Equities
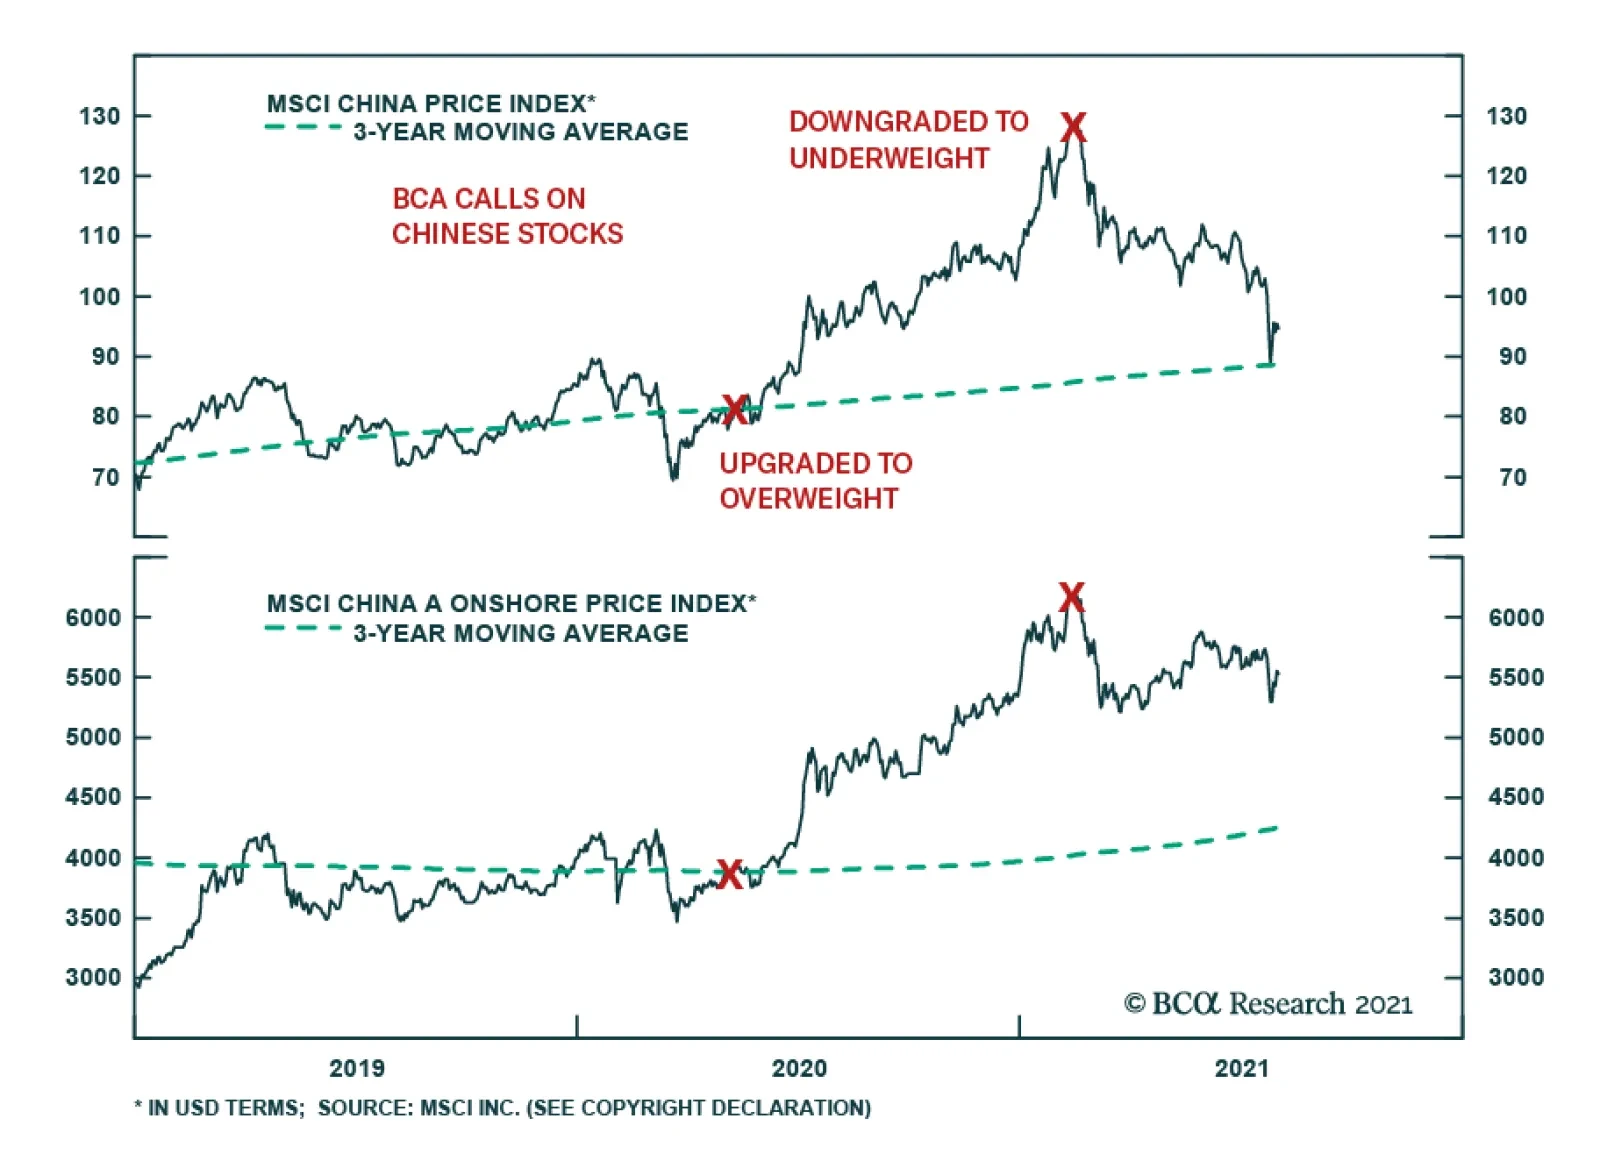
The performance of Chinese stocks last month was almost a mirror image from a year ago. Chinese stocks went from being the best performers among global asset classes in July 2020 to the worst in the same month this year. This reflects a policy shift from…

Last weekend, the national eviction moratorium, put in place during the pandemic, expired. While our hearts go out for the affected families, wearing our economists’ hats, we consider the termination of the eviction ban a likely positive for the US economy, and the US equities. The US is experiencing a red-hot job market with companies struggling to fill positions. End of eviction moratorium may be a necessary catalyst for more workers joining the work force. Indeed, interest in online recruitment postings is picking up (see chart). Ability to fill in open positions will put a lid on the rising wages and contain a vicious cycle of inflation. Investment implication of this development is a further boost to home improvement stocks (HD, LOW) and residential REITS. Evictions will help vulnerable landlords, responsible for real estate taxes, mortgage payments, utilities, and repairs, avoid bankruptcies by finding solvent tenants. Landlords will spend again preparing houses and apartments for a changeover, contributing to the economic growth. Rent prices will increase, in response to ubiquitous housing shortages, and boosting performance of REITs. The likely passage of a bipartisan infrastructure bill and a larger infrastructure-and-social-welfare bill through Congress will expand the social safety net, supporting victims of evictions. Bottom Line: The termination of the national eviction ban is a small net positive for the home improvement and residential REITs equity industries.
On Evictions
On Evictions
Highlights Last week’s market gyrations do not mark the end of China’s structural reforms. The country’s macro policy setting has shifted to allow a higher tolerance for short-term pain in exchange for long-term gain. Chinese policymakers will temporarily put the brakes on its reform agenda if policy measures threaten domestic economic stability; a spillover from the equity market rout to the currency market and private-sector investment will be a pressure point for the authorities. Messages from last week’s Politburo meeting were only marginally more positive than in April. While policymakers seem to be paying more attention to the economic slowdown, they do not appear to be in a rush to rescue the economy. We present three scenarios describing how the equity markets and policy may develop in the coming months. In all the scenarios, investors should avoid trying to catch a falling knife. Feature July was an extraordinarily difficult time for Chinese stocks and last week’s steep slide intensified as a slew of announced regulatory changes spooked market participants (Chart 1). Chart 1Chinese Stocks Had A Tough Month
Pricing A Tighter Regulatory Grip
Pricing A Tighter Regulatory Grip
We have repeatedly outlined the risks to Chinese equities in the past month. Since the PBoC cut the reserve requirement ratio in early July, the negative impact on the financial markets from tightening industry policies has outweighed the limited positive effects from a slightly more dovish central bank policy stance. Chart 2Chinese TMT Stock Prices Were Hammered
Chinese TMT Stock Prices Were Hammered
Chinese TMT Stock Prices Were Hammered
Is now a good time to buy Chinese stocks? Multiple compressions have made Chinese equities, particularly the hard-hit technology, media & telecom (TMT) stocks in the offshore market, appear cheap compared with their global counterparts (Chart 2). In this report we present three scenarios how China’s equity market and policies will likely evolve. In our view, more than a week of stock selloffs will be needed for policymakers to halt reforms. Furthermore, even if the pace of reforms eases and policymakers start to reflate the economy, it will likely take between 6 and 12 months for stock prices to find a bottom. In light of escalating uncertainty over China’s financial market performance, the China Investment Strategy and Global Asset Allocation services will jointly publish a Special Report on August 18. We will examine how global investors can improve the risk-reward profile of their multi-asset portfolios with exposure to Chinese assets. Three Scenarios While the regulatory landscape is unclear, we can draw on previous experience to analyze how China’s equity market and policy directions may evolve. In the first scenario, which is our baseline case, the economy would weaken, but would not cross policymakers’ pain threshold. There would be marginal policy easing action to alleviate market anxiety and monetary policy would be slightly loosened along with polices on some non-core sectors, such as infrastructure investment. In this scenario, structural reforms could continue for another 6 to 12 months, as suggested by colleagues at the BCA Geopolitical Strategy services. Investors should resist the urge to buy on the dip. Investors would be kept on edge by a confluence of a slowing economy (even though the slowdown is measured) and heighted regulatory oversight. The market would oscillate between technical rebounds when macro policy eases and selloffs when industry regulations tighten. There are two reasons why the pace of regulatory tightening will not moderate in the near term. First, China’s economic policy has shifted from setting an annual economic growth target to multi-year planning. This allows policymakers to have a higher tolerance for near-term distress in exchange for long-term benefits. Despite a deep dive in stock prices last week, China’s bond and currency markets have been stable relative to the market gyrations in both 2015 and 2018 (Chart 3A and 3B). Furthermore, the newly released PMIs and recent economic data show that the China’s economic activity is weakening, but the speed of softening seems to be within the policymakers’ comfort zone (Chart 4). Chart 3AChinese Bond And Currency Markets Have Been Relatively Calm Despite Equity Market Selloffs
Chinese Bond And Currency Markets Have Been Relatively Calm Despite Equity Market Selloffs
Chinese Bond And Currency Markets Have Been Relatively Calm Despite Equity Market Selloffs
Chart 3BChinese Bond And Currency Markets Have Been Relatively Calm Despite Equity Market Selloffs
Chinese Bond And Currency Markets Have Been Relatively Calm Despite Equity Market Selloffs
Chinese Bond And Currency Markets Have Been Relatively Calm Despite Equity Market Selloffs
Chart 4Economic Pain Has Not Crossed Policymakers' Threshold
Economic Pain Has Not Crossed Policymakers' Threshold
Economic Pain Has Not Crossed Policymakers' Threshold
Secondly, the new rules imposed on industries - ranging from internet, property, education, healthcare to capital markets - are part of China’s long-term structural reform agenda outlined in the 14th Five-Year Plan (FYP). As China transitions from building a "moderately prosperous society" by 2020 to becoming a "great modern socialist nation" by 2049, the country’s policy priority has shifted from a rapid accumulation of wealth to addressing income inequality and social welfare for average households. The policy objective is not only to close regulatory loopholes and end the disorderly expansion of capital and market shares, but also assign a larger weight of social equality and responsibility to the private sector’s business practices. The pace in achieving this overarching goal will only moderate when China’s economy and financial markets show meaningful signs of stress. The second possibility would be if policymakers fail to restore investors’ confidence. Foreign and domestic investors would reassess China’s policy directions and reprice the outlook for corporate profit growth. Market selloffs would continue, like in 2015 and 2018 following policy shocks,1 equity market gyrations would spill over to the currency market through capital outflows and real economic sectors through dwindling investment (Chart 5). In this scenario, Chinese policymakers would likely abandon their reform agenda, at least temporarily, and decisively shift policy to reflate the economy (Chart 6). Chart 5Financial Market Panic Spilled Over To Other Sectors In Both 2015 and 2018...
Financial Market Panic Spilled Over To Other Sectors In Both 2015 and 2018...
Financial Market Panic Spilled Over To Other Sectors In Both 2015 and 2018...
Chart 6...Triggering Decisive Reflationary Policy Responses
...Triggering Decisive Reflationary Policy Responses
...Triggering Decisive Reflationary Policy Responses
A third scenario would be if China is challenged by the external environment, either due to a significant increase in geopolitical conflicts or a widespread resurgence of new COVID cases. Both aspects would pose sizable downside risks to China’s economic activity. The risks would force authorities to shift to an easier stance and slow the pace of domestic reforms. Chart 7It Took 6 To 12 Months (And Sizable Stimulus) For Stock Prices To Bottom Out
It Took 6 To 12 Months (And Sizable Stimulus) For Stock Prices To Bottom Out
It Took 6 To 12 Months (And Sizable Stimulus) For Stock Prices To Bottom Out
In the second and third scenarios, the rout in the equity market would likely deepen in the near term, before prices bottom in response to a halt in regulatory crackdowns and a decisive turn to reflationary measures. As illustrated in Chart 7, in both 2015 and 2018, it took 6 to 12 months and significant stimulus for Chinese stock prices to bottom in absolute terms. Bottom Line: Our baseline scenario suggests a continuation of structural reforms. Investors should refrain from jumping into the market until there are firm signs that regulatory tightening is over and reflationary measures have started. Key Messages From The Politburo Meeting Last week’s much-anticipated Politburo meeting, chaired by President Xi Jinping, adopted a slightly more dovish tone towards macroeconomic policy than in April, but also indicated that the leadership will stick to its long-term reform agenda. The stance was mildly positive for the overall economy and financial markets. Macro policies in some non-core sectors, such as infrastructure investment, will likely ease at the margin during the rest of the year. However, the meeting’s statement warned “a more complex and challenging external environment” lies ahead, which indicates that heightened concerns over geopolitical tensions will only exacerbate regulatory oversights in data and national security. Regarding fiscal policy in 2H21, the authorities seem to be growing more concerned about growth outlook. The meeting mentioned that fiscal support should make “reasonable progress” later this year and early next year. The pace of local government special purpose bond (SPB) issuance will pick up in Q3 and into Q4. However, we maintain our view that without a significant rise in bank credit growth, an acceleration in SPB issuance will only provide a moderate boost to local infrastructure spending. The reference to cross-cycle policy adjustment from the meeting readout is also in line with our view that policymakers may save their fiscal ammunition for next year when the economy comes under greater downward pressure. Odds are rising that the authorities will allow a frontloading of SPBs in Q1 2022 before the National People’s Congress in March next year. The statement also notably mentioned that government officials shall “ensure the supply of commodities and stabilize prices" and called for a more rational pace in carbon reduction. We think this message implies a temporary easing of production curbs in some heavy industries, such as steel, coal, and possibly a further release of strategic reserves of industrial metals (Chart 8A and 8B). The supply-side policy shift should add downward pressure on global industrial prices in addition to the ongoing slowdown in demand from China (Chart 9). Chart 8ASome Backpaddling Likely In Decarbonization Progress
Some Backpaddling Likely In Decarbonization Progress
Some Backpaddling Likely In Decarbonization Progress
Chart 8BSome Backpaddling Likely In Decarbonization Progress
Some Backpaddling Likely In Decarbonization Progress
Some Backpaddling Likely In Decarbonization Progress
Chart 9Downward Pressure On Commodity Prices From China's Weakening Demand And Rising Domestic Production
Downward Pressure On Commodity Prices From China's Weakening Demand And Rising Domestic Production
Downward Pressure On Commodity Prices From China's Weakening Demand And Rising Domestic Production
Meanwhile, the meeting repeated the "three stabilization” policy, which targets stabilizing land prices, housing prices and property market expectations. This sends a strong signal that policymakers are unwilling to soften the tone on restrictions in the housing market. Bottom Line: The July Politburo meeting’s messaging was only modestly more dovish than three months ago. Investment Implications Chinese offshore stocks have fallen by 26% from their February peak, compared with approximately 14% for onshore stocks. The offshore TMT stocks are approaching their long-term technical resistance, measured by the three-year moving average in prices (Chart 10). While the magnitude of last week’s stock price decline seems excessive relative to previous market selloffs, the multiple compression reflects considerable uncertainty surrounding the outlook for China’s policy direction. New antitrust regulations in China are intended to limit the monopolistic business practices of internet companies. As a result, these companies’ operational costs will rise and profit growth will decline, and their valuations will converge with those of non-TMT companies. The trailing P/E ratio in Chinese investable TMT stocks is still elevated, making the equities vulnerable to further regulatory tightening and multiple compressions (Chart 11). Chart 10Chinese TMT Stocks: On The Verge Of Breaking Below Their Technical Resistance...
Chinese TMT Stocks: On The Verge Of Breaking Below Their Technical Resistance...
Chinese TMT Stocks: On The Verge Of Breaking Below Their Technical Resistance...
Chart 11...But Still Vulnerable To Further Multiple Compression
...But Still Vulnerable To Further Multiple Compression
...But Still Vulnerable To Further Multiple Compression
Jing Sima China Strategist jings@bcaresearch.com Footnotes 1On August 11, 2015, the PBOC surprised the market with three consecutive devaluations of the Chinese yuan, knocking over 3% off its value. On April 3, 2018 former US President Donald Trump unveiled plans for 25% tariffs on about $50 billion of Chinese imports. Market/Sector Recommendations Cyclical Investment Stance
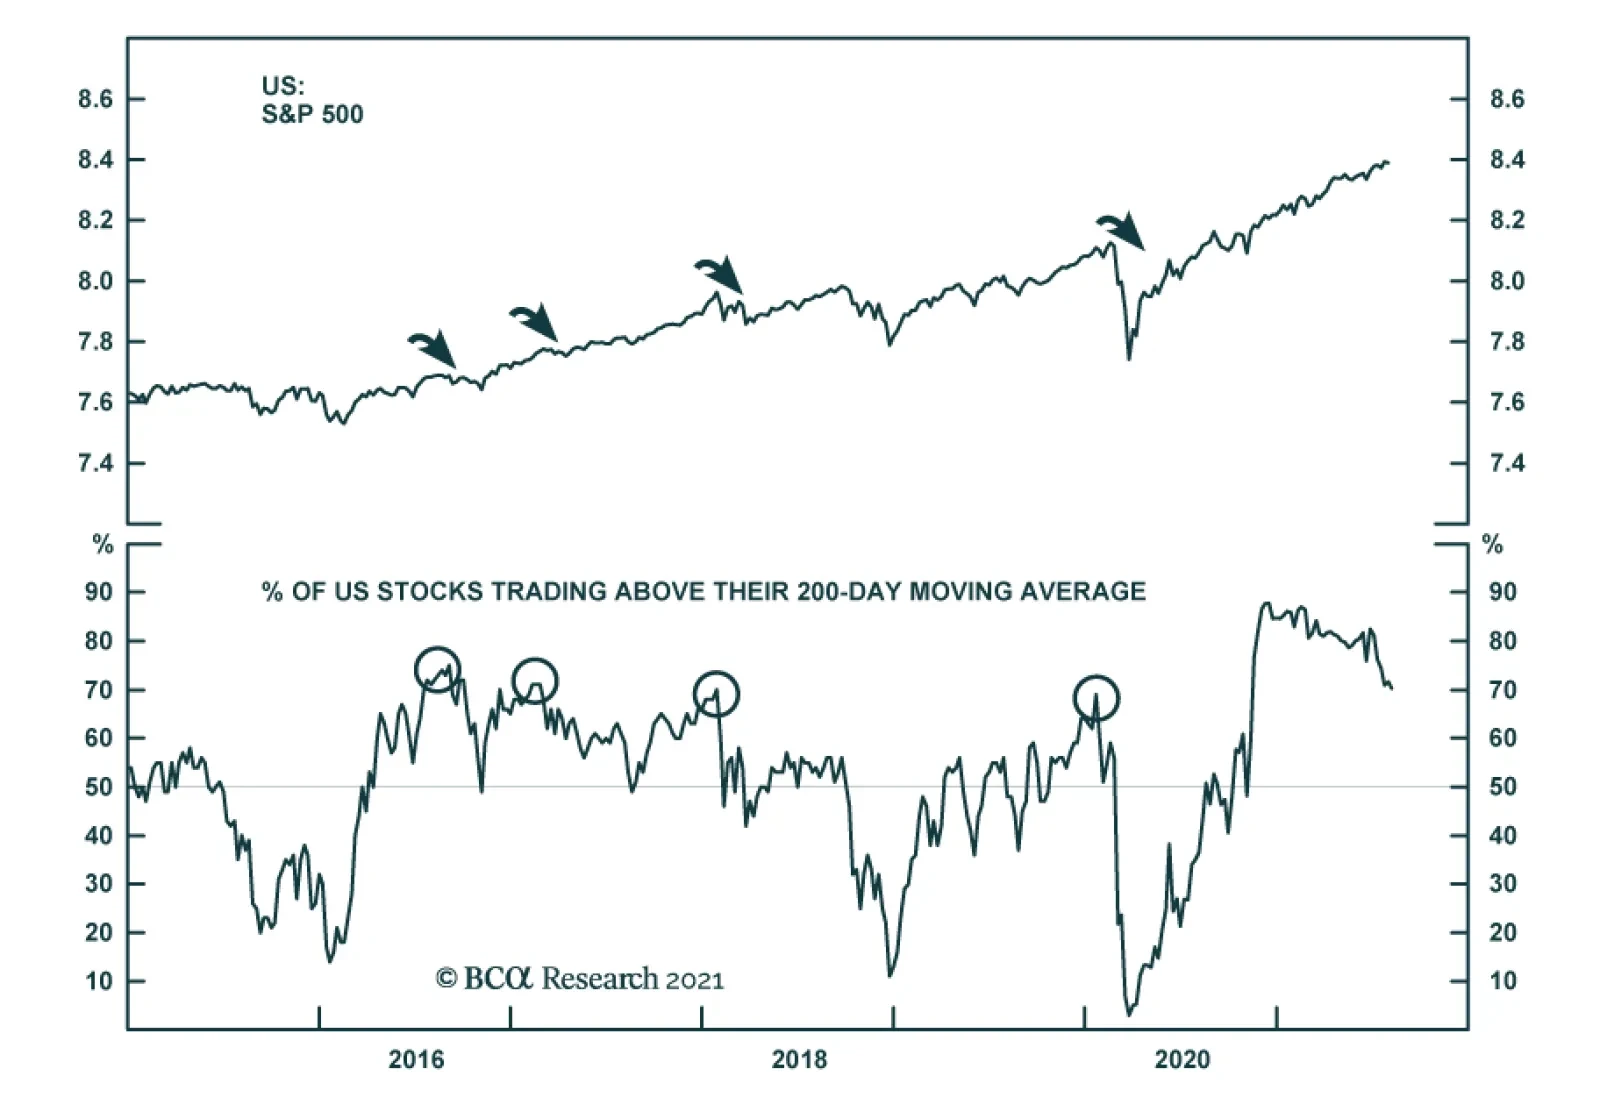
The share of US stocks trading above their 200-day moving average – a measure of breadth for the US equity market – has eased considerably. It now stands a good 12 percentage points below its late-June peak. Nevertheless, at 70%, it is still high relative to…
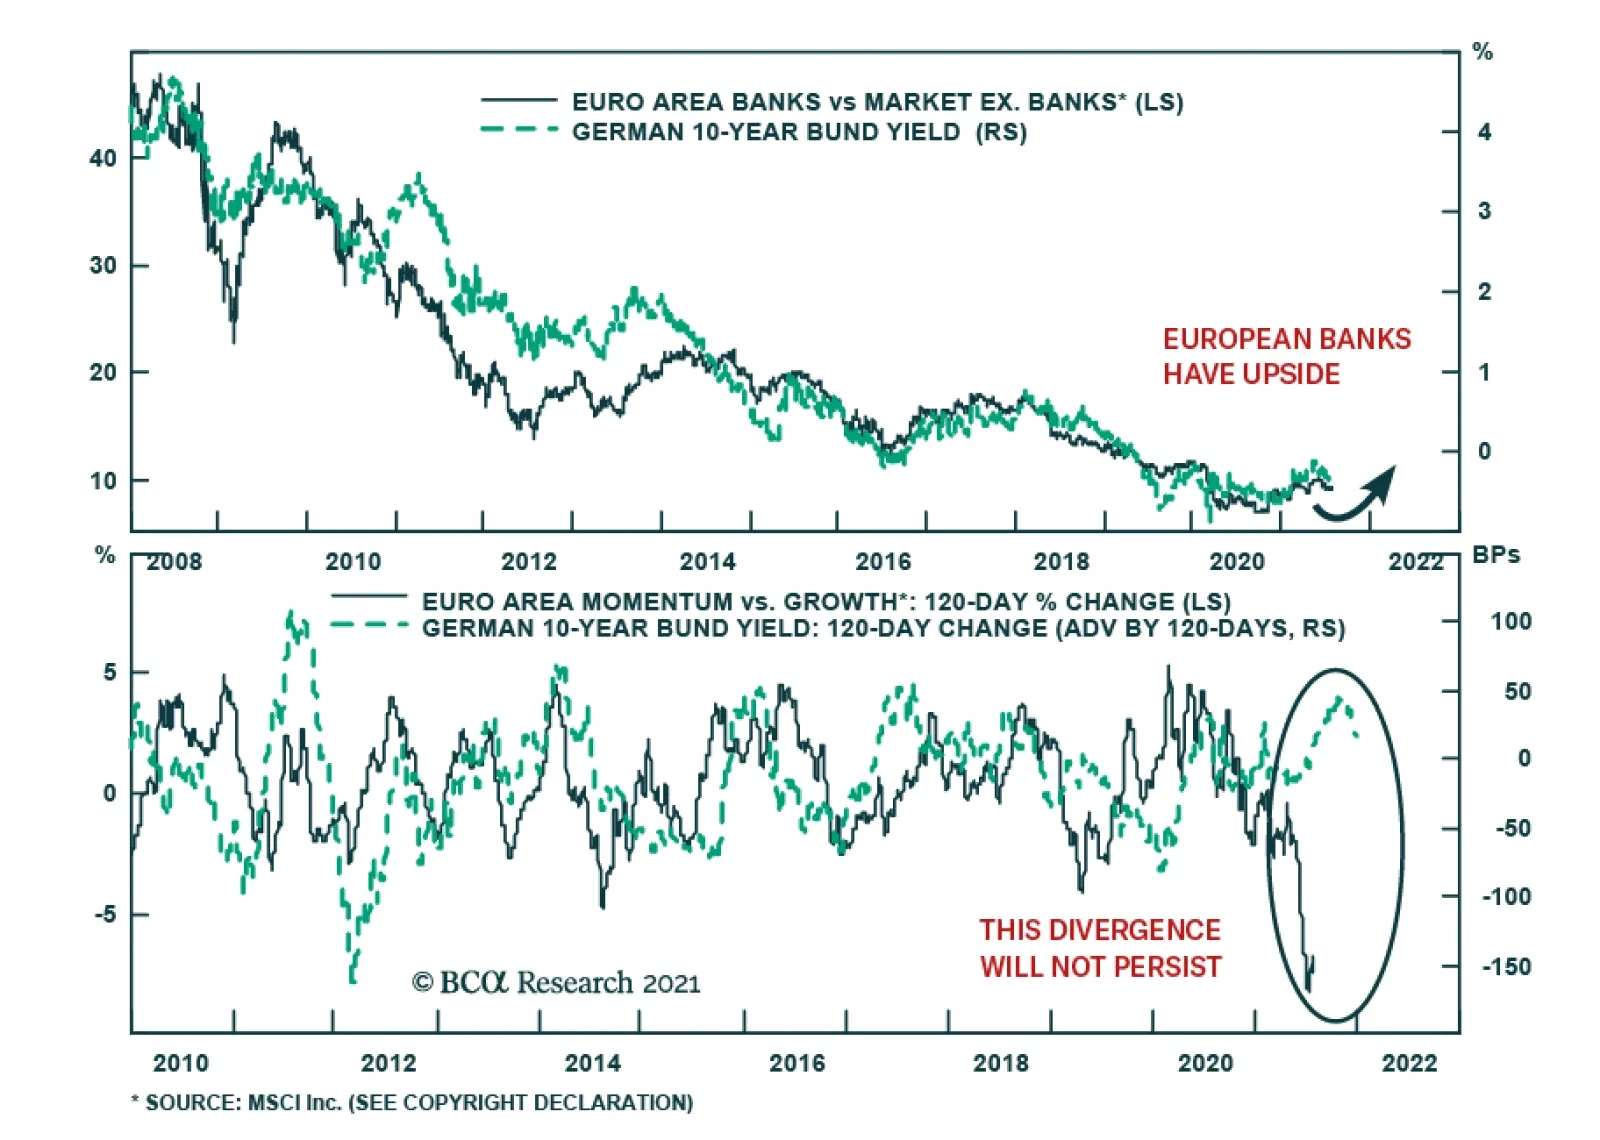
According to BCA Research’s European Investment Strategy service, investors should favor financials, industrials, and momentum stocks at the expense of growth stocks. Global safe-haven yields are unlikely to decline significantly from current levels.…
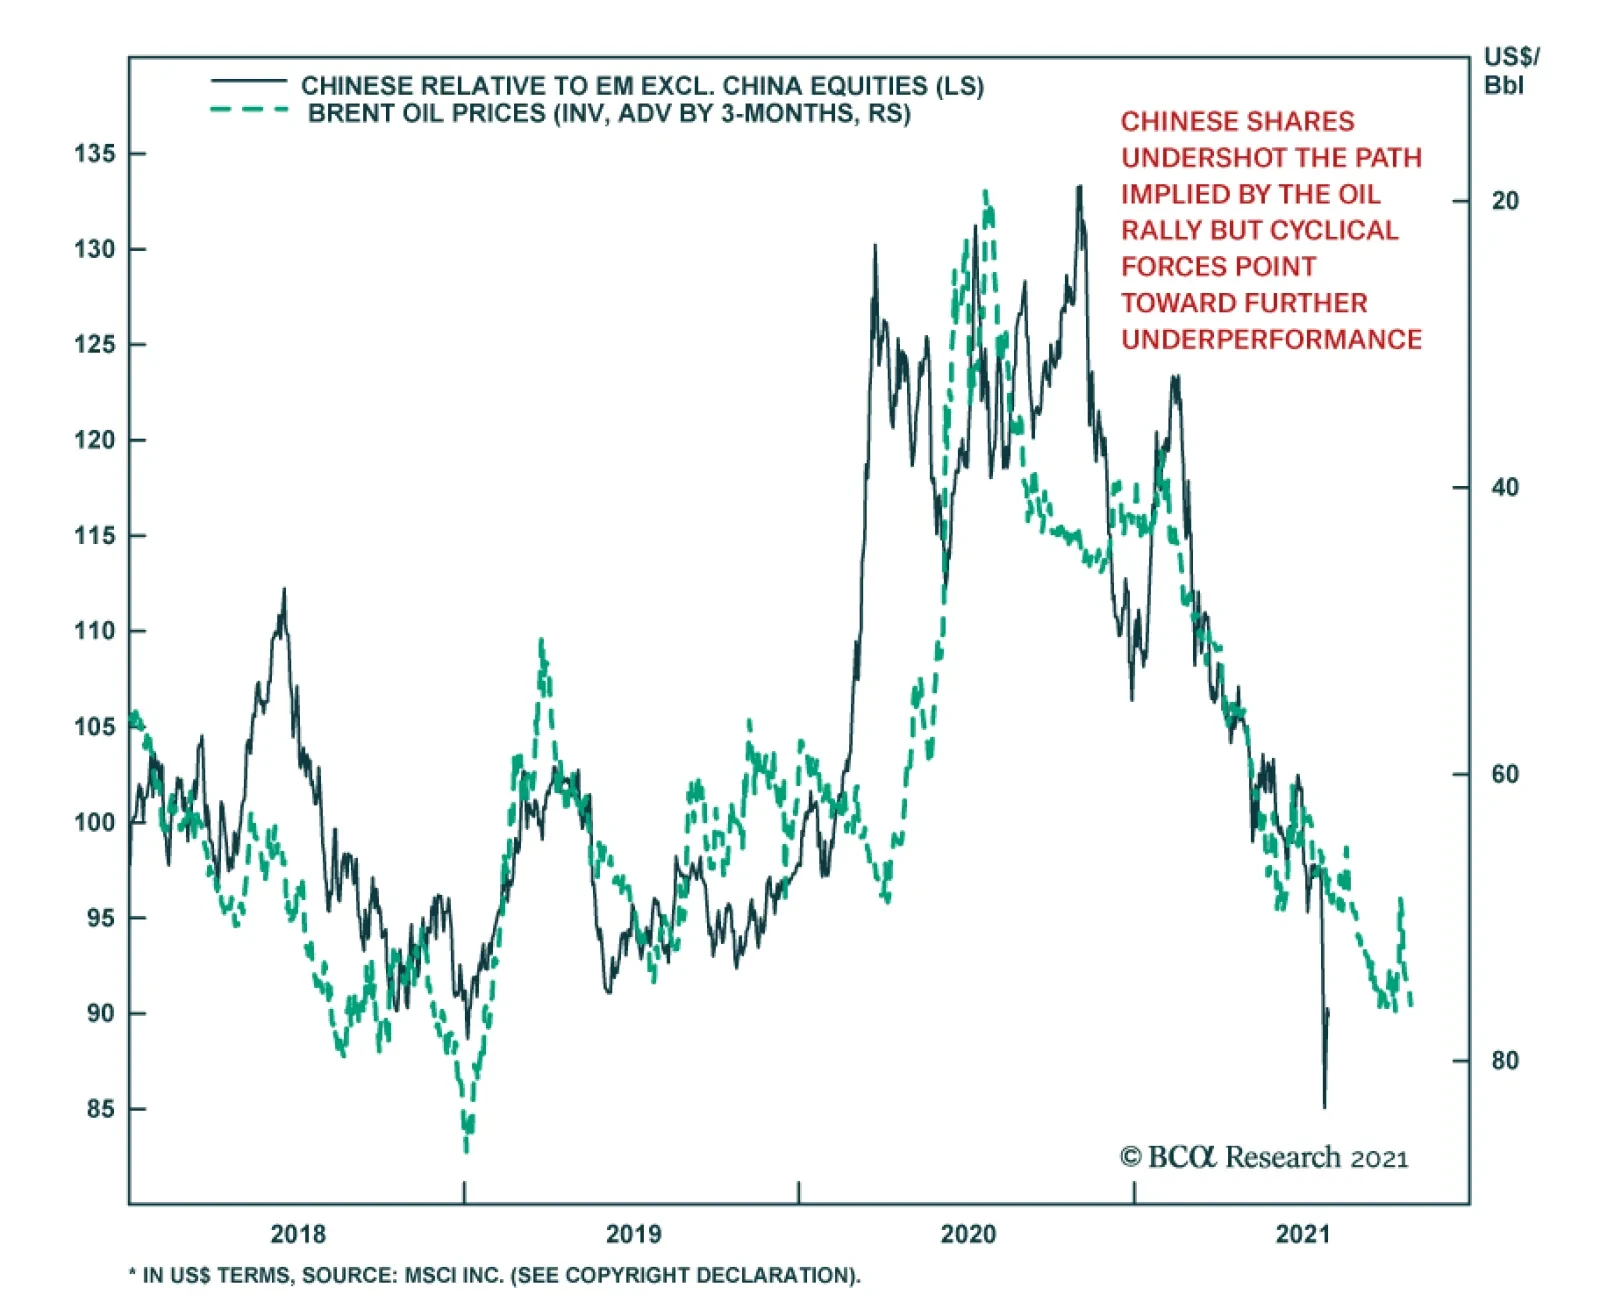
China is a large net importer of oil and rising crude prices act as a significant drag on this economy, at least compared to other emerging markets. Consequently, the relative performance of Chinese equities has tracked with a lag the inverted price of oil…
Dear Client, This week, in lieu of our regular report, I am sending you a special report written by my colleague Jonathan LaBerge, chief strategist of our flagship The Bank Credit Analyst service. Jonathan argues that investors should see social media as a technological innovation that harms productivity. While Jonathan concedes that social media was not the main driver of policy uncertainty and political risk over the past decade, he makes a good case that it plays an aggravating role. He warns that social media and political polarization still pose risks to the macroeconomic outlook in the coming years, while also highlighting idiosyncratic risks threatening social media stocks. We trust that you will find this report insightful. We will resume regular publication next week. All very best, Matt Gertken Vice President Geopolitical Strategy US Political Strategy BCA Research Highlights Investors should view social media as a technological innovation with negative productivity growth. Social media has contributed to policy mistakes – such as fiscal austerity and protectionism – that have acted as shocks to aggregate demand over the past 15 years. The cyclical component of productivity was long lasting in nature during the last economic expansion. Forces that negatively impact economic growth but do not change the factors of production necessarily reduce measured productivity, and repeated policy mistakes strongly contributed to the slow growth profile of the last economic cycle. Political polarization in a rapidly changing world is the root cause of these policy shocks, but social media likely facilitated and magnified them. The risks of additional mistakes from populism remain present, even before considering other risks to society from social media: a reduction in mental health among young social media users, and the role that social media has played in spreading misinformation. A potential revival in protectionist sentiment is a risk to a constructive cyclical view that we will be closely monitoring over the coming 12-24 months. Investors with concentrated positions in social media stocks should be aware of the potential idiosyncratic risks facing these companies from the public’s impression of the impact of social media on society – especially if social media companies come to be widely associated with political gridlock, the polarization of society, and failed economic policies (as already appears to be the case). Feature Investors should view social media as a technological innovation with negative productivity growth. Social media has contributed to policy mistakes – such as fiscal austerity and protectionism – that have acted as shocks to aggregate demand over the past 15 years. Political polarization in a rapidly changing world is the root cause of these policy shocks, but social media likely facilitated and magnified them. While the risk of premature fiscal consolidation appears low today compared to the 2010-14 period, the pandemic and its aftermath could force the Biden administration or Congressional Democrats toward protectionist or otherwise populist actions over the coming year in the lead up to the 2022 mid-term elections. The midterms, for their part, are expected to bring gridlock back into US politics, which could remove fiscal options should the economy backslide. Frequent shocks during the last economic expansion reinforced the narrative of secular stagnation. In the coming years, any additional policy shocks following a return to economic normality will again be seen by both investors and the Fed as strong justification for low interest rates – despite the case for cyclically and structurally higher bond yields. In addition, investors with concentrated positions in social media companies should take seriously the long-term idiosyncratic risks facing these stocks. These risks stem from the public’s impression of the impact of social media on society, particularly if social media comes to be widely associated with political gridlock, the polarization of society, and failed economic policies. A Brief History Of Social Media The earliest social networking websites date back to the late 1990s, but the most influential social media platforms, such as Facebook and Twitter, originated in the mid-2000s. Prior to the advent of modern-day smartphones, user access to platforms such as Facebook and Twitter was limited to the websites of these platforms (desktop access). Following the release of the first iPhone in June 2007, however, mobile social media applications became available, allowing users much more convenient access to these platforms. Charts 1 and 2 highlight the impact that smartphones have had on the spread of social media, especially since the release of the iPhone 3G in 2008. In 2006, Facebook had roughly 12 million monthly active users; by 2009, this number had climbed to 360 million, growing to over 600 million the year after. Twitter, by contrast, grew somewhat later, reaching 100 million monthly active users in Q3 2011. Social media usage is more common among those who are younger, but Chart 3 highlights that usage has risen over time for all age groups. As of Q1 2021, 81% of Americans aged 30-49 reported using at least one social media website, compared to 73% of those aged 50-64 and 45% of those aged 65 and over. Chart 4 highlights that the usage of Twitter skews in particular toward the young, and that, by contrast, Facebook and YouTube are the social media platforms of choice among older Americans. Chart 1Facebook: Monthly Active Users
The Social Media Magnification Effect: Austerity, Populism, And Slower Growth
The Social Media Magnification Effect: Austerity, Populism, And Slower Growth
Chart 2Twitter: Monthly Active Users Worldwide
The Social Media Magnification Effect: Austerity, Populism, And Slower Growth
The Social Media Magnification Effect: Austerity, Populism, And Slower Growth
Chart 3A Sizeable Majority Of US Adults Regularly Use Social Media
A Sizeable Majority Of US Adults Regularly Use Social Media
A Sizeable Majority Of US Adults Regularly Use Social Media
Chart 4Older Americans Use Facebook Far More Than Twitter
The Social Media Magnification Effect: Austerity, Populism, And Slower Growth
The Social Media Magnification Effect: Austerity, Populism, And Slower Growth
As a final point documenting the development and significance of social media, Chart 5 highlights that more Americans now report consuming news often (roughly once per day) from a smartphone, computer, or tablet other than from television. Radio and print have been completely eclipsed as sources of frequent news. The major news publications themselves are often promoted through social media, but the rise of the Internet has weighed heavily on the journalism industry. Social media has, for better and for worse, enabled the rapid proliferation of alternative news, citizen journalism, rumor, conspiracy theories, and foreign disinformation. Chart 5Social Media Has Changed The Way People Consume News
The Social Media Magnification Effect: Austerity, Populism, And Slower Growth
The Social Media Magnification Effect: Austerity, Populism, And Slower Growth
The Link Between Social Media And Post-GFC Austerity Following the 2008-2009 global financial crisis (GFC), there have been at least five deeply impactful non-monetary shocks to the US and global economies that have contributed to the disconnection between growth and interest rates: A prolonged period of US household deleveraging from 2008-2014 The Euro Area sovereign debt crisis Fiscal austerity in the US, UK, and Euro Area from 2010 – 2012/2014 The US dollar / oil price shock of 2014 The rise of populist economic policies, such as the UK decision to leave the European Union, and the US-initiated trade war of 2018-2019. Among these shocks to growth, social media has had a clear impact on two of them. In the case of austerity in the aftermath of the Great Recession, a sharp rise in fiscal conservatism in 2009 and 2010, emblematized by the rise of the US Tea Party, profoundly affected the 2010 US midterm elections. It is not surprising that there was a fiscally conservative backlash following the crisis: the US budget deficit and debt-to-GDP ratio soared after the economy collapsed and the government enacted fiscal stimulus to bail out the banking system. And midterm elections in the US often lead to significant gains for the opposition party However, Tea Party supporters rapidly took up a new means of communicating to mobilize politically, and there is evidence that this contributed to their electoral success. Chart 6 illustrates that the number of tweets with the Tea Party hashtag rose significantly in 2010 in the lead-up to the election, which saw the Republican Party take control of the House of Representatives as well as the victory of several Tea Party-endorsed politicians. Table 1 highlights that Tea Party candidates, who rode the wave of fiscal conservatism, significantly outperformed Democrats and non-Tea Party Republicans in the use of Twitter during the 2010 campaign, underscoring that social media use was a factor aiding outreach to voters. Chart 6Tea Party Supporters Rapidly Adopted Social Media To Mobilize Politically
Tea Party Supporters Rapidly Adopted Social Media To Mobilize Politically
Tea Party Supporters Rapidly Adopted Social Media To Mobilize Politically
Table 1Tea Party Candidates Significantly Outperformed In Their Use Of Social Media
The Social Media Magnification Effect: Austerity, Populism, And Slower Growth
The Social Media Magnification Effect: Austerity, Populism, And Slower Growth
And while it is more difficult to analyze the use and impact of Facebook by Tea Party candidates and supporters owing to inherent differences in the structure of the Facebook platform, interviews with core organizers of both the Tea Party and Occupy Wall Street movements have noted that activists in these ideologically opposed groups viewed Facebook as the most important social networking service for their political activities.1 Under normal circumstances, we agree that fiscal policy should be symmetric, with reduced fiscal support during economic expansions following fiscal easing during recessions. But in the context of multi-year household deleveraging, the fiscal drag that occurred in following the 2010 midterm elections was clearly a policy mistake. This mistake occurred partially under full Democratic control of government and especially under a gridlocked Congress after 2010. Chart 7 highlights that the contribution to growth from government spending turned sharpy negative in 2010 and continued to subtract from growth for some time thereafter. In addition, panel of Chart 7 highlights that the US economic policy uncertainty index rose in 2010 after falling during the first year of the recovery, reaching a new high in 2011 during the Tea Party-inspired debt ceiling crisis. Chart 7The Fiscal Drag That Followed The 2010 Midterm Elections Was A Clear Policy Mistake
The Fiscal Drag That Followed The 2010 Midterm Elections Was A Clear Policy Mistake
The Fiscal Drag That Followed The 2010 Midterm Elections Was A Clear Policy Mistake
In addition to the negative impact of government spending on economic growth, this extreme uncertainty very likely damaged confidence in the economic recovery, contributing to the subpar pace of growth in the first half of the last economic expansion. Chart 8 highlights the weak evolution in real per capita GDP from 2009-2019 compared with previous economic cycles, which was caused by a prolonged household balance sheet recovery process that was made worse by policy mistakes. To be sure, the UK and the EU did not have a Tea Party, and yet political elites imposed fiscal austerity. It is also the case that President Obama was the first president to embrace social media as a political and public relations tool. So it cannot be said that either social media or the Republican Party are uniquely to blame for the policy mistakes of that era. But US fiscal policy would have been considerably looser in the 2010s if not for the Tea Party backlash, which was partly enabled by social media. Too tight of fiscal policy in turn fed populism and produced additional policy mistakes down the road. Chart 8Policy Mistakes Significantly Contributed To Last Cycle's Subpar Growth Profile
Policy Mistakes Significantly Contributed To Last Cycle's Subpar Growth Profile
Policy Mistakes Significantly Contributed To Last Cycle's Subpar Growth Profile
From Fiscal Drag To Populism While social media is clearly not the root cause of the recent rise of populist policies, it has had a hand in bringing them about – in both a direct and indirect manner. The indirect link between social media use and the rise in populist policies has mainly occurred through the highly successful use of social media by international terrorist organizations (chiefly ISIL) and its impact on sentiment toward immigration in several developed market economies. Chart 9 highlights that public concerns about immigration and race in the UK began to rise sharply in 2012, in lockstep with both the rise in UK immigrants from EU accession countries and a series of events: the Syrian refugee crisis, the establishment and reign of the Islamic State, and three major terrorist attacks in European countries for which ISIL claimed responsibility. Given that the main argument for “Brexit” was for the UK to regain control over its immigration policies, these events almost certainly increased UK public support for withdrawing from the EU. In other words, it is not clear that Brexit would have occurred (at least at that moment in time) without these events given the narrow margin of victory for the “leave” campaign. The absence of social media would not have prevented the rise of ISIL, as that occurred in response to the US’s precipitous withdrawal from Iraq. The inevitable rise of ISIL would still have generated a backlash against immigration. Moreover, fiscal austerity in the UK and EU also fed other grievances that supported the Brexit movement. But social media accelerated and amplified the entire process. Chart 10 presents fairly strong evidence that Brexit weakened UK economic performance relative to the Euro Area prior to the pandemic, with the exception of the 2018-2019 period. In this period Euro Area manufacturing underperformed during the Trump administration’s trade war as a result of its comparatively higher exposure to automobile production and its stronger ties to China. Panel 2 highlights that GBP-EUR fell sharply in advance of the referendum, and remains comparatively weak today. Chart 9Terrorism And Immigration Likely Contributed To Brexit
Terrorism And Immigration Likely Contributed To Brexit
Terrorism And Immigration Likely Contributed To Brexit
Chart 10Brexit Weakened UK Economic Performance Prior To The Pandemic
Brexit Weakened UK Economic Performance Prior To The Pandemic
Brexit Weakened UK Economic Performance Prior To The Pandemic
Turning to the US, Donald Trump’s election as US President in 2016 was aided by both the direct and indirect effects of social media. In terms of indirect effects, Trump benefited from similar concerns over immigration and terrorism that caused the UK to leave the EU: Chart 11 highlights that terrorism and foreign policy were second and third on the list of concerns of registered voters in mid-2016, and Chart 12 highlights that voters regarded Trump as the better candidate to defend the US against future terrorist attacks. Chart 11Terrorism Ranked Highly As An Issue In The 2016 US Election
The Social Media Magnification Effect: Austerity, Populism, And Slower Growth
The Social Media Magnification Effect: Austerity, Populism, And Slower Growth
Chart 12Voters Regarded Trump As Better Equipped To Defend Against Terrorism
The Social Media Magnification Effect: Austerity, Populism, And Slower Growth
The Social Media Magnification Effect: Austerity, Populism, And Slower Growth
Trump’s election; and the enactment of populist policies under his administration, were directly aided by Trump’s active use of social media (mainly Twitter) to boost his candidacy. Chart 13 highlights that there were an average of 15-20 tweets per day from Trump’s Twitter account from 2013-2015, and 80% of those tweets occurred before he announced his candidacy for president in June 2015. This strongly underscores that Trump mainly used Twitter to lay the groundwork for his candidacy as an unconventional political outsider rather than as a campaign tool itself, which distinguishes his use of social media from that of other politicians. In other words, new technology disrupted the “good old boys’ club” of traditional media and elite politics. Chart 13Trump Used Twitter To Lay The Groundwork For His Candidacy
Trump Used Twitter To Lay The Groundwork For His Candidacy
Trump Used Twitter To Lay The Groundwork For His Candidacy
Chart 14The Trump Tax Cuts A Huge Rise In Corporate Earnings
The Trump Tax Cuts A Huge Rise In Corporate Earnings
The Trump Tax Cuts A Huge Rise In Corporate Earnings
Some policies of the Trump administration were positive for financial markets, and it is fair to say that Trump fired up animal spirits to some extent: Chart 14 highlights that the Tax Cuts and Jobs Act caused a significant rise in stock market earnings per share. But the Trump tax cuts were a conventional policy pushed mostly by the Congressional leadership of the Republican Party, and they did not meaningfully boost economic growth. Chart 15 highlights that, while the US ISM manufacturing index rose sharply in the first year of Trump’s administration, an uptrend was already underway prior to the election as a result of a significant improvement in Chinese credit growth and a recovery in oil prices after the devastating collapse that took place in 2014-2015. Chart 15But The Tax Cuts Did Not Do Much To Boost Growth
But The Tax Cuts Did Not Do Much To Boost Growth
But The Tax Cuts Did Not Do Much To Boost Growth
Similarly, Chart 15 highlights that the Trump trade war does not bear the full responsibility of the significant slowdown in growth in 2019, as China’s credit impulse decelerated significantly between the passage of the Tax Cuts and Jobs Act and the onset of the trade war because Chinese policymakers turned to address domestic concerns. But Chart 16 highlights that the aggressive imposition of tariffs, especially between the US and China, caused an explosion in trade uncertainty even when measured on an equally-weighted basis (i.e., when overweighting trade uncertainty, in countries other than the US and China), which undoubtedly weighed on the global economy and contributed to a very significant slowdown in US jobs growth in 2019 (panel 2). Moreover, Chinese policymakers responded to the trade onslaught by deleveraging, which weighed on the global economy; and consolidating their grip on power at home. In essence, Trump was a political outsider who utilized social media to bypass the traditional media and make his case to the American people. Other factors contributed to his surprising victory, not the least of which was the austerity-induced, slow-growth recovery in key swing states. While US policy was already shifting to be more confrontational toward China, the Trump administration was more belligerent in its use of tariffs than previous administrations. The trade war thus qualifies as another policy shock that was facilitated by the existence of social media. Chart 16The Trade War Caused An Explosion In Global Trade Uncertainty
The Trade War Caused An Explosion In Global Trade Uncertainty
The Trade War Caused An Explosion In Global Trade Uncertainty
Viewing Social Media As A Negative Productivity-Innovation A rise in fiscal conservatism leading to misguided austerity, the UK’s decision to leave the European Union, and the Trump administration’s trade war have represented significant non-monetary shocks to both the US and global economies over the past 12 years. These shocks strongly contributed to the subpar growth profile of the last economic expansion, as demonstrated above. Given the above, it is reasonable for investors to view social media as a technological innovation with negative productivity growth, given that it has facilitated policy mistakes during the last economic expansion. Chart 17 underscores this point, by highlighting that multi-factor productivity growth has been extremely weak in the post-GFC environment. While productivity is usually driven by supply-side factors over the longer term, it has a cyclical component to it – and in the case of the last economic expansion, the cyclical component was long lasting in nature. Any forces negatively impacting economic growth that do not change the factors of production necessarily reduce measured productivity; it is for this reason that measured productivity declines during recessions; and policy mistakes negatively impact productivity growth. Chart 17Policy Mistakes, Partially Enabled By Social Media, Reduced Productivity During The Last Expansion
Policy Mistakes, Partially Enabled By Social Media, Reduced Productivity During The Last Expansion
Policy Mistakes, Partially Enabled By Social Media, Reduced Productivity During The Last Expansion
Chart 18State & Local Government Finances Are In Much Better Shape Today
State & Local Government Finances Are In Much Better Shape Today
State & Local Government Finances Are In Much Better Shape Today
The Risk Of Aggressive Austerity Seems Low Today… Fiscal austerity in the early phase of the last economic cycle was the first social media-linked shock that we identified, but the risk of aggressive austerity appears low today. Much of the fiscal drag that occurred in the aftermath of the global financial crisis happened because of insufficient financial support to state and local governments – and the subsequent refusal by Congress to authorize more aid. But Chart 18 highlights that state and local government finances have already meaningfully recovered, on the back of bipartisan stimulus in 2020, while the American Rescue Plan provides significant additional funding. While it is true that US fiscal policy is set to detract from growth over the coming 6-12 months, this will merely reflect the unwinding of fiscal aid that had aimed to support household income temporarily lost, as a result of a drastic reduction in services spending. As we noted in last month’s report,2 goods spending will likely slow as fiscal thrust turns to fiscal drag, but services spending will improve meaningfully – aided not just by a post-pandemic normalization in economic activity, but also by the deployment of some of the sizable excess savings that US households have accumulated over the past year. Fiscal drag will also occur outside of the US next year. For example, the IMF is forecasting a two percentage point increase in the Euro Area’s cyclically-adjusted primary budget balance, which would represent the largest annual increase over the past two decades. But here too the reduction in government spending will reflect the end of pandemic-related income support, and is likely to occur alongside a positive private-sector services impulse. During the worst of the Euro Area sovereign debt crisis, the impact of austerity was especially acute because it was persistent, and it occurred while the output gap was still large in several Euro Area economies. Chart 19 highlights that Euro Area fiscal consolidation from 2010-2013 was negatively correlated with economic activity during that period, and Chart 20 highlights that, with the potential exception of Spain, this austerity does not appear to have led to subsequently stronger rates of growth. Chart 19Euro Area Austerity Lowered Growth During The Consolidation Phase…
The Social Media Magnification Effect: Austerity, Populism, And Slower Growth
The Social Media Magnification Effect: Austerity, Populism, And Slower Growth
Chart 20…And Did Not Seem To Subsequently Raise Growth
The Social Media Magnification Effect: Austerity, Populism, And Slower Growth
The Social Media Magnification Effect: Austerity, Populism, And Slower Growth
This experiment in austerity led the IMF to conclude that fiscal multipliers are indeed large during periods of substantial economic slack, constrained monetary policy, and synchronized fiscal adjustment across numerous economies.3 Similarly, attitudes about austerity have shifted among policymakers globally in the wake of the populist backlash. Given this, despite the significant increase in government debt levels that has occurred as a result of the pandemic, we strongly doubt that advanced economies will attempt to engage in additional austerity prematurely, i.e., before unemployment rates have returned close-to steady-state levels. …But The Risk Of Protectionism And Other Populist Measures Looms Large The role that social media has played at magnifying populist policies should be concerning for investors, especially given that there has been a rising trend towards populism over the past 20 years. In a recent paper, Funke, Schularick, and Trebesch have compiled a cross-country database on populism dating back to 1900, defining populist leaders as those who employ a political strategy focusing on the conflict between “the people” and “the elites.” Chart 21 highlights that the number of populist governments worldwide has risen significantly since the 1980s and 1990s, and Chart 22 highlights that the economic performance of countries with populist leaders is clearly negative. Chart 21Populism Has Been On The Rise For The Past 30 Years
The Social Media Magnification Effect: Austerity, Populism, And Slower Growth
The Social Media Magnification Effect: Austerity, Populism, And Slower Growth
The authors found that countries’ real GDP growth underperformed by approximately one percentage point per year after a populist leader comes to power, relative to both the country’s own long-term growth rate and relative to the prevailing level of global growth. To control for the potential causal link between economic growth and the rise of populist leaders, Chart 23 highlights the results of a synthetic control method employed by the authors that generates a similar conclusion to the unconditional averages shown in Chart 22: populist economic policies are significantly negative for real economic growth. Chart 22Populist Leaders Are Clearly Growth Killers Even After…
The Social Media Magnification Effect: Austerity, Populism, And Slower Growth
The Social Media Magnification Effect: Austerity, Populism, And Slower Growth
Chart 23… Controlling For The Odds That Weak Growth Leads To Populism
The Social Media Magnification Effect: Austerity, Populism, And Slower Growth
The Social Media Magnification Effect: Austerity, Populism, And Slower Growth
This is especially concerning given that wealth and income inequality, perhaps the single most important structural cause of rising populism and political polarization, is nearly as elevated as it was in the 1920s and 1930s (Chart 24). This trend, at least in the US, has been exacerbated by a decline in public trust of mainstream media among independents and Republicans that began in the early 2000s and helped to fuel the public’s adoption of alternative news and social media. The decline in trust clearly accelerated as a result of erroneous reporting on what turned out to be nonexistent weapons of mass destruction in Iraq and other controversies of the Bush administration. Chart 21 showed that the rise in populism has also yet to abate, suggesting that social media has the potential to continue to amplify policy mistakes for the foreseeable future. Chart 24Inequality: The Most Important Structural Cause Of Populism And Polarization
Inequality: The Most Important Structural Cause Of Populism And Polarization
Inequality: The Most Important Structural Cause Of Populism And Polarization
It is not yet clear what economic mistakes will occur under the Biden administration, but investors should not rule out the possibility of policies that are harmful for growth. The likely passage of a bipartisan infrastructure bill or a partisan reconciliation bill in the second half of this year will most likely be the final word on fiscal policy until at least 2025,4 underscoring that active fiscal austerity is not likely a major risk to investors. Spending levels will probably freeze after 2022: Republicans will not be able to slash spending, and Democrats will not be able to hike spending or taxes, if Republicans win at least one chamber of Congress in the midterms (as is likely). Biden has preserved the most significant of Trump’s protectionist policies by maintaining US import tariffs against China, and the lesson from the Tea Party’s surge following the global financial crisis is that major political shifts, magnified by social media, can manifest themselves as policy with the potential to impact economic activity within a two-year window. Attitudes toward China have shifted negatively around the world because of deindustrialization and now the pandemic.5 White collar workers in DM countries have clearly fared better during lockdowns than those of lower-income households. This has created extremely fertile ground for a revival in populist sentiment, which could force the Biden administration or Congressional Democrats toward protectionist or otherwise populist actions over the coming year, in the lead up to the 2022 mid-term elections. Investment Conclusions In this report, we have documented the historical link between social media, populism, and policy mistakes during the last economic expansion. It is clear that neither social media nor even populism is solely responsible for all mistakes – the UK’s and EU’s ill-judged foray into austerity was driven by elites. Furthermore, we have not addressed in this report the impact of populism on actions of emerging markets, such as China and Russia, whose own behavior has dealt disinflationary blows to the global economy. Nevertheless, populism is a potent force that clearly has the power to harness new technology and deliver shocks to the global economy and financial markets. The risks of additional mistakes from populism are still present, and that is even before considering other risks to society from social media: a reduction in mental health among young social media users, and the role that social media has played in spreading misinformation – contributing to the vaccine hesitancy in some DM countries that we discussed in Section 1 of our report. Two investment conclusions emerge from our analysis. First, we noted in our April report that there is a chance that investor expectations for the natural rate of interest (“R-star”) will rise once the economy normalizes post-pandemic, but that this will likely not occur as long as investors continue to believe in the narrative of secular stagnation. Despite the fact that the past decade’s shocks occurred against the backdrop of persistent household deleveraging (which has ended in the US), these shocks reinforced that narrative, and any additional policy shocks following a return to economic normality will again be seen by both investors and the Fed as strong justification for low interest rates. Thus, while the rapid closure of output gaps in advanced economies over the coming year argues for both cyclically and structurally higher bond yields, a revival in protectionist sentiment is a risk to this view that we will be closely monitoring over the coming 12-24 months. Second, for tech investors, the bipartisan shift in public sentiment to become more critical of social media companies is gradually becoming a real risk, potentially affecting user growth. Based solely on Facebook, Twitter, Pinterest, and Snapchat, social media companies do not account for a very significant share of the overall equity market (Chart 25), suggesting that the impact of a negative shift in sentiment toward social media companies would not be an overly significant event for equity investors in general. Chart 25 highlights that the share of social media companies as a percent of the broad tech sector rises if Google is included; YouTube accounts for less than 15% of Google’s total advertising revenue, however, suggesting modest additional exposure beyond the solid line in Chart 25. Chart 25The Underperformance Of Social Media Would Not Excessively Weigh On The Broad Market
The Underperformance Of Social Media Would Not Excessively Weigh On The Broad Market
The Underperformance Of Social Media Would Not Excessively Weigh On The Broad Market
Still, investors with concentrated positions in social media stocks should be aware of the potential idiosyncratic risks facing social media companies as a result of the public’s impression of the impact of social media on society. If social media companies come to be widely associated with political gridlock, the polarization of society, and failed economic policies (as already appears to be the case), then the fundamental performance of these stocks is likely to be quite poor regardless of whether or not tech companies ultimately enjoy a relatively friendly regulatory environment under the Biden administration. Jonathan LaBerge, CFA Vice President The Bank Credit Analyst Footnotes 1 Grassroots Organizing in the Digital Age: Considering Values and Technology in Tea Party and Occupy Wall Street by Agarwal, Barthel, Rost, Borning, Bennett, and Johnson, Information, Communication & Society, 2014. 2 Please see The Bank Credit Analyst “July 2021,” dated June 24, 2021, available at bca.bcaresearch.com 3 “Are We Underestimating Short-Term Fiscal Multipliers?”,IMF World Economic Outlook, October 2012 4 Please see US Political Strategy Outlook "Third Quarter Outlook 2021: Game Time," dated June 30, 2021, available at usps.bcaresearch.com 5 “Unfavorable Views of China Reach Historic Highs in Many Countries,” PEW Research Center, October 2020.
Highlights Economy – The Fed remains unperturbed about inflation, even as it continues to surprise to the upside: At his latest press conference, Chair Powell repeated the mantra that the spike in inflation will prove to be temporary. The shape of the inflation expectations curve supports the Fed’s view and the key expectations boxes of our inflation checklist remain unchecked. Markets – The decline in Treasury yields indicates that investors aren’t too worried about it, either: Although inflation data have continued to surprise to the upside, investors and the broader public seem to have moved on after the release of the March and April numbers. Inflation agita is not gone for good, but it may remain dormant until the fall. Strategy – The economic and policy backdrops remain favorable for risk assets and we remain overweight equities and spread product: Stop us if you’ve heard this one before, but risk assets will continue to generate positive excess returns over Treasuries and cash unless the Delta variant disrupts activity. Feature What a difference ten weeks make. When we rolled out our checklist on May 24th, inflation was Topic A for BCA clients and Google searchers, but it has been coming up less in our meetings and the internet queries are half of what they were (Chart 1). Inflation is a critical element of bond and currency markets, however, and it can have significant implications when it diverges from market expectations. Its currently elevated level and the novelty and uncertainty of the Fed’s revised approach to it ensure that it will intermittently command the spotlight. Chart 1Oh, Never Mind
Oh, Never Mind
Oh, Never Mind
Down the road, we think it has a good chance to break above a range that investors and policymakers are comfortable with, and we will review our inflation checklist every month or two to keep clients apprised of its course. We have checked the same three boxes that we did six weeks ago and the story from the charts underlying them is unchanged. Inflation remains well above 2% year-over-year and it will stay there for the foreseeable future. The Fed is nowhere close to deploying its tools to guide it back down to its stated target, however, so it presents no danger to the potent post-pandemic expansion, and households’ and businesses’ mindsets do not appear to have changed in any way that would presage a self-reinforcing dynamic that would feed an inflation spiral. If inflation isn’t going to become problematic any time soon, overheating is not a pressing risk over our twelve-month investment timeframe. If we are correct that the new Delta-powered wave of COVID infections will not strain the health care system’s capacity or spark an unsettling pickup in fatalities, we won’t need to increase our probability of a growth shortfall. From an investment strategy perspective, diminishing probabilities of too-hot and too-cold tail outcomes support continued risk-friendly positioning. The Goldilocks outcome of strong growth backed by ultra-accommodative monetary policy should allow risk assets to continue generating positive excess returns over Treasuries and cash over the next twelve months. Updating The Inflation Checklist Table 1Inflation Checklist
Resolute
Resolute
As mentioned above, we have checked the same three boxes on our inflation checklist that we did in late May and late June (Table 1). The labor market story remains unchanged: employer demand is at all-time highs as measured by the Job Openings components of the NFIB and JOLTS surveys (Chart 2). Labor supply has not risen to meet it, however, as a range of factors, including reduced caregiver availability (for children and adults), reluctance to risk infection and generous unemployment insurance benefits, converge to limit the number of job seekers. Though record demand and limited supply would be expected to lead to much higher prices, wage growth has remained contained (Chart 3), especially in the more refined series that adjust for composition effects or include benefits (Chart 3, bottom two panels). Chart 2Help Wanted
Help Wanted
Help Wanted
Chart 3Wage Growth Has Remained In Check
Wage Growth Has Remained In Check
Wage Growth Has Remained In Check
Year-over-year increases in core CPI and the core PCE price index have continued to accelerate (Chart 4, solid lines). They seem to have lost their ability to shock after April, however, as inflation expectations have taken little note of them and Google “inflation” searches have come off the boil. Investors apparently accept the Fed’s contention that the base inflation readings are being distorted by price moves in spaces that have been especially impacted by the pandemic and subsequent component shortages. Though the Fed's explanation may seem awfully convenient, its read is supported by the much more modest moves in the trimmed-mean CPI and PCE indexes (Chart 4, dashed lines). Chart 4Inflation Is Not Quite As Bad As It May Seem ...
Inflation Is Not Quite As Bad As It May Seem ...
Inflation Is Not Quite As Bad As It May Seem ...
We continue to check the inflation pipeline box as our Pipeline Inflation Pressure Index is still pointing steeply higher (Chart 5). With components like the CRB’s Raw Industrials Index showing no sign of letting up, pipeline pressures will not just go away. The dollar’s recovery is limiting inflation pressure from the import channel, though inflation is comparatively muted in both the euro zone (Chart 6, top panel) and China (Chart 6, bottom panel) in any event. Chart 5... But Its Got Legs
... But Its Got Legs
... But Its Got Legs
Chart 6Global Pressures Are Mild For Now
Global Pressures Are Mild For Now
Global Pressures Are Mild For Now
Chart 7Markets Are Looking Through Temporary Inflation Pressures ...
Markets Are Looking Through Temporary Inflation Pressures ...
Markets Are Looking Through Temporary Inflation Pressures ...
Chart 8... And So Are Consumers
... And So Are Consumers
... And So Are Consumers
We continue to view inflation expectations as the key to a meaningful inflection. If households, businesses and investors begin to anticipate a much higher rate of inflation over the longer term, they will change their behavior in ways that will cause their expectations to become self-fulfilling. We are therefore especially focused on the inflation expectations curve and have been relieved to see that market measures (Chart 7) and surveys (Chart 8) indicate that investors and other economic participants believe that an elevated rate of consumer price increases will not persist beyond the next year or two. As Table 2 illustrates, the inverted TIPS and CPI swaps expectations curves project a significant decline in inflation from the near term to the intermediate and long term. Table 2The Inflation Expectations Curve Is Solidly Inverted
Resolute
Resolute
The Fed Stays The Course The FOMC meeting and Chair Powell’s subsequent press conference were thin gruel, as the committee neither made nor telegraphed any meaningful course changes. Our main takeaway from the press conference was that the Fed is in no hurry to remove monetary accommodation because it is unperturbed by the inflation data that have come out over the last several months. As for accommodation, tapering is first on the agenda, but it doesn’t look like Powell will tackle the issue at Jackson Hole later this month: “We have not reached substantial further progress yet. So we’re not there, and … we see ourselves as having some ground to cover to get there.” Following the meeting, market consensus coalesced around a November or December announcement preceding a reduction in purchases beginning in January. Powell continued to stick to his ongoing inflation story, arguing that elevated inflation prints have resulted from idiosyncratic disruptions or base effects in segments that have been particularly affected by the pandemic. “What we’re seeing is a handful of things that really account for the overshoot of inflation. … [N]ew, used and rental cars have moved up in price because of the car shortage because of the semiconductor shortage. And hotels and airfares have moved back up, but that really just is retracing the very large downward movement in prices that they had before (Chart 9). [T]hat’s a big, big part of why the inflation readings are so high. And those frankly don’t carry significant implications in the long run for inflation or for the American economy.” Chart 9Inflation Isnt So Bad On A Two-Year Basis
Inflation Isnt So Bad On A Two-Year Basis
Inflation Isnt So Bad On A Two-Year Basis
Powell also riffed on the meaning of “transitory” in response to a reporter’s question, offering some further insight into the Fed’s inflation perspective. “[W]hat I mean by transitory is just something that doesn’t leave a permanent mark on the inflation process. I don’t mean that producers are going to take those price increases back. That’s not the idea. It’s just that they won’t go on indefinitely. So to the extent people are implementing price increases because raw materials are going up or labor costs or something’s going up, you know, the question for inflation really is, does that mean they’re going to go up the next year by the same amount?” Yet Another Great Quarter For Earnings Chart 10Following The New Script To A T
Resolute
Resolute
Last week, with 25% of S&P 500 constituents having reported results, we noted that 2Q21 was shaping up to be the index’s fifth consecutive quarter of dramatically outsized earnings beats. Now that 60% of the S&P has reported, including all five of the mega-cap FAAMG companies, we can declare that the streak will reach five when this reporting season is complete. Once again, knockout results (Chart 10, bottom panel) have stood the long-established guide-down-a-little-before-reporting-then-beat-by-a-modest-margin pattern (Chart 10, top panel) on its head. This quarter’s beat, currently tracking to 13%, will join the previous four pandemic quarters’ beats in obliterating the 1-to-6% range that contained every single quarter from 2012 to 2019 (Chart 11). Chart 11The Monster Beats Continue
Resolute
Resolute
The immediate upshot has been for the consensus second quarter earnings estimate to be revised higher to a level that surpasses first quarter earnings and our “easily attainable” $50 ballpark estimate (Table 3). If the Delta variant does not upend economic activity, as per our base case, we think there is scope for forward estimates to be revised higher. The current forecast has four-quarter earnings through 2Q22 ($204.70) barely rising from the current quarter’s annualized run rate ($203.84). That is unusual in a series that has a lifetime mean of 18% and rarely contracts, especially given that the economy is expanding at a gangbusters clip. Table 32Q21's Been Fixed, But The Out Quarters Still Have Scope To Rise
Resolute
Resolute
Investment Implications Chart 12The Shelves Are Almost Bare
The Shelves Are Almost Bare
The Shelves Are Almost Bare
We are undeterred by last week’s GDP disappointment, broader concerns about deceleration or overwrought talk about stagflation. 6.5% real second-quarter GDP growth came in well short of the consensus 8.4% expectation, but the number wasn’t as bad as it may have appeared to the naked eye. Real final domestic demand, which looks through inventory swings and net exports to provide a truer barometer of ongoing activity, grew at an 8.1% rate, powered by nearly 12% growth in consumption. The continued depletion of retail inventories, which must be restocked to meet ravenous consumer demand (Chart 12), pushed some growth into subsequent quarters, so growth may not have peaked in 2Q after all. As for stagflation, it simply doesn’t apply when the world’s largest economy is growing at the rate of a developing economy, three times its trend, over a year into an expansion. On balance, the new information we received last week was favorable. The Fed reiterated its resolve to keep supporting the economy with emergency levels of monetary accommodation even though the emergency has passed; S&P 500 earnings continue to shoot the lights out, forcing analysts into lifting their estimates once future quarters get closer; and consumers are spending with gusto, suggesting that excess pandemic savings and robust gains in household net worth will provide an ongoing lift to the economy well into 2022. All in all, the macroeconomic backdrop remains favorable for investors in risk assets and we continue to recommend overweighting them. Doug Peta, CFA Chief US Investment Strategist dougp@bcaresearch.com
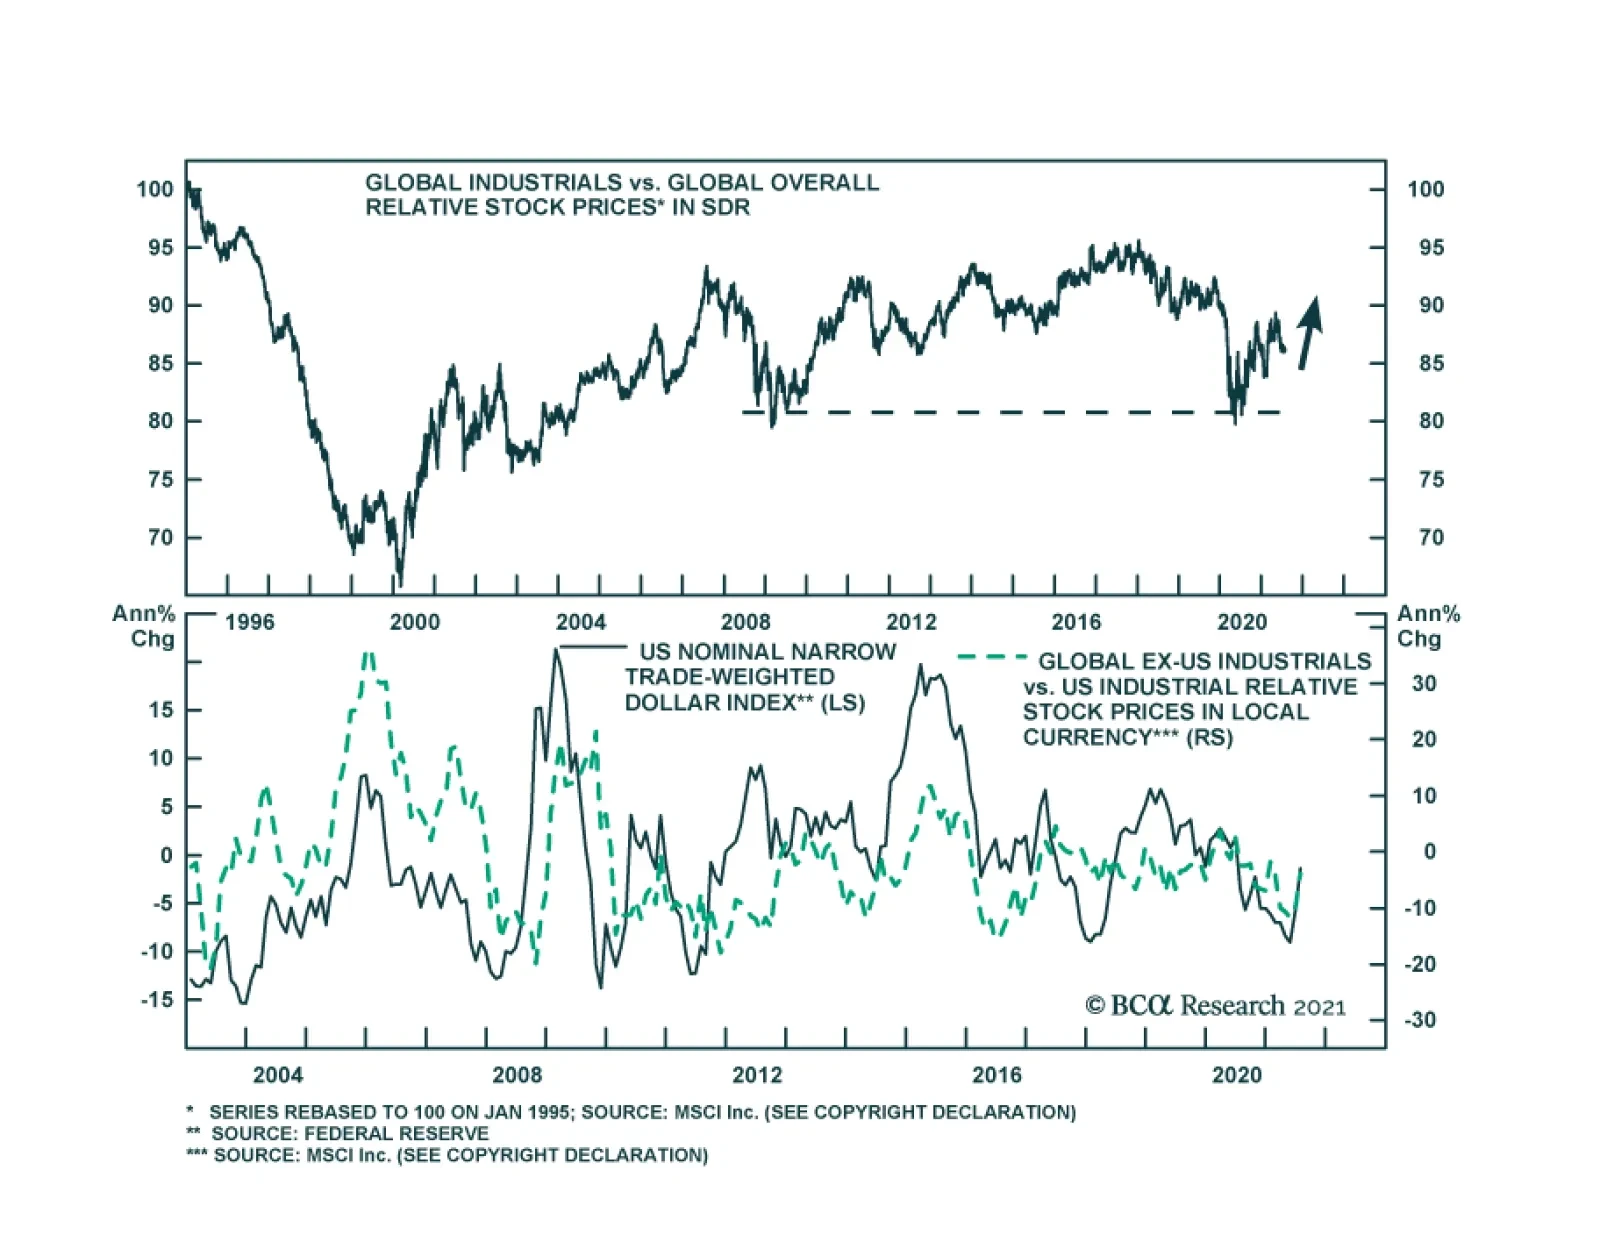
BCA Research’s Emerging Markets Strategy service recommends investors overweight US or international industrial companies that sell into the US as a multi-year strategy. The team views these industrial companies as a better way to play their thesis of…
Highlights Globalization is recovering to its pre-pandemic trajectory. But it will fail to live up to potential, as the “hyper-globalization” trends of the 1990s are long gone. China was the biggest winner of hyper-globalization. It now faces unprecedented risks in the context of hypo-globalization. Global investors woke up to China’s domestic political risks this year, which include arbitrary regulatory crackdowns on tech and private business. While Chinese officials will ease policy to soothe markets, the cyclical and structural outlook is still negative for this economy. Growth and stimulus have peaked. Political risk will stay high through the national party congress in fall 2022. US-China relations have not stabilized. India, the clearest EM alternative for global investors, is high-priced relative to China and faces troubles of its own. It is too soon to call a bottom for EM relative to DM. Feature Global investors woke up to China’s domestic political risk over the past week, as Beijing extended its regulatory crackdown to private education companies. Our GeoRisk Indicator shows Chinese political risk reaching late 2017 levels while the broad Chinese stock market continued this year’s slide against emerging market peers (Chart 1). Chart 1China: Domestic Political Risk Takes Investors By Surprise
Hypo-Globalization (A GeoRisk Update)
Hypo-Globalization (A GeoRisk Update)
A technical bounce in Chinese tech stocks will very likely occur but we would not recommend playing it. The first of our three key views for 2021 is the confluence of internal and external headwinds for China. True, today’s regulatory blitz will pass over like previous ones and the fast money will snap up Chinese tech firms on the cheap. The Communist Party is making a show of force, not destroying its crown jewels in the tech sector. However, the negative factors weighing on China are both cyclical and structural. Until Chinese President Xi Jinping adjusts his strategy and US-China relations stabilize, investors do not have a solid foundation for putting more capital at risk in China. Globalization is in retreat and this is negative for China, the big winner of the past 40 years. Hypo-Globalization Globalization in the truest sense has expanded over millenia. It will only reverse amid civilizational disasters. But the post-Cold War era of “hyper-globalization” is long gone.1 The 2010s saw the emergence of de-globalization. In the wake of COVID-19, global trade is recovering to its post-2008 trend but it is nowhere near recovering the post-1990 trend (Chart 2). Trade exposure has even fallen within the major free trade blocs, like the EU and USMCA (Chart 3). Chart 2Hypo-Globalization
Hypo-Globalization
Hypo-Globalization
Chart 3Trade Intensity Slows Even Within Trade Blocs
Trade Intensity Slows Even Within Trade Blocs
Trade Intensity Slows Even Within Trade Blocs
Of course, with vaccines and stimulus, global trade will recover in the coming decade. We coined the term “hypo-globalization” to capture this predicament, in which globalization is set to rebound but not to its previous trajectory.2 We now inhabit a world that is under-globalized and under-globalizing, i.e. not as open and free as it could be. A major factor is the US-China economic divorce, which is proceeding apace. China’s latest state actions – in diplomacy, finance, and business – underscore its ongoing disengagement from the US-led global architecture. The US, for its part, is now on its third presidency with protectionist leanings. American and European fiscal stimulus are increasingly protectionist in nature, including rising climate protectionism. Bottom Line: The stimulus-fueled recovery from the global pandemic is not leading to re-globalization so much as hypo-globalization. A cyclical reboot of cross-border trade and investment is occurring but will fall short of global potential due to a darkening geopolitical backdrop. Still No Stabilization In US-China Relations Chart 4Do Nations Prefer Growth? Or Security?
Hypo-Globalization (A GeoRisk Update)
Hypo-Globalization (A GeoRisk Update)
A giant window of opportunity is closing for China and Russia – they will look back fondly on the days when the US was bogged down in the Middle East. The US current withdrawal from “forever wars” incentivizes Beijing and Moscow to act aggressively now, whether at home or abroad. Investors tend to overrate the Chinese people’s desire for economic prosperity relative to their fear of insecurity and domination by foreign powers. China today is more desirous of strong national defense than faster economic growth (Chart 4). The rise of Chinese nationalism is pronounced since the Great Recession. President Xi Jinping confirmed this trend in his speech for the Communist Party’s first centenary on July 1, 2021. Xi was notably more concerned with foreign threats than his predecessors in 2001 and 2011 (Chart 5).3 China has arrived as a Great Power on the global stage and will resist being foisted into a subsidiary role by western nations. Chart 5Xi Jinping’s Centenary Speech Signaled Nationalist Turn
Hypo-Globalization (A GeoRisk Update)
Hypo-Globalization (A GeoRisk Update)
Meanwhile US-China relations have not stabilized. The latest negotiations did not produce agreed upon terms for managing tensions in the relationship. A bilateral summit between Presidents Biden and Xi Jinping has not been agreed to or scheduled, though it could still come together by the end of October. Foreign Minister Wang Yi produced a set of three major demands: that the US not subvert “socialism with Chinese characteristics,” obstruct China’s development, or infringe on China’s sovereignty and territorial integrity (Table 1). The US’s opposition to China’s state-backed economic model, export controls on advanced technology, and attempts to negotiate a trade deal with the province of Taiwan all violate these demands.4 Table 1China’s Three Demands From The United States (July 2021)
Hypo-Globalization (A GeoRisk Update)
Hypo-Globalization (A GeoRisk Update)
The removal of US support for China’s economic, development – recently confirmed by the Biden administration – will take a substantial toll on sentiment within China and among global investors. US President Joe Biden and four executive departments have explicitly warned investors not to invest in Hong Kong or in companies with ties to China’s military-industrial complex and human rights abuses. The US now formally accuses China of genocide in the Xinjiang region.5 Bottom Line: There is no stabilization in US-China relations yet. This will keep the risk premium in Chinese currency and equities elevated. The Sino-American divorce is a major driver of hypo-globalization. China’s Regulatory Crackdown President Xi Jinping’s strategy is consistent. He does not want last year’s stimulus splurge to create destabilizing asset bubbles and he wants to continue converting American antagonism into domestic power consolidation, particularly over the private economy. Now China’s sweeping “anti-trust” regulatory crackdown on tech, education, and other sectors is driving a major rethink among investors, ranging from Ark-founder Cathie Wood to perma-bulls like Stephen Roach. The driver of the latest regulatory crackdown is the administration’s reassertion of central party control. The Chinese economy’s potential growth is slowing, putting pressure on the legitimacy of single-party rule. The Communist Party is responding by trying to improve quality of life while promoting nationalism and “socialism with Chinese characteristics,” i.e. strong central government control and guidance over a market economy. Beijing is also using state power and industrial policy to attempt a great leap forward in science and technology in a bid to secure a place in the sun. Fintech, social media, and other innovative platforms have the potential to create networks of information, wealth, and power beyond the party’s control. Their rise can generate social upheaval at home and increase vulnerability to capital markets abroad. They may even divert resources from core technologies that would do more to increase China’s military-industrial capabilities. Beijing’s goal is to guide economic development, break up the concentration of power outside of the party, prevent systemic risks, and increase popular support in an era of falling income growth. Sociopolitical Risks: Social media has demonstrably exacerbated factionalism and social unrest in the United States, while silencing a sitting president. This extent of corporate power is intolerable for China. Economic And Financial Risks: Innovative fintech companies like Ant Group, via platforms like Alipay, were threatening to disrupt one of the Communist Party’s most important levers of power: the banking and financial system. The People’s Bank of China and other regulators insisted that Ant be treated more like a bank if it were to dabble in lending and wealth management. Hence the PBoC imposed capital adequacy and credit reporting requirements.6 Data Security Risks: Didi Chuxing, the ride-sharing company partly owned by Uber, whose business model it copied and elaborated on, defied authorities by attempting to conduct its initial public offering in the United States in June. The Communist Party cracked down on the company after the IPO to show who was in charge. Even more, Beijing wanted to protect its national data and prevent the US from gaining insights into its future technologies such as electric and autonomous vehicles. Foreign Policy Risks: Beijing is also preempting the American financial authorities, who will likely take action to kick Chinese companies that do not conform to common accounting and transparency standards off US stock exchanges. Better to inflict the first blow (and drive Chinese companies to Hong Kong and Shanghai for IPOs) than to allow free-wheeling capitalism to continue, giving Americans both data and leverage. Thus Beijing is continuing the “self-sufficiency” drive, divorcing itself from the US economy and capital markets, while curbing high-flying tech entrepreneurs and companies. The party’s muscle-flexing will culminate in Xi Jinping’s consolidation of power over the Politburo and Central Committee at the twentieth national party congress in fall 2022, where he is expected to take the title of “Chairman” that only Mao Zedong has held before him. The implication is that the regulatory crackdown can easily last for another six-to-12 more months. True, investors will become desensitized to the tech crackdown. But health care and medical technology are said to be in the Chinese government’s sights. So are various mergers and acquisitions. Both regulatory and political risk premia in different sectors can persist. The current administration has waged several sweeping regulatory campaigns against monopolies, corruption, pollution, overcapacity, leverage, and non-governmental organizations. The time between the initial launch of one of these campaigns and their peak intensity ranges from two to five years (Chart 6). Often, but not always, central policy campaigns have an express, three-year plan associated with them. Chart 6ABeijing Cracked Down On Monopolies, Corruption, Pollution...
Beijing Cracked Down On Monopolies, Corruption, Pollution...
Beijing Cracked Down On Monopolies, Corruption, Pollution...
Chart 6B...NGOs, Overcapacity, And Leverage
...NGOs, Overcapacity, And Leverage
...NGOs, Overcapacity, And Leverage
Chart 7China Tech: Buyer Beware
China Tech: Buyer Beware
China Tech: Buyer Beware
The first and second year mark the peak impact. The negative profile of Chinese tech stocks relative to their global peers suggests that the current crackdown is stretched, although there is little sign of bottom formation yet (Chart 7). The crackdown began with Alibaba founder Jack Ma, and Alibaba stocks have yet to arrest their fall either in absolute terms or relative to the Hang Seng tech index. Bottom Line: A technical bounce is highly likely for Chinese stocks, especially tech, but we would not recommend playing it because of the negative structural factors. For instance, we fully expect the US to delist Chinese companies that do not meet accounting standards. The Chinese Government’s Pain Threshold? The government is not all-powerful – it faces financial and economic constraints, even if political checks and balances are missing. Beijing does not have an interest in destroying its most innovative companies and sectors. Its goal is to maintain the regime’s survival and power. China’s crackdown on private companies goes against its strategic interest of promoting innovation and therefore it cannot continue indefinitely. The hurried meeting of the China Securities Regulatory Commission with top bankers on July 28 suggests policymakers are already feeling the heat.7 In the case of Ant Group, the company ultimately paid a roughly $3 billion fine (which is 18% of its annual revenues) and was forced to restructure. Ant learned that if it wants to behave more like a bank athen it will be regulated more like a bank. Yet investors will still have to wrestle with the long-term implications of China’s arbitrary use of state power to crack down on various companies and IPOs. This is negative for entrepreneurship and innovation, regardless of the government’s intentions. Chart 8China's Pain Threshold = Property Sector
China's Pain Threshold = Property Sector
China's Pain Threshold = Property Sector
Ultimately the property sector is the critical bellwether: it is a prime target of the government’s measures against speculative asset bubbles. It is also an area where authorities hope to ease the cost of living for Chinese households, whose birth rates and fertility rates are collapsing. While there is no risk of China’s entire economy crumbling because of a crackdown on ride-hailing apps or tutoring services, there is a risk of the economy crumbling if over-zealous regulators crush animal spirits in the $52 trillion property sector, as estimated by Goldman Sachs in 2019. Property is the primary store of wealth for Chinese households and businesses and falling property prices could well lead to an unsustainable rise in debt burdens, a nationwide debt-deflation spiral, and a Japanese-style liquidity trap. Judging by residential floor space started, China is rapidly approaching its overall economic pain threshold, meaning that property sector restrictions should ease, while monetary and credit policy should get easier as necessary to preserve the economic recovery (Chart 8). The economy should improve just in time for the party congress in late 2022. Bottom Line: China will be forced to maintain relatively easy monetary and fiscal policy and avoid pricking the property bubble, which should lend some support to the global recovery and emerging markets economies over the cyclical (12-month) time frame. China’s Regulation And Demographic Pressures Is the Chinese government not acting in the public interest by tamping down financial excesses, discouraging anti-competitive corporate practices, and combating social ills? Yes, there is truth to this. But arbitrary administrative controls will not increase the birth rate, corporate productivity, or potential GDP growth. First, it is true that Chinese households cite high prices for education, housing, and medicine as reasons not to have children (Chart 9). However, price caps do not attack the root causes of these problems. The lack of financial security and investment options has long fueled high house prices. The rabid desire to get ahead in life and the exam-oriented education system have long fueled high education prices. Monetary and fiscal authorities are forced to maintain an accommodative environment to maintain minimum levels of economic growth amid high indebtedness – and yet easy money policies fuel asset price inflation. In Japan, fertility rates began falling with economic development, the entrance of women in the work force, and the rise of consumer society. The fertility rate kept falling even when the country slipped into deflation. It perked up when prices started rising again! But it relapsed after the Great Recession and Fukushima nuclear crisis (Chart 10, top panel). Chart 9China: Concerns About Having Children
Hypo-Globalization (A GeoRisk Update)
Hypo-Globalization (A GeoRisk Update)
China’s fertility rate bottomed in the 1990s and has gradually recovered despite the historic surge in property prices (Chart 10, second panel), though it is still well below the replacement rate needed to reverse China’s demographic decline in the absence of immigration. A lower cost of living and a higher quality of life will be positive for fertility but will require deeper reforms.8 Chart 10Fertility Fell In Japan Despite Falling Prices
Fertility Fell In Japan Despite Falling Prices
Fertility Fell In Japan Despite Falling Prices
At the same time, arbitrary regulatory crackdowns that punish entrepreneurs are not likely to boost productivity. Anti-trust actions could increase competition, which would be positive for productivity, but China’s anti-trust actions are not conducted according to rule of law, or due process, so they increase uncertainty rather than providing a more stable investment environment. China’s tech crackdown is also aimed at limiting vulnerability to foreign (American) authorities. Yet disengagement with the global economy will reduce competition, innovation, and productivity in China. Bottom Line: China’s demographic decline will require larger structural changes. It will not be reversed by an arbitrary game of whack-a-mole against the prices of housing, education, and health. India And South Asia Chart 11China Will Ease Policy... Or India Will Break Out
China Will Ease Policy... Or India Will Break Out
China Will Ease Policy... Or India Will Break Out
Global investors have turned to Indian equities over the course of the year and they are now reaching a major technical top relative to Chinese stocks (Chart 11). Assuming that China pulls back on its policy tightening, this relationship should revert to mean. India faces tactical geopolitical and macroeconomic headwinds that will hit her sails and slow her down. In other words, there is no great option for emerging markets at the moment. Over the long run, India benefits if China falters. Following the peak of the second COVID-19 wave in May 2021, some high frequency indicators have showed an improvement in India’s economy. However, activity levels appear weaker than of other emerging markets (Chart 12). Given the stringency levels of India’s first lockdown last spring, year-on-year growth will look faster than it really is. As the base effect wanes, underlying weak demand will become evident. Moreover India is still vulnerable to COVID-19. Only 25% of the population has received one or more vaccine shots which is lower than the global level of 28%. The result will be a larger than expected budget deficit. India refrained from administering a large dose of government spending in 2020 (Chart 13). With key state elections due from early 2022 onwards, the government could opt for larger stimulus. This could assume the form of excise duty cuts on petroleum products or an increase in revenue expenditure. These kinds of measures will not enhance India’s productivity but will add to its fiscal deficit. Chart 12Weak Post-COVID Rebound In India – And Losing Steam
Hypo-Globalization (A GeoRisk Update)
Hypo-Globalization (A GeoRisk Update)
Chart 13India Likely To Expand Fiscal Spending Soon
Hypo-Globalization (A GeoRisk Update)
Hypo-Globalization (A GeoRisk Update)
Such an unexpected increase in India’s fiscal deficit could be viewed adversely by markets. India’s fiscal discipline tends to be poorer than that of peers (see Chart 13 above). Meanwhile India’s north views Pakistan unfavorably and key state elections are due in this region. Consequently, Indian policy makers may be forced to adopt a far more aggressive foreign policy response to any terrorist strikes from Pakistan or territorial incursions by China over August 2021. The US withdrawal from Afghanistan poses risks for India as it has revived the Taliban’s influence. India has a long history of being targeted by Afghani terrorist groups. And its diplomatic footprint in Afghanistan has been diminishing. Earlier in July, India decided temporarily to close its consulate in Kandahar and evacuated about 50 diplomats and security personnel. As August marks the last month of formal US presence in Afghanistan, negative surprises emanating from Afghanistan should be expected. Bottom Line: Pare exposure to Indian assets on a tactical basis. Our Emerging Markets Strategy takes a more optimistic view but geopolitical changes could act as a negative catalyst in the short term. We urge clients to stay short Indian banks. Investment Takeaways US stimulus contrasts with China’s turmoil. The US Biden administration and congressional negotiators of both parties have tentatively agreed on a $1 trillion infrastructure deal over eight years. Even if this bipartisan deal falls through, Democrats alone can and will pass another $1.3-$2.5 trillion in net deficit spending by the end of the year. Stay short the renminbi. Prefer a balance of investments in the dollar and the euro, given the cross-currents of global recovery yet mounting risks to the reflation trade. A technical bounce in Chinese stocks and tech stocks is nigh. China’s policymakers are starting to respond to immediate financial pressures. However, growth has peaked and structural factors are still negative. The geopolitical outlook is still gloomy and China’s domestic political clock is a headwind for at least 12 more months. Prefer developed market equities over emerging markets (Chart 14). Emerging markets failed to outperform in the first half of the year, contrary to our expectation that the global reflation trade would lift them. China/EM will benefit when Beijing eases policy and growth rebounds. Chart 14Emerging Markets: Not Out Of The Woods Yet
Emerging Markets: Not Out Of The Woods Yet
Emerging Markets: Not Out Of The Woods Yet
Stay short Indian banks and strongman EM currencies, including the Turkish lira, the Brazilian real, and the Philippine peso. The biggest driver of EM underperformance this year is the divergence between the US and China. But until China’s policy corrects, the rest of EM faces downside risks. Matt Gertken Vice President Geopolitical Strategy mattg@bcaresearch.com Ritika Mankar, CFA Editor/Strategist ritika.mankar@bcaresearch.com Footnotes 1 Dani Rodrik, The Globalization Paradox: Democracy and the Future of the World Economy (New York: Norton, 2011). 2 See my "Nationalism And Globalization After COVID-19," Investments & Wealth Monitor (Jan/Feb 2021), pp13-21, investmentsandwealth.org. 3 Our study of Xi’s speech is not limited to this quantitative, word-count analysis. A fuller comparison of his speech with that of his predecessors on the same occasion reveals that Xi was fundamentally more favorable toward Marx, less favorable toward Deng Xiaoping and the pro-market Third Plenum, utterly silent on notions of political reform or liberal reform, more harsh in his rhetoric toward the outside world, and hawkish about the mission of reunifying with Taiwan. 4 The Chinese side also insisted that the US stop revoking visas, punishing companies and institutes, treating the press as foreign agents, and detaining executives. It warned that cooperation – which the US seeks on the environment, Iran, North Korea, and other areas – cannot be achieved while the US imposes punitive measures. 5 See US Department of State, "Xinjiang Supply Chain Business Advisory," July 13, 2021, and "Risks and Considerations for Businesses Operating in Hong Kong," July 16, 2021, state.gov. 6 Top business executives are also subject to these displays of state power. For example, Alibaba founder Jack Ma caricatured China’s traditional banks as “pawn shops” and criticized regulators for stifling innovation. He is now lying low and has taken to painting! 7 See Emily Tan and Evelyn Cheng, "China will still allow IPOs in the United States, securities regulator tells brokerages," CNBC, July 28, 2021, cnbc.com. Officials are sensitive to the market blowback but the fact remains that IPOs in the US have been discouraged and arbitrary regulatory crackdowns are possible at any time. 8 Increasing social spending also requires local governments to raise more revenue but the central government had been cracking down on the major source of revenues for local government: land sales and local government financing vehicles. With the threat of punishment for local excesses and lack of revenue source, local governments have no choice but to cut social services, pushing affluent residents towards private services, while leaving the less fortunate with fewer services. As with financial regulations, the central government may backpedal from too tough regulation of local governments, but more economic and financial pain will be required to make it happen. The Geopolitics Of The Olympics The 2020 Summer Olympics are currently underway in Tokyo, even though it is 2021. The arenas are mostly empty given the global pandemic and economic slowdown. Every four years the Summer Olympics create a golden opportunity for the host nation to showcase its achievements, infrastructure, culture, and beauty. But the Olympics also have a long history of geopolitical significance: terrorist acts, war protests, social demonstrations, and boycotts. In 1906 an Irish athlete climbed a flag pole to wave the Irish flag in protest of his selection to the British team instead of the Irish one. In 1968 two African American athletes raised their fists as an act of protest against racial discrimination in the US after the assassination of Martin Luther King Jr. In 1972, the Palestinian terrorist group Black September massacred eleven Israeli Olympians in Munich, Germany. In 1980 the US led the western bloc to boycott the Moscow Olympics while the Soviet Union and its allies retaliated by boycotting the 1984 Los Angeles Olympics. In 2008, Russia used the Olympics as a convenient distraction from its invasion of Georgia, a major step in its geopolitical resurgence. So far, thankfully, the Tokyo Olympics have gone without incident. However, looking forward, geopolitics is already looming over the upcoming 2022 Winter Olympics in Beijing.
Hypo-Globalization (A GeoRisk Update)
Hypo-Globalization (A GeoRisk Update)
How the world has changed. The 2008 Summer Olympics marked China’s global coming-of-age celebration. The breathtaking opening ceremony featured 15,000 performers and cost $100 million. The $350 million Bird’s Nest Stadium showcased to the world China’s long history, economic prowess, and various other triumphs. All of this took place while the western democratic capitalist economies grappled with what would become the worst financial and economic crisis since the Great Depression. In 2008, global elites spoke of China as a “responsible stakeholder” that was conducting a “peaceful rise” in international affairs. The world welcomed its roughly $600 billion stimulus. Now elites speak of China as primarily a threat and a competitor, a “revisionist” state challenging the liberal world order. China is blamed for a lack of transparency (if not virological malfeasance) in handling the COVID-19 pandemic. It is blamed for breaking governance promises and violating human rights in Hong Kong, for alleged genocide in Xinjiang, and for a list of other wrongdoings, including tough “Wolf Warrior” diplomacy, cyber-crime and cyber-sabotage, and revanchist maritime-territorial claims. Even aside from these accusations it is clear that China is suffering greater financial volatility as a result of its conflicting economic goals. Talk of a diplomatic or even full boycott of Beijing’s winter games is already brewing. Sponsors are also second-guessing their involvement. More than half of Canadians support boycotting the winter games. Germany is another bellwether to watch. In 2014, Germany’s president (not chancellor) boycotted the Sochi Olympics; in 2021, the EU and China are witnessing a major deterioration of relations. Parliamentarians in the UK, Italy, Sweden, Switzerland, and Norway have asked their governments to outline their official stance on the winter games. In the age of “woke capitalism,” a sponsorship boycott of the games is a possibility. This is especially true given the recent Chinese backlash against European multinational corporations for violating China’s own rules of political correctness. A boycott which includes any members of the US, Norway, Canada, Sweden, Germany, or the Netherlands would be substantial as these are the top performers in the Winter Olympics. Even if there is no boycott, there is bound to be some political protests and social demonstrations, and China will not be able to censor anything said by Western broadcasters televising the events. Athletes usually suffer backlash at home if they make critical statements about their country, but they run very little risk of a backlash for criticizing China. If anything, protests against China’s handling of human rights will be tacitly encouraged. Beijing, for its part, will likely overreact, as these days it not only controls the message at home but also attempts more actively to export censorship. This is precisely what the western governments are now trying to counteract, for their own political purposes. The bottom line is that the 2008 Beijing Olympics reflected China’s strengths in stark contrast with the failures of democratic capitalism, while the 2022 Olympics are likely to highlight the opposite: China’s weaknesses, even as the liberal democracies attempt a revival of their global leadership. Jesse Anak Kuri Associate Editor Jesse.Kuri@bcaresearch.com Section II: GeoRisk Indicator China
China: GeoRisk Indicator
China: GeoRisk Indicator
Russia
Russia: GeoRisk Indicator
Russia: GeoRisk Indicator
United Kingdom
UK: GeoRisk Indicator
UK: GeoRisk Indicator
Germany
Germany: GeoRisk Indicator
Germany: GeoRisk Indicator
France
France: GeoRisk Indicator
France: GeoRisk Indicator
Italy
Italy: GeoRisk Indicator
Italy: GeoRisk Indicator
Canada
Canada: GeoRisk Indicator
Canada: GeoRisk Indicator
Spain
Spain: GeoRisk Indicator
Spain: GeoRisk Indicator
Taiwan
Taiwan: GeoRisk Indicator
Taiwan: GeoRisk Indicator
Korea
Korea: GeoRisk Indicator
Korea: GeoRisk Indicator
Turkey
Turkey: GeoRisk Indicator
Turkey: GeoRisk Indicator
Brazil
Brazil: GeoRisk Indicator
Brazil: GeoRisk Indicator
Australia
Australia: GeoRisk Indicator
Australia: GeoRisk Indicator
Section III: Geopolitical Calendar