Equities

Highlights Economy – The inevitable deceleration has arrived, but the economy is still growing far faster than trend and will continue to do so through 2022: A wide range of data series shows that US growth has likely peaked but deceleration from way, way above the long-run potential growth rate to way above it is not cause for concern. Markets – Growth worries pulled equities lower for one day last week before investors rushed back in to buy the dip: Stock volatility made a brief return at the beginning of the week before the S&P 500 snapped back to resume taking aim at new highs. Fundamentals supported the reversal as earnings are on a path to blow away expectations for the fifth consecutive quarter. Strategy – Investors should stay the course by overweighting risk assets in multi-asset portfolios: As long as the spread of the Delta variant does not lead to punishing new restrictions, the economy will continue to grow at an extremely rapid clip and the strong-growth, easy-policy backdrop will continue to support equities and credit. Feature The S&P 500 had its worst one-day performance since early April last Monday, shedding 1.6% and sending the VIX above 20 for only the ninth time since it broke into the teens in March (Chart 1). We do not read too much into day-to-day moves in financial markets, but the tumult seems to have resulted from equities’ delayed reaction to investor unease about decelerating growth. It makes intuitive sense that forward-looking markets often assign greater importance to the direction of a key data series than its level. In Wayne Gretzky terms, the level is largely an indication of where conditions have been, while the direction offers more insight into where they are headed. Direction does not always trump level, however, and investors should bear in mind that the current pace of growth is extremely elevated. The Bloomberg consensus of economists is calling for 6.6% real GDP growth in 2021 and 4.2% in 2022. Those figures project a tapering, especially from quarter to quarter (Table 1), but they still represent red-hot growth for an economy with an annual long-term potential growth rate in the range of 1.75% to 2%. They also reflect a gentle tapering, with growth expected to remain comfortably above trend through 2023. Chart 1Lower Highs, Lower Lows
Lower Highs, Lower Lows
Lower Highs, Lower Lows
Table 12% Is So Last Decade
Thrill Ride
Thrill Ride
We are far less concerned about deceleration from high single-digit growth than we would be about sub-trend readings. Falling below trend was the persistent fear in the aftermath of the Global Financial Crisis when economists and investors alike worried that the economy would not be able to stay above stall speed. Growth likely peaked in the second quarter, and supply bottlenecks and wavering confidence in the face of the spread of COVID-19’s Delta variant have brought the economic surprise index back down to earth (Chart 2). To take one example of a series that recently generated a negative surprise, however, we think the month-over-month decline in the ISM non-manufacturing index has less to say about the economy than its fourth straight reading in the 60s, a level it had reached just eight times in the previous 23 years (Chart 3). Chart 2The Economy Is Cooling Off, ...
The Economy Is Cooling Off, ...
The Economy Is Cooling Off, ...
Chart 3... But It's Still Quite Hot
Thrill Ride
Thrill Ride
Is The Bond Market Trying To Warn Us? Chart 4Inflation Fears Have Ebbed
Inflation Fears Have Ebbed
Inflation Fears Have Ebbed
We did not foresee the steep decline in 10-year Treasury yields that has played out since mid-June and it has led us to ask if underlying economic conditions are weaker than we perceived. Based on the available data, we do not think so. It seems like the rally in long-dated Treasuries can be attributed to an unwinding of inflation fears, concerns about slowing growth and the reversal of a Treasury sell-off that had gone too far too fast. We remain constructive on the economy, assuming vaccine-resistant COVID-19 variants do not emerge, and we still expect the 10-year Treasury yield will end the year north of 1.75%. Inflation fears have cooled considerably, with 10-year TIPS breakevens having retreated to the lower end of the Fed’s desired range, while the 5-year-on-5-year series (the 5-year breakeven five years from now) has dropped out of it (Chart 4). Though we do not expect inflation to become a problem for the economy for another couple of years, we do expect that it will re-emerge as a worry for investors once the primary impediments to labor supply disappear in September, especially if the year-over-year CPI readings continue to come in way above 2%. Our Global Fixed Income Strategy service stresses that investors should watch the mix of components driving inflation. If accelerated wage gains appear to be on their way to becoming entrenched or the rate of growth in rents inflects higher, the transitory inflation narrative might begin to weaken, leading the Fed to dial back accommodation sooner and/or faster than the bond market currently anticipates. Though we are not concerned about a widely anticipated peak in the rate of growth, a revival of COVID-19 after it seemed to have been defanged would throw a spanner into the works. A surge in new infections, even in countries like the UK and the US which have been ahead of the pack in terms of vaccinations, indicates that the Delta variant is especially transmissible. The spike in infections here (Chart 5, top panel) and abroad has apparently dampened economic optimism, helping to push Treasury and other developed world sovereign yields lower. The good news, however, is that the Delta variant does not appear to be particularly lethal (Chart 5, bottom panel) and the leading Pfizer and Moderna vaccines have acquitted themselves well against it. We are watching virus developments carefully, but we do not yet see evidence that suggests new rounds of activity restrictions are in store and we therefore expect virus variants will ultimately have little economic impact. Chart 5The Delta Variant Is More Contagious But Less Serious
The Delta Variant Is More Contagious But Less Serious
The Delta Variant Is More Contagious But Less Serious
Aside from the pendulum shifting from too-hot concerns to too-cold concerns, much of the Treasury rally appears to have been a reaction to the speed and extent of the backup in yields. Our Global Fixed Income Strategy colleagues point out that Treasuries became quite oversold in the first quarter. The 10-year yield got as far above its 200-day moving average as it did during the taper tantrum in 2013 (Chart 6, second panel), with both real-money investors (Chart 6, third panel) and speculators (Chart 6, bottom panel) shunning duration. Speculators have trimmed their short positions but the real money has yet to capitulate, suggesting that yields may be able to hang around current levels or edge even lower before returning to a level that better aligns with underlying economic strength, robust inflation readings and the future path of the fed funds rate. Earnings Continue To Crush Expectations Every equity investor is familiar with the earnings season dance. About halfway through the quarter, companies begin to guide analysts’ expectations lower. Analysts duly adjust their estimates down a few percentage points over the ensuing ten weeks before companies begin to report. Company earnings then come in about the level initially expected midway through the quarter and – voila! – three-quarters of S&P 500 constituents beat expectations and the overall index beats by around 3%. The typical pattern looks very much like it did across 2019 (Chart 7, top panel). Chart 6The Treasury Selloff Was Overdone
The Treasury Selloff Was Overdone
The Treasury Selloff Was Overdone
Chart 7Not The Same Old Song-And-Dance
Thrill Ride
Thrill Ride
Beginning with the second quarter of 2020, when the most stringent lockdown measures meant to stymie the spread of the pandemic were fully in force, the picture has been very different. S&P 500 constituents have barely guided down heading into earnings before proceeding to demolish estimates by close to 20% (Chart 7, bottom panel). The established practice of companies guiding analysts to position the bar at a height they think they can comfortably clear produced a narrow and consistent dispersion of earnings beats across the 32 quarters from 2012 to 2019, with a mean of 3.7% and a standard deviation of 1.4%, all clustered within a narrow 1-to-6% range (Chart 8). Chart 8Blasting Out Of The Old Range
Thrill Ride
Thrill Ride
Something else entirely has unfolded over the last four quarters, when earnings beat by an average of 19.5%, more than three times above the previous eight years’ peak and five times their mean. Even with the pandemic numbers pushing the mean higher and quadrupling the standard deviation, the four quarters’ beats have been 3.2, 2.2, 1.8 and 3.1 standard deviations above the mean, respectively. With a quarter of the S&P 500 having reported results through last Friday, the second quarter appears to be on a path to extend the blowout streak to five quarters (Chart 7, bottom panel). Investors, conditioned to the S&P 500 unfailingly beating earnings, don’t seem to be cognizant of how unusual the magnitude of the beats has been. Gigantic year-over-year earnings gains, which will peak this quarter, also seem to have obscured how low the bar has been set on a quarter-over-quarter basis. As our US Equity Sector Strategy colleagues have highlighted, year-over-year comparisons that span pandemic-distorted quarters are of limited use. To get a more relevant read, they compare 2021 results to 2019 results. (For the full year, 2021 earnings per share for the S&P 500 are projected to come in 18.2% above 2019, for 8.7% annualized growth). Table 2A Remarkably Low Bar
Thrill Ride
Thrill Ride
We have been tracking quarter-over-quarter changes and were surprised to see that forward four-quarter earnings were expected to decline 2% from their first-quarter run rate ($196.52, annualized) when the reporting season began, with the second quarter declining by 8% (Table 2). Given manifold signs of economic revival, an 8% sequential contraction strikes us as highly improbable. With real GDP expected to grow by 9% on an annualized quarter-over-quarter basis, or better than 12% in nominal terms, 2% growth seems reasonable, so we see $50 as a more realistic and easily attainable ballpark estimate, which would have earnings beat by 11%. Regardless of where earnings end up, the bar has been set extremely low – the analyst consensus has not forecasted contraction in any forward four-quarter period since 1980 (Chart 9). Our takeaway is that earnings estimates have scope to move higher, taking the S&P 500 with them if multiples don’t contract, or giving valuations a chance to cool if the index moves sideways or turns lower. Chart 9An Odd Time To Call For The First Contraction In 40 Years
An Odd Time To Call For The First Contraction In 40 Years
An Odd Time To Call For The First Contraction In 40 Years
Investment Implications Our investment strategy recommendations follow from our ongoing analysis of the business cycle, the credit cycle, the monetary policy cycle and (when applicable) the sentiment cycle. Although the consistency of our risk-friendly asset allocation recommendations may have begun to seem boring, nothing in our cycle analysis calls for a change in our views. There is no reason to expect a recession when households are sitting on $2.4 trillion of excess savings, household net worth has advanced at the fastest rate on record, retail inventories have been depleted to record-low levels and payrolls are set to continue expanding at a furious rate over the next year-plus. The credit cycle is set to continue its charmed path, as rising incomes, cash-stuffed households and businesses, and zero interest rate policy suppress borrower distress and keep lenders eager to make loans. Monetary policy may get incrementally less accommodative as asset purchases shrink, but a rate hike is more than a year away. One can make a reasonable argument that the Fed will be unable to lift the fed funds rate to a truly restrictive level in the next policy tightening cycle once it begins to hike rates, even if it’s not our base case. We are certain that monetary policy settings will remain extremely easy well beyond our one-year investment timeframe. Sentiment is generally buoyant, but it is not at extreme levels that would warrant factoring it into our strategy as a contrarian indicator. We will therefore stay the course, while monitoring pandemic developments and keeping a sharp lookout for signs that we’re wrong about inflation or growth. If we are correct that the threat from COVID-19 will remain contained, we expect that earnings revisions will ensure that the next catalyst for equities will be a positive one. The consensus expectation for a decline in the earnings run rate is simply incompatible with observed conditions on the ground. Doug Peta, CFA Chief US Investment Strategist dougp@bcaresearch.com
Dear Client, I will be on vacation next week. In lieu of our regular report, we will be sending you a Special Report written by my colleague Arthur Budaghyan, BCA Research’s Chief Emerging Markets Strategist. Arthur’s report will discuss the long-term outlook for industrial companies. He argues that the US is entering an industrial boom prompted by infrastructure stimulus and onshoring. This will benefit US industrial equities, or ones selling into the US on a multi-year horizon. I trust you will find it insightful. Best regards, Peter Berezin, Chief Global Strategist Highlights Investors keep asking whether the recent increase in US inflation is transitory. However, this is the wrong question to ask. Annualized core CPI inflation reached 10.6% in the second quarter. There is little doubt that inflation will fall from such elevated levels. The key question that investors should be asking is whether inflation will decline more or less than what the market is discounting. The widely watched 5-year/5-year forward TIPS inflation breakeven rate has sunk to 2.11%, below the Fed’s “comfort zone” of 2.3%-to-2.5%. Thus, the market already expects a substantial decline in inflation. Our sense is that US inflation will come down fast enough to allow the Fed to maintain a highly dovish policy stance, but not as fast as market expectations currently imply. As inflation surprises on the upside, long-term bond yields will rise. This should revive bank shares and other reflationary plays. The combination of a weaker US dollar, faster sequential Chinese growth, increased vaccine supplies, and favorable valuations should all help EM stocks later this year. Go long the Vanguard FTSE Emerging Markets ETF (VWO) versus the Vanguard S&P 500 ETF (VOO). The Right Question About Inflation Chart 1After A Spike In Q2, US Inflation Will Decelerate
After A Spike In Q2, US Inflation Will Decelerate
After A Spike In Q2, US Inflation Will Decelerate
Investors remain focused on whether the recent bout of US inflation is transitory. However, this is not the correct question to be asking at the present juncture. The US core CPI rose by 10.6% at an annualized pace in Q2 relative to the first quarter (Chart 1). It is almost inevitable that inflation will come down from such high levels. The key question investors should be asking is whether inflation will decline more or less than what is already baked into market expectations. As Chart 2 shows, investors expect US inflation to come down rapidly over the next two years. The 5-year/5-year forward TIPS breakeven inflation rate – a good proxy for where investors expect inflation to be over the long haul – has sunk to 2.11% (Chart 3). This is below the Fed’s comfort zone of 2.3%-to-2.5%.1 Globally, long-term inflation expectations remain subdued (Chart 4). Chart 2Inflation Is Expected To Moderate Over The Coming Years
Investors Are Asking The Wrong Question About Inflation
Investors Are Asking The Wrong Question About Inflation
Chart 3Inflation Expectations Have Fallen Back Below The Fed's Target Zone
Inflation Expectations Have Fallen Back Below The Fed's Target Zone
Inflation Expectations Have Fallen Back Below The Fed's Target Zone
Chart 4Long-Term Inflation Expectations Remain Subdued
Investors Are Asking The Wrong Question About Inflation
Investors Are Asking The Wrong Question About Inflation
Inflation Will Fall, But… Our sense is that US inflation will come down fast enough to allow the Fed to maintain a highly dovish policy stance, but not as fast as market expectations currently imply. Broad-based inflationary pressures would make the Fed nervous. However, that is not what we are seeing. Wages have accelerated markedly in only a few relatively low-skilled sectors such as retail trade and leisure and hospitality (Chart 5). For the economy as a whole, wage growth is broadly stable (Chart 6). The expiration of extended unemployment benefits, the reopening of schools, and increased immigration should also boost labor supply in the fall. Chart 5Faster Wage Growth Has Been Confined To A Few Low-Wage Sectors
Investors Are Asking The Wrong Question About Inflation
Investors Are Asking The Wrong Question About Inflation
Chart 6No Sign Of A Wage-Price Spiral... For Now
No Sign Of A Wage-Price Spiral... For Now
No Sign Of A Wage-Price Spiral... For Now
On the price front, more than two-thirds of the increase in the core CPI in June stemmed from pandemic-afflicted sectors (Chart 7). The price of the median item within the CPI index rose by just 2.2% year-over-year in June, somewhat below the pre-pandemic pace of inflation (Chart 8). Chart 7Most Of The Recent Increase In Inflation Is Pandemic-Related
Investors Are Asking The Wrong Question About Inflation
Investors Are Asking The Wrong Question About Inflation
Chart 8The Median Price In The CPI Basket Is Up Only 2.2%
The Median Price In The CPI Basket Is Up Only 2.2%
The Median Price In The CPI Basket Is Up Only 2.2%
… Not As Fast As The Market Expects While inflation will fall as pandemic effects recede, investors are overestimating how fast this will happen. US growth has undoubtedly peaked, but at a very high level. Economists surveyed by Bloomberg estimate that US GDP rose by 9.0% in Q2. Growth is expected to slow to 7.1% in Q3 and 5.1% in Q4, while averaging 4.2% in 2022 (Table 1). By any standard, these are very strong, above-trend growth rates. Table 1Growth Is Peaking, But At A Very High Level
Investors Are Asking The Wrong Question About Inflation
Investors Are Asking The Wrong Question About Inflation
Chart 9Nearly 90% Of US Seniors Have Had At Least One Shot
Investors Are Asking The Wrong Question About Inflation
Investors Are Asking The Wrong Question About Inflation
The current Delta-variant wave is unlikely to slow US growth by very much. Although vaccination rates among younger people are at middling levels, they are quite high for the elderly who are most at risk of serious illness. Close to 89% of Americans above the age of 65 have received at least one shot, and nearly 80% are fully vaccinated (Chart 9). The 65+ age group accounts for four-fifths of all Covid deaths in the United States. Widespread vaccination coverage for older Americans will take pressure off the hospital system, allowing the economy to remain open. Fiscal Support In The US And Abroad As we noted last week, Senate Democrats are likely to use the reconciliation process to both raise the debt ceiling and pass President Biden’s $3.5 trillion American Jobs and Families Plan. They are also likely to move forward on Biden’s proposed $600 billion in infrastructure spending, with or without Republican support. Meanwhile, much of the fiscal stimulus that has already been undertaken has yet to make its way through to the economy. US households are sitting on about $2.5 trillion in excess savings, about half of which stems from increased government transfers (Chart 10). Chart 10A Lot Of Excess Savings
Investors Are Asking The Wrong Question About Inflation
Investors Are Asking The Wrong Question About Inflation
Chart 11Inventories Are At Low Levels
Inventories Are At Low Levels
Inventories Are At Low Levels
Satiating that demand has not been easy for many companies. Retail sector inventories are at record lows (Chart 11). The number of homes that have been authorized for construction but where building has yet to begin has increased by 62% since the start of the pandemic (Chart 12). By limiting production, supply-chain bottlenecks will push some spending towards the future. This will keep growth from decelerating more than it otherwise would. Outside the US, fiscal policy will remain supportive. All 27 EU countries ratified the €750 billion Next Generation fund on May 28th. The allocations from the fund for southern European countries are relatively large (Chart 13). Most of the money will be spent on public investment projects with high fiscal multipliers. Chart 12Growing Backlog Of New Home Construction Projects
Growing Backlog Of New Home Construction Projects
Growing Backlog Of New Home Construction Projects
Chart 13EU Fiscal Policy: Allocations To Southern European Countries Are Relatively Large
EU Fiscal Policy: Allocations To Southern European Countries Are Relatively Large
EU Fiscal Policy: Allocations To Southern European Countries Are Relatively Large
Chart 14Economic Growth In China Was Slow In H1
Economic Growth In China Was Slow In H1
Economic Growth In China Was Slow In H1
The Japanese government is contemplating sending stimulus checks to low-income citizens in advance of the general election due by October 22nd. It is an understandable move. Covid cases are rising again. As a result, the authorities have declared a state of emergency in Tokyo and barred spectators from attending the Olympic games in and around the city. Fortunately, the Japanese vaccination campaign has accelerated after a slow start. A third of the population has now received at least one shot. The government intends to vaccinate all eligible people by November. Looking at quarter-over-quarter growth rates, Chinese growth averaged just 3.8% on an annualized basis in the first half of 2021 (Chart 14). Growth should pick up in the second half of the year thanks in part to increased fiscal spending. As of June, local governments had used only 28% of their annual bond issuance quotas, compared with 61% over the same period last year and 65% in 2019. Most of the proceeds from local government bond sales will likely flow into infrastructure projects. Resumption Of The Dollar Bear Market Will Keep Inflation From Falling Too Far As a countercyclical currency, the US dollar usually weakens when global growth is strong (Chart 15). Short-term real interest rate differentials have moved sharply against the dollar, a trend that is unlikely to change anytime soon given the Fed’s dovish bias (Chart 16). While inflation in the US is not as sensitive to currency fluctuations as in most other countries, a weaker dollar will still lift tradeable goods prices (Chart 17). Chart 15The Dollar Is A Countercyclical Currency
The Dollar Is A Countercyclical Currency
The Dollar Is A Countercyclical Currency
Chart 16Rate Differentials Are A Headwind For The Dollar
Rate Differentials Are A Headwind For The Dollar
Rate Differentials Are A Headwind For The Dollar
Chart 17The Dollar And Inflation
Investors Are Asking The Wrong Question About Inflation
Investors Are Asking The Wrong Question About Inflation
Structural Forces Turning More Inflationary Not only are cyclical forces likely to turn out to be less disinflationary than investors believe, but many of the structural factors that have suppressed inflation over the past 40 years are reversing direction: Chart 18Globalization Plateaued More Than A Decade Ago
Globalization Plateaued More Than A Decade Ago
Globalization Plateaued More Than A Decade Ago
Globalization is in retreat: The ratio of global trade-to-manufacturing output has been flat for over a decade (Chart 18). Looking out, the ratio could even decline as more companies shift production back home in order to gain greater control over supply chains of essential goods. Baby boomers are leaving the labor force en masse. As a group, baby boomers hold more than half of US household wealth (Chart 19). They will continue to run down their wealth once they retire. However, since they will no longer be working, they will no longer contribute to national output. Continued spending against a backdrop of diminished production could be inflationary. Despite a pandemic-induced bounce, underlying productivity growth remains anemic (Chart 20). Slow productivity growth could cause aggregate supply to fall short of aggregate demand. Social stability is in peril, as exemplified by the recent dramatic increase in the US homicide rate. In the past, social instability and higher inflation have gone hand in hand (Chart 21). Perhaps most importantly, policymakers are deliberately aiming to run the economy hot. A tight labor market will eventually lift wage growth to a greater degree than what we have seen so far (Chart 22). Not only could higher wage growth push up inflation through the usual “cost-push” channel, but by boosting labor’s share of income, a tight labor market could spur aggregate demand. Chart 19Baby Boomers Have Accumulated A Lot Of Wealth
Investors Are Asking The Wrong Question About Inflation
Investors Are Asking The Wrong Question About Inflation
Chart 20Trend Productivity Growth Has Been Disappointing
Trend Productivity Growth Has Been Disappointing
Trend Productivity Growth Has Been Disappointing
Chart 21Historically, Social Unrest And Higher Inflation Move In Lock-Step
Historically, Social Unrest And Higher Inflation Move In Lock-Step
Historically, Social Unrest And Higher Inflation Move In Lock-Step
Chart 22A Tight Labor Market Eventually Bolsters Wages
A Tight Labor Market Eventually Bolsters Wages
A Tight Labor Market Eventually Bolsters Wages
Investment Implications Chart 23Positive Earnings Revisions Are At High Levels
Investors Are Asking The Wrong Question About Inflation
Investors Are Asking The Wrong Question About Inflation
The path to higher rates is lined with lower rates. The longer central banks keep interest rates below their neutral level, the more economies will overheat, and the more rates will eventually need to rise to bring inflation back down. For now, we are still in the warm-up phase to higher inflation. With long-term inflation expectations below target, central banks will be able to maintain accommodative monetary policies. This is good news for stocks, at least in the short-to-medium term. The recent wobble in equity markets has occurred despite a strong second quarter earnings season. According to the latest available data from I/B/E/S, 90% of S&P 500 companies have reported earnings above analyst expectations. Earnings have surprised on the upside by an average of 19.2%, compared to a historical average of 3.9%. Positive earnings revisions are at record high levels (Chart 23). Full year 2021 S&P 500 EPS estimates have risen 16% since the start of the year. Analysts have also raised their estimates for 2022 and 2023 (Chart 24). We continue to recommend that asset allocators favor stocks over bonds over a 12-month horizon. Chart 24Analysts Have Been Revising Up Earnings Estimates This Year
Analysts Have Been Revising Up Earnings Estimates This Year
Analysts Have Been Revising Up Earnings Estimates This Year
Chart 25The Gains Of Recent Winners Have Not Been Fully Mirrored In Relative Earnings Growth
The Gains Of Recent Winners Have Not Been Fully Mirrored In Relative Earnings Growth
The Gains Of Recent Winners Have Not Been Fully Mirrored In Relative Earnings Growth
Chart 26Bank Shares Thrive In A Rising Yield Environment
Bank Shares Thrive In A Rising Yield Environment
Bank Shares Thrive In A Rising Yield Environment
Tech stocks have outperformed the broader market over the past seven weeks. However, unlike during the pandemic, 12-month forward EPS estimates for tech have not risen in relation to other sectors (Chart 25). As long-term bond yields move back up, tech shares will underperform. In contrast, banks will benefit from higher yields (Chart 26). Along the same lines, US stocks have outpaced other stock markets by more than one would have expected based on relative EPS trends. Notably, EM earnings have moved sideways versus the US since mid-2019. Yet, US stocks have outperformed EM by 17% over this period. Today, the forward P/E ratio for EM stands at 13.8, compared to 22.1 for the US (Chart 27). The combination of a weaker US dollar, faster sequential Chinese growth, increased vaccine supplies, and favorable valuations should all help EM stocks later this year. Go long the Vanguard FTSE Emerging Markets ETF (VWO) versus the Vanguard S&P 500 ETF (VOO). Peter Berezin Chief Global Strategist pberezin@bcaresearch.com Chart 27Wide Valuation Gap Between US And Non-US Markets
Wide Valuation Gap Between US And Non-US Markets
Wide Valuation Gap Between US And Non-US Markets
Footnotes 1 The Federal Reserve targets an average inflation rate of 2% for the personal consumption expenditures (PCE) index. The TIPS breakeven is based on the CPI index. Due to compositional differences between the two indices, CPI inflation has historically averaged 30-to-50 basis points higher than PCE inflation. This is why the Fed effectively targets a CPI inflation rate of about 2.3%-to-2.5%. Global Investment Strategy View Matrix
Investors Are Asking The Wrong Question About Inflation
Investors Are Asking The Wrong Question About Inflation
Special Trade Recommendations
Investors Are Asking The Wrong Question About Inflation
Investors Are Asking The Wrong Question About Inflation
Current MacroQuant Model Scores
Investors Are Asking The Wrong Question About Inflation
Investors Are Asking The Wrong Question About Inflation
Highlights The Delta variant will continue causing jitters but there is much greater evidence today than there was in early 2020 that humanity can curb the virus, both with vaccines and government stimulus. Delta jitters will reinforce the Fed’s dovishness and will, if anything, increase the odds that President Biden passes his mammoth spending package this fall. The very near term could easily see more volatility but by the end of the year the reflationary cast of global policy will have won the day. Tax hikes and rate hikes lurk beyond 2021. There is still no stabilization in US-China policy and the US and its allies have called out China for cyber aggression, signaling a new front of open competition. A cyber event is one of the leading contenders for the next negative shock to the global economy. Structural factors strongly support rising concerns among the global elite about cyber insecurity. Stick to this year’s key themes and views: long gold, long value over growth, long international stocks, long Mexico, long aerospace and defense, and short emerging market “strongmen” regimes. Feature Global equities sank and rose over the past week as investors struggled with “peak growth” in the US and China, the prospect of monetary policy normalization, and other risks on the horizon, including immediate concerns over the Delta variant of COVID-19. The rapid rebound, including for cyclicals like European stocks, suggested that investors are still buying the dip given a very supportive macro and policy backdrop (Chart 1). The BCA House View consists of accommodative policy, economic recovery, a weakening dollar, and the outperformance of cyclical risk assets. We largely agree, with the caveat that there will be “No Return To Normalcy” in the geopolitical realm. Meaning that over the medium and long term the US dollar will remain firmer than expected and cyclical economies and sectors will face headwinds. Chart 1Equity Market Hits Wall Of Worry
Equity Market Hits Wall Of Worry
Equity Market Hits Wall Of Worry
The pandemic will have unforeseen consequences, such as social unrest and regime failures, while China’s secular slowdown and the Great Power competition between the US and its rivals will intensify. Not only is China slowing but also President Joe Biden has been confirmed as a China hawk, coopting President Trump’s aggressive stance and courting US allies to pile the pressure on Beijing. For most of this year the “normalcy” narrative has prevailed. Now investors are becoming fearful of the “abnormalcy” narrative. The US dollar has surprised its doubters on the basis of relative growth and interest rate differentials (Chart 2). Chart 2Dollar Remains Firm, Reflation Indicator Abates
Dollar Remains Firm, Reflation Indicator Abates
Dollar Remains Firm, Reflation Indicator Abates
Over the next six months, the key point is that until these geopolitical risks boil over and explode, they reinforce the bullish macro view, since government spending will surge to address national challenges. The rich democracies have awoken to the threat posed by malaise at home and autocracy abroad. They have reactivated fiscal policy to rebuild their states and expand the social safety net. They are increasing investments in infrastructure, renewables, and defense. This trend is especially positive for US allied economies, global manufacturers ex-China, commodity prices, and commodity producing emerging markets, at least until the next shock erupts. We discuss the risk of a cyber shock as well as the points above in this report. Policy Responses To The Delta Variant The Delta variant began in India and has now swept the world. So far the variants respond to COVID vaccines, which are being rolled out globally. National and local political leaders will promote vaccination campaigns first – only if hospital systems are clogged will they resort to social restrictions. New infections have risen much faster than hospitalizations and deaths, although the latter are lagging indicators and will eventually follow cases (Chart 3). But financial markets will largely look past the scare, as they looked past the various waves of the original virus over the past 15 months. Today investors have greater evidence of humanity’s ability to curb the virus and can expect government spending to tide over the economy if new restrictions are necessary. New social restrictions should not be ruled out. They are not politically impossible. Public opinion in the developed countries shows that about 77% of people believe restrictions were about right or should have been tighter, while only 23% believe there should have been fewer restrictions (Chart 4). About 40% of Germans oppose the lifting of restrictions even for the vaccinated! Chart 3Delta Variant: A Limited Risk Unless Hospitals Clog
Delta Variant: A Limited Risk Unless Hospitals Clog
Delta Variant: A Limited Risk Unless Hospitals Clog
Chart 4ANew Lockdowns Not Impossible
Stay The Course (But Gird For Cyber War)
Stay The Course (But Gird For Cyber War)
Chart 4BNew Lockdowns Not Impossible
Stay The Course (But Gird For Cyber War)
Stay The Course (But Gird For Cyber War)
Any financial or economic distress from virus variants will reinforce ultra-accommodative monetary policy. The European Central Bank adopted a symmetric inflation target of 2% as it completed its strategic review, up from a previous goal which simply aimed at inflation just under 2%. It is likely to expand rather than taper asset purchases (Chart 5). At the Fed, the balance of power between hawks and doves on the Federal Open Market Committee reflects the political and geopolitical trends of the day. In the wake of the Great Recession, the doves overwhelmed the hawks (Chart 6). The institution has fully transitioned today – it now aims to generate an inflation overshoot – and it will not jeopardize its new average inflation targeting regime by tightening policy too soon this year or next. Chart 5Central Banks Will Delay Normalization If COVID Crisis Persists
Central Banks Will Delay Normalization If COVID Crisis Persists
Central Banks Will Delay Normalization If COVID Crisis Persists
Chart 6Doves Firmly In Ascendancy At Federal Reserve
Stay The Course (But Gird For Cyber War)
Stay The Course (But Gird For Cyber War)
The Delta variant makes it more likely that governments will increase fiscal support. The European Union’s Recovery Fund has a modest impact but the EU Commission is not patrolling budget deficits anymore, in the event that new social restrictions set back the recovery. The Democratic Party will pass President Biden’s $3.5-$4.1 trillion American Jobs and Families Plan through Congress by Christmas (with a net deficit increase of $1.3-$2.5 trillion over eight years). Support rates among independents and Democrats suggest Biden will come up with the votes (Chart 7). A renewed sense of crisis will compel any straggling senators. Chart 7ADelta Variant Makes Biden Stimulus Even More Likely To Pass
Stay The Course (But Gird For Cyber War)
Stay The Course (But Gird For Cyber War)
Chart 7BDelta Variant Makes Biden Stimulus Even More Likely To Pass
Stay The Course (But Gird For Cyber War)
Stay The Course (But Gird For Cyber War)
Markets will cheer more government spending as they have done throughout the vast surge in budget deficits across the world, not least in the developed markets, where austerity stunted the recovery in the wake of the Great Recession (Chart 8). Beyond Delta jitters and reactive stimulus, there are clouds forming on the horizon over the medium and long term. Budget deficits will start contracting, central banks will start hiking rates, and taxes will go up (and not only in the US). Geopolitical risks that are suppressed today will erupt later. Bottom Line: The very near term could easily see more volatility but by the end of the year the reflationary cast of global economic policy will have won the day. The bigger problems come clearly into review after the ink dries on the last installment of the great Biden budget blowout. Chart 8Market Will Cheer Another Round Of Government Spending
Market Will Cheer Another Round Of Government Spending
Market Will Cheer Another Round Of Government Spending
China Policy And Cyber War What might the next major negative shock be? A leading candidate is China, with its confluence of internal and external risks. China’s policymakers opened the floodgates of credit-and-fiscal stimulus to combat the global pandemic in 2020. They quickly shifted to tightening policy to prevent destabilizing asset bubbles. Now they are easing again. Stimulus and growth have both peaked. Authorities are on the verge of overtightening policy but tactical shifts in economic policy often occur in July. Right on cue the State Council ordered across-the-board cuts to bank reserve requirements on July 9. The Politburo’s July meeting on economic policy will bring an even more important policy signal. The concrete impact of the RRR cut should not be overstated. China has been lowering RRRs since late 2011 as its broad money growth has continually declined. The trend is indicative of China’s secular slowdown. A new series of RRR cuts is often attended by a global equity selloff (Chart 9). Chart 9China Blinked - But One RRR Cut Will Not Prevent A Global Selloff
China Blinked - But One RRR Cut Will Not Prevent A Global Selloff
China Blinked - But One RRR Cut Will Not Prevent A Global Selloff
Our China Investment Strategy highlights that policy remains restrictive in other areas. Local governments have been told not to borrow if they have hidden debts. Moreover the crackdown on China’s tech sector also continues apace. These regulatory crackdowns are characteristic of the Xi Jinping administration and can continue for a while as it further consolidates power in advance of the twentieth National Party Congress in fall 2022. The US-China conflict is getting worse. The Biden administration took several punitive actions over the past month. It warned businesses against investing in Hong Kong and Xinjiang. It rejected a restart of the strategic and economic dialogue. While a bilateral summit between Biden and Xi Jinping is possible on October 30-31, it is not yet scheduled and would only temporarily improve relations. One of Biden’s more significant recent moves was to orchestrate a joint statement with allies condemning China for aggressive behavior in cyber space.1 A massive cyber attack should be high up on any investor’s list of “gray rhino” events (high-probability, high-impact events). The world has suffered large shocks from global terrorism, financial crisis, and pandemic. Lightning rarely strikes the same place twice. Of course, nobody knows what will cause the next upset. But a devastating cyber event has been underrated in the investment community and that is changing (Table 1). Fed Chair Powell, asked by a reporter what was the chief risk to the global financial system, said “cyber risk.” To quote in full: So you would worry about a cyber event. That's something that many, many government agencies, including the Fed and all large private businesses and all large private financial companies in particular, monitor very carefully, invest heavily in. And that's really where the risk I would say is now, rather than something that looked like the global financial crisis.2 Table 1Cyber Event Underrated In Consensus View Of Global Risks
Stay The Course (But Gird For Cyber War)
Stay The Course (But Gird For Cyber War)
Here are six structural reasons that cyber risk will continue to escalate: Cyber space is one of the truly ungoverned spaces. The US is the preponderant power in cyber space, as elsewhere, but there is no regular order or code of conduct. The US cyber bureaucracy is decentralized and uncoordinated while its opponents are centrally commanded, aggressive, and sophisticated. Great power competition is escalating. The US is struggling with China, Russia, and Iran and all sides seek to intimidate enemies and gain allies. Cyber capabilities enhance essential tasks like spying, sabotage, and information warfare. The tech race is intensifying, with companies and governments investing heavily in innovation and industry, while US export controls exacerbate China’s frantic efforts to obtain advanced tech by any means. The pandemic boosted digital dependency across industry and commerce, creating a “perfect storm” for cyber attacks and hacking.3 The US and its allies are threatening to retaliate more actively against cyber attacks, which may initially lead to an increase in the total number of attacks. In addition, Israel will need to sabotage Iran’s nuclear program if it is not halted by diplomacy. The US is polarized and war-weary yet claiming greater commitment to its allies, a paradox that encourages foreign rivals to use cyber tools to foment US divisions; strike at regional opponents that lack US security guarantees; and test the US commitment to its allies. The current US-Russia negotiations toward a truce against cyber attacks on critical infrastructure are the sole example of a potential structural improvement. The US and Russia could conceivably lay down some rules of the road in cyber space. There may be a basis for an agreement in that already this year the US refrained from blocking the Nordstream II pipeline with Germany while Russia refrained from re-invading Ukraine. However, a Russo-American truce would not dispel the risk of a global cyber surprise. It could even increase the odds. Russia this year alone showed with the Colonial Pipeline hack and the JBS meat-packing hack that its proxies can disrupt critical US infrastructure. It would make sense to agree to a truce so that the US does not demonstrate the same capability against Russia. Even without a truce, Russia does not benefit from provoking massive US cyber attacks. The US is the world’s leading cyber power and has pledged that it will retaliate. Rather Russia will concentrate its efforts closer to home: suppressing dissent, intimidating the former Soviet Union, and testing the US’s willingness to defend its allies. It would be useful for Russia to use cyber attacks to undermine NATO unity and demonstrate that the US is reluctant to defend NATO members’ critical infrastructure. Remember the cyber strike against Estonia in 2007. Hence huge shocks could still emerge in Europe or elsewhere even if the US and Russia make a ceasefire regarding their own critical infrastructure. The same can be said for China, Iran, and North Korea. Attacks in their neighborhood are even more likely than direct provocations against the United States now that the US is threatening graver consequences. Beijing is concentrating its cyber power on technological acquisition. But it will also try to intimidate its neighbors into neutrality and test America’s commitment to its allies. This applies to markets like Taiwan, South Korea, the Philippines, and Vietnam. Not all cyber attacks would cause a global shock but the danger of Biden’s emphasis on alliances and multilateralism is that the US will be tested and its commitments will expand. Local cyber attacks could escalate if the US believes it must prove its resolve. Bottom Line: Cyber firms’ share prices have risen since we made our contrarian buy call back in March. True, fundamentals are poor despite the strong geopolitical tailwind. The BCA Equity Analyzer shows that valuations, debt, liquidity, and return on equity have deteriorated relative to the global large cap equity universe (Chart 10). Still, as long as liquidity is ample and geopolitical risk is high we expect cyber firms’ share prices to keep grinding upward. Chart 10Cyber Stocks: Poor Fundamentals But Geopolitics A Secular Driver
Stay The Course (But Gird For Cyber War)
Stay The Course (But Gird For Cyber War)
Investment Takeaways We are sticking with our key themes and views: long gold; long value over growth; long DM-ex-US stocks such as FTSE100 (Chart 11) and European industrials; long US neighbors Mexico and Canada; long defense and cyber stocks; and short the assets of emerging market “strongman” regimes from China and Russia to Brazil, Turkey, and the Philippines. Taking several of our trade recommendations alongside the copper-to-gold ratio, a key measure of global reflation, there could be more near-term downside (Chart 12). Nevertheless these are strategic trades designed to bear rewards over 12 months and beyond. Mainland Chinese investors should book gains on long Chinese 10-year government bonds. We would not rule out a bigger bond rally later given China’s risks at home and abroad, but RRR cuts often lead to a selloff and the signal is that the socialist policy “put” remains in place. Book gains on long Italian / short Spanish equities. This tactical trade is now hitting the top of its range and will likely mean revert. We are still optimistic on European stocks and the euro as a whole and view the German election as a positive catalyst almost regardless of outcome. Chart 11Stay The Course: Long Value Over Growth
Stay The Course: Long Value Over Growth
Stay The Course: Long Value Over Growth
Matt Gertken Vice President Geopolitical Strategy mattg@bcaresearch.com Chart 12Stick To Cyclical Trades Over Near-Term Volatility
Stick To Cyclical Trades Over Near-Term Volatility
Stick To Cyclical Trades Over Near-Term Volatility
Footnotes 1 White House, “The United States, Joined by Allies and Partners, Attributes Malicious Cyber Activity and Irresponsible State Behavior to the People’s Republic of China,” July 19, 2021, whitehouse.gov. 2 “Jerome Powell: Full 2021 60 Minutes Interview Transcript,” CBS News, April 11, 2021, cbsnews.com. 3 Connor Fairman, “2020: Cybercrime’s Perfect Storm,” Council on Foreign Relations, January 20, 2021, cfr.org.

Weekly Performance Update For the week ending Thu Jul 22, 2021 The Market Monitor displays the trailing 1-quarter performance of strategies based around the BCA Score. For each region, we construct an equal-weighted, monthly rebalanced portfolio consisting of the top 3 stocks per sector and compare it with the regional benchmark. For each portfolio, we show the weekly performance of individual holdings in the Top Contributors/Detractors table. In addition, the Top Prospects table shows the holdings that currently have the highest BCA Score within the portfolio. For more details, click the region headers below to be redirected to the full historical backtest for the strategy. BCA US Portfolio
Market Monitor (Jul 22, 2021)
Market Monitor (Jul 22, 2021)
Total Weekly Return BCA US Portfolio S&P500 TRI 0.37% 0.18% Top Contributors AN:US IPG:US JLL:US DELL:US ESGR:US Weekly Return 42 bps 19 bps 12 bps 7 bps 6 bps Top Detractors SIG:US LPX:US FLO:US MTZ:US PEG:US Weekly Return -13 bps -9 bps -8 bps -6 bps -5 bps Top Prospects TX:US MPLX:US BRK.A:US ESGR:US ANAT:US BCA Score 97.25% 95.16% 95.13% 93.88% 91.26% BCA Canada Portfolio
Market Monitor (Jul 22, 2021)
Market Monitor (Jul 22, 2021)
Total Weekly Return BCA Canada Portfolio S&P/TSX TRI -0.95% -0.42% Top Contributors ONEX:CA RCH:CA QBR.A:CA SMU.UN:CA TCL.A:CA Weekly Return 13 bps 12 bps 6 bps 6 bps 3 bps Top Detractors IFP:CA CS:CA CFP:CA CRON:CA CNQ:CA Weekly Return -25 bps -21 bps -15 bps -13 bps -10 bps Top Prospects LNF:CA CS:CA IFP:CA CFP:CA ELF:CA BCA Score 98.98% 98.62% 98.50% 96.76% 93.76% BCA UK Portfolio
Market Monitor (Jul 22, 2021)
Market Monitor (Jul 22, 2021)
Total Weekly Return BCA UK Portfolio FTSE 100 TRI 0.73% -0.61% Top Contributors FDEV:GB FDM:GB HFD:GB SVST:GB GLTR:GB Weekly Return 42 bps 26 bps 12 bps 12 bps 10 bps Top Detractors SPI:GB RMG:GB TUNE:GB CMCX:GB MNOD:GB Weekly Return -18 bps -11 bps -10 bps -9 bps -8 bps Top Prospects SVST:GB ROSN:GB GROW:GB NLMK:GB RMG:GB BCA Score 99.11% 96.58% 95.14% 93.80% 93.56% BCA Eurozone Portfolio
Market Monitor (Jul 22, 2021)
Market Monitor (Jul 22, 2021)
Total Weekly Return BCA EMU Portfolio MSCI EMU TRI 0.22% 0.25% Top Contributors CNV:FR MONT:BE REY:IT PHA:FR ROVI:ES Weekly Return 20 bps 16 bps 10 bps 9 bps 8 bps Top Detractors ATS:AT RWAY:IT LOUP:FR PMAG:AT SON:PT Weekly Return -12 bps -11 bps -9 bps -7 bps -7 bps Top Prospects STR:AT TESB:BE SOLV:BE BB:FR FDJ:FR BCA Score 99.74% 97.33% 96.76% 96.66% 96.57% BCA Japan Portfolio
Market Monitor (Jul 22, 2021)
Market Monitor (Jul 22, 2021)
Total Weekly Return BCA Japan Portfolio TOPIX TRI -0.77% -1.81% Top Contributors 7593:JP 8117:JP 6960:JP 6413:JP 3459:JP Weekly Return 8 bps 7 bps 6 bps 4 bps 4 bps Top Detractors 5021:JP 5020:JP 3291:JP 7994:JP 6641:JP Weekly Return -19 bps -14 bps -13 bps -12 bps -12 bps Top Prospects 4966:JP 6960:JP 9436:JP 6641:JP 8117:JP BCA Score 99.72% 99.39% 99.01% 98.49% 98.41% BCA Hong Kong Portfolio
Image
Total Weekly Return BCA Hong Kong Portfolio Hang Seng TRI -0.77% -0.97% Top Contributors 215:HK 2380:HK 316:HK 990:HK 323:HK Weekly Return 30 bps 26 bps 14 bps 12 bps 11 bps Top Detractors 220:HK 3600:HK 468:HK 856:HK 2232:HK Weekly Return -29 bps -25 bps -24 bps -22 bps -19 bps Top Prospects 1277:HK 2232:HK 857:HK 1606:HK 990:HK BCA Score 99.81% 99.47% 99.25% 98.76% 98.51% BCA Australia Portfolio
Market Monitor (Jul 22, 2021)
Market Monitor (Jul 22, 2021)
Total Weekly Return BCA Australia Portfolio S&P/ASX All Ord. TRI 0.10% 0.56% Top Contributors NEC:AU RUL:AU JLG:AU SGF:AU GRR:AU Weekly Return 22 bps 17 bps 16 bps 15 bps 12 bps Top Detractors AGI:AU FLN:AU BLX:AU DDR:AU PSQ:AU Weekly Return -47 bps -12 bps -8 bps -8 bps -8 bps Top Prospects GRR:AU BFG:AU PIC:AU BLX:AU SOL:AU BCA Score 99.09% 98.31% 97.86% 97.46% 97.33%

BCA Research’s Counterpoint service observes that over the past three years the US dollar has almost perfectly tracked the performance of bonds versus equities, proving that the main driver for dollar demand is (defensive) portfolio flows. This is because,…
Feature June’s economic data and second-quarter GDP indicate that China’s economic recovery may have peaked. Slight improvements in some sectors, including manufacturing investment, exports and consumption, were offset by slowing in China’s old economy, such as infrastructure and real estate. A softening economy will weigh on Chinese corporate profits in 2H21. Inflation in Producer Price Index (PPI) has likely peaked, but it remains far above its historic average. Downstream industries may benefit from low interest rates and slightly less inflationary pressures on input prices, however, their profit growth has rolled over given weakening domestic demand and base effect. Industrial profits will shift downward in 2H21, meanwhile China’s macro policy will probably disappoint investors. Last week’s GDP’s numbers show that small-to-medium enterprises (SMEs) and private-sector businesses bore the brunt of rising global commodity prices and a slow recovery in domestic household consumption and services. The data, coupled with recent policy moves, support our view that China’s leadership is focused on helping vulnerable segments of the economy rather than boosting domestic demand by broadly easing policies (Chart 1). Nonetheless, the authorities may resort to easing policy later in 2021 if export growth weakens significantly in the second half of the year. A series of Reserve Requirement Ratio (RRR) and/or interest rate cuts, increased infrastructure project approvals, and/or looser real estate regulations, will signal that China’s ongoing policy tightening cycle has ended. In recent weeks both Chinese onshore and offshore stocks slipped further in absolute terms and relative to global benchmarks (Chart 2). We continue to recommend that investors remain cautious on Chinese stocks, at least through Q3. Chart 1No Broad Easing Yet
No Broad Easing Yet
No Broad Easing Yet
Chart 2Investors Still Cautious On China's Economy And Policy
Investors Still Cautious On China's Economy And Policy
Investors Still Cautious On China's Economy And Policy
Qingyun Xu, CFA Associate Editor qingyunx@bcaresearch.com Jing Sima China Strategist jings@bcaresearch.com Q2 GDP: Recovering At A Slower Pace China’s official GDP growth, on a year-over-year basis, slowed to 7.9% in Q2 from 18.3% in Q1 (Chart 3, top panel). While Q2’s weaker reading reflects the base effect in the data, it was slightly below the market’s expectation of 8.0-8.5%. Moreover, on a sequential basis (quarter-over-quarter), Q2’s seasonally adjusted GDP growth was one of the slowest in the past decade (Chart 3, bottom panel). These figures and the underlying data highlight that China’s economic growth momentum, which historically lags the credit impulse by six to nine months, has peaked (Chart 4). However, in 1H21, China aggregate output still grew by a 5.5% average annual rate during the same period over the past two years, well within Chinese policymakers’ target of above 5% growth needed to maintain a stable economy. Meanwhile, the bifurcation in China’s economic recovery continues. While robust external demand for Chinese goods helped to underpin manufacturing output, the sector’s profit growth has lagged upstream industries. Moreover, state-owned enterprises (SOEs) are experiencing soaring profit growth whereas SMEs have struggled with rising global commodity prices and sluggish domestic consumption as discussed below. We expect that the pace in credit growth deceleration will moderate in 2H21 and interest rates will stay at historically low levels. However, the authorities are unlikely to loosen macro policies until more signs of economic weaknesses emerge. Chart 3Q2 GDP: Slowing From An Elevated Level
Q2 GDP: Slowing From An Elevated Level
Q2 GDP: Slowing From An Elevated Level
Chart 4Chinese Economic Growth Should Soften Further In 2H21
Chinese Economic Growth Should Soften Further In 2H21
Chinese Economic Growth Should Soften Further In 2H21
Robust Exports, Sluggish Manufacturing Investment Chart 5Subdued Manufacturing Investment Recovery Despite Robust Exports
Subdued Manufacturing Investment Recovery Despite Robust Exports
Subdued Manufacturing Investment Recovery Despite Robust Exports
China’s export growth in June beat market expectations, despite shipping disruptions at major ports in Guangdong province due to a resurgence in COVID-19 cases. However, the recovery in manufacturing investment was muted through most of 1H21 even though export growth was resilient (Chart 5). There are several reasons for the sluggish recovery: the RMB’s rapid appreciation in the first five months of 2021, rising inflation and the limited pricing power that Chinese exporters gained in the first half of the year likely impeded their profits and curbed their propensity to invest (Chart 6). Total export values in USD significantly outpaced those in RMB terms, suggesting that the profit gains by Chinese exporters were offset by the strengthening local currency (Chart 7). Chart 6Rapid RMB Appreciation Will Weigh On Industrial Profits
Rapid RMB Appreciation Will Weigh On Industrial Profits
Rapid RMB Appreciation Will Weigh On Industrial Profits
Chart 7Divergence Between Exports In USD versus RMB
Divergence Between Exports In USD versus RMB
Divergence Between Exports In USD versus RMB
Furthermore, manufacturers in mid-to-downstream industries have been unable to fully pass on rising input costs to domestic consumers, which is evidenced in the faster growth of manufacturing output volume compared with price increases. It contrasts with the previous inflationary cycles, where surging prices for manufactured goods surpassed output volume (Chart 8A & 8B). Chart 8AChina's Manufacturing Recovery: Stronger Volume Than Prices
China's Manufacturing Recovery: Stronger Volume Than Prices
China's Manufacturing Recovery: Stronger Volume Than Prices
Chart 8BMuted Profit Margin Recovery In Manufacturing Compared With Mining
Muted Profit Margin Recovery In Manufacturing Compared With Mining
Muted Profit Margin Recovery In Manufacturing Compared With Mining
June’s improvement in manufacturing investment may not advance into 2H21 without added policy support. The nearly 2% depreciation in the RMB against the dollar in recent weeks will alleviate some pressure on exporters’ profit margins. However, export prices in USD also started to weaken (Chart 9). In addition, June’s manufacturing PMI and a Chinese business school survey,1 reported a deterioration in business conditions among smaller businesses. The weaker sentiment will depress manufacturing investments since China’s manufacturing sector is dominated by private and smaller businesses (Chart 10). Chart 9Chinese Export Prices In USD Are Rolling Over
Chinese Export Prices In USD Are Rolling Over
Chinese Export Prices In USD Are Rolling Over
Chart 10Deteriorating Business Sentiment Will Depress Manufacturing Investments
Deteriorating Business Sentiment Will Depress Manufacturing Investments
Deteriorating Business Sentiment Will Depress Manufacturing Investments
Recent policy measures to keep a low interest-rate environment will help the export and manufacturing sectors by reducing operating costs. The measures are also in keeping with China’s shift from boosting its service sector to maintaining a steady share of manufacturing output in its domestic economy (Chart 11). Chart 11Maintaining A Steady Share Of Manufacturing Output In China's Economy
Maintaining A Steady Share Of Manufacturing Output In China's Economy
Maintaining A Steady Share Of Manufacturing Output In China's Economy
Policy Tightening In The Old Economy Continues Chart 12Investments In Real Estate Have Lost Steam
Investments In Real Estate Have Lost Steam
Investments In Real Estate Have Lost Steam
Infrastructure investment growth slowed further in June. Investments in real estate, which drove China’s economic recovery in the second half of 2020, are also losing momentum (Chart 12). The slowdown, engineered by policymakers, will likely endure for the rest of the year. Bank loans to real estate developers tumbled to a cyclical low (Chart 13). In addition, deposit and advance payments, the main source of funds for real estate projects, nose-dived along with home sales (Chart 14). Chart 13No Signs Of Looser Financing Regulations In Property Sector
No Signs Of Looser Financing Regulations In Property Sector
No Signs Of Looser Financing Regulations In Property Sector
Chart 14Falling Home Sales Will Further Depress Real Estate Investments
Falling Home Sales Will Further Depress Real Estate Investments
Falling Home Sales Will Further Depress Real Estate Investments
Chart 15Sharp Pullback In New Infrastructure Project Approvals This Year
Sharp Pullback In New Infrastructure Project Approvals This Year
Sharp Pullback In New Infrastructure Project Approvals This Year
Infrastructure project approvals by the Ministry of Finance remain on a downward trend (Chart 15). Last week, China’s Banking and Insurance Regulatory Commission (CBIRC) announced a new rule to stop financial institutions from lending to local government financing vehicles (LGFV) that hold off-balance sheet government debt. LGFVs are largely used by provincial governments to borrow from banks to help fund infrastructure projects. Regulations targeting the real estate sector will further dampen real estate investments in the second half of this year. Land purchases and housing starts, both leading indicators for real estate investment, have declined since February. Excavator sales and investment in construction equipment also deteriorated sharply (Chart 16). Given that housing prices remain elevated, we do not expect real estate regulations to shift to an easier tone. The deceleration in China’s old economy is reflected in imports. While the value of imports remains strong, the volume has slowed, which suggests that the surge was due to soaring commodity prices (Chart 17, top panel). In particular, the growth in China’s imports of copper and steel, on a year-over-year basis and in volume terms, contracted in June (Chart 17, bottom panel). Chart 16Construction Activities Set To Slow Further
Construction Activities Set To Slow Further
Construction Activities Set To Slow Further
Chart 17Falling Import Volume
Falling Import Volume
Falling Import Volume
The Key To A Consumption Recovery Retail sales picked up slightly in June following two consecutive months of decline. However, retail sales remain below their pre-pandemic level (Chart 18). Labor market dynamics and household income growth, which stayed sluggish through 1H21, hold the key to the speed and magnitude of a recovery in consumption this year (Chart 19). Chart 18Sluggish Recovery In Household Consumption
Sluggish Recovery In Household Consumption
Sluggish Recovery In Household Consumption
Chart 19A Lackluster Consumption Recovery Due To Slow Recovery in Household Income
A Lackluster Consumption Recovery Due To Slow Recovery in Household Income
A Lackluster Consumption Recovery Due To Slow Recovery in Household Income
Household precautionary savings, which remain elevated compared with their historical norms, have depressed the propensity to spend (Chart 20). While the overall unemployment rate in China’s urban centers has steadily declined this year, the rate of jobless young graduates (ages 16-24) picked up and is nearly three percentage points higher than its historical mean (Chart 21). However, the high unemployment among graduates will not encourage policymakers to stimulate the economy. The number of new graduates in both 2020 and 2021 is larger than the historical average, while the growth in new job creation has nearly recovered to that of the pre-pandemic years (Chart 22). Chart 20Households' Propensity For Precautionary Savings Remains Elevated
Households' Propensity For Precautionary Savings Remains Elevated
Households' Propensity For Precautionary Savings Remains Elevated
Chart 21Rising Unemployment Rate Among Younger Workers
Rising Unemployment Rate Among Younger Workers
Rising Unemployment Rate Among Younger Workers
Moreover, labor market slack among young graduates seems to be concentrated in the services sector, and this sector’s improvement is dependent on China’s domestic pandemic situation and inoculation rates rather than on stimulus (Chart 23). Chart 22Urban Job Creation Growth Still On The Mend
Urban Job Creation Growth Still On The Mend
Urban Job Creation Growth Still On The Mend
Chart 23Interruptions In Service Sector Recovery Due To Lingering COVID Cases
Interruptions In Service Sector Recovery Due To Lingering COVID Cases
Interruptions In Service Sector Recovery Due To Lingering COVID Cases
Elevated Inflation, Downshifting Industrial Profits Chart 24China's PPI May Have Reached A Cyclical Peak...
China's PPI May Have Reached A Cyclical Peak...
China's PPI May Have Reached A Cyclical Peak...
China’s domestic inflationary pressures eased slightly in June with a small decline in both consumer and producer prices. The input price component of the manufacturing PMI, which normally leads the PPI by about three months, dropped sharply last month, which indicates that the PPI may have reached its cyclical peak (Chart 24). However, producer price inflation will likely remain elevated in the second half of the year. Although global industrial metal prices have rolled over since May, they remain at their highest level since 2011 (Chart 25). A rapid deceleration in Chinese credit growth and weakening demand in 2H21 will remove some pressure in the sizzling hot commodity market, but global supply-side constraints will limit the downside in raw material prices, at least through the next six months. Therefore, diminishing inflationary pressures on the PPI will only slightly reduce input costs for China’s mid-to- downstream manufacturers, which have been unable to pass on rising commodity prices to domestic consumers (Chart 26). As discussed earlier, Chinese export prices in both USD and RMB terms have also rolled over. Chart 25...But Global Commodity Prices Are Still Elevated
...But Global Commodity Prices Are Still Elevated
...But Global Commodity Prices Are Still Elevated
Chart 26Absence Of Inflation Pass-Through
Absence Of Inflation Pass-Through
Absence Of Inflation Pass-Through
Given that price changes are more important to corporate profits than volume changes, Chinese mid-to-downstream industries will continue to face downward pressure on their profit margins. Profit growth in mid-to-downstream industries consistently lagged their upstream counterparts in the past 12 months (Chart 27). Moreover, state-holding enterprises, which dominate upstream industries, have seen a 150% jump in profit growth from a year ago, while the rate of profit gains among privately owned industrial companies tumbled this year (Chart 28). Chart 27A Faster Mean Reversal In Profit Growth Among Private Companies
Taking The Pulse Of China’s Slowing Economy
Taking The Pulse Of China’s Slowing Economy
Chart 28A Faster Mean Reversal In Profit Growth Among Private Companies
A Faster Mean Reversal In Profit Growth Among Private Companies
A Faster Mean Reversal In Profit Growth Among Private Companies
Chinese policymakers will probably focus on addressing imbalances in China’s industrial sector and economy by supporting SMEs and the private sector. Meanwhile, industrial profit growth will decline in 2H21 from its V-shaped recovery last year, given weakening domestic demand and the waning base effect. Table 1China Macro Data Summary
Taking The Pulse Of China’s Slowing Economy
Taking The Pulse Of China’s Slowing Economy
Table 2China Financial Market Performance Summary
Taking The Pulse Of China’s Slowing Economy
Taking The Pulse Of China’s Slowing Economy
Footnotes 1The CKGSB (Cheung Kong Graduate School Of Business) Business Conditions Index (BCI) comprises four sub-indices: corporate sales, corporate profits, corporate financing environment and inventory levels. Equity Sector Recommendations Cyclical Investment Stance
Highlights Metals prices are likely to suffer in the short term on the back of weakening Chinese demand and fading inflationary pressures. Accordingly, in our most recent Global Asset Allocation (GAA) Quarterly Outlook, we downgraded the AUD to underweight against the greenback. Bond yields, globally, are bound to rise moderately over the course of the coming 12 months. Australian yields, however, are likely to rise slower than those in the US. The RBA has been explicit in communicating what it would take to adjust its policy stance and is likely to lag behind other central banks in DM. We therefore recommend investors favor Australian government bonds in a global bond portfolio. Australian equities, now dominated by Financials rather than the Materials sector, would benefit from a rise in bond yields. However, a weaker AUD and declining metal prices warrant no more than a benchmark exposure to Australian equities within a global equity portfolio. Introduction Recently, clients have often been asking about Australia. The reasons seem clear. With a potential commodities “super-cycle” driven by a shift to renewable energy and electric vehicles (EVs), both the Australian economy and equities should be in a position to benefit. The reality, however, has been much less positive. Particularly the divergence between the core driver of the Australian market, industrial metals, and the performance of both equities and the currency over the past few years has been a concern (Chart 1). Over the past year and a half, Australian equities have underperformed the MSCI ACWI by 12.4% (Chart 2, panel 1). This underperformance was mainly due to the outperformance of the US. However, even against global markets excluding the US, Australian equities did not match the rise in commodity prices – particularly industrial metals (Chart 2, panel 2). Chart 1Despite The Rise In Metals Prices...
Despite The Rise In Metals Prices...
Despite The Rise In Metals Prices...
Chart 2...Australian Equities Have Not Outperformed
...Australian Equities Have Not Outperformed
...Australian Equities Have Not Outperformed
Chart 3Financials Dominate Australian Equities
Financials Dominate Australian Equities
Financials Dominate Australian Equities
The structure of the Australian market has changed over the past few years. The commodities boom and subsequent global liquidity boom over the past two decades have fueled a housing bubble in Australia and an unsustainable rise in household debt. As a result, Australian equities are no longer dominated by metals and mining stocks, but rather by banks (Chart 3). We structured this Special Report in a Q&A format, answering questions we think are most relevant for investors to assess both the short- and long-term outlook for Australia. We aim to provide an overview of the economy and draw some conclusions on how investors should be positioned. Our conclusions are as follows: Over the past year and a half, the Australian economy has shown how complementary actions between fiscal and monetary policy, as well as social restriction measures, can mitigate both economic and human damage. The Reserve Bank of Australia (RBA) will be in no rush to adjust its policy stance until wage growth is back to its 3% target. However, RBA officials risk running the economy hot in the meantime given that measures of employment are back to their pre-pandemic levels. The RBA is not likely to change its policy stance before reaching its wage growth and inflation targets and will probably lag behind other global central banks in tightening. In that case, investors should favor Australian government bonds in a global bond portfolio. Australian banks remain well-funded and in good health. But their excessive exposure to the housing sector puts them at grave risk if home prices collapse. Despite this, there seems to be a feedback loop where a decline in mortgage rates fuels further demand for loans, pushing up home prices. A slowdown in Chinese credit growth and economic activity will hamper commodity demand, weighing down on Australian equities. The longer-term outlook remains compelling for Australian equities and metals as we enter into a new commodities “supercycle” fueled by a transition to renewable and alternative energy. The Australian economy stands to benefit given that the country has high levels of both production and reserves of the minerals needed for this transition. Q: How Does The Economy Look In The Short-Term? A: Australia can be regarded as one of the few countries that successfully navigated the pandemic with a minimal amount of damage, both to its population and economy. With swift measures to limit travel and implement social restrictions, the spread of the outbreak was curtailed to slightly over 30,000 total cases, representing only 0.12% of its population (Chart 4). On the other hand, its vaccination campaign has been much slower (at 38 doses administered per 100 people) than in other DM economies such as the US, UK, France, or Germany with 100, 120, 90, and 102 doses per 100 people, respectively. In the short term, this might not seem particularly damaging to the economy. However, if vaccination rates do not pick up rapidly, Australia’s international travel restrictions (which cannot sustainably be kept in place) will hamper economic growth and become a major drag on the tourism and education sectors (Chart 5, panels 1 & 2). Chart 4Government Policies Contained The Pandemic Outbreak...
Government Policies Contained The Pandemic Outbreak...
Government Policies Contained The Pandemic Outbreak...
Chart 5...At The Expense Of Tourism
...At The Expense Of Tourism
...At The Expense Of Tourism
Ample fiscal support – in the form of wage subsidies and business support through the JobKeeper program – mitigated the shortfall in household incomes (Chart 6). This provided a boost to both consumers and businesses with Q1 GDP growth coming in at 1.8% quarter-on-quarter (7.4% annualized). GDP expectations for the remainder of this year and next show a resilient strong momentum for Australian growth and domestic demand (Chart 7). Chart 6Fiscal Stimulus Supported Employment...
A Deeper Dive Into The Land Down Under
A Deeper Dive Into The Land Down Under
Chart 7...And Overall Growth
...And Overall Growth
...And Overall Growth
Chart 8Labor Market Back To Pre-Pandemic Levels...
Labor Market Back To Pre-Pandemic Levels...
Labor Market Back To Pre-Pandemic Levels...
The labor market recovery has been an excellent example of how fiscal support and lockdown measures complement each other. Most employment indicators have almost recovered or surpassed their pre-pandemic levels: The unemployment rate stands at 4.90%, compared to 5.13%, the underemployment rate is at 7.44%, compared to 8.60%. The total number of those employed is now above its pre-pandemic level, albeit still below the 2018-2019 growth trend (Chart 8). Q: When Will The RBA Shift Its Policy Stance? A: The RBA has been explicit in communicating that changes in its policy stance hinge on Australian wage growth rising sustainably towards 3% – a level last reached in Q1 2013. Even with economic activity mostly restored, wage growth remains low at 1.49% (Chart 9). Our belief is that until that occurs, the RBA will probably maintain its accommodative stance. Our global fixed-income strategists, in a recent report, highlighted their belief that the RBA is likely to be less hawkish than markets currently expect – on both tapering and hiking rates. We agree with that assessment. Comments by RBA Governor Lowe earlier last month back our dovish belief: He stated that “The Board is committed to maintaining highly supportive monetary conditions to support a return to full employment in Australia and inflation consistent with the target…This is unlikely to be until 2024 at the earliest”. Market expectations nevertheless remain much more hawkish – pointing to a first rate hike by mid 2022 and almost 70 basis points of hikes by 2024 (Chart 10). Chart 9...However Wage Growth Remains Muted
...However Wage Growth Remains Muted
...However Wage Growth Remains Muted
Chart 10Market Expects A Hawkish RBA...
Market Expects A Hawkish RBA
Market Expects A Hawkish RBA
Chart 11...And Is Already Pricing That Down The Curve
...And Is Already Pricing That Down The Curve
...And Is Already Pricing That Down The Curve
Chart 12Inflation Remains Well-Below The RBA's Target
Inflation Remains Well-Below The RBA's Target
Inflation Remains Well-Below The RBA's Target
This means that the RBA will probably risk running the economy hot for a while. With total employment back to its pre-pandemic level and other employment indicators closely behind, inflationary pressures, sooner or later, will begin to mount. Higher growth prospects and inflation risks are being discounted further down the curve (Chart 11). The June CPI print is likely to reflect a transitory short-term base effect and the RBA is mostly going to see through that. In the meantime, we would watch other broad inflation indicators to gauge for price pressures. Broader measures such as the trimmed-mean inflation index or median inflation remain subdued at 1.1% and 1.3%, respectively. The 10-year breakeven rate currently stands at 2.1%, within the RBA’s range of 2%-3%, highlighting the market’s belief that long-term inflation remains well under control (Chart 12). Bottom Line: The RBA is likely to maintain its dovish stance for longer than the market expects. A return to sustainable levels of wage growth and inflation will remain the top objectives and it is unlikely that policy will be reversed before they are achieved. Our global fixed-income strategists laid out a checklist of what would make the RBA turn less dovish. So far, only 1 out of 5 items on their list (the recovery in private-sector demand) signals the need for a more hawkish stance. The remaining items signal no imminent pressure on the RBA to adjust policy (Table 1). The RBA is also wary of the currency appreciating if it took a more hawkish stance ahead of other central banks (e.g., the Fed) and is therefore likely to switch policy only after other central banks do so (Chart 13). Accordingly, investors should favor Australian government bonds within a global bond portfolio. Table 1RBA Checklist
A Deeper Dive Into The Land Down Under
A Deeper Dive Into The Land Down Under
Chart 13The RBA Will Be Wary Of A Rising AUD
The RBA Will Be Wary Of A Rising AUD
The RBA Will Be Wary Of A Rising AUD
Q: Are There Signs Of Improvement In The Banking Sector? A: Headline indicators of the health of the Australian banking sector paint a picture of a well-capitalized, highly funded, and profitable industry. Return on equity (ROE) has averaged 12.1% over the past decade. Capital adequacy and Tier 1 capital ratios stand at 14.5% and 18.2%, respectively – much higher than at the start of the Global Financial Crisis (GFC). The ratio of non-performing loans remains low and Australian banks’ reliance on leverage has also decreased (Chart 14). Chart 14Banks Look Healthy...
Banks Look Healthy...
Banks Look Healthy...
Chart 15...But Remain Exposed To The Housing Sector...
...But Remain Exposed To The Housing Sector
...But Remain Exposed To The Housing Sector
However, these indicators mask a major underlying risk. Banks remain heavily exposed to the housing market, with housing loans as high as 62% of banks’ gross outstanding loans and 40% of total assets (Chart 15, panel 1). Over the past decade and a half, banks have lent an average of A$56 of housing-related loans for every A$100 in total loans (Chart 15, panel 2). Chart 16...Which Is Showing No Signs Of Slowing Down
...Which Is Showing No Signs Of Slowing Down
...Which Is Showing No Signs Of Slowing Down
Chart 17Households Remain Heavily Indebted
Households Remain Heavily Indebted
Households Remain Heavily Indebted
With interest rates falling over the past few decades, construction activity has boomed. Consequently, the demand for loans for new homes has been rising, leading home prices higher (Chart 16). This also meant that household debt levels have climbed and currently standing at a staggering 130% of GDP and 180% of disposable income (Chart 17). So what does this mean for banks’ stock prices? The short answer is that absent a bursting of the bubble in house prices, banks should continue to fare well. Interestingly, the long-standing relationship between bond yields and banks’ relative stock price returns – one that works in other financial-heavy markets such as the euro area – did not hold in Australia, at least until recently. In fact, we find that, historically, Australian banks outperformed the broad market when bond yields were falling. This relationship changed post-GFC, most likely when inflation expectations became unanchored and trended lower – reflecting lower commodity prices (Chart 18). Bottom Line: Rising rates, reflecting better growth prospects and higher long-term inflation, should be a tailwind for bank stocks in the short term. Accommodative monetary policy will spur activity in the property market, propping up bank profits. This, however, puts banks at even greater risk when profitability starts to decline, NPLs rise and regulations tighten further. The latter risk is one we would highlight following RBA deputy governor Guy Debelle’s statement that monetary policy will not be used as a tool to curtail housing prices and that there are other tools to address that issue. Chart 18Rising Yields Will Be A Tailwind For Australian Equities
Rising Yields Will Be A Tailwind For Australian Equities
Rising Yields Will Be A Tailwind For Australian Equities
Q: How Does Chinese Policy Impact Australian Growth? A: China's role in global supply chains, as both a producer and consumer, has increased dramatically since the early 2000s. China’s demand for commodities generally and industrial metals in particular has grown over the past two decades from an average of 10% of total global demand to 50% for most metals (Chart 19). Australia stood to benefit, redirecting more and more of its metals’ production away from the rest of the world and towards China. For example, during the same period, the share of Australian iron ore exports to China increased fourfold (Chart 20). Chart 19China Is A Major Consumer Of Metals...
China Is A Major Consumer Of Metals...
China Is A Major Consumer Of Metals...
Chart 20...And This Has Benefited Australia Over The Past Two Decades
...And This Has Benefited Australia Over The Past Two Decades
...And This Has Benefited Australia Over The Past Two Decades
However, this dynamic leaves the Australian economy very exposed to the Chinese business cycle – one that is heavily reliant on policymakers’ decisions on how much liquidity to inject into the economy. After strong credit and fiscal support throughout 2020, the Chinese authorities – wary of excessive leverage in the economy – have begun paring back stimulus which is likely to lead to weaker growth in the second half of the year and put downward pressure on metal demand (Chart 21). Chart 21Weakening Chinese Demand Will Hurt Metals In The Short-Term
Weakening Chinese Demand Will Hurt Metals In The Short-Term
Weakening Chinese Demand Will Hurt Metals In The Short-Term
Heightened political tensions between Australia and China have also played a role. China recently imposed restrictions, including additional tariffs and bans, on Australian imports such as beef, wine, coal, and other goods. Consequently, Australian exports to China slowed. However, the goods not imported by China were absorbed by other economies – Australian export growth did not fall that much. It is unlikely that a new commodity-heavy marginal buyer will emerge in the short-term to replace Chinese demand. The recent rise in commodity prices reflected a return to economic activity, as well as inflationary fears, and supply, shipping, and logistical backlogs. These will ease in the short term, weighing on both the AUD and Australian equities. Q: Can The Shift To Renewable Energy Spur Future Australian Growth? A: The shift to renewable energy and electrification – particularly in the transport sector – will occur sooner rather than later. Some commodity-exporting countries stand to benefit, and Australia is likely to be one. We previously highlighted that modeling longer-term demand is tricky since it relies on assumptions for the emergence of new technologies, metals’ efficiency and recycling rates, and the rate of conversion to renewables. Chart 22The Shift To Renewables Will Require More Resources...
A Deeper Dive Into The Land Down Under
A Deeper Dive Into The Land Down Under
The mechanics of the future demand/supply relationship hinge on the following: Demand will rise during this energy transition period – simply due to the fact that the new clean energy systems require more minerals (such as copper and zinc) than the current traditional hydrocarbon-fueled energy system (Chart 22, panel 1). Electric vehicles (EVs) require about four and a half times more of certain commodities – particularly copper, nickel, and graphite – than conventional vehicles do (Chart 22, panel 2). Supply limitations, on the other hand, are what might propel metal prices even higher and lead the world economy into a new commodities “supercycle”. A study by the Institute for Sustainable Futures has shown that, in the most positive energy transition scenarios, demand for some metals will exceed supply, in terms of both available resources and reserves (Table 2). Table 2...Which Are Likely To Be In Short Supply
A Deeper Dive Into The Land Down Under
A Deeper Dive Into The Land Down Under
For some of those metals, Australia is either among the top producers, or has the largest reserves. For example, Australia produces almost 45% and 12% of the world’s lithium and zinc, and has 22% and 27% of the world’s reserves. Looking at other metals, supply disruptions – particularly in economies where political, social, and environmental influences are an issue – might be the driver of further price rises. For example, Chile has the largest shares of global lithium reserves (~44%), and copper reserves (~23%), while South Africa has the largest share of global manganese reserves (~40%). Bottom Line: The transition to renewable energy is already underway and is likely to intensify. Forecast demand should outstrip supply and Australia stands to benefit given its large share of current production and/or reserves. How much will depend on the pace of renewable energy integration but miners are likely to be long-term winners. Q: What Is The Outlook For The AUD? A: The Global Asset Allocation (GAA) service, in its latest Quarterly Outlook, turned negative on the AUD. The currency has historically had a high positive correlation with commodity prices and industrial metals prices, which in turn are very sensitive to Chinese demand (Chart 23). Given our outlook for metals in the short term (falling demand driven by slowing Chinese activity), we expect some weakening in the AUD over the coming 9-to-12 months (Chart 24). Chart 23The AUD Is Highly Correlated To Metal Prices...
The AUD Is Highly Correlated To Metal Prices...
The AUD Is Highly Correlated To Metal Prices...
Chart 24...Which In Turn Are Highly Correlated To Chinese Activity
...Which In Turn Are Highly Correlated To Chinese Activity
...Which In Turn Are Highly Correlated To Chinese Activity
Additionally, short-term weakness in the economy, caused by further lockdowns as Delta-variant COVID cases rise, is a risk since it might reduce domestic demand. From a valuation perspective, the AUD is slightly below its fair value (Chart 25). However, this on its own does not compel us to remain positive on the currency. We also consider other indicators such as investor positioning – which has reached a decade high, according to Citibank’s FX Positioning Alert Indicator (PAIN) (Chart 26). This indicator suggests that active FX traders hold substantial long positions in the AUD against the USD. Historically, this indicator has provided contrarian signals, with extreme optimism (pessimism) providing useful short (long) signals. Chart 25The AUD Is Close To Fair Value
The AUD Is Close To Fair Value
The AUD Is Close To Fair Value
Chart 26Investors Are Long The AUD
Investors Are Long The AUD
Investors Are Long The AUD
Bottom Line: Short-term weakness in the economy and a reversal in metal prices warrant caution on the currency. While valuations do not signal overbought conditions, investor positioning (a contrarian indicator) does. Q: How Should Equity Investors Be Positioned? A: Our recent Special Report on whether country or sector effects drive equity performance showed that sector composition was relatively important in Australia, given the large difference in sector weightings relative to the global benchmark. Our analysis showed that cumulative Australian sector performance over the past two decades detracted from overall returns (Chart 27). Given that framework, and the relationship between the Australian economy and industrial metals, we find that Australian equity performance relative to the US mirrors the performance of global metal and mining relative to global tech stocks (Chart 28). This underperformance makes sense: Commodity prices have been in a structural downtrend throughout the past decade. Chart 27Country Vs Sector Effect
Country Vs Sector Effect
Country Vs Sector Effect
Chart 28Australia / US = Metals / Tech
Australia / US = Metals / Tech
Australia / US = Metals / Tech
Therefore, given our view of the outlook for metals, we would not want to shun Australian equities. The Global Asset Allocation (GAA) service is currently neutral the Australian market within a global equity portfolio, and underweight the Materials sector over the next 12 months. We believe this positioning makes sense given the slowdown in the Chinese economy and the improbability that another country will emerge as the alternative marginal buyer of commodities. The longer-term outlook is more compelling however, as the shift to decarbonization, renewables, and alternative energy gets underway. Conclusions In the short term metals prices are likely to suffer on the back of weakening Chinese demand (with no immediate substitute as a marginal buyer) as well as fading inflationary fears and an easing of supply/logistical issues. Our analysis shows that sector composition is a larger driver of Australian equity relative performance than country composition. While Australian equities – dominated by Financials – would benefit from a moderate rise in global bond yields, yields will rise more slowly in Australia than in the US and the AUD is likely to weaken. Over the next 12 months, investors should remain neutral on Australian equities within a global equity portfolio. The RBA is likely to lag other central banks in tightening policy. Investors should therefore favor Australian government bonds over other developed economies such as the US and Canada. Amr Hanafy, Senior Analyst Global Asset Allocation amrh@bcaresearch.com
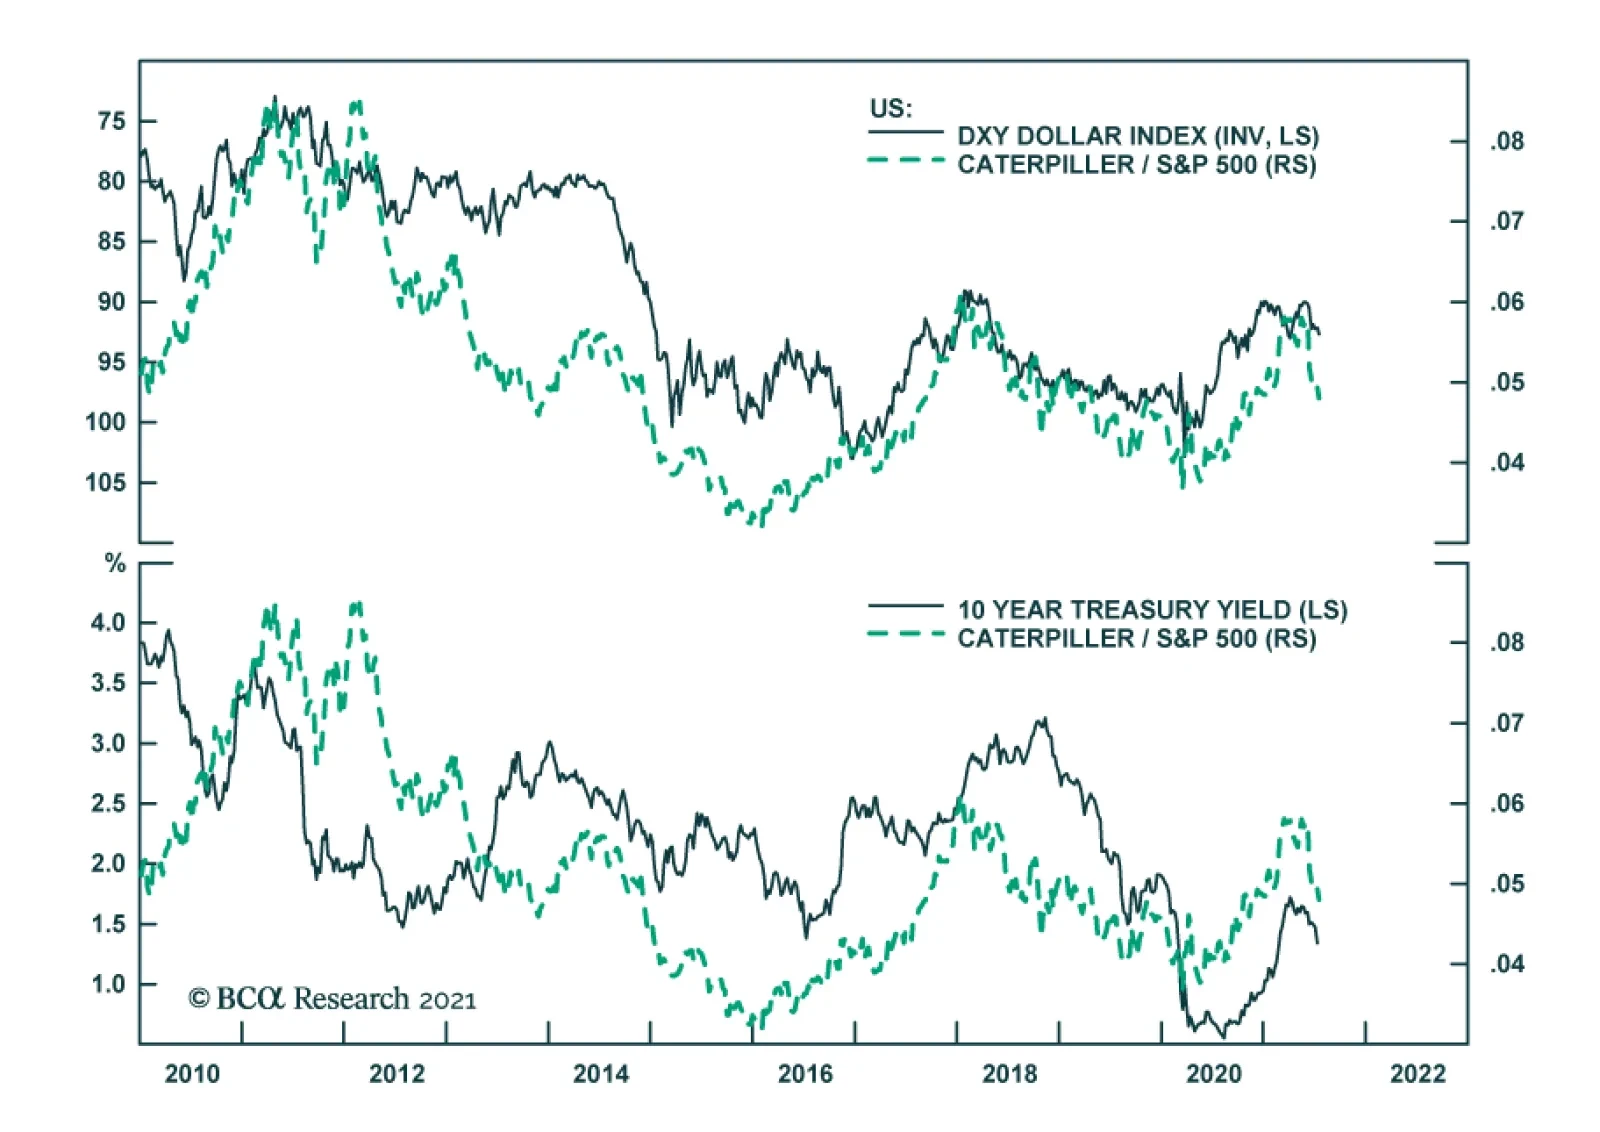
Caterpillar has been underperforming the broad US market since mid-March, a move that slightly predates the rebound in the dollar and the decline in global yields. The tight inverse relationship between the relative performance of Caterpillar and the…
Highlights The ECB has changed its inflation target, but its credibility remains weak. Inflation will not allow the ECB to tighten policy anytime soon. Instead, the ECB will have to add to its asset purchase program next year and may even consider dual interest rates. EUR/USD should continue to appreciate because of the weakness in the USD, but EUR/GBP, EUR/NOK, and EUR/SEK will soften. The SNB will follow the ECB; buy Swiss stocks / sell Eurozone defensives as an uncorrelated trade. China matters more than COVID-19 for the cyclical/defensive ratio. Despite our pro-cyclical medium- to long-term portfolio bias, the reflation trade is pausing. Remain tactically long telecom / short consumer discretionary as a hedge. European momentum stocks are near critical levels relative to growth equities. Feature The European Central Bank has found a new way to shed its Bundesbank heritage further and to justify the continuation of its QE program well after other central banks around the world will have ended their asset purchases. The early results of the Strategy Review and the subsequent comments by President Christine Lagarde will make it near impossible for the ECB to taper its asset purchases anytime soon. Practically, this means that the European yield curve will steepen relative to that of the US. Additionally, this policy should not hurt EUR/USD, but it will hurt EUR/GBP, EUR/NOK, and EUR/SEK. In the equity space, Swiss stocks will outperform European defensive equities, creating an opportunity for an uncorrelated trade. A New Tougher Target The ECB has abandoned its long-standing target of “close but below” 2% inflation. Even more importantly, the ECB followed the Bank of Japan and the Fed in adopting an approach whereby both downside and upside deviations from the 2% inflation target are to be fought. The ECB’s credibility was already hurt by its inability to achieve its more modest previous inflation target. Since 2009, the Euro Area HICP only averaged 1.2% (Chart 1). To prevent losing further credibility under its new mandate, the ECB will have to increase its stockpile of assets. Moreover, the ECB is far from achieving its new mandate, which will add to the ECB’s need to expand stimulus to the system even once the impact of owner-equivalent rent is included in CPI. Chart 1Mission Impossible
Mission Impossible
Mission Impossible
Chart 2Narrow Inflationary Pressures
Narrow Inflationary Pressures
Narrow Inflationary Pressures
Today, the ECB’s measure of core inflation stands at 1%, while headline inflation is 1.9%. As the economy re-opens, a surge in inflation is likely, but this spike will be transitory, even more so than in the US. As we recently showed, our estimate of the Eurozone trimmed-mean CPI has plunged close to 0%, which highlights that inflation pressures remain narrow (Chart 2). The labor market is another hurdle that will prevent Eurozone inflation from durably reaching 2% anytime soon. Currently, the total hours worked in the Euro Area remains well below the equilibrium level implied by the working-age population (Chart 3), which historically constrains wages. Moreover, it generally takes many quarters after labor shortages become prevalent before inflation begins to inch higher (Chart 4). Chart 3No Wage Pressure Yet
No Wage Pressure Yet
No Wage Pressure Yet
Chart 4No Inflation Labor Shortages For A While
No Inflation Labor Shortages For A While
No Inflation Labor Shortages For A While
The euro is the last force that caps European inflation. Despite the recent depreciation in EUR/USD, the trade-weighted euro remains near all-time highs, which historically imparts strong deflationary pressures to the economy (Chart 5). Beyond the time it will take for realized inflation to reach the ECB’s new target, inflation expectations are still inconsistent with 2% inflation. As the top panel of Chart 6illustrates, market-based inflation expectations in the Eurozone remain well below both 2% and the levels that prevailed before the Great Financial Crisis, even though rising commodity prices are lifting global inflation expectations. Market participants are not alone in doubting the ECB; professional forecasters do not see inflation at 2% in the near-term or the long-term (Chart 6, bottom panel). Chart 5The Euro Is Deflationary
The Euro Is Deflationary
The Euro Is Deflationary
Chart 6The ECB Lacks Credibility
The ECB Lacks Credibility
The ECB Lacks Credibility
In addition to the continued inability of the ECB to achieve its previous inflation target, let alone its present one, sovereign risk still hamstrings the central bank. The Italian economy remains fragile, because little structural reform has taken place. The Spanish economy cannot stand on its own two feet while the tourism industry continues to suffer due to COVID-19 related fears. And the exploding debt load of the French economy as well as its structural current account deficit raise the possibility that OATs will become unmoored. The ECB will ensure that spreads in those nations do not widen, or Eurozone inflation will never reach the new 2% target. Bottom Line: When it was time to achieve near—but below—2% inflation, the credibility of the ECB was already limited. The new target will be even harder to reach, but the symmetry around it gives the ECB more leeway to provide additional support to the Eurozone economy. Market Implications The ECB is now bound to maintain policy accommodation beyond the scheduled end of the PEPP program in March 2022, or the new policy target will be even less credible than the previous one. BCA Global Fixed Income Strategy team expects the ECB to maintain its asset purchase program beyond the stated end of the PEPP. Practically, this means that the ECB will fold the program into the pre-pandemic APP. The ECB cannot tighten policy while it remains so far from its target, especially now that missing the goalpost to the downside is as problematic as missing it to the upside. We expect the ECB to hint at this on Thursday. Chart 7The EONIA Curve Anticipated The Strategy Review
The EONIA Curve Anticipated The Strategy Review
The EONIA Curve Anticipated The Strategy Review
The ECB will also not increase interest rates for the foreseeable future, which the EONIA curve already anticipates (Chart 7). Money markets only expect a first hike in late 2024, which is appropriate. Compared to a month ago, overnight rates 10-year forward fell by more than 10bps, from 0.75% to 0.61%. We are inclined to fade this move. More stimulus raises the outlook for long-term policy rates. Amid the correction in global bond yields, betting against the decline in the long-term EONIA rate is akin to catching a falling knife; however, because the ECB is easing relative to the Fed, a box trade of buying European steepeners at the same time as US flatteners remains appropriate. The ECB could also lower the rate on TLTRO operations, resulting in a dual interest rate regime in the Eurozone. As Megan Greene and Eric Lonergan have argued, this policy would provide a further lift to the Euro Area economy by boosting the attractiveness of borrowing; at the same time, it would limit the deleterious impact of ever-more negative deposit rates on the profitability of the banking sector, because banks would borrow at extremely negative rates to finance lending activities. Chart 8JPY And YCC
JPY And YCC
JPY And YCC
The effect of the policy on the euro is more complex. When Japan announced its Yield Curve Control strategy in September 2016, it defined price stability as achieving a 2% inflation rate over the span of the business cycle. In other words, the BoJ implemented a backdoor average inflation mandate. Following this announcement, USD/JPY strengthened (Chart 8), but this move reflected the dollar rally and the global bond selloff around the US election, not yen-specific factors. This suggests that the euro will continue to track the USD inversely. BCA’s FX Strategy team remains bearish on the greenback, as a result of the growing US current account deficit and the fact that the Fed continues to target an overshoot in inflation, which suggests that, even if US nominal interest rates rise, real rates will lag behind. The EUR is nonetheless set to underperform compared to other European currencies. In the UK, house price gains are accelerating, the jobless count is declining rapidly as the economy re-opens, and the cheapness of the pound is accentuating positive inflation surprises. This combination suggests that the BoE is likely to follow the path of the Bank of Canada or the Reserve Bank of New Zealand, by beginning to tighten policy by early next year. Norway also faces a similar set of circumstances and has already announced it will lift interest rates this year. As we argued two months ago, the Riksbank is likely to follow its western neighbor, because the Swedish housing market is roaring, and the economy will remain well supported by the upcoming global capex boom. Hence, EUR/GBP, EUR/NOK, and EUR/SEK will depreciate. The Swiss National Bank should be the outlier that will follow the ECB. Swiss headline and core inflation linger at 0.6% and 0.4%, respectively. Wage growth is a meager 0.5%, because the Swiss output gap remains a massive 5.5% of GDP (Chart 9, top panel). Meanwhile, consumer confidence and retail sales are much weaker than those of Sweden, Norway, or the UK. Finally, Swiss private debt stands at 270% of GDP, which means that this economy still risks falling into a Fisherian debt-deflation trap. As a result, the SNB will continue to try to cap the upside in the CHF vis-à-vis the EUR, because the currency remains the main determinant of Swiss monetary conditions. Moreover, according to the central bank, the Swiss franc is still 10% overvalued relative to the euro, which is weighing on the country’s competitiveness (Chart 9, bottom panel). To fight the recent depreciation of EUR/CHF, the SNB will not raise rates for a long time and will intervene further in the FX market. The liquidity injections should prompt additional increases in the SNB’s domestic sight deposits, which since 2015 have resulted in a rise of Swiss bond yields relative to those of Germany (Chart 10). While counterintuitive, this relationship reflects the reflationary impact of the SNB’s asset purchases. It also means that the Swiss real estate market is set to become ever bubblier. Chart 9The SNB Will Follow The ECB
The SNB Will Follow The ECB
The SNB Will Follow The ECB
Chart 10Swiss/German Spreads To Widen
Swiss/German Spreads To Widen
Swiss/German Spreads To Widen
For Swiss shares, the picture is more complex. Swiss equities are extremely defensive, but, while they underperform Euro Area stocks when global yields rise, widening Swiss / German spreads often provide a lift to the SMI. A simple model, assuming US 10-year Treasury yields rise to 2.25% by the end of 2022 (BCA’s US Bond Strategy forecast) and that Swiss/German spreads widen to 20bps as the SNB domestic sight deposits swell, suggests that Swiss stocks will underperform that of the Euro Area over the coming 18 months (Chart 11). However, if we compare Swiss equities to European defensive sectors, then the widening in Swiss/German spreads should prompt an outperformance of Swiss equities, because their multiples benefit from ample liquidity conditions in Switzerland (Chart 12). Chart 11Swiss Stocks Are Too Defensive To Outperform Durably...
Swiss Stocks Are Too Defensive To Outperform Durably...
Swiss Stocks Are Too Defensive To Outperform Durably...
Chart 12...But They Will Beat Euro Area Defensives
...But They Will Beat Euro Area Defensives
...But They Will Beat Euro Area Defensives
Bottom Line: The results of the ECB Strategy Review will force this central bank to remain a laggard and continue to expand its balance sheet well after the expected end of the PEPP program. Eurozone interest rates will also fall behind that of other major economies. The ECB may even consider cutting the interest rate on TLTROs to boost lending. These policies will have a minimal impact on EUR/USD, which will continue to be dominated by the dollar’s fluctuations. However, EUR/GBP, EUR/SEK, and EUR/NOK will suffer. Finally, the SNB will follow the ECB and expand its balance sheet further, which will paradoxically lift Swiss/German spreads. As a result of their defensive nature, Swiss stocks will underperform Euro Area ones over the next 18 months, but they will outperform European defensive equities. Go long Swiss equities relative to European defensives, as a trade uncorrelated to the broad market. Follow China, Not Delta Chart 13
The ECB’s New Groove
The ECB’s New Groove
In recent days, doubts have grown about the European re-opening trade because of the resurgence of COVID-19 cases. The Delta variant (or any subsequent mutation for that matter) will cause hiccups along the way, but, ultimately, the re-opening will continue to proceed. As a result of the growing rate of vaccination, hospitalizations and deaths remain stable even if new cases are climbing rapidly in many countries (Chart 13). As long as the burden on the healthcare system remains limited, governments will find it difficult to justify further large-scale lockdowns. Instead, measures such as Macron’s Pass Sanitaire will provide increasing, widespread incentives for greater vaccination. Despite this sanguine take on the Delta variant, we remain concerned for the near-term outlook for cyclical equities because of the Chinese economy, even after the recent 50bps cut in the Reserve Requirement Ratio. BCA’s China Investment Strategy service believes that the RRR cut does not signal the beginning of a policy easing cycle. More evidence would be needed, such as additional RRR cuts, rising excess reserves, or supportive policies for the infrastructure and real estate sectors. For now, we heed the message from PBoC official Sun Guofeng that “the RRR cut is a standard liquidity operation.” Chart 14Fade The RRR Cut
Fade The RRR Cut
Fade The RRR Cut
The dominant force for the Chinese economy remains the previous deterioration in the credit impulse, which suggests that Q3 and Q4 growth will decelerate materially (Chart 14, top panel). Moreover, the softening impulse is consistent with weaker global economic activity, as approximated by our Global Nowcast (Chart 14, middle panel), especially since the lingering effect of the past RRR increases is still consistent with a global deceleration (Chart 14, bottom panel). In this context, we continue to hedge our long-term preference for cyclical stocks because of the near-term risks created by China and the excessively rapid move in the cyclical-to-defensives ratio (Chart 15). In response to this pause in the reflation trade, we continue to favor a long telecom/short consumer discretionary tactical position, which is supported by valuations and RoE differentials, as well as the still extended relative momentum (Chart 16). The period of risk to the global reflation trade should also allow the dollar to remain firm in the near-term, which means that for the coming months, the euro will not go beyond its trading range in place since the beginning of the year. Chart 15Cyclicals Remain Tactically Vulnerable
Cyclicals Remain Tactically Vulnerable
Cyclicals Remain Tactically Vulnerable
Chart 16Stay Long Telecom / Short Consumer Discretionary
Stay Long Telecom / Short Consumer Discretionary
Stay Long Telecom / Short Consumer Discretionary
Bottom Line: China’s RRR cut is not yet enough to bet against the temporary pause in the global reflation trade. Thus, investors should continue to hedge pro-cyclical long-term bets in their portfolios via a long telecom / short consumer discretionary position. An Exciting Chart A chart caught our eye this week: The underperformance of Eurozone momentum stocks relative to growth stocks is massively overdone (Chart 17). For now, we only want to highlight the phenomenon, but, in the coming weeks, we will delve deeper into the topic to gauge if these oversold conditions constitute an attractive opportunity. Chart 17Washed Out Moment
Washed Out Moment
Washed Out Moment
Mathieu Savary, Chief European Investment Strategist Mathieu@bcaresearch.com Currency Performance
The ECB’s New Groove
The ECB’s New Groove
Fixed Income Performance Government Bonds
The ECB’s New Groove
The ECB’s New Groove
Corporate Bonds
The ECB’s New Groove
The ECB’s New Groove
Equity Performance Major Stock Indices
The ECB’s New Groove
The ECB’s New Groove
Geographic Performance
The ECB’s New Groove
The ECB’s New Groove
Sector Performance
The ECB’s New Groove
The ECB’s New Groove
Highlights Yield curves have flattened considerably in the major economies since April. Slowing global growth, the perception that the Fed is turning more hawkish, and technical factors have contributed to flatter yield curves. Looking out, we expect the forces pushing down bond yields to abate, with the US 10-year Treasury yield ultimately rising to 1.8%-to-1.9% by the end of the year. Shrinking output gaps, rebounding inflation expectations, and stepped-up Treasury issuance should all push yields higher. Higher yields will benefit bank shares at the expense of tech stocks. Investors should favor value over growth and non-US equities over their US peers. We are closing our long global energy stocks/short copper miners trade. In its place, we are opening a trade to go long the December 2022 Brent futures contract at a price of $66.50/bbl. Flatter Yield Curves Yield curves have flattened considerably in the major economies since April. The US 10-year yield has fallen to 1.31% (and was down to as low as 1.25% intraday last Thursday) from a recent peak of 1.74% on March 31st. The US 2-year yield has risen 7 bps over this period, which has translated into 50 bps of flattening in the 2/10 yield curve. The German bund curve has flattened by 20 bps, the UK curve by 28 bps, the Canadian curve by 52 bps, and the Australian curve by 57 bps. Even the Japanese yield curve has managed to flatten by 13 bps (Chart 1). Chart 1AYield Curves In The Major Economies Have Flattened Since April (I)
Yield Curves In The Major Economies Have Flattened Since April (I)
Yield Curves In The Major Economies Have Flattened Since April (I)
Chart 1BYield Curves In The Major Economies Have Flattened Since April (II)
Yield Curves In The Major Economies Have Flattened Since April (II)
Yield Curves In The Major Economies Have Flattened Since April (II)
Chart 2US Economic Surprise Index Is Near A Post-Pandemic Low
US Economic Surprise Index Is Near A Post-Pandemic Low
US Economic Surprise Index Is Near A Post-Pandemic Low
Three major factors account for the recent bout of yield-curve flattening: Slowing growth: Decelerating growth is usually accompanied by a flatter yield curve. Chinese growth peaked late last year. US growth peaked around March, with the Citi Economic Surprise Index falling to a post-pandemic low last week (Chart 2). European growth will peak over the course of this summer (Table 1). The emergence of the Delta variant has amplified growth concerns. Table 1Growth Is Peaking, But At A Very High Level
The Message From The Yield Curve
The Message From The Yield Curve
Fears that the Fed is turning more hawkish: About one-third of the flattening in the US yield curve occurred in the two days following the June FOMC meeting. The shift in the median Fed forecast towards a 2023 rate hike was interpreted by many market participants as a signal that the Fed was unwilling to tolerate a prolonged inflation overshoot (Chart 3). As a result, short-term rate expectations moved up while long-term rate expectations declined (Chart 4). Chart 3The Fed Dots Have Shifted Towards An Earlier Rate Hike
The Message From The Yield Curve
The Message From The Yield Curve
Chart 4Markets Saw The June FOMC Meeting As A Turning Point
Markets Saw The June FOMC Meeting As A Turning Point
Markets Saw The June FOMC Meeting As A Turning Point
Chart 5Treasury Cash Balances Are Declining
Treasury Cash Balances Are Declining
Treasury Cash Balances Are Declining
Technical factors: Investors were positioned very bearishly on bonds earlier this year, helping to set the stage for a short-covering rally. Meanwhile, with yet another debt ceiling showdown looming in Congress, the Treasury department began to slash T-bill issuance, drawing on its cash balances at the Fed instead (Chart 5). Treasurys, which were already in short supply due to the Fed’s QE program, became even scarcer. All this happened at a time when seasonal factors normally turn bond bullish (Chart 6). Chart 6Seasonality In Markets
The Message From The Yield Curve
The Message From The Yield Curve
How these three factors evolve over the coming months will dictate the path of bond yields, with important implications for stocks and currencies. Let’s examine each in turn. Global Growth Will Slow, But Remain Firmly Above Trend Chart 7High Vacancies Suggest Strong Demand For Labor
High Vacancies Suggest Strong Demand For Labor
High Vacancies Suggest Strong Demand For Labor
While global growth will continue to decelerate, it will remain well above trend. This is important because ultimately, it is the size of the output gap that determines the timing and magnitude of rate hikes. In the US, the high level of job vacancies suggests that there is no shortage of labor demand (Chart 7). What is missing are willing workers. As we noted in our Third Quarter Strategy Outlook, labor shortages should ease in the fall as expanded unemployment benefits expire, schools reopen, and immigration picks up. The recent rapid decline in initial unemployment claims is consistent with an acceleration in job gains over the coming months (Chart 8). The share of small businesses planning to increase hiring also jumped in June to the highest level in the 48-year history of the NFIB survey (Chart 9). Chart 8Declining Unemployment Claims Point To Further Strong Employment Growth
Declining Unemployment Claims Point To Further Strong Employment Growth
Declining Unemployment Claims Point To Further Strong Employment Growth
Chart 9Small US Businesses Are Keen To Hire
Small US Businesses Are Keen To Hire
Small US Businesses Are Keen To Hire
Delta Risk In the US, 32,000 new Covid cases were reported on Wednesday. This pushed the 7-day average to 25,000, double the level it was the first week of July. According to the CDC, more than 90% of US counties with high case counts had vaccination rates below 40% (Map 1). As is in other countries, the highly contagious Delta variant accounts for the majority of new US infections. Map 1AUS Covid Vaccination Coverage
The Message From The Yield Curve
The Message From The Yield Curve
Map 1BUS Covid Infection Trends
The Message From The Yield Curve
The Message From The Yield Curve
Chart 10Vaccine Makers Are On Track To Produce Over 10 Billion Doses In 2021
The Message From The Yield Curve
The Message From The Yield Curve
The latest Covid wave will slow US economic activity, but probably not by much. The CDC estimates that over 99% of recent US Covid deaths have been among the non-vaccinated population. Vaccinated people have little to fear from the Delta strain and hence, will likely continue to go on with their daily lives. Non-vaccinated people, in most cases, are presumably not very concerned about contracting the virus, so they too will go on with their daily lives. Thus, it is difficult to see how the Delta strain will lead to major behavioral changes. And politically, it will be difficult for governments to legislate lockdowns when everyone who wants a vaccine has been able to receive one. Outside the US, the Delta strain will cause more havoc. Nevertheless, there is a light at the end of the tunnel. Globally, vaccine makers are set to produce over 10 billion doses this year (Chart 10). Many of these vaccines will make their way to emerging economies, which have struggled to obtain adequate supplies. That should help boost EM growth. China Policy Support Chinese retail sales, industrial production, and fixed asset investment all rose faster than expected in June. Yesterday’s solid activity data followed strong trade numbers released earlier this week. Chart 11Chinese Credit Growth Should Stabilize In The Second Half Of The Year
Chinese Credit Growth Should Stabilize In The Second Half Of The Year
Chinese Credit Growth Should Stabilize In The Second Half Of The Year
Chinese policy is turning more stimulative, which should continue to support growth. Effective this Thursday, the PBOC cut its reserve requirement ratio by 0.5 percentage points, releasing about RMB 1 trillion of liquidity into the banking system. It was the first such cut since April 2020. Total social financing, a broad measure of Chinese credit, rose by RMB 3.7 trillion in June, well above consensus estimates of RMB 2.9 trillion. Credit growth has fallen sharply since last October and is currently running near its 2018 lows (Chart 11). Looking out, Chinese credit growth should pick up modestly as local governments issue more debt. As of June, local governments had used only 28% of their annual bond issuance quota, compared with 61% over the same period last year and 65% in 2019. The proceeds from local government bond sales will likely flow into infrastructure spending, which has been tepid in recent years (Chart 12). Increased infrastructure spending will boost metals prices. With that in mind, we are closing our long global energy stocks/short copper miners trade for a gain of 8.5%. In its place, we are opening a trade to go long the December 2022 Brent futures contract at a price of $66.50/bbl. As Chart 13 shows, BCA’s Commodity and Energy service expects oil prices to keep rising in contrast to market expectations of a price decline. Chart 12China: Weak Infrastructure Spending Should Pick Up
China: Weak Infrastructure Spending Should Pick Up
China: Weak Infrastructure Spending Should Pick Up
Chart 13Oil Prices Have Further Upside
Oil Prices Have Further Upside
Oil Prices Have Further Upside
The Fed Will Stay Dovish Chart 14Excluding Pandemic-Affected Sectors, Core CPI Has Not Surged As Much As Headline Measures
Excluding Pandemic-Affected Sectors, Core CPI Has Not Surged As Much As Headline Measures
Excluding Pandemic-Affected Sectors, Core CPI Has Not Surged As Much As Headline Measures
Market participants overreacted to the shift in the Fed’s dot plot. The regional Fed presidents tend to be more hawkish than the Board of Governors. Jay Powell himself probably penciled in one hike for 2023. Lael Brainard, who may end up replacing Powell next year, likely projects no hikes for 2023. Granted, inflation has surged. The CPI rose 5.4% year-over-year in June, above expectations of 4.9%. Core CPI inflation clocked in at 4.5%, surpassing expectations of 4.0%. However, most of the increase in the CPI continues to be driven by a few pandemic-affected sectors. Excluding airfares, hotels, and vehicle prices, the core CPI rose by a modest 2.5% in June. The level of the CPI outside these pandemic-affected sectors is still below trend, suggesting little imminent need for monetary tightening (Chart 14). Many input prices have already rolled over (Chart 15). The price of lumber, which at one point was up 93% from the start of 2021, is now down for the year. Steel prices are well off their highs. So too are memory chip prices. Even used car auction prices are starting to decline (Chart 16). Chart 15Input Prices Have Rolled Over
Input Prices Have Rolled Over
Input Prices Have Rolled Over
Chart 16Used Car Prices Have Probably Peaked
Used Car Prices Have Probably Peaked
Used Car Prices Have Probably Peaked
Chart 17Both The Fed And Market Participants Have Revised Down Their Estimate Of The Neutral Rate Of Interest
Both The Fed And Market Participants Have Revised Down Their Estimate Of The Neutral Rate Of Interest
Both The Fed And Market Participants Have Revised Down Their Estimate Of The Neutral Rate Of Interest
Chart 18Inflation Expectations Have Fallen Back Below The Fed's Target Zone
Inflation Expectations Have Fallen Back Below The Fed's Target Zone
Inflation Expectations Have Fallen Back Below The Fed's Target Zone
Despite the widespread perception that US monetary policy is ultra-accommodative, current policy rates are only two percentage points below both the Fed’s and the market’s estimates of the terminal rate (Chart 17). Given the zero lower bound constraint on nominal policy rates, tightening monetary policy prematurely could be a grave mistake.Market-based inflation expectations are signaling the need for easier, not tighter, monetary policy. After rising earlier this year, the 5-year/5-year forward TIPS breakeven inflation rate has fallen back below the Fed’s comfort zone (Chart 18). It is highly unlikely that the Fed will commence tapering if long-term inflation expectations remain below target. More likely, the Fed will ramp up its dovish rhetoric over the coming months, allowing inflation expectations to recover. This should put some upward pressure on long-term bond yields. Technical Factors Are Turning Less Bond Friendly Chart 19Investors Were Heavily Short Bonds Earlier This Year
Investors Were Heavily Short Bonds Earlier This Year
Investors Were Heavily Short Bonds Earlier This Year
While seasonal factors should remain bond bullish over the remainder of the year, other technical factors are turning less supportive. Investors surveyed by J.P. Morgan increased duration exposure over the past four weeks, after having cut it to the lowest level since 2017 (Chart 19). Traders also cut short positioning on the 30-year bond by two-thirds from record levels. Treasury issuance should normalize by the fall. While the obligatory brinkmanship over the debt ceiling is likely to extend beyond the August 1st deadline, BCA’s chief political strategist Matt Gertken believes that Democrats will ultimately be able to raise the ceiling. Senate Democrats may end up using the reconciliation process to both raise the debt ceiling and pass President Joe Biden’s $3.5 trillion American Jobs and Families Plan with 51 votes along. They are also likely to move forward on passing Biden’s proposed $600 billion in traditional infrastructure, with or without Republican support. The combination of increased Treasury supply and more fiscal spending should translate into higher bond yields. Higher Bond Yields Favor Value Stocks We expect the US 10-year Treasury yield to move back up to 1.8%-to-1.9% by the end of the year. Bond yields in other markets will also rise, but less so than in the US, given the relatively “high beta” status of US Treasurys (Chart 20). In contrast to tech stocks, banks usually outperform when bond yields are rising (Chart 21). The recent pickup in US consumer lending should also help bank shares (Chart 22). Chart 20US Treasuries Have A Higher Beta Than Most Other Government Bond Markets
US Treasuries Have A Higher Beta Than Most Other Government Bond Markets
US Treasuries Have A Higher Beta Than Most Other Government Bond Markets
Chart 21Bank Shares Thrive In A Rising Yield Environment
Bank Shares Thrive In A Rising Yield Environment
Bank Shares Thrive In A Rising Yield Environment
Chart 22Recent Pickup In US Consumer Lending Will Help Bank Shares
Recent Pickup In US Consumer Lending Will Help Bank Shares
Recent Pickup In US Consumer Lending Will Help Bank Shares
Chart 23Outperformance Of Tech Stocks Not Backed By Trend In Earnings Estimates
Outperformance Of Tech Stocks Not Backed By Trend In Earnings Estimates
Outperformance Of Tech Stocks Not Backed By Trend In Earnings Estimates
Chart 24Non-US Stocks And Value Stocks Typically Perform Best When The Dollar Is Falling
Non-US Stocks And Value Stocks Typically Perform Best When The Dollar Is Falling
Non-US Stocks And Value Stocks Typically Perform Best When The Dollar Is Falling
It is worth noting that the outperformance of tech stocks over the past six weeks has not been mirrored in relative upward revisions to earnings estimates (Chart 23). Without the tailwind from relatively fast earnings growth, tech names will lag the market over the remainder of 2021. The US dollar usually weakens when growth momentum rotates from the US to the rest of the world, which is likely to occur in the second half of this year. A dovish Fed will put further downward pressure on the greenback. Non-US stocks and value stocks typically perform best when the dollar is falling (Chart 24). Peter Berezin Chief Global Strategist peterb@bcaresearch.com Global Investment Strategy View Matrix
The Message From The Yield Curve
The Message From The Yield Curve
Special Trade Recommendations
The Message From The Yield Curve
The Message From The Yield Curve
Current MacroQuant Model Scores
The Message From The Yield Curve
The Message From The Yield Curve