Equities
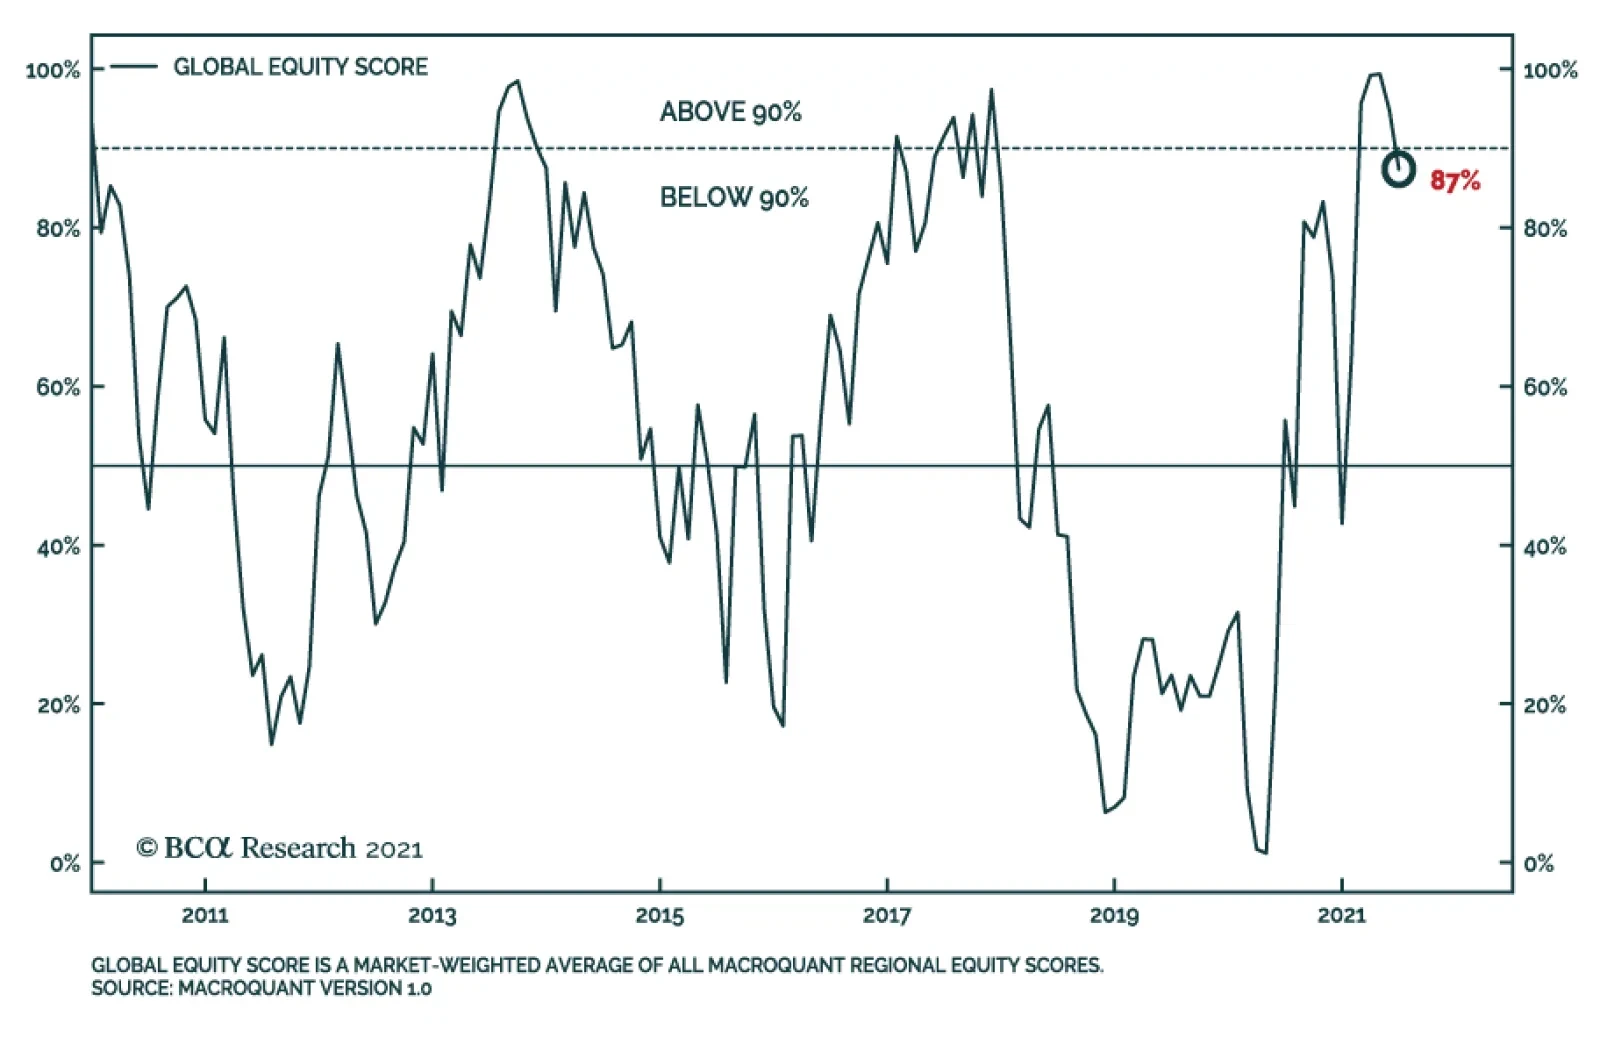
The MacroQuant global equity score is a market-weighted composite of all the regional equity scores within the model. It ranges between 0% and 100%, with 0% being most bearish and 100% being most bullish. Read the full details on MacroQuant in the recently…

One Market To Rule Them All
One Market To Rule Them All
The bond market continues to dictate the pace for the SPX and relative sector performance. The 30-year US Treasury yield retraced nearly half a percent from the mid-March peak triggering a US equity market rotation from cyclical and value sectors like materials, into growth sectors such as technology. AMZN alone moved more than 3% yesterday breaking out to fresh all-time highs signaling continued outperformance of growth stocks, while more value sectors lag behind (see chart). With growth rolling over and the Fed staying pat despite a slightly more hawkish stance, we expect the rates market to remain range bound for a while longer, further supporting a strong run of growth stocks in general, and tech in particular. Bottom Line: The rotation trade into growth at the expense of value has more room to run.
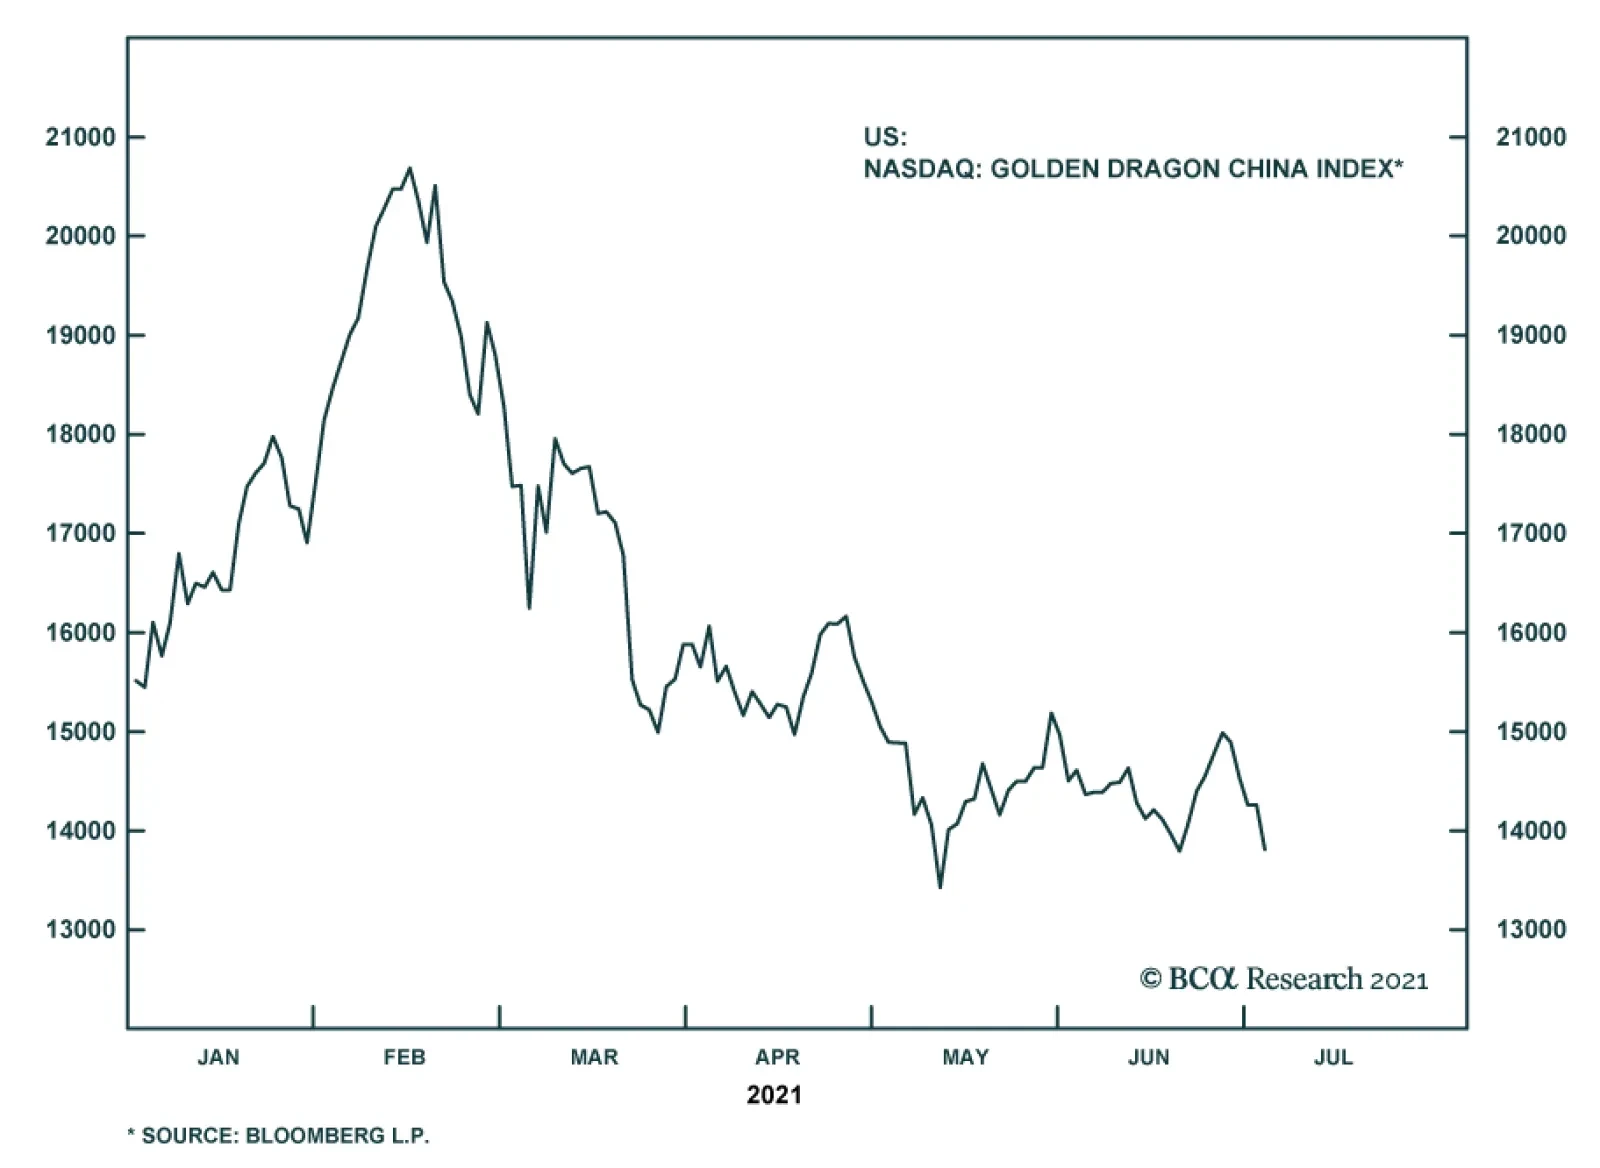
Chinese regulators asserted their authority over homegrown ride-hailing success story Didi (ticker: DIDI) by squeezing its ability to reach new customers days after it raised $4.4 billion in an IPO of American Depository Receipts (ADRs). The stock lost 20-25%…
Foreword Today we are publishing a charts-only report focused on the S&P 500, Cyclicals/Defensives, Growth/Value, and Small/Large. Many of the charts are self-explanatory; to some we have added a short commentary. The charts cover macro, valuations, fundamentals, technicals, and the uses of cash. Our goal is to equip you with all the data you need to make investment decisions along these style dimensions. We also include performance, valuations and earnings growth expectations tables for all styles, sectors, industry groups, and industries (GICS 1, 2 and 3). We hope you will find this publication, which we plan to update on a monthly basis, useful. Overarching Investment Themes Macro Economic growth remains robust, albeit slowing from a high peak. The business cycle has moved to an unusual slowdown stage, characterized by high growth. Investors’ inflation fears are dissipating, and the reflation trade is on the way out. However, concerns remain: According to the Consumer Confidence Survey, higher inflation is getting embedded into consumer expectations, potentially propagating a vicious cycle of stronger demand and higher prices (Chart 1). Fed rhetoric is becoming more hawkish. Yet, investors are shrugging it off, concluding a more active Fed is worth it to tame inflation. Companies are struggling to fill job openings and are hit with rising materials prices. However, corporate America's pricing power remains at an all-time high, helping offset the margin squeeze (Chart 2). Chart 1Consumer Confidence Survey: Inflation Expectations
Consumer Confidence Survey: Inflation Expectations
Consumer Confidence Survey: Inflation Expectations
Chart 2Corporate Pricing Power
Corporate Pricing Power
Corporate Pricing Power
Post-pandemic economic recovery was plagued by shortages and supply-chain disruptions. While it will take a long time for the supply issues to be resolved, bottlenecks are showing early signs of easing as delivery times are starting to fall (Chart 3). Last, but not least, consumers have money to spend, but prefer to splurge on services and experiences rather than goods. Chart 3Philadelphia Fed Business Survey: Delivery Times
Philadelphia Fed Business Survey: Delivery Times
Philadelphia Fed Business Survey: Delivery Times
Valuations And Profitability The US stock market remains expensive, trading more than two standard deviations above the long-term average (Chart 4). Cyclicals look even worse, trading three standard deviations above Defensives. The six-month forward earnings outlook for the S&P 500 remains healthy with the BCA earnings model pointing towards higher growth. Hopefully, the index will grow into its elevated valuation. Small, Value, and Cyclicals also have impressive earnings growth expectations relative to their safer counterparts, but growth has peaked across the board, which does not bode well for performance. Chart 4Valuations Indicator (S&P 500)
Valuations Indicator (S&P 500)
Valuations Indicator (S&P 500)
Uses Of Cash Share buybacks and other shareholder-friendly activities are on the rise again and are expected to gain steam this year and next. A falling denominator in the EPS ratio is another factor that will propel the S&P 500 higher (Chart 5). Capex is still lagging. A pickup in Capex will signal that the post-pandemic recovery is firmly on track, and life is fully back to normal as companies are comfortable investing in future growth. This will give the US equity rally, especially Cyclicals, a new lease of life (Chart 6). Chart 5Buybacks
Buybacks
Buybacks
Chart 6Capex/Sales
Capex/Sales
Capex/Sales
Investment Implications Normalization has been sending ripples through the US equity markets, as investors rotate back into Growth, and away from the reflation trade, and give a cold shoulder to small caps. We recommend a rotation from Value into Growth. While we are agnostic between Small and Large, we prefer both small- and large-cap Growth to large caps in general. While we think that the value trade has (mostly) run its course, we still like the Cyclicals most exposed to Consumer and Business Services, Infrastructure, and Oil. Irene Tunkel Chief Strategist, US Equity Strategy irene.tunkel@bcaresearch.com S&P 500 Chart 7Macroeconomic Backdrop
Macroeconomic Backdrop
Macroeconomic Backdrop
Chart 8Profitability
Profitability
Profitability
Chart 9Valuations And Technicals
Valuations And Technicals
Valuations And Technicals
Chart 10Uses Of Cash
Uses Of Cash
Uses Of Cash
Cyclicals Vs Defensives Chart 11Macroeconomic Backdrop
Macroeconomic Backdrop
Macroeconomic Backdrop
Chart 12Profitability
Profitability
Profitability
Chart 13Valuation And Technicals
Valuation And Technicals
Valuation And Technicals
Chart 14Uses Of Cash
Uses Of Cash
Uses Of Cash
Growth Vs Value Chart 15Macroeconomic Backdrop
Macroeconomic Backdrop
Macroeconomic Backdrop
Chart 16Valuations, Profitability And Technicals
Valuations, Profitability And Technicals
Valuations, Profitability And Technicals
Small Vs Large Chart 17Macroeconomic Backdrop
Macroeconomic Backdrop
Macroeconomic Backdrop
Chart 18Profitability
Profitability
Profitability
Chart 19Valuations And Technicals
Valuations And Technicals
Valuations And Technicals
Chart 20Uses Of Cash
Uses Of Cash
Uses Of Cash
Table 1Performance
US Equity Chart Pack
US Equity Chart Pack
Table 2Valuations And Forward Earnings Growth
US Equity Chart Pack
US Equity Chart Pack
Recommended Allocation
Is It A Small World After All?
Is It A Small World After All?
Footnotes .
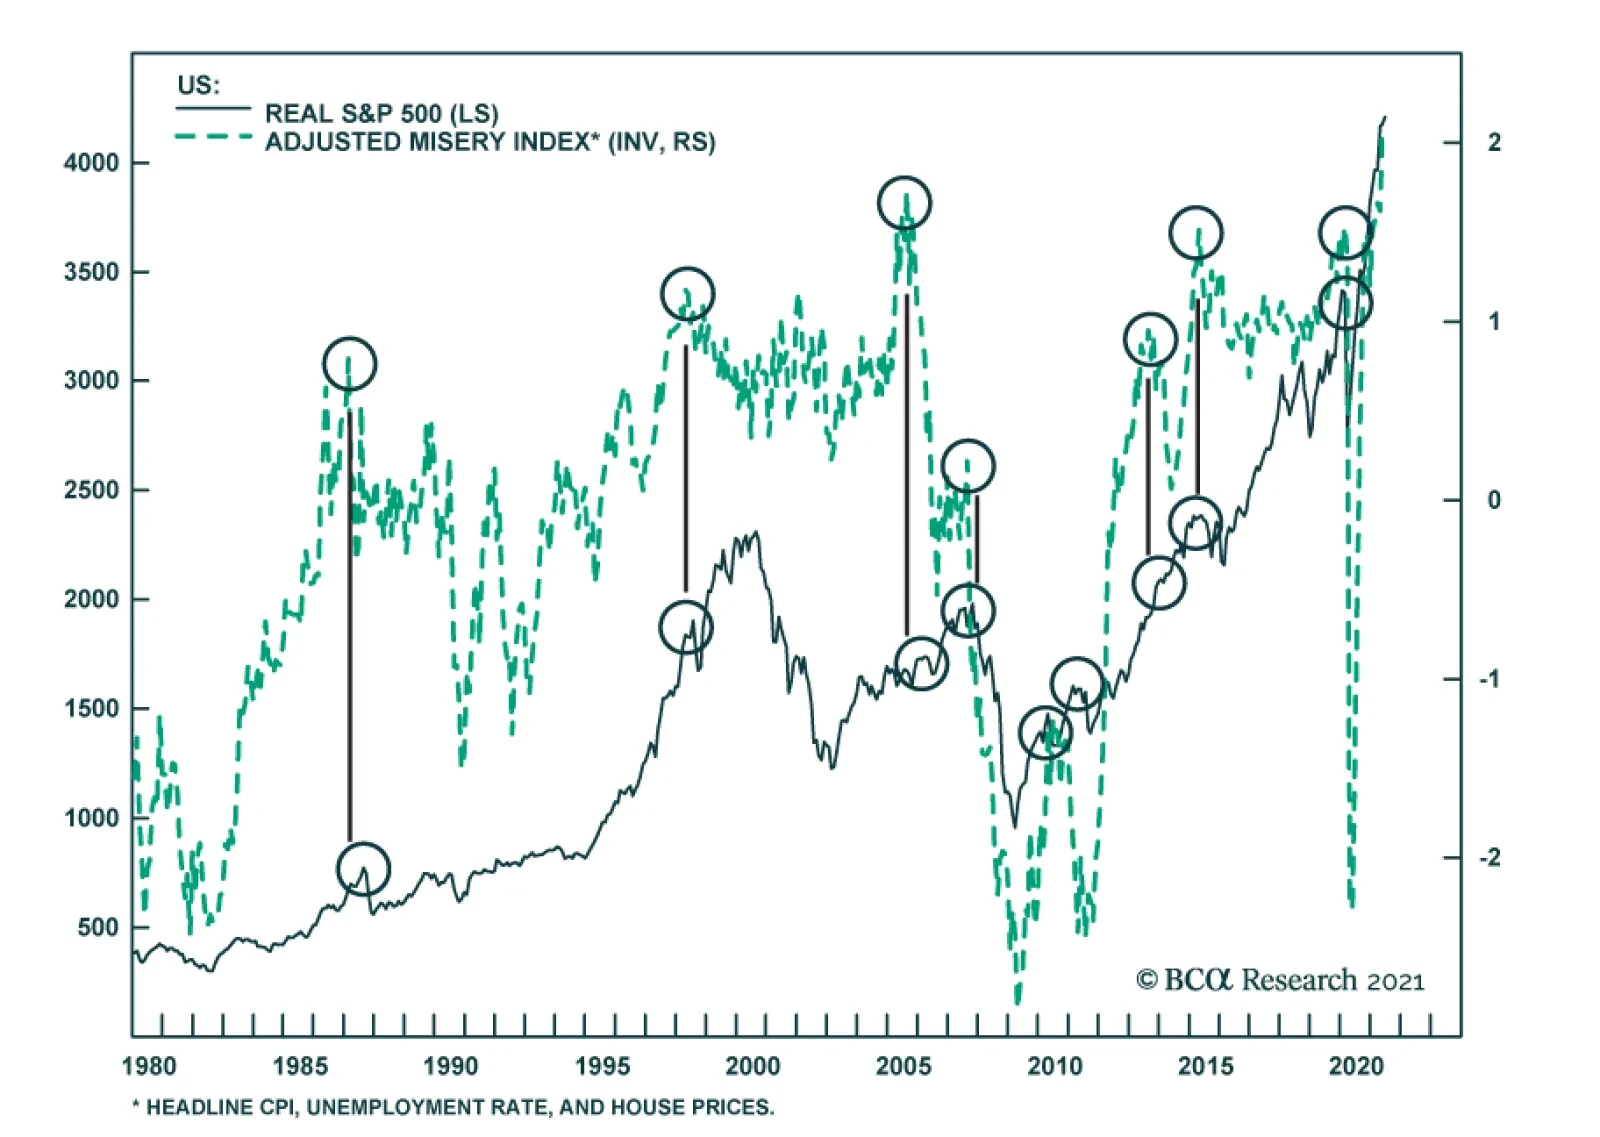
Our misery index is surging to fresh highs. Whenever a combination of rising inflation, high unemployment and rising house prices was in play, this was a warning salvo that the policy mix might become a toxic cocktail for longer-term asset prices. BCA…
Highlights Barring major surprises, President Macron will be re-elected in 2022. Any dramatic reversal in the pandemic that leads to a new recession would benefit the opposition candidate. Otherwise, Macron will remain the frontrunner. A second term for President Macron would see a continuation of the structural reforms started in 2017, but with a longer process for coalition-building in the National Assembly. This is bullish for France. Reducing the size of the state will go a long way to improve France’s economic competitiveness over the long run. Tactically, favor the more defensive Spanish market over the highly cyclical French market. Underweight French consumer discretionary equities relative to their European and global peers. Longer term, overweight French industrials equities relative to German ones, and overweight French tech equities relative to European ones. Ahead of the election, buy the dip on any euro weakness and French OAT/German bund spread widening. Feature The French presidential election is nine months away, and it is already starting to catch investors’ attention as one of the main political events in Europe in 2022. In talks with clients, we’ve been asked repeatedly about the odds we assign to a Marine Le Pen victory and the market implications. Those concerns are understandable but overrated. Le Pen’s personal approval rating is on the rise, and, in most polls, the far-right candidate beats President Emmanuel Macron in the first round vote, although not the critical second round. Although the same polls see Macron being re-elected, the gap between the two has narrowed considerably since the 2017 election, which Macron won by 66 percent of the vote. Still, Macron is favored for re-election. He has several strong advantages over Le Pen, and it is unlikely she will be able to close the gap further before the election. Macron’s first term has been eventful. Neoliberal structural reforms started with drums beating in the first 18 months of his term. But the pace and breadth of reform eventually became too ambitious or painful for France to bear, and protests erupted in 2018. First came the “Yellow Vest Movement,” and then came protests against pension reform. Macron tried to compromise and continue with his agenda, but COVID-19 forced his hand. Since then, Macron has focused on crisis management, benefiting from the large state sector’s role as an automatic stabilizer amid the downturn. A second term under President Macron would see a reboot of the structural reforms started in 2017, albeit without single-party rule in the National Assembly. Reforms aimed at reducing the size of the state, and its cost, would go a long way to improve France’s economic competitiveness over the long run. Therefore, the prospect of Macron’s reelection is bullish for France, even though the reality of his second term would be more complex. 2017 All Over Again? Yes And No At first glance, the 2022 election seems to be a repeat of 2017. Le Pen and Macron are likely to face off in the second round and the latter, the Europhile centrist candidate, is likely to win once more. However, everything surrounding this election has changed. The Incumbency Effect One of the major changes is favorable for Macron: he is the incumbent running for re-election. Macron had been part of President Francois Hollande’s government since 2014, so he was still viewed in 2017 as a political neophyte and dark horse candidate. His rapid rise to power, along with that of his upstart party, La République En Marche (LREM), was astounding. Chart 1Pro-Incumbency Effect Favors Macron
France: More Than Just A Déjà-Vu
France: More Than Just A Déjà-Vu
There is a strong pro-incumbency effect in French presidential elections, especially in the first round (Chart 1). Since 1965, five incumbents have run for re-election, and all have made it to the second round. Importantly, four won first place in the first round, with a six percentage-point margin on average. The chief exception is Nicolas Sarkozy in 2012. The reason for Sarkozy’s loss, however, is well known: he attempted to pass an unpopular pension reform in the teeth of the Euro debt crisis, 12 months before facing re-election. The only other incumbent who failed at re-election was Valerie Giscard d’Estaing, who lost to Francois Mitterrand in 1981, when the whole world was in stagflation and upheaval. The incumbency effect is not as pronounced in the second round (Chart 1, bottom panel). However, when facing a far-right candidate, incumbents win by a wide margin. This was the case in 2002 and 2017. Today, Macron still has a 12-point lead on Le Pen. Macron compares well to his predecessors. Chart 2 shows the approval rating for all presidents sitting in office over the past 40 years. The number of people who intend to vote for Macron has increased, the first time this has happened for an incumbent president since 1988. Only three presidents had a higher approval rating at this stage of their term, albeit from a higher starting point. Macron’s approval rating has increased by 10% since February 2020, when the COVID-19 pandemic hit Europe. Chart 2Macron Compares Well To His Predecessors
France: More Than Just A Déjà-Vu
France: More Than Just A Déjà-Vu
Table 1Incumbency And Recessions Under The Fifth Republic
France: More Than Just A Déjà-Vu
France: More Than Just A Déjà-Vu
The shock of the pandemic and recession is the greatest change since 2017, and the biggest challenge facing Macron. Four incumbents have made a bid for re-election that was preceded by a recession within 12-24 months (Table 1). The results are mixed, and it is hard to establish a clear anti-incumbency effect. If anything, the timing and nature of this crisis are likely to help Macron rather than hurt him, since the vaccination campaign and easing of lockdown measures will enable the economy to normalize and improve ahead of April 10-24, 2022, when voters cast their first ballots. Nonetheless, another major shock (of any kind) could undermine the incumbent advantage. Economic Recovery Is The Top Priority While the Macron administration’s handling of the pandemic was questioned, public opinion was never aggressively hostile toward his handling of the economy. Macron was instrumental in securing a major European fiscal stimulus package (and joint debt issuance) with the German Chancellor, Angela Merkel. He enthusiastically adopted the crisis mentality of “whatever it takes” to wage war against COVID-19, enabling the oversized French state to deploy the most generous furlough scheme in Europe, shielding millions of workers and preventing businesses from going under. This will be one of his winning cards. Chart 3The Handling Of The Pandemic Dictates Macron's Popularity
The Handling Of The Pandemic Dictates Macron's Popularity
The Handling Of The Pandemic Dictates Macron's Popularity
His approval rating began to rebound following the end of lockdowns (Chart 3). This trend should strengthen as the French economy reopens, supported by a government that will play an accommodative and reflationary economic role until the election. Public opinion wants him to focus on the labor market and the economic recovery in the months to come, and he will be happy to oblige. Public opinion also views Macron as the most qualified candidate when it comes to economic matters (Table 2). 42% of respondents think that Le Pen is not qualified “at all” on economic matters, her Achilles’ heel, a perception that was already entrenched when Macron crushed her in a televised debate before the second round of the 2017 election. Table 2Macron Is Perceived As The Most Qualified To Oversee The Economic Recovery
France: More Than Just A Déjà-Vu
France: More Than Just A Déjà-Vu
Europhile Versus Eurosceptic? The central issue of the 2017 election was Europe and France’s role in it. Following the UK’s disruptive Brexit referendum in 2016, and a long tradition of Euroscepticism within her party, Le Pen campaigned on “Frexit” and the abandonment of the euro. Conversely, Macron embraced the EU and the monetary union as he ran for president and committed to having France play a more important role within the bloc if he won. Chart 4Le Pen And The EU: Not The Divorce We Expected
Le Pen And The EU: Not The Divorce We Expected
Le Pen And The EU: Not The Divorce We Expected
Since then, Le Pen has drastically shifted her stance on the EU. She now claims that the benefits of the common currency and single market outweigh the costs. After all, 70% of the French public support the euro and EU membership (Chart 4). Like clockwork, her personal approval ratings have steadily gone up. This strategic shift aligns her with the median voter, and combined with the Covid crisis, it is the only reason to take her candidacy remotely seriously in 2022, despite Macron’s clear advantages. Nevertheless, Le Pen has not yet risen above her 2012 peak in popular support. She failed to do so between 2014 and 2015, when the lingering European debt crisis, the Syrian refugee crisis, multiple terrorist attacks in France, and sluggish economic growth should have boosted her popularity. Her shifting perspective on the euro was therefore necessary and might be just what she needs to break through her 37% ceiling of popular support. Le Pen’s policy agenda is now focusing on protectionism, immigration, and national security. It is a Trumpian mix. However, while her new stance is more mainstream, it also differentiates her less from the other center-right politicians in France, namely Xavier Bertrand, who recently made local electoral gains in Le Pen’s northern industrial base. Macron is as strong an advocate for Europe as ever. He convinced Germany to break the taboo on joint fiscal policy during the pandemic. Now, he is also mounting a bid to become the natural leader of Europe, given that Merkel is stepping down, and her party is likely to lose standing in the German election in September. France is set to take over the rotating EU Council Presidency in the first half of 2022, under the theme “Recovery, power, belonging,” which provides Macron with a golden opportunity to pitch himself as Europe’s premier statesman and economic steward in the final months of the election campaign. One Thing Hasn’t Changed: The Outcome Of A Macron/Le Pen Duel Most opinion polls give Macron a 10-12 point lead on Le Pen in the second round of the election. This gap is wide enough to reassure investors that it is not a polling error. However, in 2017, Macron’s average lead over Le Pen was 22%, and he won the election with 66% of votes. It is the narrowing of that gap that raises eyebrows among investors. Table 3Ideological Blocs Also Favor Macron
France: More Than Just A Déjà-Vu
France: More Than Just A Déjà-Vu
Still, Le Pen’s chances at closing the gap are overrated. She is not a political “unknown” anymore and has very little ability to “surprise” voters into rallying around her next year. She will have trouble persuading those who know all about her. Grouping French voters according to ideological blocs, that is, presidential preference by party affiliation, suggests that the biggest threat to Macron is a strong center-right candidate who can beat Le Pen, especially if this should coincide with a revival of the center-left (Table 3). Otherwise, as in 2017, Macron will be able to count on voters from other parties in the second round of the election (Table 4). While both candidates appeal to right-wing constituents and would have to share their ballots, Macron can count on the green EELV party, as well as left-wing voters, to join center-right voters to elect him. Macron has made environmental issues a part of his mandate, which should help him confront a green neophyte such as Le Pen. Table 4Voting Against Le Pen Implies Voting For Macron
France: More Than Just A Déjà-Vu
France: More Than Just A Déjà-Vu
The results of the regional elections held last month confirm this analysis. The motivation to keep Le Pen and her Rassemblement National (National Rally) party out of power is still strong (see Box 1). The poor showing of the National Rally means she won’t be able to maintain her current momentum in her personal approval ratings. Box 1 2021 Regional Elections: Bad Omen For Marine Le Pen In Revival Of The Center-Right? The regional elections took place on June 20 and 27. While limited in relevance for the 2022 presidential race, the result of extremely low voter turnout, regional elections offer a gauge of how constituents feel about the political offerings from anti-establishment parties. Le Pen’s party suffered a heavy blow. It had hoped to consolidate power and build momentum ahead of the presidential election, but it failed even to win in its stronghold of Southern France. Meanwhile, Macron’s party (La République En Marche!) also disappointed. This outcome is not surprising; the local elections last year yielded similar results, highlighting the lack of presence at the local and regional levels for the four-year-old party. The surprise came from the center-right. It managed to win seven of the thirteen regions, beating far-right candidates by wide margins. Importantly, Xavier Bertand, Valérie Pécresse, and Laurent Wauquiez, all predicted to run for president next year, held onto their seats. Chart 5Strong Demographic Base In The Second Round
France: More Than Just A Déjà-Vu
France: More Than Just A Déjà-Vu
Both candidates’ demographic bases have remained the same. Macron is still popular among Millennials, white collar workers, and the elderly (Chart 5). He also has a strong base in Paris (and the suburbs) as opposed to Le Pen, and he still outperforms Le Pen among rural voters in today’s polls. Macron also scores high among the employees of the public sector—even though he is in favor of a smaller public sector. Furthermore, the unemployed mostly favor him, which reinforces the perception that he is the best candidate to improve the French economy and cut the unemployment rate. What if Le Pen fails to make it into the second round of the election? We discuss this possibility in the next section. Risks To The Base Case Scenario The greatest risks to our view are a setback in the economic recovery, an outperformance from the center-right, and the emergence of a dark horse. The latest developments in the UK and Israel, where a large share of the population is fully vaccinated, suggest that the “Delta” variant of COVID-19 remains a threat, with the potential to send economies back into lockdowns. The consequences would be dire for Macron. His chances at re-election would likely evaporate if his government imposed new lockdown measures. What about presidential candidates other than Le Pen? Our base case scenario that Macron will win is based on two assumptions: (1) the center-left Socialist Party will remain in shambles, and (2) the center-right remains scattered under different banners and will therefore lack unity. There is very little chance that the center-left will make a comeback in time, but the results from the regional elections suggest that the center-right could surprise to the upside (see Box 1), especially if it decides to rally behind a single candidate ahead of the first round. Could this candidate be a dark horse? Former Prime Minister Edouard Philippe or outsider candidate Xavier Bertrand could make formidable opponents to both Macron and Le Pen. Philippe’s personal approval rating currently stands at 50%, the highest among French politicians. He also appeals to constituents of all political leanings (Chart 6). This scenario could reshuffle the likely outcomes of both the first and second round of the election. Both Bertand and Philippe could win over voters who decided to side with Le Pen in 2017, while Philippe can compete with Macron over LREM voters. Additionally, Xavier Bertrand cuts into Le Pen’s support since he has made blue collar workers and the middle-class a priority. However, Macron and Le Pen each enjoy a strong voters’ base. It is necessary to monitor whether Valérie Pécresse (Soyons libres) and Laurent Wauquiez (Les Républicains) can be brought to endorse Xavier Bertrand ahead of the first round in 2022. Chart 6Edouard Philippe: From Ally To Outcast To Challenger?
France: More Than Just A Déjà-Vu
France: More Than Just A Déjà-Vu
Beyond The Election Aside from the presidency, the outstanding question is the makeup of the National Assembly in 2022. Macron is not likely to enjoy the strong single-party legislative majority of his first term or to gain control of the Senate. Consequently, he will be more constrained in the legislature in a second term. Nonetheless, the demand for a better economy and a healthier job market requires pro-productivity reforms, which the public knows, and Macron has made reform his banner. Other conventional parties will come under pressure to support Macron’s reform agenda, even though that agenda will be less ambitious than it was in his first term. Chart 7Strong Presence Of Right-Leaning Forces
Strong Presence Of Right-Leaning Forces
Strong Presence Of Right-Leaning Forces
Efforts at cutting back the size of the state are still likely, even though the pandemic has helped rather than hurt statism. This is because the French median voter, who never witnessed the degree of neoliberal reform that took place in the Anglo-Saxon world, has grown weary of the economy’s inefficiencies, just as the Anglo-Saxons have grown weary of laissez-faire neoliberalism. Before the pandemic, the French people understood the need to reduce the size of the state. After all, a larger state implies a larger cost burden borne by both households and corporations. When faced with the choice between paying the bill for the government’s fiscal response to COVID-19 (through higher taxes), or undertaking reforms aiming at reducing the size of the state, the French people will pick the former. Moreover, centrist forces will hold sway in the legislature (Chart 7); hence, some kind of budget normalization is expected in 2023 or thereafter. Other structural reforms If Macron wins would include pension reforms. We should also expect measures to push French companies to bring activities back to France, as well as a greater focus on leading France on the green path. Bottom Line: Barring major surprises, President Macron will be re-elected in 2022. There is a risk to our view if a center-right candidate defeats Le Pen to make it to the second round of the election. Either Macron or a center-right presidency would see a continuation of the structural reforms started in 2017, but with a longer process for coalition-building in the National Assembly. Investment Implications The French economy is currently experiencing an economic upswing. Three factors explain this pick-up: ultra-accommodative monetary conditions in Europe, fiscal largesse, and considerable pent-up demand. In 2021, GDP is projected to expand by 5.75% in annual average terms, higher than the Euro Area average of 4.6%. It should then grow by 4% in 2022 and by 2% in 2023. We remain bullish on French equities on a secular basis, as long as the elections result in further incremental structural reforms over time. As the election draws nearer, investors should treat any French OAT/German Bund spread widening as a buying opportunity and purchase the euro on any election-related dip. French Equities The CAC40 and French equities have had a good run since the beginning of the year. In absolute terms, the CAC40 is one of the best performers year-to-date, up +17%, driven by the outperformance of French consumer discretionary and financials equities, both in absolute and relative terms. However, a period of turbulence is appearing on the horizon; the shift in global growth drivers, the beginning of the global liquidity withdrawal, and lingering COVID worries are creating headwinds for the cyclicals-to-defensives ratio this summer. As such, we recently recommended investors downgrade cyclical equities tactically in Europe from overweight to neutral. With 66% in cyclicals, the French MSCI equity index will underperform in this environment, especially relative to the more defensive Spanish market (Table 5). Table 5Cyclicals Versus Defensives In European Markets
France: More Than Just A Déjà-Vu
France: More Than Just A Déjà-Vu
Chart 8Three Trade Ideas
Three Trade Ideas
Three Trade Ideas
In fact, our Combined Mechanical Valuation Indicator (CMVI) shows that French consumer discretionary equities are expensive relative to both their European and global peers (Chart 8). Regarding the reform theme, we stick with our long French industrial equities / short German industrial equities on a long-term horizon (Chart 8, second and third panel). The idea is that French reforms should suppress unit labor costs and make French exports more competitive vis-à-vis their main competitor, Germany. The latter faces a leftward shift in policy in elections this September. Finally, we recommend investors go long French tech stocks relative to their European counterparts. This sector is cheap (Chart 8, bottom panel), and the French tech sector will be supported by additional government spending of EUR7 billion on digital investments over the next two years. Bond Markets & FX A dovish ECB is consistent with a continued overweight in European peripheral bonds and an underweight stance on French government bonds. Chart 9Just Buy The Dip
Just Buy The Dip
Just Buy The Dip
What is more relevant with respect to the French election is the OAT/Bund spread. In the past, unusually wide spreads between the two represented a euro breakup premium. In early 2017, spreads widened when the approval rating of Le Pen increased (Chart 9). However, since “Frexit” and the abandonment of the euro are no longer part of Le Pen’s agenda, investors should view spread widening as a buying opportunity. Similarly, investors should buy the euro on any election-related dip, particularly following the first round. “Frexit” has been removed from the equation, hence the euro should not weaken on breakup risk this time around. Bottom Line: We remain bullish on French equities within a European portfolio on a secular basis. If our views on the cyclicals-to-defensives ratio materialize in the near-term, highly cyclical French equities will temporarily underperform, unlike the more defensive Spanish market. On a 3- to 12-month horizon, investors should short French consumer discretionary equities relative to both their European and global counterparts. Current valuations suggest that betting on the booming French tech sector at the expense of its European neighbors will be profitable. Once the election draws nearer, investors should treat any French OAT/German Bund spread widening as a buying opportunity and purchase the euro on any election-related dip. Jeremie Peloso, Associate Editor JeremieP@bcaresearch.com
Highlights Three distinct forces are likely to make South Asia’s geopolitical risks increasingly relevant to global investors. First, India’s tensions with China stem from China’s growing foreign policy assertiveness and India’s shift away from traditional neutrality toward aligning with the US and its allies. This creates a security dilemma in South Asia, just as in East Asia. Second, India’s economy is sputtering in the wake of the COVID-19 pandemic, adding fuel to nationalism and populism in advance of a series of important elections. India will stimulate the economy but it could also become more reactive on the international scene. Third, the US is withdrawing from Afghanistan and negotiating a deal with Iran in an effort to reduce the US military presence in the Middle East and South Asia. This will create a scramble for influence across both regions and a power vacuum in Afghanistan that is highly likely to yield negative surprises for India and its neighbors. Traditionally geopolitical risks in South Asia have a limited impact on markets. India’s growth slowdown and forthcoming fiscal stimulus are more relevant for investors. However, a sharp rise in geopolitical risk would undermine India’s structural advantages as the West diversifies away from China. Stay short Indian banks. Feature Geopolitical risks in South Asia are slowly but surely rising. India-Pakistan and China-India are well-known “conflict-dyads” or pairings. Historically, these two sets have been fighting each other over their fuzzy Himalayan border with limited global financial market consequences. But now fundamental changes are afoot that are altering the geopolitical setting in the region. Specifically, the coming together of three distinct forces could trigger a significant geopolitical event in South Asia. The three forces are as follow: Force #1: Sino-Indian Tensions Get Real About a year ago, Indian and Chinese troops clashed in Ladakh, a disputed territory in the Kashmir region. Following these clashes China reduced its military presence in the Pangong Tso area but its presence in some neighboring areas remains meaningful. Besides the troop build-up along India’s eastern border, China is building more air combat infrastructure in its India-facing western theatre. China’s major air bases have historically been concentrated in China’s eastern region, away from the Indian border (Map 1). Consequently, India has historically enjoyed an advantage in airpower. But China appears to be working to mitigate this disadvantage. Map 1Most Of China’s Major Aviation Units Are Located Away From India
South Asia: A Slowdown And A Showdown
South Asia: A Slowdown And A Showdown
Owing to China’s increased military focus along the Sino-India border, India’s threat perception of China has undergone a fundamental change in recent years. Notably, India has diverted some of its key army units away from its western Indo-Pak border towards its eastern border with China. India could now have nearly 200,000 troops deployed along its border with China, which would mark a 40% increase from last year.1 Turning attention to the Indo-Pak border, India’s problems with Pakistan appear under control for now. This is owing to the ceasefire agreement that was renewed by the two countries in February 2021. However, this peace cannot possibly be expected to last. This is mainly because core problems between the two countries (like Pakistan’s support of militant proxies and India’s control over Kashmir) remain unaddressed. History too suggests that bouts of peace between the two warring neighbors rarely last long. These bouts usually end abruptly when a terrorist attack takes place in India. With both political turbulence and economic distress in Pakistan rising, the fragile ceasefire between India and Pakistan could be upended over the next six months. In fact, two events over the last week point to the fragility of the ceasefire: Two drones carrying explosives entered an Indian air force station located in Jammu and Kashmir (i.e. a northern territory that India recently reorganized, to Pakistan’s chagrin). Even as no casualties were reported, this attack marks a turning point for terrorist activity in India as this was the first-time terrorists used drones to enter an Indian military base. Hours later, another drone attack struck an Indian base at the Ratnuchak-Kaluchak army station, the site of a major terrorist attack in 2002. Chart 1China, Pakistan And India Cumulatively Added 41 Nuclear Warheads Over 2020
South Asia: A Slowdown And A Showdown
South Asia: A Slowdown And A Showdown
Given that the ceasefire was agreed recently, any further increase in terrorist activity in India over the next six months would suggest that a more substantial breakdown in relations is nigh. Distinct from these recent tensions, China’s troop deployment along India’s eastern arm and Pakistan’s presence along India’s western arm creates a strategic “pincer” that increasingly threatens India. India is naturally concerned. China and Pakistan are allies who have been working closely on projects including the strategic China-Pakistan Economic Corridor (CPEC). The CPEC is a collection of infrastructure projects in Pakistan that includes the development of a port in Gwadar where a future presence of the People's Liberation Army Navy (PLAN) is envisaged. Gwadar has the potential of providing China land-based access to the Indian Ocean. Trust in the South Asian region is clearly running low. Distinct from troop build-ups and drone-attacks, China, Pakistan, and India cumulatively added more than 40 nuclear warheads over the last year (Chart 1). China is reputed to be engaged in an even larger increase in its nuclear arsenal than the data show.2 From a structural perspective, too, geopolitical risks in the South Asian peninsula are bound to keep rising. When it comes to the conflicting Indo-Pak dyad, India’s geopolitical power has been rising relative to that of Pakistan in the 2000s. However, the geopolitical muscle of the Sino-Pak alliance is much greater than that of India on a standalone basis (Chart 2). Chart 2India Has Aligned With The QUAD To Counter The Sino-Pak Alliance
South Asia: A Slowdown And A Showdown
South Asia: A Slowdown And A Showdown
China’s active involvement in South Asia is responsible for driving India’s increasing desire to abandon its historical foreign policy stance of non-alignment. India’s membership in the Quadrilateral Security Dialogue (also known as the QUAD, whose other members include the US, Japan, and Australia) bears testimony to India’s active effort to develop closer relations with the US and its allies (Chart 2). India’s alignment with the US is deepening China’s and Pakistan’s distrust of India. Conventional and nuclear military deterrence should prevent full-scale war. But the regional balance is increasingly fluid which means geopolitical risks will slowly but surely rise in South Asia over the coming year and years. Force #2: A Growth Slowdown Alongside India’s Loaded Election Calendar The pandemic has hit the economies of South Asia particularly hard. South Asia historically maintained higher real GDP growth rates relative to Emerging Markets (EMs). But in 2021, this region’s growth rate is set to be lower than that of EM peers (Chart 3). History is replete with examples of a rise in economic distress triggering geopolitical events. South Asia is characterized by unusually low per capita incomes (Chart 4) and the latest slowdown could exacerbate the risk of both social unrest and geopolitical incidents materialising. Chart 3South Asian Economies Have Been Hit Hard By The Pandemic
South Asia: A Slowdown And A Showdown
South Asia: A Slowdown And A Showdown
Chart 4South Asia Is Characterized By Very Low Per Capita Incomes
South Asia: A Slowdown And A Showdown
South Asia: A Slowdown And A Showdown
To complicate matters a busy state elections calendar is coming up in India. Elections will be due in seven Indian states in 2022. These states account for about 25% of India’s population. State elections due in 2022 will amount to a high-stakes political battle. During state elections in 2021, the ruling Bharatiya Janata Party (BJP) was the incumbent in only one of the five states. In 2022, the BJP is the incumbent party in most of the states that are due for elections, which means it has the advantage but also has a lot to lose, especially in a post-pandemic environment. Elections kick off in the crucial state of Uttar Pradesh next February. Last time this state faced elections Prime Minister Narendra Modi was willing to go to great lengths to boost his popularity ahead of time. Specifically, he upset the nation with a large-scale and unprecedented de-monetization program. Given the busy state election calendar in 2022, we expect the BJP-led central government to focus on policy actions that can improve its support among Indian voters. Two policies in particular are likely to come through: Fiscal Stimulus Measures To Provide Economic Relief: India has refrained from administering a large post-pandemic stimulus thus far. As per budget estimates, the Indian central government’s total expenditure in FY22 is set to increase only by 1% on a year-on-year basis. But the expenditure-side restraint shown by India’s central government could change. With elections and a pandemic (which has now claimed over 400,000 lives in India), the central government could consider a meaningful increase in spending closer to February 2022. Map 2Northern India Views Pakistan Even More Unfavorably Than Rest Of India
South Asia: A Slowdown And A Showdown
South Asia: A Slowdown And A Showdown
India’s Finance Minister already announced a fiscal stimulus package of $85 billion (amounting to 2.8% of GDP) earlier this week. Whilst this stimulus entails limited fresh spending (amounting to about 0.6% of India’s GDP), we would not be surprised if the government follows it up with more spending closer to February 2022. Assertive Foreign Policy To Ward-Off Unfriendly Neighbors: India’s northern states are known to harbor unfavorable views of Pakistan (Map 2). The roots of this phenomenon can be traced to geography and the bloody civil strife of 1947 that was triggered by the partition of British-ruled India into the two independent dominions of India and Pakistan. Given the north’s unfavorable views of Pakistan and given looming elections, Indian policy makers may be forced to adopt a far more aggressive foreign policy response, to any terrorist strikes from Pakistan or territorial incursions by China. This kind of response was observed most recently ahead of the Indian General Elections in April-May 2019. An Indian military convoy was attacked by a suicide-bomber in early February 2019 and a Pakistan-based terrorist group claimed responsibility. A fortnight later the Indian air force launched unexpected airstrikes across the Line of Control which were then followed by the Pakistan air force conducting air strikes in Jammu and Kashmir. While the next round of Pakistani and Indian general elections is not due until 2023 and 2024, respectively, it is worth noting that of the seven state elections due in India in 2022, four are in the north (Uttar Pradesh, Punjab, Uttarakhand, and Himachal Pradesh). Force #3: Power Vacuum In Afghanistan The final reason to be wary of the South Asian geopolitical dynamic is the change in US policy: both the Iran nuclear deal expected in August and the impending withdrawal from Afghanistan in September. The US public has now elected three presidents on the demand that foreign wars be reduced. In the wake of Trump and populism the political establishment is now responding. Therefore Biden will ultimately implement both the Iran deal and the Afghan withdrawal regardless of delays or hang-ups. But then he will have to do damage control. In the case of Iran, a last-minute flare-up of conflict in the region is likely this summer, as the US, Israel, Saudi Arabia, and Iran underscore their red lines before the US and Iran settle down to a deal. Indeed it is already happening, with recent US attacks against Iran-backed Shia militias in Syria and Iraq. A major incident would push up oil prices, which is negative for India. But the endgame, an Iranian economic opening, is positive for India, since it imports oil and has had close relations with Iran historically. In the case of Afghanistan, the US exit will activate latent terrorist forces. It will also create a scramble for influence over this landlocked country that could lead to negative surprises across the region. The first principle of the peace agreement between the US and Afghanistan states that the latter will make all efforts to ensure that Afghan soil is not used to further terrorist activity. However, the enforceability of such a guarantee is next to impossible. Notably, the US withdrawal from Afghanistan will revive the Taliban’s influence in the region. This poses major risks for India, which has a long history of being targeted by Afghani terrorist groups. The Taliban played a critical role in the release of terrorists into Pakistan following the hijacking of an Indian Airlines flight in 1999. Furthermore, the Haqqani network, which has pledged allegiance to the Taliban, has attacked Indian assets in the past. Any attack on India deriving from the power vacuum in Afghanistan would upset the precarious regional balance. Whilst there are no immediate triggers for Afghani groups to launch a terrorist attack in India, the US withdrawal will trigger a tectonic shift in the region. Negative surprises emanating from Afghanistan should be expected. Investment Conclusions Chart 5Indian Banks Appear To Have Factored In All Positives
Indian Banks Appear To Have Factored In All Positives
Indian Banks Appear To Have Factored In All Positives
We reiterate the need to pare exposure to Indian assets on a tactical basis. India’s growth engine is likely to misfire over the second half of the Indian financial year. Macroeconomic headwinds pose the chief risk for investors, but major geopolitical changes could act as a negative catalyst in the current context. So we urge clients to stay short Indian Banks (Chart 5). Financials account for the lion’s share of India’s benchmark index (26% weight). India could opt for an unexpected expansion in its fiscal deficit soon. Whilst we continue to watch fiscal dynamics closely, we expect the fiscal expansion to materialize closer to February 2022 when India’s most populous state (i.e. Uttar Pradesh) will undergo elections. Over the long run, India’s sense of insecurity will escalate in the context of a more assertive China, stronger Sino-Pakistani ties, and a power vacuum in Afghanistan. For that reason, New Delhi will continue to shed its neutrality and improve relations with the US-led coalition of democratic countries, with an aim to balance China. This process will feed China’s insecurity of being surrounded and contained by a hegemonic American system. This security dilemma is a source of South Asian geopolitical risk that will become more globally relevant over time. China’s conflict with the US and western world should create incentives for India to attract trade and investment. However, its ability to do so will be contingent upon domestic political factors and regional geopolitical factors. Ritika Mankar, CFA Editor/Strategist ritika.mankar@bcaresearch.com Matt Gertken Vice President Geopolitical Strategy mattg@bcaresearch.com Footnotes 1 Sudhi Ranjan Sen, ‘India Shifts 50,000 Troops to China Border in Historic Move’, Bloomberg, June 28, 2021, bloomberg.com. 2 Joby Warrick, “China is building more than 100 missile silos in its western desert, analysts say,” Washington Post, June 30, 2021, washingtonpost.com.

Weekly Performance Update For the week ending Thu Jul 01, 2021 The Market Monitor displays the trailing 1-quarter performance of strategies based around the BCA Score. For each region, we construct an equal-weighted, monthly rebalanced portfolio consisting of the top 3 stocks per sector and compare it with the regional benchmark. For each portfolio, we show the weekly performance of individual holdings in the Top Contributors/Detractors table. In addition, the Top Prospects table shows the holdings that currently have the highest BCA Score within the portfolio. For more details, click the region headers below to be redirected to the full historical backtest for the strategy. BCA US Portfolio
Market Monitor (Jul 1, 2021)
Market Monitor (Jul 1, 2021)
Total Weekly Return BCA US Portfolio S&P500 TRI 1.13% 1.27% Top Contributors TX:US AN:US UHAL:US LH:US IT:US Weekly Return 24 bps 18 bps 16 bps 15 bps 13 bps Top Detractors ENBL:US JLL:US PSB:US ET:US ESGR:US Weekly Return -7 bps -7 bps -6 bps -6 bps -5 bps Top Prospects ESGR:US ANAT:US MPLX:US BRK.A:US TX:US BCA Score 97.67% 97.62% 97.18% 96.50% 95.46% BCA Canada Portfolio
Market Monitor (Jul 1, 2021)
Market Monitor (Jul 1, 2021)
Total Weekly Return BCA Canada Portfolio S&P/TSX TRI -0.24% -0.13% Top Contributors TOU:CA CCA:CA CS:CA CFP:CA QBR.A:CA Weekly Return 21 bps 19 bps 12 bps 8 bps 6 bps Top Detractors IMO:CA CRON:CA LNR:CA BB:CA LNF:CA Weekly Return -17 bps -12 bps -10 bps -10 bps -7 bps Top Prospects LNF:CA CS:CA RUS:CA IFP:CA NWC:CA BCA Score 99.30% 99.16% 98.35% 98.15% 97.74% BCA UK Portfolio
Market Monitor (Jul 1, 2021)
Market Monitor (Jul 1, 2021)
Total Weekly Return BCA UK Portfolio FTSE 100 TRI 0.87% 0.23% Top Contributors NVTK:GB DEC:GB NFC:GB CMCX:GB TUNE:GB Weekly Return 28 bps 21 bps 17 bps 17 bps 16 bps Top Detractors NLMK:GB FDEV:GB SVST:GB RMG:GB GROW:GB Weekly Return -14 bps -11 bps -7 bps -6 bps -5 bps Top Prospects SVST:GB NLMK:GB GLTR:GB GROW:GB N91:GB BCA Score 99.74% 99.62% 98.33% 97.69% 95.88% BCA Eurozone Portfolio
Market Monitor (Jul 1, 2021)
Market Monitor (Jul 1, 2021)
Total Weekly Return BCA EMU Portfolio MSCI EMU TRI 0.52% -0.67% Top Contributors TL5:ES STR:AT ROVI:ES TESB:BE CNV:FR Weekly Return 17 bps 13 bps 12 bps 10 bps 9 bps Top Detractors FDJ:FR FLUX:BE IPN:FR MONT:BE LOUP:FR Weekly Return -14 bps -9 bps -6 bps -6 bps -6 bps Top Prospects STR:AT CNV:FR FDJ:FR POST:AT LOUP:FR BCA Score 99.56% 98.38% 97.45% 97.13% 96.28% BCA Japan Portfolio
Market Monitor (Jul 1, 2021)
Market Monitor (Jul 1, 2021)
Total Weekly Return BCA Japan Portfolio TOPIX TRI 0.80% -0.29% Top Contributors 3468:JP 9543:JP 8595:JP 8979:JP 4326:JP Weekly Return 16 bps 16 bps 12 bps 11 bps 10 bps Top Detractors 3291:JP 9532:JP 5122:JP 4966:JP 6345:JP Weekly Return -11 bps -6 bps -5 bps -5 bps -3 bps Top Prospects 4966:JP 8133:JP 3291:JP 8117:JP 6960:JP BCA Score 99.28% 99.12% 98.82% 98.25% 97.84% BCA Hong Kong Portfolio
Image
Total Weekly Return BCA Hong Kong Portfolio Hang Seng TRI 0.08% 0.01% Top Contributors 316:HK 2380:HK 28:HK 1606:HK 2877:HK Weekly Return 41 bps 13 bps 11 bps 10 bps 10 bps Top Detractors 468:HK 1898:HK 3600:HK 1277:HK 98:HK Weekly Return -25 bps -22 bps -11 bps -10 bps -10 bps Top Prospects 1277:HK 98:HK 1839:HK 2232:HK 857:HK BCA Score 99.98% 99.06% 98.97% 98.49% 98.28% BCA Australia Portfolio
Market Monitor (Jul 1, 2021)
Market Monitor (Jul 1, 2021)
Total Weekly Return BCA Australia Portfolio S&P/ASX All Ord. TRI 1.10% 0.17% Top Contributors GRR:AU JLG:AU FLN:AU HVN:AU CAJ:AU Weekly Return 28 bps 27 bps 20 bps 18 bps 17 bps Top Detractors NEW:AU PSQ:AU ORG:AU NEC:AU NHC:AU Weekly Return -17 bps -12 bps -12 bps -10 bps -9 bps Top Prospects ZIM:AU BSE:AU AGI:AU BFG:AU PIC:AU BCA Score 98.58% 97.70% 97.27% 96.91% 96.82%
Dear Client, We are sending you our Strategy Outlook today, where we outline our thoughts on the macro landscape and the direction of financial markets for the rest of 2021 and beyond. Next week, please join me for a webcast on Thursday, July 8 at 10:00 AM EDT (3:00 PM BST, 4:00 PM CEST, 10:00 PM HKT) where I will discuss the outlook. Best regards, Peter Berezin, Chief Global Strategist Highlights Macroeconomic Outlook: Global growth is peaking but will remain solidly above trend. While the proliferation of the Delta strain is likely to trigger another wave of Covid cases this summer, the economic impact will be far smaller than during past waves. Global Asset Allocation: The risk-reward profile for stocks has deteriorated since the start of the year. Nevertheless, with few signs that the global economy is heading towards another major downturn, investors should maintain a modest equity overweight on a 12-month horizon. Equities: Favor cyclicals, value-oriented, and non-US equities. Emerging markets should spring back to life in the autumn once vaccine supplies increase and Chinese fiscal policy turns more stimulative. Fixed Income: Maintain below average interest-rate duration exposure. The 10-year US Treasury yield will finish the year at 1.9%. Spread product will continue to outperform high quality government bonds. Currencies: The US dollar will resume its weakening trend as growth momentum rotates from the US to the rest of the world. EUR/USD will finish the year at 1.25. Commodities: Brent will rise to $79/bbl by end-2021, 9% above current market expectations. While the lagged effects from the slowdown in Chinese credit growth earlier this year will weigh on base metals during the summer months, the long-term outlook for metals is positive. Favor gold over cryptos as an inflation hedge. I. Macroeconomic Outlook Global Vaccination Campaign Kicks Into High Gear Nearly 18 months after the pandemic began, the global economy is on the mend. In its latest round of forecasts released on May 31st, the OECD projects that the global economy will expand by 5.8% this year, up from its March projection of 5.6%. The OECD also bumped up its growth forecast for 2022 from 4% to 4.4%. After a rough start, the vaccination campaign is progressing well in most advanced economies (Chart 1). The US and the UK were the first major developed economies to roll out the vaccines, followed by Canada and the EU. While Japan has lagged behind, the pace of vaccinations has picked up lately. Twenty percent of the Japanese population has now received at least one dose. Developing economies are still struggling to secure enough vaccines. Fortunately, this problem should abate over the next six months. The Global Health Innovation Center at Duke University estimates that pharmaceutical companies are on track to produce more than 10 billion vaccine doses this year (Chart 2). While perhaps not enough to inoculate everyone who wants a jab, it will suffice in providing protection to the most vulnerable members of society – the elderly and those with pre-existing medical conditions. Chart 1The Vaccination Campaign Is Progressing Well In Most Developed Economies
The Vaccination Campaign Is Progressing Well In Most Developed Economies
The Vaccination Campaign Is Progressing Well In Most Developed Economies
Chart 2Vaccine Makers Are On Track To Produce Over 10 Billion Doses In 2021
2021 Third Quarter Strategy Outlook: The Path To Normal
2021 Third Quarter Strategy Outlook: The Path To Normal
New Variants And Vaccine Hesitancy Are Risks Novel strains of the virus remain a concern. First identified in India, the so-called “Delta variant” is spreading around the world. The number of new cases in the UK, where the Delta variant accounts for over 90% of all new infections, is rising again (Chart 3). The latest outbreak has forced the government to postpone “Freedom Day” from June 21st to July 19th (Chart 4). Chart 3The Number Of New Cases In The UK Is Rising Anew
2021 Third Quarter Strategy Outlook: The Path To Normal
2021 Third Quarter Strategy Outlook: The Path To Normal
Chart 4Dismantling Of Lockdown Measures Occurring At Varying Pace
2021 Third Quarter Strategy Outlook: The Path To Normal
2021 Third Quarter Strategy Outlook: The Path To Normal
It is highly likely that the Delta variant will produce another wave of cases in the US this summer. Despite ample availability, one-third of Americans over the age of 18 have yet to receive a single dose of a vaccine. As is the case with most everything in the United States, the question of whether to be inoculated has become politicized. In many Republican-leaning states, more than half the population remains unvaccinated (Chart 5). Chart 5The US Politicization Of Vaccines Raises The Risk From COVID-19 Variants
2021 Third Quarter Strategy Outlook: The Path To Normal
2021 Third Quarter Strategy Outlook: The Path To Normal
Vaccine hesitancy will likely diminish as the evidence of their effectiveness continues to mount. According to analysis by the Associated Press using CDC data, fully vaccinated people accounted for less than 1% of the 18,000 COVID-19 deaths in the US in May. A study out of the UK showed that two doses of the Pfizer-BioNTech vaccine was 96% effective against hospitalization from the Delta variant, while the Oxford-AstraZeneca vaccine was 92% effective. While another wave of the pandemic will curb growth this summer, the economic impact will be far smaller than in the past. At this point, the initial terror of the pandemic has faded. Politically, it will be more difficult to justify lockdowns in countries such as the US where almost everyone who wants a vaccine has already been able to get one. Macro Policy Outlook: Tighter But Not Tight After cranking the fire hose to full blast during the pandemic, policymakers are looking to scale back support. On the fiscal side, governments are slowly starting to rein in budget deficits. The IMF expects the fiscal impulse in advanced economies to average -4% of GDP in 2022, implying an incrementally tighter fiscal stance (Chart 6). Chart 6Budget Deficits Set To Decline, But Remain High By Historic Standards
2021 Third Quarter Strategy Outlook: The Path To Normal
2021 Third Quarter Strategy Outlook: The Path To Normal
Tighter does not necessarily mean tight, however. The IMF sees advanced economies running an average cyclically-adjusted primary budget deficit of 2.6% of GDP between 2022 and 2026, compared to an average deficit of 1.1% of GDP between 2014 and 2019. In the US, Congress is debating an infrastructure bill, a key element of President Biden’s “Build Back Better” agenda. If the bill fails to move out of the Senate, our geopolitical strategists expect Congress to use the reconciliation process to pass most of Biden’s legislative program. This should result in an additional 1.3% of GDP in federal spending per year over the next 8 years, offset only partly by higher taxes. Chart 7EU Fiscal Policy: Allocations To Southern European Countries Are Relatively Large
EU Fiscal Policy: Allocations To Southern European Countries Are Relatively Large
EU Fiscal Policy: Allocations To Southern European Countries Are Relatively Large
Chart 8Japanese PMIs Stuck In The Mud
Japanese PMIs Stuck In The Mud
Japanese PMIs Stuck In The Mud
In the euro area, the IMF expects fiscal policy to remain structurally looser by nearly 2% of GDP in the post-pandemic period. After six months of parliamentary debates, all 27 EU countries ratified the €750 billion Next Generation fund on May 28th. The allocations from the fund for southern European countries are relatively large (Chart 7). Most of the money will be spent on public investment projects with high fiscal multipliers. Japan has a habit of tightening fiscal policy at exactly the wrong moment, with the October 2019 hike in the sales tax from 8% to 10% being no exception. Unlike in other developed economies, both the Japanese manufacturing and services PMI remain stuck in the mud (Chart 8). The odds are rising that Prime Minister Yoshihide Suga will announce a major stimulus package after the Olympic Games and ahead of the general election due by October 22nd. China: Normalization Not Deleveraging Chart 9China: Weak Infrastructure Spending Should Pick Up
China: Weak Infrastructure Spending Should Pick Up
China: Weak Infrastructure Spending Should Pick Up
In China, strong export growth, propelled by the shift in global spending towards manufactured goods during the pandemic, allowed the government to tighten fiscal policy modestly in the first half of the year. Looking out, fiscal policy should turn more stimulative. Local governments used only 16% of their bond issuance allocation between January and May, compared with 59% over the same period last year and 40% in 2019. Proceeds should benefit infrastructure spending, which has been on the weak side in recent years (Chart 9). After a sharp decline, Chinese credit growth should stabilize in the second half of the year. The current pace of credit growth of 11% is near its 2018 lows and is broadly in line with nominal GDP growth (Chart 10). Given that the authorities have stated their desire to stabilize the ratio of credit-to-GDP, they are unlikely to proactively suppress credit growth further. The recent decline in the 3-month SHIBOR, which usually moves in the opposite direction of credit growth, is evidence to this effect (Chart 11). Chart 10Chinese Credit Growth Should Stabilize In The Second Half Of The Year
Chinese Credit Growth Should Stabilize In The Second Half Of The Year
Chinese Credit Growth Should Stabilize In The Second Half Of The Year
Chart 11China: Easing Off The Brakes?
China: Easing Off The Brakes?
China: Easing Off The Brakes?
Nevertheless, changes in fiscal and credit policy tend to affect the Chinese economy with a lag (Chart 12). Thus, the tightening in fiscal policy and the deceleration in credit growth that occurred early this year could still weigh on economic activity during the summer months. Chart 12China: Changes In Fiscal And Credit Policy Affect The Economy With A Lag
China: Changes In Fiscal And Credit Policy Affect The Economy With A Lag
China: Changes In Fiscal And Credit Policy Affect The Economy With A Lag
Don’t Sweat The Dot Plot Markets interpreted the June FOMC meeting in a hawkish light. Both the 2-year and 5-year yield jumped 10 basis points following the meeting (Table 1). The US dollar, which is quite sensitive to changes in short-term rate expectations, strengthened by nearly 2%. In contrast, long-term bond yields declined following the meeting, with the 10-year and 30-year bond yield falling by 6 and 19 basis points, respectively. Table 1Change In Yields Following June FOMC Meeting
2021 Third Quarter Strategy Outlook: The Path To Normal
2021 Third Quarter Strategy Outlook: The Path To Normal
As long duration assets, stocks take their cues more from long-term yields than short-term rates. Hence, it was not surprising that equities held their ground, and that growth stocks reversed some of their underperformance against value stocks this year. Chart 13Markets Interpreted The June FOMC Meeting In A Hawkish Light
Markets Interpreted The June FOMC Meeting In A Hawkish Light
Markets Interpreted The June FOMC Meeting In A Hawkish Light
This publication agrees with BCA’s bond strategists that the market overreacted to the changes in the Fed’s projections (aka “the dots”). As Chair Powell himself noted during the press conference, the dot plot is “not a great forecaster of future rate moves,” before adding that “Lift-off is well into the future.” The market is currently pricing in 105 basis points of tightening by the end of 2023. Prior to the meeting, investors were expecting 85 basis points in rate hikes (Chart 13). The regional Fed presidents tend to be more hawkish than the Board of Governors. Our guess is that Jay Powell himself only penciled in one hike for 2023. Lael Brainard, who may be replacing Powell next year, likely projects no hikes for 2023. The Path To Full Employment Chart 14The Divergence Of Goods And Services Spending
The Divergence Of Goods And Services Spending
The Divergence Of Goods And Services Spending
Rather than obsessing over the dots, investors should focus on the questions that will actually drive Fed policy, namely how long it takes the US economy to return to full employment and what happens to inflation in the interim and beyond. There is a lot of uncertainty over these questions – both on the demand side (how fast will spending recover?) and the supply side (how much labor market slack is there and how quickly can firms ramp up hiring?). On the demand side, the pandemic led to unprecedented changes in household spending and saving behavior. As Chart 14 shows, goods spending surged while services spending collapsed. Overall spending declined, and together with increased transfer payments, savings ballooned. As of May, US households were sitting on $2.5 trillion in excess savings. Looking at disaggregated bank deposit data as a proxy for the distribution of household savings, the wealthiest 10% of households accounted for about 70% of the increase in savings between Q1 of 2020 and Q1 of 2021 (Chart 15). Given that richer households have relatively low marginal propensities to spend, this suggests that a large fraction of these excess savings will remain unspent. Nevertheless, $2.5 trillion is a lot of money – it’s equal to almost 17% of annual consumption. Hence, even if a third of this cash hoard were to make its way into the economy, it could buoy aggregate demand significantly. Chart 15Excess Savings Have Mostly Flowed To The Rich
2021 Third Quarter Strategy Outlook: The Path To Normal
2021 Third Quarter Strategy Outlook: The Path To Normal
A Labor Market Puzzle Turning to the supply side, there were over 4% fewer people employed in the US in May than in January 2020 (Chart 16). On the face of it, this would suggest the presence of a significant amount of labor market slack. Chart 16US Employment Still More Than 4% Below Pre-Pandemic Levels
2021 Third Quarter Strategy Outlook: The Path To Normal
2021 Third Quarter Strategy Outlook: The Path To Normal
Yet, the NFIB small business survey tells a different story. It revealed that 48% of firms reported difficulty in filling vacant positions in May, the highest percentage of respondents in the 46-year history of the survey (Chart 17). Chart 17US Labor Market Shortages (I)
US Labor Market Shortages (I)
US Labor Market Shortages (I)
Chart 18US Labor Market Shortages (II)
US Labor Market Shortages (II)
US Labor Market Shortages (II)
Along the same lines, the nationwide job openings rate reached a record high of 6% in April, up from 4.5% in January 2020. The quits rate, a good proxy for worker confidence, is also at a record high (Chart 18). How does one reconcile the low level of employment with other data pointing to a tight labor market? As we discussed in a report two weeks ago, four explanations stand out: Generous unemployment benefits, which have depressed labor force participation among low-wage workers (Chart 19). Chart 19Labor Scarcity Prevalent In Low-Wage Sectors
2021 Third Quarter Strategy Outlook: The Path To Normal
2021 Third Quarter Strategy Outlook: The Path To Normal
Chart 20School Closures Have Curbed Labor Supply
2021 Third Quarter Strategy Outlook: The Path To Normal
2021 Third Quarter Strategy Outlook: The Path To Normal
Pandemic-related school closures. As Chart 20 shows, they have had a noticeable impact on labor force participation among women with young children. Reduced immigration. At one point during the pandemic, visa issuance was down 99% from pre-pandemic levels (Chart 21). An increase in early retirements. We estimate that about 1.5 million more workers retired during the pandemic than would have been expected based solely on demographic trends (Chart 22). Chart 21US Migrant Worker Supply Is Depressed
2021 Third Quarter Strategy Outlook: The Path To Normal
2021 Third Quarter Strategy Outlook: The Path To Normal
Chart 22The Pandemic Accelerated Early Retirement
The Pandemic Accelerated Early Retirement
The Pandemic Accelerated Early Retirement
All but the last effect is likely to be fleeting. Enhanced unemployment benefits expire in September; President Biden has reversed President Trump’s ban on most worker visas; and schools should fully reopen by the fall. And even for the retirement effect, most recent retirees were approaching retirement age anyway. Thus, there will likely be fewer incremental retirements over the next few years. A Speed Limit To Hiring? Assuming that a large fraction of sidelined workers return to the labor market in the fall, how fast will firms be able to hire them? In general, we are skeptical of arguments claiming that there is much of a speed limit to the pace of hiring. Chart 23There Is A Lot Of Churn In The Labor Market
There Is A Lot Of Churn In The Labor Market
There Is A Lot Of Churn In The Labor Market
There is a lot of churn in the labor market. Gross job flows are much larger than net flows. Between 2015 and 2019, 66.1 million people were hired on average per year compared with 59.6 million who quit or were discharged. Churn is especially strong in the retail and hospitality sectors, the two segments that account for the bulk of today’s shortfall in jobs. In April of this year, retailers hired nearly 800,000 workers. An additional 1.42 million workers found jobs in the leisure and hospitality sectors. This is equivalent to 5.3% and 10.1% of total employment in those sectors, respectively (Chart 23). And remember, we are talking about only one month’s worth of hiring. During past V-shaped recoveries, employment growth often surpassed 5% on a year-over-year basis (Chart 24). Such a growth rate would produce net 670K new jobs per month, enough to restore full employment by mid-2022. Chart 24V-Shaped Recoveries Are Generally Followed By Strong Labor Market Recoveries
V-Shaped Recoveries Are Generally Followed By Strong Labor Market Recoveries
V-Shaped Recoveries Are Generally Followed By Strong Labor Market Recoveries
The Fed’s Three Criteria For Lift-Off In August of 2020, the Fed formally adopted a “flexible average inflation targeting” framework. It seeks to offset periods of below-target inflation with periods of above-target inflation. The goal is to better anchor long-term inflation expectations, while giving households and firms more clarity over where the price level will be many years out. In the spirit of this new framework, the Fed has made it clear that it needs to see three things before it considers raising rates: The labor market must be at “maximum employment” 12-month PCE inflation must be above 2% The FOMC must expect inflation to remain above 2% for some time If the US economy achieves full employment by the middle of next year, the first criterion will be satisfied. PCE inflation clocked in at 3.9% in May, so at least for now, the second criterion is satisfied as well. The big question concerns the third criterion. How Transitory Is US Inflation Likely To Be? As Chart 25 shows, more than half of the increase in the CPI in April and May can be explained by higher vehicle prices, along with a rebound in pandemic-affected service prices (airfares, hotels, and event admissions). Outside those sectors, the level of the CPI still remains below its pre-pandemic trend, while the level of the PCE deflator is barely above it (Chart 26). Aside from a few low-wage sectors such as retail and hospitality, overall wage growth remains contained. Neither the Atlanta Fed Wage Growth Tracker nor the Employment Cost Index – the two cleanest measures of US wage inflation – is signaling a brewing wage-price spiral (Chart 27). Chart 25Rebounding Pandemic-Affected Services Prices Are Pushing Up Overall CPI
2021 Third Quarter Strategy Outlook: The Path To Normal
2021 Third Quarter Strategy Outlook: The Path To Normal
Chart 26AUnwinding Of "Base Effects" (I)
Unwinding Of "Base Effects" (I)
Unwinding Of "Base Effects" (I)
Chart 26BUnwinding Of "Base Effects" (II)
Unwinding Of "Base Effects" (II)
Unwinding Of "Base Effects" (II)
Chart 27No Sign Of A Wage-Price Spiral... For Now
No Sign Of A Wage-Price Spiral... For Now
No Sign Of A Wage-Price Spiral... For Now
Chart 28Rising Oil Prices Have Fueled The Jump In Inflation Expectations
2021 Third Quarter Strategy Outlook: The Path To Normal
2021 Third Quarter Strategy Outlook: The Path To Normal
Chart 29Inflation Expectations Back Below The Fed's Target Zone
Inflation Expectations Back Below The Fed's Target Zone
Inflation Expectations Back Below The Fed's Target Zone
Chart 30A Top In Inflation Expectations?
A Top In Inflation Expectations?
A Top In Inflation Expectations?
While inflation expectations have risen, they should fall in the second half of the year as gasoline prices descend from their seasonal highs (Chart 28). Market expectations of inflation have already dipped back below the Fed’s comfort zone (Chart 29). Inflation expectations 5-to-10 years out in the University of Michigan’s Survey of Consumers also dropped from 3% in May to 2.8% in June (Chart 30). Overall producer price inflation should decline. Chart 31 shows that lumber prices, steel prices, agriculture prices, and memory chip prices have all peaked. Taken together, all this suggests that the recent surge in inflation is indeed likely to be “transitory.” Chart 31Input Prices Have Rolled Over
Input Prices Have Rolled Over
Input Prices Have Rolled Over
Risk-Management Considerations Favor A “Go Slow” Approach Chart 32Market Participants See An Even Lower Terminal Rate Than The Fed
Market Participants See An Even Lower Terminal Rate Than The Fed
Market Participants See An Even Lower Terminal Rate Than The Fed
The financial press often characterizes the Fed’s monetary policy as ultra-accommodative. With policy rates near zero, one would be forgiven for agreeing. However, the reality is that neither the Fed nor, for that matter, most market participants think that monetary policy is all that easy. Using expectations for the terminal Fed funds rate as a proxy for the neutral rate of interest, the Fed’s estimate of the terminal rate has fallen from 4.3% in 2012 to 2.5% at present (Chart 32). Surveys of primary dealers and other market participants suggest that investors think the terminal rate is even lower than what the Fed believes it to be. It is an open question as to whether the neutral rate really is as low as widely believed. But if it is, raising rates prematurely would be a grave mistake. Given the zero lower bound constraint on nominal policy rates, the Fed would be hard-pressed to ease monetary policy by enough to respond to any future deflationary shock. In contrast, if inflation proves to be more persistent, raising rates to cool the economy would be relatively straightforward. All this suggests that the Fed is likely to maintain its “go slow” approach. This publication expects tapering of QE to begin early next year, with no rate hike until December 2022 or early 2023. Other Central Banks Constrained By The Fed Chart 33Long-Term Inflation Expectations Remain Subdued
Long-Term Inflation Expectations Remain Subdued
Long-Term Inflation Expectations Remain Subdued
The Fed’s dovish bias limits the ability of other developed economy central banks to tighten monetary policy. For some central banks, such as the ECB and BoJ, raising rates is the last thing they want to do. In both the euro area and Japan, long-term inflation expectations remain well below target (Chart 33). The Bank of England is in a better position to tighten monetary policy than the ECB. Inflation expectations are relatively high in the UK and a frothy housing market poses a long-term threat to economic stability. Nevertheless, the need to maintain a competitive currency to facilitate post-Brexit economic adjustments will limit the BoE’s ability to raise rates. Moreover, the departure of BoE Chief Economist, Andy Haldane, from the MPC will silence the sole voice sounding the alarm over rising inflation. Among the G7 economies, the Bank of Canada is the closest to raising rates. After a slow start, the vaccination campaign is now progressing well there. Property prices have gone through the roof. The Western Canada Select oil price has reached the highest level since 2014. The discount to WTI has shrunk from a peak over 50% in November 2018 to about 20% in recent weeks. The Bank of Canada has already begun tapering asset purchases. While concerns about a stronger loonie will tie the BoC’s hands to some extent, the first rate hike is still likely in mid-2022. II. Financial Markets A. Portfolio Strategy The Golden Rule embraced by this publication is “remain bullish on stocks as long as growth is likely to remain strong for the foreseeable future.” Historically, bear markets rarely occur outside of recessions (Chart 34). With both fiscal and monetary policy still supportive, and households in many countries sitting on plenty of dry powder, the odds that the global economy will experience a major downturn in the next 12 months are low. Chart 34Recessions And Bear Markets Tend To Overlap
2021 Third Quarter Strategy Outlook: The Path To Normal
2021 Third Quarter Strategy Outlook: The Path To Normal
That said, we do acknowledge that the risk-reward profile for equities has deteriorated since the start of the year. Global stocks have risen 12% year-to-date, implying that investors have priced in an increasingly optimistic economic outlook. Our equity valuation indicator points to very poor long-term future returns, particularly in the US (Chart 35). Chart 35ALong-Term Expected Returns Are Nothing To Write Home About (I)
Long-Term Expected Returns Are Nothing To Write Home About (I)
Long-Term Expected Returns Are Nothing To Write Home About (I)
Chart 35BLong-Term Expected Returns Are Nothing To Write Home About (II)
Long-Term Expected Returns Are Nothing To Write Home About (II)
Long-Term Expected Returns Are Nothing To Write Home About (II)
Democrats in Congress will likely use the reconciliation process to raise corporate taxes. While this is unlikely to cause major problems for the economy, it could weigh on stocks. As we discussed in a past report, neither analyst earnings estimates nor market expectations are baking in much impact from higher tax rates. Meanwhile, economic growth has peaked in the US and China, and will peak in the other major economies over the balance of 2021. Slower growth is usually associated with lower overall equity returns (Table 2). Stocks are also likely to face headwinds as spending shifts back from goods to services. Goods producers are overrepresented in stock market indices compared to the broader economy. Table 2The Economic Cycle And Financial Assets
2021 Third Quarter Strategy Outlook: The Path To Normal
2021 Third Quarter Strategy Outlook: The Path To Normal
The fact that global growth is peaking at exceptionally high levels will soften the blow for stocks. Likewise, the need to rebuild inventories and satisfy pent-up demand for some manufactured goods that have been in short supply will keep goods production from falling too drastically. Nevertheless, investors who have been maximally overweight stocks should consider paring exposure by raising cash. Only a modest equity overweight is appropriate going into the second half of this year. B. Equity Sectors, Regions, And Styles While we continue to favor cyclical equity sectors over defensives, non-US over the US, and value over growth, our conviction is lower than it was at the start of the year. In the near term, the lagged effects from the slowdown in Chinese credit growth could weigh on global cyclicals. Cyclicals could also stumble as the Delta variant rolls through the US and other countries. In addition, the US dollar could sustain recent gains as investors continue to fret that the Fed is turning hawkish. A stronger dollar is usually bad for cyclicals and non-US stocks (Chart 36). Chart 36Cyclical And Non-US Stocks Tend To Outperform Defensives When The Dollar Is Weakening
Cyclical And Non-US Stocks Tend To Outperform Defensives When The Dollar Is Weakening
Cyclical And Non-US Stocks Tend To Outperform Defensives When The Dollar Is Weakening
Chart 37Bank Shares Thrive in A Rising Yield Environment
Bank Shares Thrive in A Rising Yield Environment
Bank Shares Thrive in A Rising Yield Environment
Ultimately, as discussed earlier in this report, the Fed is likely to push back against the market’s hawkish interpretation of its dot plot. The resulting reflationary impulse should cause the dollar to weaken over a 12-month horizon while allowing for a re-steepening of the yield curve. Higher long-term bond yields tend to benefit banks, which are overrepresented in value indices (Chart 37). A stabilization in credit growth and more stimulative Chinese policy later this year should temper concerns about EM growth. Greater access to vaccines will also allow more EM economies to partake in reopening euphoria, thus benefiting local EM stock markets and global cyclicals. C. Fixed Income If stocks are pricey, government bonds are even more dear. Real yields are negative in most G10 economies. And while persistently higher inflation is not an imminent threat, it is a longer-term risk that bond valuations are not discounting. We expect the 10-year US Treasury yield to rise to 1.9% by the end of the year, above current market expectations of 1.61%. As of today, we are expressing this view by going short the 10-year Treasury note in our trade table. US Treasuries have a higher beta than most other government bond markets (Chart 38). Treasury yields tend to rise more when global bond yields are moving higher and vice versa. Given our expectation that global growth will remain solidly above trend over the next 12 months, fixed-income investors should underweight high-beta bond markets such as the US and Canada, while overweighting the euro area and Japan. Chart 38US Treasuries Have A Higher Beta Than Most Other Government Bond Markets
US Treasuries Have A Higher Beta Than Most Other Government Bond Markets
US Treasuries Have A Higher Beta Than Most Other Government Bond Markets
BCA’s bond strategists see more upside from high-yield bonds than for investment grade. While high-yield spreads are quite tight, they are still pricing in a default rate of 2.9%. This is more than their fair-value default estimate of 2.3%-to-2.8% (Chart 39). It is also above the year-to-date realized default rate of 1.8%. Chart 39Spread-Implied Default Rate
Spread-Implied Default Rate
Spread-Implied Default Rate
Our bond team sees USD-denominated EM corporate bonds as being attractively priced relative to domestic investment-grade corporate bonds with the same duration and credit rating. They prefer EM corporates to EM sovereigns in the A and Baa credit tiers, while preferring EM sovereigns over EM corporates in the Aa credit tier. Investors willing to take on foreign-exchange risk should consider EM local-currency bonds. As we discuss next, a weaker US dollar over the next 12 months should translate into stronger EM currencies. D. Currencies Four forces tend to drive the US dollar over cyclical horizons of about 12 months: Growth: As a countercyclical currency, the dollar typically does poorly when global growth is strong. This is especially the case when growth is rotating away from the US to other countries (Chart 40). Bloomberg consensus estimates imply that the US economy will transition from leader to laggard over the coming months, which is dollar bearish (Table 3). Chart 40The Dollar Is A Countercyclical Currency
The Dollar Is A Countercyclical Currency
The Dollar Is A Countercyclical Currency
Table 3Growth Is Peaking, But At A Very High Level
2021 Third Quarter Strategy Outlook: The Path To Normal
2021 Third Quarter Strategy Outlook: The Path To Normal
Interest Rate Differentials: The trade-weighted dollar tends to track the real 2-year spread between the US and its trading partners (Chart 41). It is unlikely that US real rates will fall much from current levels. However, the current level of spreads is already consistent with a meaningfully weaker dollar. Chart 41Rate Differentials Are A Headwind For The Dollar
Rate Differentials Are A Headwind For The Dollar
Rate Differentials Are A Headwind For The Dollar
Balance Of Payments: The US trade deficit has increased significantly over the past year (Chart 42). Equity inflows have been helping to finance the trade deficit (Chart 43). However, if stronger growth abroad causes equity flows to move out of the US, the dollar will suffer. Chart 42The US Trade Deficit Has Increased Significantly
The US Trade Deficit Has Increased Significantly
The US Trade Deficit Has Increased Significantly
Chart 43Equity Inflows Have Helped Finance The Trade Deficit
Equity Inflows Have Helped Finance The Trade Deficit
Equity Inflows Have Helped Finance The Trade Deficit
Momentum: Being a contrarian is a losing strategy when it comes to trading the dollar. This is because the US dollar is a high momentum currency (Chart 44). The dollar usually continues to weaken when it is trading below its various moving averages and sentiment is bearish (Chart 45). At present, while the dollar is near its short-term moving averages, it is still below its long-term moving averages. Sentiment is bearish, but has come off its lows. On balance, the technical picture for the dollar is slightly negative. Chart 44The Dollar Is A High Momentum Currency
2021 Third Quarter Strategy Outlook: The Path To Normal
2021 Third Quarter Strategy Outlook: The Path To Normal
Chart 45ABeing A Contrarian Doesn't Pay When It Comes To Trading The Dollar (I)
Being A Contrarian Doesn't Pay When It Comes To Trading The Dollar (I)
Being A Contrarian Doesn't Pay When It Comes To Trading The Dollar (I)
Chart 45BBeing A Contrarian Doesn't Pay When It Comes To Trading The Dollar (II)
Being A Contrarian Doesn't Pay When It Comes To Trading The Dollar (II)
Being A Contrarian Doesn't Pay When It Comes To Trading The Dollar (II)
Adding it all up, we expect the dollar to weaken over a 12-month horizon. The dollar’s downdraft will likely begin in earnest during the fall when Chinese policy turns more stimulative and fears that the Fed has turned hawkish subside. We expect EUR/USD to finish the year at 1.25. GBP/USD should hit 1.50. Both EM and commodity currencies should also do better. The lone laggard among “fiat currencies” will be the yen. As a highly defensive currency, the yen usually struggles when global growth is firm. Chart 46To This Day, Most Crypto Payments Are Made To Criminals
2021 Third Quarter Strategy Outlook: The Path To Normal
2021 Third Quarter Strategy Outlook: The Path To Normal
What about cryptocurrencies? I debated the topic with my colleague, Dhaval Joshi, in early June. To make a long story short, I think it is highly unlikely that cryptos will ever thrive. More than 13 years since Bitcoin was created, cryptos continue to be mainly used to facilitate illicit transactions. According to Chainalysis, there were fewer cryptocurrency payments processed by merchants in 2020 than in 2017 (Chart 46). Meanwhile, Bitcoin mining continues to produce significant environmental damage (Chart 47). And if there is any place where there is hyperinflation, it is in the creation of new cryptocurrencies. There are over 5000 cryptocurrencies at last count, double the number at this time last year (Chart 48). We are currently short Bitcoin in our trade table. Chart 47Bitcoin And Ethereum: How Dare You!
2021 Third Quarter Strategy Outlook: The Path To Normal
2021 Third Quarter Strategy Outlook: The Path To Normal
Chart 48Hyperinflation In New Cryptocurrency Creation
2021 Third Quarter Strategy Outlook: The Path To Normal
2021 Third Quarter Strategy Outlook: The Path To Normal
E. Commodities Structurally, oil faces a bleak future. Transport accounts for about 60% of global oil consumption. The shift to electric vehicles will undermine this key source of oil demand. Cyclically, however, crude prices could still rise as the global economic recovery unfolds. Supply remains quite tight, reflecting both OPEC vigilance and the steep drop in oil and gas capex of recent years (Chart 49). Bob Ryan, BCA’s chief commodity strategist, expects Brent to rise to $79/bbl by the end of the year, which is 9% above current market expectations (Chart 50). Chart 49Oil And Gas Companies Curtailed Capex In Recent Years
2021 Third Quarter Strategy Outlook: The Path To Normal
2021 Third Quarter Strategy Outlook: The Path To Normal
Chart 50Oil Prices Still Have Room To Run
Oil Prices Still Have Room To Run
Oil Prices Still Have Room To Run
Chart 51Chinese Metal Consumption Up 5-Fold Since The 2000s Commodity Boom
Chinese Metal Consumption Up 5-Fold Since The 2000s Commodity Boom
Chinese Metal Consumption Up 5-Fold Since The 2000s Commodity Boom
In contrast to oil, the long-term outlook for base metals is favorable. A typical electric vehicle requires four times as much copper as a typical gasoline-propelled vehicle. By 2030, the demand from EVs alone should amount to close to 4mm tonnes of copper per year, representing about 15% of current annual copper production. Strong demand for metals from China should also buoy metals prices. While trend GDP growth in China has slowed, the economy is much bigger in absolute terms than it was in the 2000s. China’s annual aggregate consumption of metals is five times as high as it was back then (Chart 51). In the near term, however, base metals have to grapple with the lagged effects of slower Chinese credit growth (Chart 52). We downgraded base metals to neutral on May 28 and are currently long global energy stocks via the IXC ETF versus global copper miners via the COPX ETF. We expect to reverse this trade by the fall. We are generally positive on gold. Since peaking last August, the price of gold has fallen more than one might have expected based on movements in real bond yields (Chart 53). Gold will also benefit from a weaker dollar later this year. Lastly, and importantly, gold should retain its standing as a good inflation hedge. Chart 52Tighter Chinese Credit Will Be A Headwind For Base Metals Over The Summer Months
Tighter Chinese Credit Will Be A Headwind For Base Metals Over The Summer Months
Tighter Chinese Credit Will Be A Headwind For Base Metals Over The Summer Months
Chart 53Gold Prices Tend To Track Real Rates
Gold Prices Tend To Track Real Rates
Gold Prices Tend To Track Real Rates
Peter Berezin Chief Global Strategist pberezin@bcaresearch.com Global Investment Strategy View Matrix
2021 Third Quarter Strategy Outlook: The Path To Normal
2021 Third Quarter Strategy Outlook: The Path To Normal
Special Trade Recommendations
2021 Third Quarter Strategy Outlook: The Path To Normal
2021 Third Quarter Strategy Outlook: The Path To Normal
Current MacroQuant Model Scores
2021 Third Quarter Strategy Outlook: The Path To Normal
2021 Third Quarter Strategy Outlook: The Path To Normal
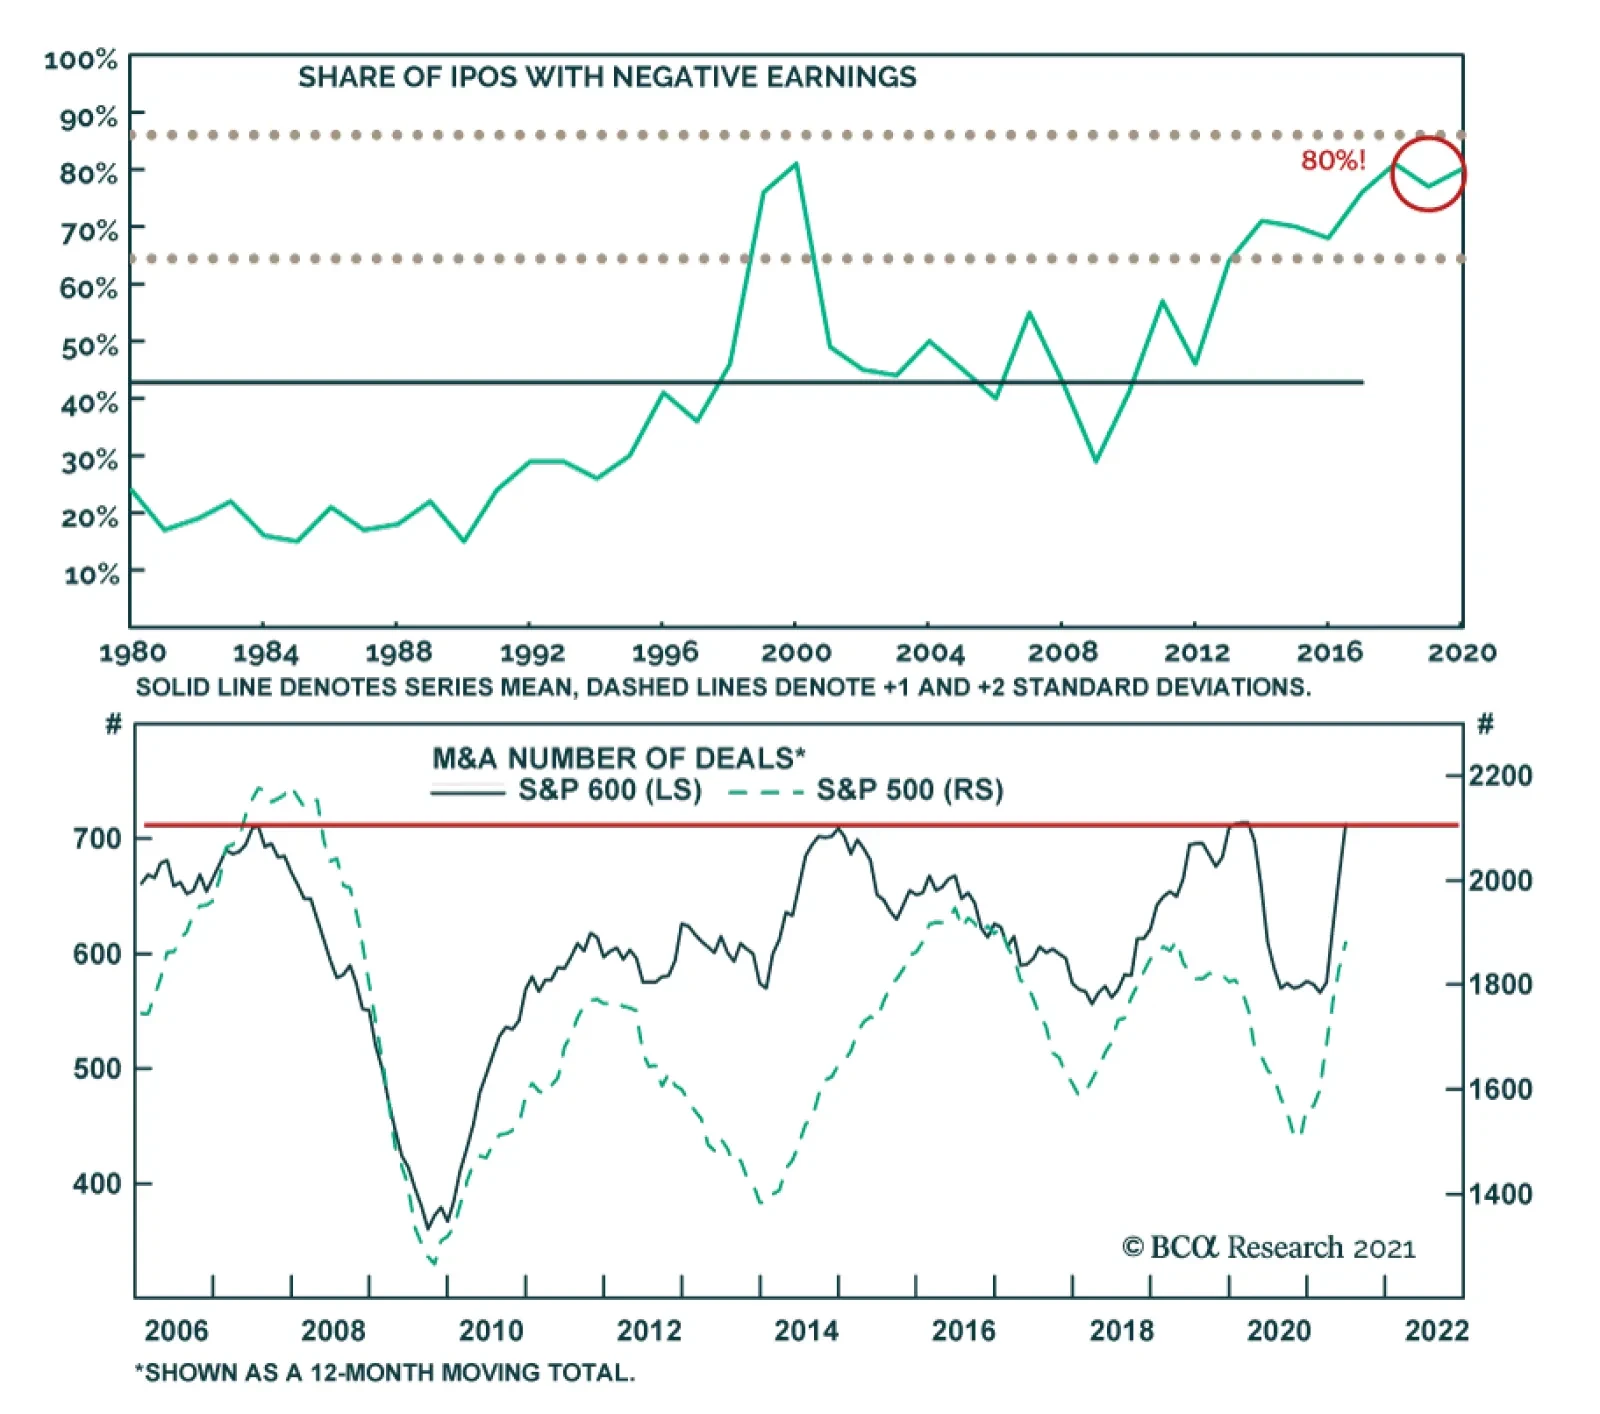
BCA Research’s US Equity Strategy service concludes that the number of IPOs with negative earnings is alarming, moreover, M&A activity has likely peaked. Initial public offerings (IPOs) are a source of future small-cap index constituents. Last year was…