Equities

Dear Client, China Investment Strategy will take a summer break next week. We will resume our publication on July 14th. Best regards and we wish you a happy and healthy summer. Jing Sima, China Strategist Highlights A USD rebound and higher domestic bond yields pose near-term challenges to Chinese risk assets. A sharp deceleration in credit growth in the past seven months will lead to weaker-than-expected data from China’s old-economy sectors in the second half of the year. Robust global trade has propelled Chinese exports, allowing the country to pursue financial deleverage and structural reforms. However, next year policymakers will face increased pressure to support the domestic economy as the global economic recovery peaks and demand slows. Investors should maintain an underweight stance towards Chinese stocks in 2H21, but remain alert to any improvements in China’s policy tone. An easing monetary policy may signal a potential upgrade catalyst in 1H22. Feature Most recent macro figures confirm that China’s impressive economic upcycle has peaked. We expect that the official manufacturing and non-manufacturing PMIs, which will be released as this report is published, will come in modestly down. We maintain the view that a major relapse in economic activity is unlikely, but the strong tailwinds that have propelled China's recovery since Q2 last year have since abated and will lead to softer growth. Meanwhile, the rate of economic and export expansions has given Chinese policymakers confidence to scale back leverage and continue with market reforms. In the second half of the year, investors' sentiment towards Chinese stocks will be tested based on three risks: A rebound in the US dollar index. A tighter liquidity environment and higher interest rates. A weakening in macro indicators beyond market expectations. As the global economic recovery peaks into 2022, pressures to support the domestic economy will become more urgent if policymakers want to maintain an average rate of 5% real GDP growth in 2020 - 2022. The current policy settings are not yet favorable to overweight Chinese risk assets. Major equity indexes remain richly valued and the market could easily correct if domestic rates move higher. However, signs of policy easing may emerge by yearend, which would prompt us to shift our view to overweight Chinese stocks in both absolute and relative terms. The Case For A Dollar Rebound On a tactical basis (next three months), a rebound in the US dollar index may curb investors’ enthusiasm for Chinese stocks. A stronger dollar will give the RMB’s appreciation some breathing room and will be reflationary for China’s economy. However, in the short term a stronger USD will also lead to weaker foreign inflows to China’s equity markets. Chinese stock prices have become more closely and negatively correlated with the dollar index since early 2020 (Chart 1). A weaker dollar is usually accompanied by a global economic upturn and a higher risk appetite from investors, propelling more foreign portfolio flows to emerging markets (which includes Chinese risk assets). Although foreign inflows account for a small portion of the Chinese A-share market cap, global institutional investors’ sentiment has become more influential and has led fluctuations in Chinese onshore stock prices (Chart 2). Chart 1Closer Correlations Between Chinese Stocks And The Dollar Index
Closer Correlations Between Chinese Stocks And The Dollar Index
Closer Correlations Between Chinese Stocks And The Dollar Index
Chart 2Foreign Investors Matter To Chinese Onshore Stock Prices
Foreign Investors Matter To Chinese Onshore Stock Prices
Foreign Investors Matter To Chinese Onshore Stock Prices
Chart 3Rising Market Expectations For The Fed's Rate Liftoff
Rising Market Expectations For The Fed's Rate Liftoff
Rising Market Expectations For The Fed's Rate Liftoff
The US Federal Reserve delivered a slightly more hawkish surprise at its June FOMC meeting with the message that it will move the projected timing of its first fed fund rate liftoff from 2024 to 2023. Since then, market expectations have shifted from growth and inflation to focusing on the next monetary policy tightening phase, with the short end of the US yield curve rising sharply (Chart 3). Given that currency markets trade off the short end of the yield curve, higher US interest rate expectations will at least temporarily lift the US dollar. The timing and pace of the Fed’s tapering of asset purchases and rate hikes will be determined by how rapidly the US economy approaches the US central bank’s definition of “maximum employment.” BCA’s US Bond Investment strategist anticipates that sizeable and positive non-farm payroll surprises will start in late summer/early fall, which will catalyze a move higher in bond yields. As such, we expect additional upside risks in the dollar index in the coming months, which will discourage foreign investors’ appetite for Chinese equities. Bottom Line: A rebound in the dollar index will be a near-term downside risk to Chinese stocks. Risk Of Higher Chinese Interest Rates Another near-term risk to Chinese stock prices is a tightening in domestic liquidity conditions and a rebound in interest rates, particularly in Q3. Chart 4The PBoC Has Managed To Keep Domestic Rates Low While Pulling Back Overall Stimulus
The PBoC Has Managed To Keep Domestic Rates Low While Pulling Back Overall Stimulus
The PBoC Has Managed To Keep Domestic Rates Low While Pulling Back Overall Stimulus
So far this year the PBoC has kept liquidity conditions accommodative to avoid massive debt defaults, while allowing a faster deceleration in the pace of credit expansion and a sharp contraction in shadow banking (Chart 4). In the coming months, however, the trend may reverse. Even though we do not think China’s current inflation and growth dynamics warrant meaningful and sustainable monetary policy tightening, there is still room for rates to normalize to their pre-pandemic levels in the next few months. Our view is based on the following: First, there was a major delay in local government bond issuance in the first five months of the year. The supply of government bonds will pick up meaningfully in Q3 to meet the annual quota for 2021. An increase in government bond issuance will remove some liquidity from the banking system because the majority of these local government bonds are purchased by commercial banks. Adding to the liquidity gap is a large number of one-year, medium-term lending facility (MLF) loans that will be due in 2H21. Secondly, the PBoC may shift its policy tightening from reducing the volume of total credit creation (measured by total social financing) to raising the price of money. Credit growth (on year-over-year basis) in the first five months of 2021 dropped by three percentage points from its peak in Q4 last year, much faster than the 13-month peak-to-trough deceleration during the 2017/18 policy tightening cycle. As the rate of credit creation approaches the government’s target for the year, which we expect around 11%, the pressure to further compress credit expansion has eased into 2H21. China’s policy agenda is still focused on de-risking in the financial and real estate sectors, therefore, we expect policymakers to keep overall monetary conditions restrictive by raising the price of money. Furthermore, we do not rule out the possibility of a hike in mortgage rates. Chart 5Rising Risk For A Bear Flattening In Domestic Yield Curve In Q3
Rising Risk For A Bear Flattening In Domestic Yield Curve In Q3
Rising Risk For A Bear Flattening In Domestic Yield Curve In Q3
Lastly, as the Fed prepares market expectations for its rate liftoff and China’s domestic economy is still relatively solid, the PBoC may seize the opportunity to guide market-based interest rates towards their pre-pandemic levels. Thus, the market will likely price in tighter liquidity conditions while lowering expectations for the economy and inflation. The short end of the yield curve will rise faster than the longer end, resulting in a flattening of the curve (Chart 5). There is a nontrivial risk that the market will react negatively to tighter liquidity conditions and rising bonds yields, particularly when the economy is slowing. We mentioned in previous reports that rising policy rates and bond yields do not necessarily lead to lower stock prices, if rates are rising while credit keeps expanding and corporate profit growth accelerates. However, currently credit impulse has decelerated sharply, and corporate profit growth has most likely peaked in Q2. Therefore, even a small increase in bond yields or market expectations of higher rates will likely trigger risk asset selloffs. Bottom Line: Bond yields will move higher in Q3, risking market selloffs. Chinese Economy Standing On One Leg China’s economic fundamentals also pose downside risks to Chinese stock prices. Macro indicators on a year-over-year comparison will soften further in 2H21 when low base effects wane, although they will weaken from very high levels. This year’s sharp credit growth deceleration will start to drag down domestic demand, with the risk of corporate profits disappointing the market. A positive tailwind from global trade prevented China's old economy from decelerating more in the first half of the year. It is reflected in the nominal imports and manufacturing orders components in the BCA Activity Index (Chart 6). However, while rising commodity prices boosted the value of Chinese imports, the volume of imports has been moving sideways of late (Chart 7). Chart 6Our BCA Activity Index Is Still Rising...
Our BCA Activity Index Is Still Rising...
Our BCA Activity Index Is Still Rising...
Chart 7...But The Volume Of The Import Component Has Rolled Over
...But The Volume Of The Import Component Has Rolled Over
...But The Volume Of The Import Component Has Rolled Over
Chart 8Export Growth Is Moderating From Current Level
Export Growth Is Moderating From Current Level
Export Growth Is Moderating From Current Level
Moreover, China’s export volume is peaking as the reopening in other countries shifts consumer demand from goods to services. Strong export growth would likely decelerate and converge to global industrial production growth in the coming 12 months, even though a regression-based approach suggests that export growth will stay above trend-growth if global economic activity remains robust (Chart 8). All three components of the official Li Keqiang Index, which measures China’s industrial sector activity and incorporates electricity consumption, railway transportation and bank lending, have rolled over (Chart 9). Among the three components in BCA’s Li Keqiang Leading Indicator, only the monetary conditions index improved on the back of lower real rates. Contributions from the money supply and credit expansion components to the overall indicator have been negative (Chart 10). Chart 9The Official Li Keqiang Index Is Weakening...
The Official Li Keqiang Index Is Weakening...
The Official Li Keqiang Index Is Weakening...
Chart 10...So Is Our BCA Li Keqiang Leading Indicator
...So Is Our BCA Li Keqiang Leading Indicator
...So Is Our BCA Li Keqiang Leading Indicator
Chart 11Household Consumption Recovery Remains A Laggard
Household Consumption Recovery Remains A Laggard
Household Consumption Recovery Remains A Laggard
The recovery in household consumption remains well behind the industrial sector in the current cycle (Chart 11). We expect consumption and services to continue recovering very gradually. Apart from China’s long-standing structural issues, such as sliding household income growth and a high propensity to save, the cyclical recovery in consumption is dependent on China’s domestic COVID-19 situation. The country is on track to fully vaccinate 40% of its population by the end of June and 80% by year-end (Chart 12). However, hiccups in the service sector recovery are expected through 2H21, given China’s “zero tolerance” policy on confirmed COVID cases, which could trigger sporadic local lockdowns (Chart 13). Chart 12China Is Racing To Reach “Full Inoculation Rate” By Yearend
China Outlook: A Mid-Year Recap
China Outlook: A Mid-Year Recap
Chart 13Expect Some Hiccups In Service Sector Recovery In 2H21
Expect Some Hiccups In Service Sector Recovery In 2H21
Expect Some Hiccups In Service Sector Recovery In 2H21
Bottom Line: Any moderation in exports in the rest of 2021 may add to the slowdown in China’s economic activity. Don’t Count On Fiscal Support Chart 14Fiscal Spending Has Been Disappointing In 1H21
Fiscal Spending Has Been Disappointing In 1H21
Fiscal Spending Has Been Disappointing In 1H21
During the first five months of the year, fiscal spending has downshifted (Chart 14). The amount of local government special-purpose bonds (SPBs) issued was far less than in the same period of the past two years, and below this year’s approved annual quota. Although we expect fiscal support to increase into 2H21, backloading SPBs would qualify, at best, as a remedial measure rather than a meaningful boost to economic activity. The RMB3 trillion SPBs to be issued in 2H21 represent only about 10% of this year’s total credit expansion. To substantially boost credit impulse and economic activity, the pickup in SPB issuance will need to be accompanied by looser monetary policy and an acceleration in bank loans (Chart 15). We do not expect that liquidity conditions will remain as lax as in 1H21. Additionally, given that the central government’s focus is to rein in the leverage of local governments and their affiliated financial vehicles (LGFV), provincial officers have little incentive to take on more bank loans against a restrictive policy backdrop. Historically, a stronger fiscal impulse linked to hefty increases in local government bond issuance has not necessarily led to meaningful improvements in infrastructure investment, which has been on a structural downshift since 2017 (Chart 16). Following a V-shaped recovery in 2H20, the growth in infrastructure investment will likely continue to slide in 2H21 due to sluggish government spending. Chart 15Bank Loans Still Hold The Key To Stimulus Impulse
Bank Loans Still Hold The Key To Stimulus Impulse
Bank Loans Still Hold The Key To Stimulus Impulse
Chart 16Don't Count On SPBs To Meaningfully Boost Infrastructure Investment
Don't Count On SPBs To Meaningfully Boost Infrastructure Investment
Don't Count On SPBs To Meaningfully Boost Infrastructure Investment
Bottom Line: There are no signs that the overall policy stance is easing to facilitate a higher fiscal multiplier from an upturn in local government bond issuance. As such, fiscal support for infrastructure spending and economic activity will disappoint in 2H21 despite more SPB issuance. Investment Conclusions Monetary conditions may tighten in Q3 although credit growth will decelerate at a slower pace. Pressures to support domestic demand will be more pronounced next year as tailwinds abate from the global recovery and domestic massive stimulus. Our view is that Chinese authorities will likely ease on the policy tightening brake towards the end of this year and perhaps even signal some reflationary measures in early 2022. Therefore, while we maintain an underweight stance on Chinese stocks for the time being, investors should remain alert to any improvements in China's policy direction. In particular, any monetary policy easing by end this year/early 2022 may signal a potential catalyst to upgrade Chinese stocks to overweight in absolute terms. Although both Chinese onshore and investable equities are currently traded at a discount relative to global stocks, they are richly valuated compared with their 2017/18 highs (Chart 17). China's economy is slowing and the corporate sector has substantially increased its leverage in the past decade. We believe that the current discount in Chinese equities relative to global stocks is warranted. Chart 18 presents a forecast for A-share earnings growth in US dollars, based on earnings’ relationship with the official Li Keqiang index. The chart shows that while an earnings contraction is not probable, without more stimulus the growth rate may fall sharply in the next 12 months from its current elevated level. This aspect, combined with only a minor valuation discount relative to global stocks, paints an uninspiring outlook for Chinese onshore stocks. Chart 17Chinese Onshore Stocks Are Traded At A Slight Discount To Global Equities
Chinese Onshore Stocks Are Traded At A Slight Discount To Global Equities
Chinese Onshore Stocks Are Traded At A Slight Discount To Global Equities
Chart 18An Uninspiring Domestic Equity Earnings Outlook
An Uninspiring Domestic Equity Earnings Outlook
An Uninspiring Domestic Equity Earnings Outlook
Our baseline view is that Chinese authorities will be more willing to step up policy supports into 2022. Fiscal impulse will likely turn negative for most major economies next year and global economic recovery will have peaked. In this scenario, both China’s economy and stocks will have the potential to outperform their global peers next year. Jing Sima China Strategist jings@bcaresearch.com Cyclical Investment Stance Equity Sector Recommendations
On Small Versus Large Caps
On Small Versus Large Caps
Initial public offerings (IPOs) are a source of future small-cap index constituents. Last year was a fruitful year since 165 companies went public. However, just to put things into perspective, 1999 and 2000 saw 476 and 380 IPOs respectively. IPOs are on the tear this year as well – raking in $171B and already topping the 2020 total. Some 80% of IPOs last year were for unprofitable companies, which is nearly two standard deviations above the historical average of 40% (see chart). While a good crop of IPOs is a great feeder ground for the small-cap indexes, it is concerning that so many unprofitable companies hit the market and often at multi-billion-dollar valuations. Euphoria is certainly the word that comes to mind, and investors’ current willingness to back companies without earnings may be a drag on overall small company earnings’ performance over the next few years. Bottom Line: We recommend investors to fade a rebound in small caps and maintain a neutral size preference. For more details, please refer to this Monday’s Strategy Report.
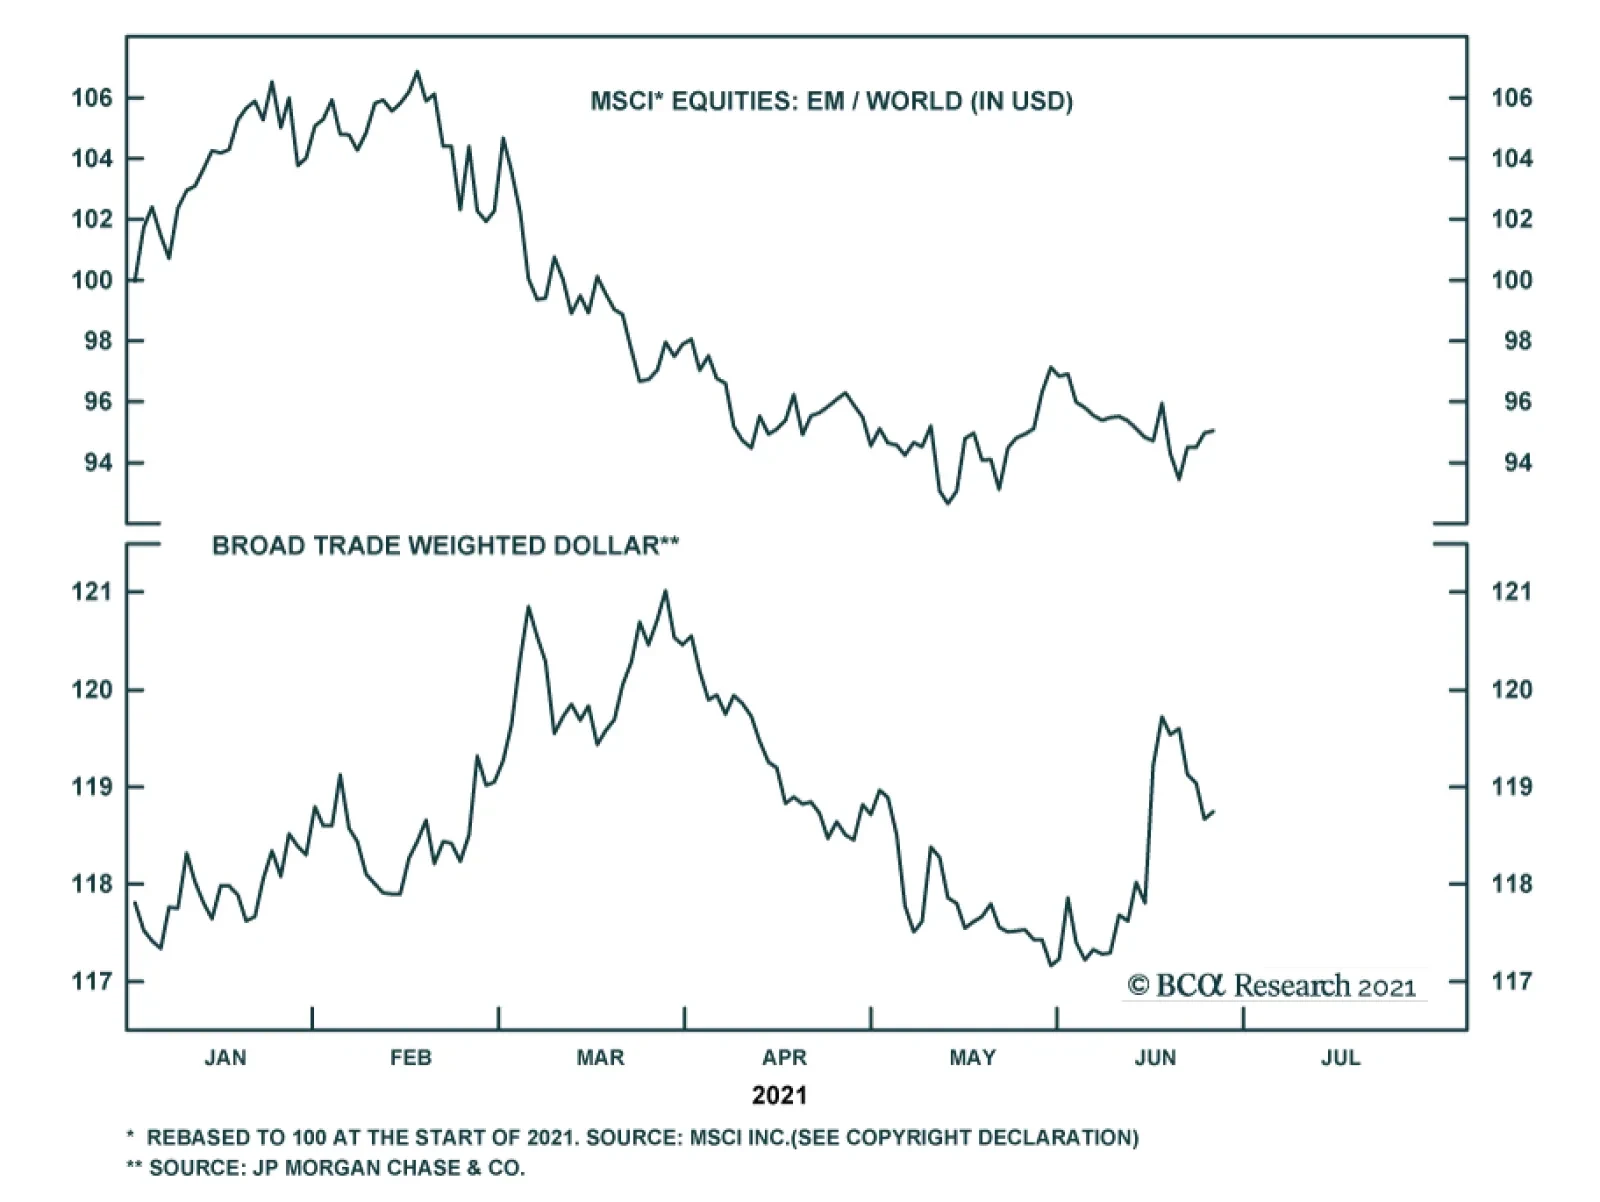
Emerging Market equities have been underperforming the global market since early June and we think this trend will continue during the next few months. First, the Fed’s hawkish pivot in June is just a small sampling of things to come. US employment will…
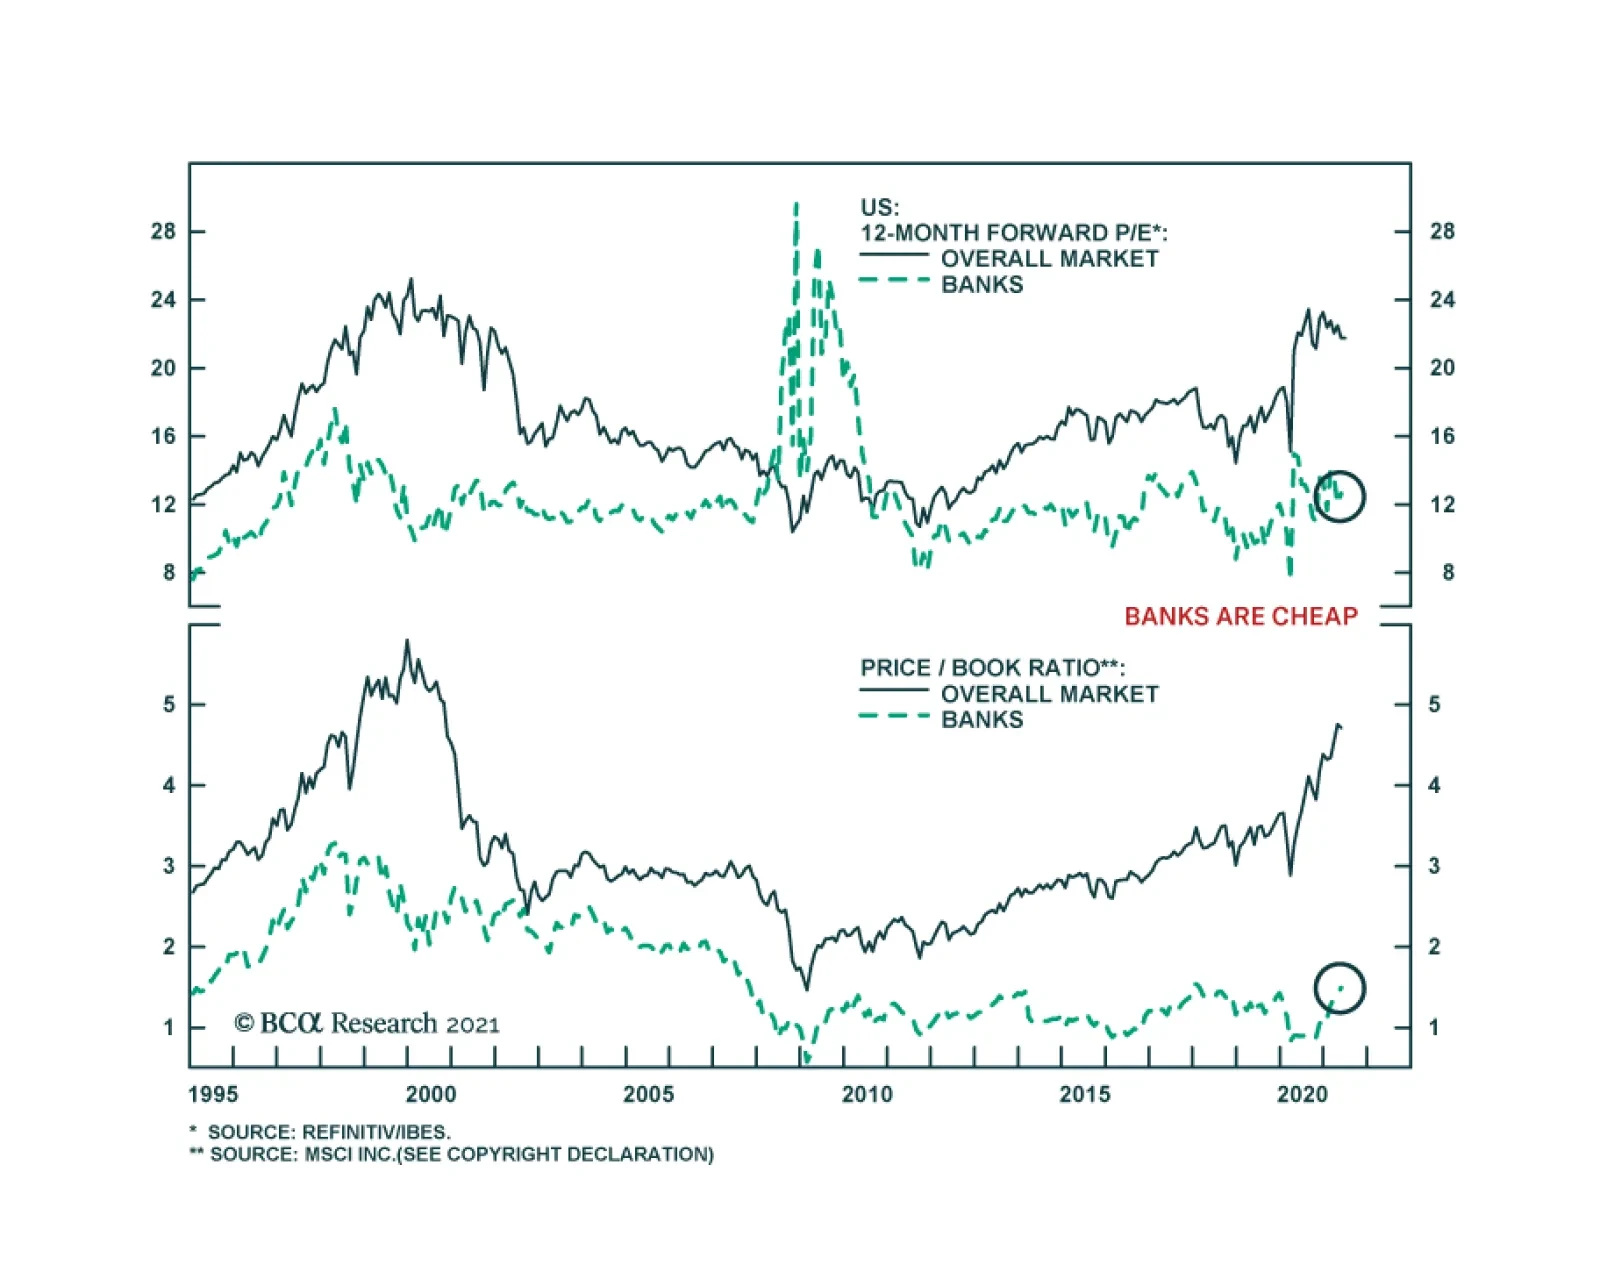
On Thursday, the Fed revealed that all 23 of the US’s biggest banks passed its “stress tests”. The positive outcome implies that emergency measures adopted during the pandemic were successful in preserving banks’ health. As a result, restrictions on dividend…
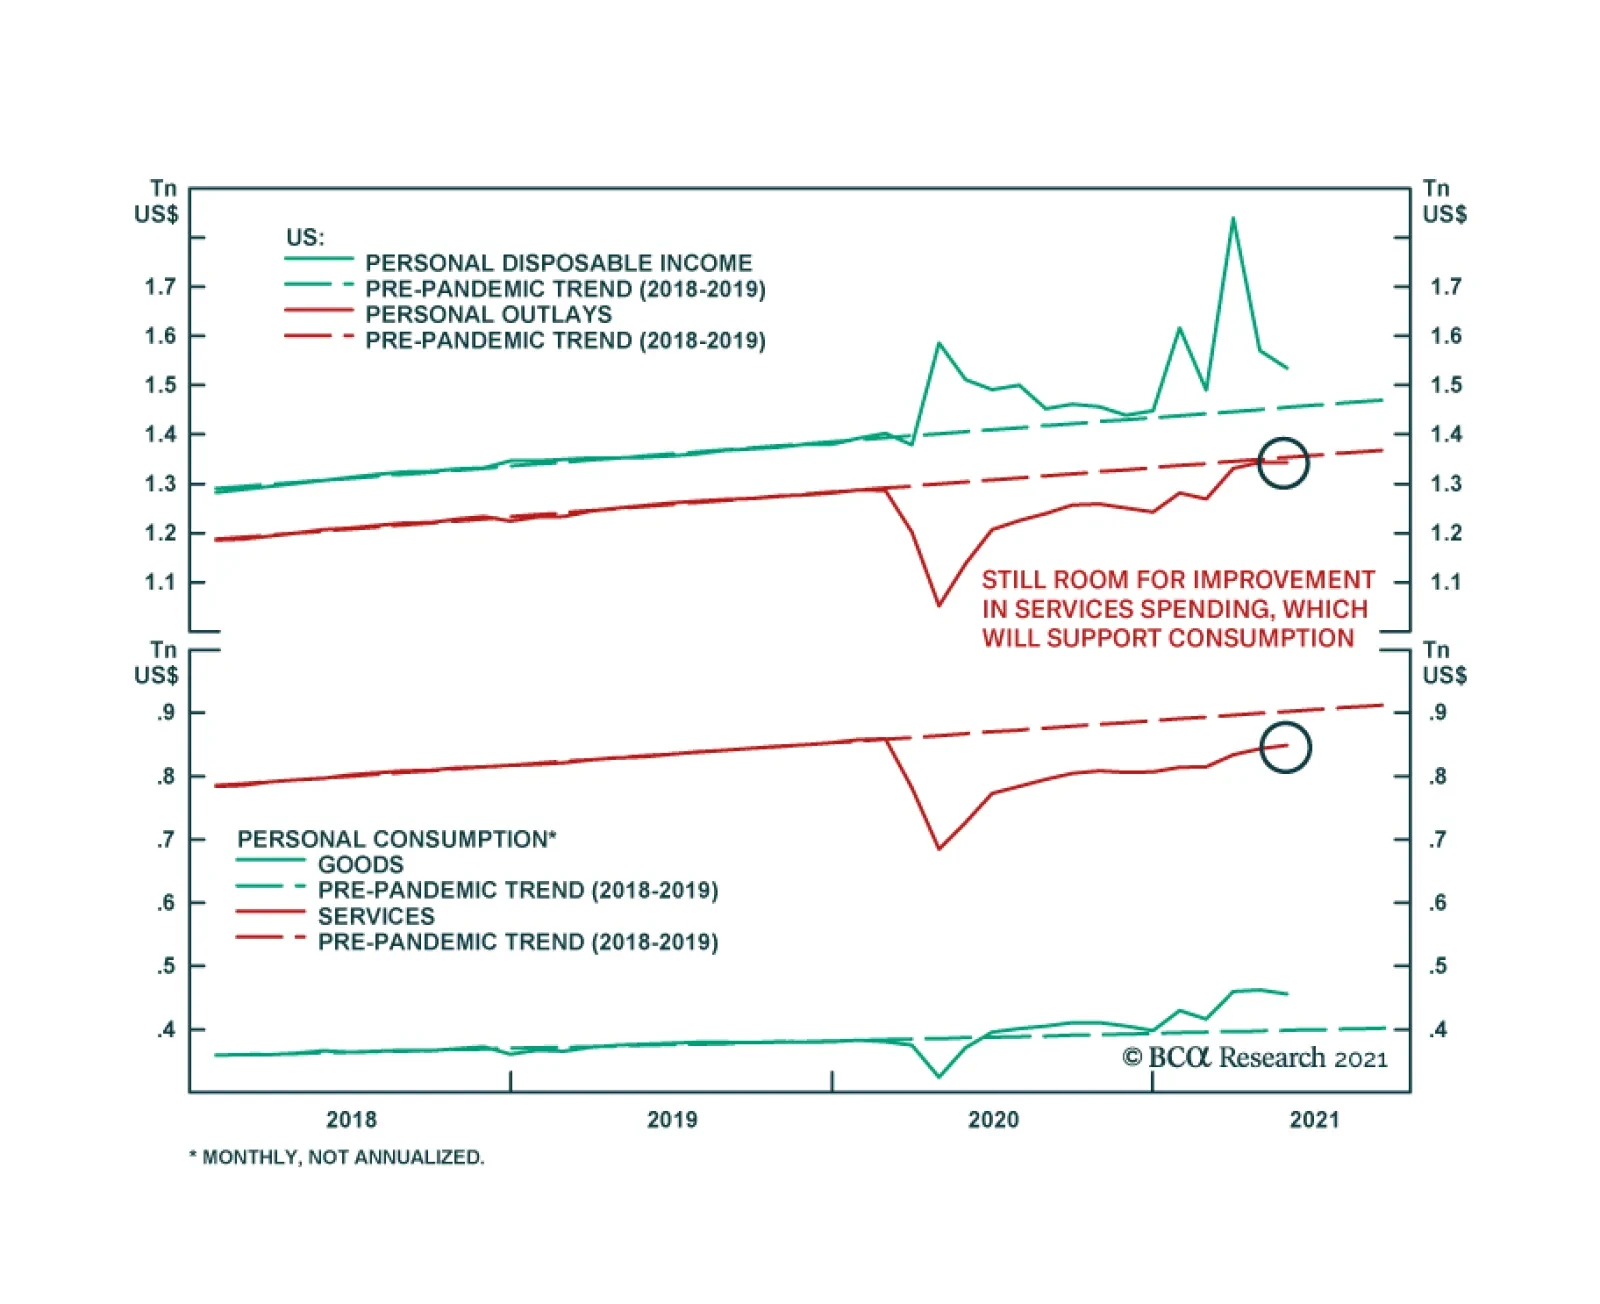
May’s US Personal Income and Outlays report was mixed. Personal income dipped 2%, less than the 2.5% anticipated by the consensus. This marks the second consecutive monthly decline after April’s 13.1% fall, and mainly reflects the waning effect of federal…

Weekly Performance Update For the week ending Thu Jun 24, 2021 The Market Monitor displays the trailing 1-quarter performance of strategies based around the BCA Score. For each region, we construct an equal-weighted, monthly rebalanced portfolio consisting of the top 3 stocks per sector and compare it with the regional benchmark. For each portfolio, we show the weekly performance of individual holdings in the Top Contributors/Detractors table. In addition, the Top Prospects table shows the holdings that currently have the highest BCA Score within the portfolio. For more details, click the region headers below to be redirected to the full historical backtest for the strategy. BCA US Portfolio
Market Monitor (Jun 24, 2021)
Market Monitor (Jun 24, 2021)
Total Weekly Return BCA US Portfolio S&P500 TRI 1.19% 1.08% Top Contributors TX:US SCCO:US DE:US UHAL:US TGT:US Weekly Return 28 bps 19 bps 19 bps 17 bps 12 bps Top Detractors MPLX:US HE:US PEG:US STX:US FLO:US Weekly Return -10 bps -10 bps -9 bps -8 bps -7 bps Top Prospects BRK.A:US ANAT:US ESGR:US TX:US MPLX:US BCA Score 98.55% 98.15% 97.91% 97.86% 93.55% BCA Canada Portfolio
Market Monitor (Jun 24, 2021)
Market Monitor (Jun 24, 2021)
Total Weekly Return BCA Canada Portfolio S&P/TSX TRI 2.34% 0.38% Top Contributors TOY:CA AUP:CA CS:CA TOU:CA IFP:CA Weekly Return 43 bps 38 bps 36 bps 19 bps 16 bps Top Detractors EMP.A:CA TCL.A:CA CCA:CA QBR.A:CA ELF:CA Weekly Return -23 bps -7 bps -7 bps -5 bps -3 bps Top Prospects CS:CA IFP:CA RUS:CA CFP:CA LNF:CA BCA Score 99.28% 98.50% 98.21% 97.43% 97.22% BCA UK Portfolio
Market Monitor (Jun 24, 2021)
Market Monitor (Jun 24, 2021)
Total Weekly Return BCA UK Portfolio FTSE 100 TRI 0.23% -0.53% Top Contributors ROSN:GB CVSG:GB KNOS:GB BIFF:GB NFC:GB Weekly Return 20 bps 14 bps 14 bps 14 bps 14 bps Top Detractors NLMK:GB DEC:GB BAKK:GB TEP:GB LXI:GB Weekly Return -19 bps -15 bps -15 bps -12 bps -11 bps Top Prospects SVST:GB NLMK:GB GLTR:GB BPCR:GB RMG:GB BCA Score 99.67% 98.62% 98.47% 95.23% 95.08% BCA Eurozone Portfolio
Market Monitor (Jun 24, 2021)
Market Monitor (Jun 24, 2021)
Total Weekly Return BCA EMU Portfolio MSCI EMU TRI -0.86% -0.52% Top Contributors MMT:FR WUW:DE FSKRS:FI MS:IT UN01:DE Weekly Return 13 bps 13 bps 11 bps 10 bps 9 bps Top Detractors CNV:FR GTT:FR ADL:DE PHA:FR US:IT Weekly Return -53 bps -19 bps -16 bps -10 bps -8 bps Top Prospects STR:AT POST:AT CNV:FR SOLV:BE HLAG:DE BCA Score 99.42% 98.85% 98.74% 97.65% 96.86% BCA Japan Portfolio
Market Monitor (Jun 24, 2021)
Market Monitor (Jun 24, 2021)
Total Weekly Return BCA Japan Portfolio TOPIX TRI -0.58% -0.84% Top Contributors 7860:JP 6676:JP 7958:JP 8117:JP 5930:JP Weekly Return 13 bps 12 bps 12 bps 9 bps 7 bps Top Detractors 9543:JP 8595:JP 7994:JP 3132:JP 8922:JP Weekly Return -17 bps -17 bps -13 bps -10 bps -8 bps Top Prospects 4966:JP 6345:JP 8133:JP 9543:JP 7994:JP BCA Score 99.33% 98.60% 98.49% 98.45% 98.11% BCA Hong Kong Portfolio
Image
Total Weekly Return BCA Hong Kong Portfolio Hang Seng TRI 0.47% 1.23% Top Contributors 990:HK 316:HK 1798:HK 857:HK 1258:HK Weekly Return 121 bps 36 bps 23 bps 21 bps 14 bps Top Detractors 3600:HK 1919:HK 43:HK 743:HK 323:HK Weekly Return -73 bps -28 bps -20 bps -18 bps -12 bps Top Prospects 990:HK 2232:HK 811:HK 1606:HK 323:HK BCA Score 99.11% 98.28% 97.72% 97.55% 97.08% BCA Australia Portfolio
Market Monitor (Jun 24, 2021)
Market Monitor (Jun 24, 2021)
Total Weekly Return BCA Australia Portfolio S&P/ASX All Ord. TRI 1.52% -0.80% Top Contributors AGI:AU GRR:AU RUL:AU CAJ:AU PDN:AU Weekly Return 85 bps 18 bps 16 bps 13 bps 12 bps Top Detractors STX:AU AST:AU SDG:AU SGF:AU EVT:AU Weekly Return -27 bps -15 bps -15 bps -6 bps -6 bps Top Prospects PIC:AU GRR:AU AGI:AU SGF:AU BFG:AU BCA Score 98.36% 98.09% 97.54% 96.84% 96.80%
Highlights The US is withdrawing from the Middle East and South Asia and making a strategic pivot to Asia Pacific. The third quarter will see risks flare around Iran and the US rejoin the 2015 Iranian nuclear deal. The result is briefly negative for oil prices but the rise of Iran is a new geopolitical trend that will increase Middle Eastern risk over the long run. The geopolitical outlook is dollar bullish, while the macroeconomic outlook is getting less dollar-bearish due to China’s risk of over-tightening policy. Stay neutral USD and be wary of commodities and emerging markets in the third quarter. European political risk is bottoming. The German and French elections are at best minor risks. However, the continent is ripe for negative black swans, especially due to Russian aggression. Go tactically long global large caps and defensives. Feature Chart 1Three Key Views On Track (So Far)
Three Key Views On Track (So Far)
Three Key Views On Track (So Far)
We chose “No Return To Normalcy” as the theme of our 2021 outlook. While the COVID-19 vaccine promised economic recovery, we argued that normalization would create complacency regarding fundamental changes that have taken place in the geopolitical environment. A contradiction between an improving macroeconomic backdrop and a foreboding geopolitical backdrop would develop in 2021 and beyond. The “reflation trade” has begun to lose steam as we go to press. However, global recovery will still be the dominant story in the second half of the year as vaccination spreads. The question for the third quarter and the rest of the year is whether reflation will continue. As a matter of forecasting, we think it will. But as a matter of investment strategy, we are taking a more defensive stance until China relaxes economic policy. In our annual outlook we highlighted three key geopolitical views: (1) China’s headwinds, both at home and abroad (2) US détente with Iran and pivot to Asia (3) Europe’s opportunity. All three trends are broadly on track and can be illustrated by looking at equity performance in the relevant regions for the year so far: Chinese stocks sold off, UAE stocks rallied, and European stocks rallied (Chart 1). However, these trends are not exclusively tied to absolute equity performance. The most important question is what happens to global growth and the US dollar as these three key views continue. Stay Neutral On The Dollar It paid off for us to maintain a neutral stance on the dollar. True, the global recovery and exorbitant US trade and budget deficits are bearish for the dollar and bullish for other currencies. But the greenback’s “counter-trend bounce” is proving more formidable than many investors expected. The fundamentals of the American economy and global position remain strong. Since the outbreak of COVID-19, the US has secured its recovery with fiscal policy, maintained rule of law amid a contested election, innovated and distributed vaccines, benefited from more flexible social restrictions, refurbished global alliances, and put pressure on its geopolitical rivals. In essence, the combined effect of President Trump’s and Biden’s policies has been to make America “great again” (Chart 2). From a geopolitical perspective, the dollar is appealing. Chart 2Trump-Biden Make America Great Again?
Trump-Biden Make America Great Again?
Trump-Biden Make America Great Again?
In addition, the first two geopolitical views mentioned above – China’s headwinds and the US-Iran détente – imply a negative environment for China and the renminbi. The reason for the US to do a suboptimal deal with Iran, both in 2015 and 2021, is to reduce the risk of war and buy time to enable a strategic pivot to Asia Pacific. Three US presidents have been elected on the pledge to conclude the “forever wars” in the Middle East and South Asia. Biden is withdrawing US troops from Afghanistan in September. There can be little doubt Biden is committed to an Iran deal, which is supposed to free up the US’s hands (Chart 3). Meanwhile the US public and Congress are unified in their desire to better defend US interests against China’s economic and military rise. There has not yet been a stabilization of US-China policies. Biden is not likely to hold a summit with Chinese President Xi Jinping until late October at earliest – and that is a guess, not a confirmed summit. The Biden administration has completed its review of China policy and is maintaining the Trump administration’s hawkish posture, as predicted. The US and China may resume their strategic and economic dialogue at some point but it is impossible to go back to the status quo ante 2015. That was the year the US adopted a more confrontational stance toward China – a stance later supercharged by Trump’s election and trade tariffs. The hawkish consensus on China is one of the rare unifying factors in a deeply divided America. The Biden administration explicitly says the US-China relationship is now defined by “competition” instead of “engagement.”1 One exception to this neutral view on the dollar has been our decision to go long the Japanese yen and Swiss franc, which has not panned out so far. Our reasoning is that geopolitical risk will boost these currencies but otherwise the reduction of geopolitical risk will weigh on the dollar in the context of global growth recovery. So far geopolitical risk has remained subdued while the US dollar has outperformed. We are still sympathetic to these safe-haven currencies, however, as they are attractively valued as long as one expects geopolitical risks to materialize (Chart 4). Chart 3US Pivot To Asia Runs Through Iran
US Pivot To Asia Runs Through Iran
US Pivot To Asia Runs Through Iran
Our third key view, that EU was the real winner of the US election last year, remains on track. This is marginally positive for the euro at the expense of the dollar. Given the above points, we favor an equal-weighted basket of the euro and the dollar relative to the renminbi (Chart 5). Chart 4Safe-Haven Currencies Attractive
Safe-Haven Currencies Attractive
Safe-Haven Currencies Attractive
Chart 5Favor Euro And Dollar Over Renminbi
Favor Euro And Dollar Over Renminbi
Favor Euro And Dollar Over Renminbi
The geopolitical outlook is dollar-bullish. The macroeconomic outlook is dollar-bearish, except that China’s economy looks to slow down. We expect China to ease policy in the second half of the year but it may come late. We remain neutral dollar in the third quarter. Wait For China To Relax Policy July 1 marks the centenary of the Communist Party of China. The main thing investors should know is that the Communist Party predates China’s capitalist phase by sixty years. The party adopted capitalism to improve the economy – it never sacrificed its political or foreign policy goals. This poses a major geopolitical problem today because the Communist Party’s consolidation of power across Greater China, symbolized by Beijing’s revocation of Hong Kong’s special status in 2019, has convinced the western democracies that China is no longer compatible with the liberal world order. China launched a 13.8% of GDP monetary-and-fiscal stimulus over 2018-20 due to the trade war and COVID-19 pandemic. So the economy is stable for the hundredth anniversary celebration. The centenary goals are largely accomplished: GDP is larger, poverty is nearly extinguished, although urban incomes are still lagging (Chart 6). General Secretary Xi Jinping will mark the occasion with a speech. The speech will contribute to his governing philosophy, Xi Jinping Thought, a synthesis of communist Mao Zedong Thought and the pro-capitalist “socialism with Chinese characteristics” pioneered by General Secretary Deng Xiaoping in the 1980s-90s. The effect is to reassert Communist Party and central government primacy after the long period of decentralization that enabled China’s rapid growth phase. It is also to endorse an inward economic turn after the four-decade export-manufacturing boom. The Xi administration’s re-centralization of policy has entailed mini-cycles of tightening and loosening control over the economy. The administration leans against the country’s tendency to gorge itself on debt and grow at any cost – until it must lean the other way for fear of triggering a destabilizing slowdown. For this reason Beijing tightened policy proactively last year, producing a sharp drop in money, credit, and fiscal expansion in 2021 that now threatens to undermine the global recovery. By our measures, any further tightening will result in undershooting the regime’s money and credit targets, i.e. overtightening, and hence threaten to drag on the global recovery (Chart 7). Chart 6China's Communist Party Centenary Goals
China's Communist Party Centenary Goals
China's Communist Party Centenary Goals
Chart 7China Verges On Over-Tightening Policy
China Verges On Over-Tightening Policy
China Verges On Over-Tightening Policy
Overtightening would be a policy mistake with potentially disastrous consequences. So the base case should be that the government will relax policy rather than undermine the post-COVID recovery. However, investors cannot be confident about the timing. The 2015 financial turmoil and renminbi devaluation occurred because policymakers reacted too slowly. One reason to believe policy will be eased is that after July 1 the government will turn its attention to the twentieth national party congress in 2022, the once-in-five-years rotation of the Central Committee and Politburo. The party congress begins at the local level at the beginning of next year and culminates in the fall of 2022 with the national rotation of top party leaders. Xi Jinping was originally slated to step down in 2022. So he needs to squash any last-minute push against him by opposing factions of the party. He may have himself named chairman of the Communist Party, like Mao before him. Most importantly he will put his stamp on the “seventh generation” of China’s leaders by promoting his followers into key positions. All of this suggests that the Xi administration cannot risk triggering a recession, even if its preferences remain hawkish on economic policy. Policy easing could come as early as the end of July. As a rule of thumb, we have noticed that the Politburo’s July meeting on economic policy is often an inflection point, as was the case in 2007, 2015, 2018, and 2020 (Table 1). Some observers claim the April Politburo meeting already signaled an easing in policy, although we do not see that. If July clearly signals relaxation, global investors will cheer and emerging market assets and commodities will rise. Table 1China’s Politburo Often Hits Inflection Point On Economic Policy In July
Third Quarter Outlook 2021: The Pivot To Asia Runs Through Iran
Third Quarter Outlook 2021: The Pivot To Asia Runs Through Iran
Still we maintain a defensive posture going into the third quarter because we do not have a high level of confidence that policymakers will act preemptively. A market riot may precede and motivate the inflection point in policy. Also the negative impact of previous policy tightening will be felt in the third quarter. China plays and industrial metals are extremely vulnerable to further correction (Chart 8). Chart 8China Plays And Metals Vulnerable To Further Correction
China Plays And Metals Vulnerable To Further Correction
China Plays And Metals Vulnerable To Further Correction
The earliest occasion for a Biden-Xi summit comes at the end of October, as mentioned. While US-China talks will occur at some level, relations will remain fundamentally unstable. While a Biden-Xi summit may improve the atmosphere and lead to a new round of strategic and economic dialogue, or Phase Two trade talks, the fact is that the US is seeking to contain China’s rise and China is seeking to break out of the strictures of the US-led world order. The global elite and mainstream media will put a lot of emphasis on the post-Trump return to diplomatic “normalcy” and summits. But this is to overemphasize style at the expense of substance. Note that the positive feelings of the Biden-Putin summit on June 16 fizzled in less than a week when Russia allegedly dropped bombs in the path of a British destroyer in the Black Sea. The US and UK were training Ukraine’s military. Britain denies any bombs were dropped but Russia says next time they will hit their target. (More on this below.) This episode is instructive for US-China relations: summitry is overrated. China is building a sphere of influence and the US no longer believes dialogue alone is the answer. Tit-for-tat punitive measures and proxy battles in China’s neighboring areas, from the Korean peninsula to the Taiwan Strait to the South and East China Seas, are the new normal. Bottom Line: Tactically, stay defensive on global risk assets, especially China plays. Strategically, maintain a constructive outlook on the cycle given the global recovery and China’s need eventually to relax monetary and fiscal policy. US-Iran Deal Likely – Then The Real Trouble Starts The US will likely rejoin the 2015 Iranian nuclear deal (Joint Comprehensive Plan of Action) by August and pull out of its longest-ever war in Afghanistan in September. The US is wrapping up its “forever wars” to meet the demands of a war-weary public. Ironically, the long-term consequence is to create power vacuums that invite new geopolitical conflicts in the context of the US’s great power struggle with China and Russia. But for now a deal with Iran – once it is settled – reduces geopolitical risk by reducing the odds of military escalation in the region. The Iran talks are more significant than the Afghanistan pullout. We are confident in a deal because Biden can rejoin the 2015 deal unilaterally – it was never approved by the US Senate as a formal treaty. The Iranians will not support any militant action so aggressive as to scupper a deal that offers them the chance of reviving their economy at a critical time in the regime’s history. Reviving the deal poses a downside risk for oil prices in the third quarter though not over the long run. It is negative in the short run because investors will have to price not only Iran’s current and future production (Chart 9) but also any resulting loss of OPEC 2.0 discipline. Brent crude is trading at $76 per barrel as we go to press, above the $65-$70 per barrel average that our Commodity & Energy Strategy service expects to see over the coming five years (Chart 10). Chart 9Iran's Oil Production Will Return
Iran's Oil Production Will Return
Iran's Oil Production Will Return
Chart 10Brent Price Faces Short-Term Downside Risk From Iranian Crude
Brent Price Faces Short-Term Downside Risk From Iranian Crude
Brent Price Faces Short-Term Downside Risk From Iranian Crude
The oil price ceiling is enforced by the cartel of oil producers who fear that too high of prices will incentivize US shale oil production as well as the global shift to renewable energy. The Russians have always dragged their feet over oil production cuts and are now pushing for production hikes. The government needs an oil price of around $50-55 per barrel for the budget to break even. The Saudis need higher prices to break even, at $70-75 per barrel. Moscow must coordinate various oil producers, led by the country’s powerful oligarchs and their factions, which is inherently more difficult than the Saudi position of coordinating one producer, Aramco. The Russians and Saudis have maintained cartel discipline so far in 2021, as expected, because the wounds of the market-share war last year are still raw. They retreated from that showdown in less than a month. However, a major escalation in Saudi Arabia’s strategic conflict with Iran could push the Saudis to seek greater market share at Iran’s expense, as occurred before the original Iran deal in 2014-15. Hence our view that the risk to oil prices will shift from the upside to the downside in the second half of the year if the US-Iran deal is reconstituted. Over the long run, the deal is not negative for oil prices. The deal is a tradeoff for lower geopolitical risk today but higher risk in the future. The reason is that Iran’s economic recovery will strengthen its strategic hand and generate a backlash in the region. The global oil supply and demand balance will fluctuate according to circumstances but regional conflict will inject a risk premium over time. Biden’s likely decision to rejoin the 2015 deal should be seen as a delaying tactic. It is impossible to go back to 2015, when the US had mustered a coalition of nations to pressure Iran and when Iran’s “reformist” faction stood to receive a historic boost from the opening of the country’s economy. Now the US lacks a coalition and the reformists are leaving office in disgrace, with the hardliners (“principlists”) taking full power for the foreseeable future. Iran is happy to go back to complying with a deal that consists of sanctions relief in exchange for temporary limits on its nuclear program. The 2015 deal’s restrictions on Iran’s nuclear program begin expiring in 2023 and continue to expire through 2040. Biden has no chance of negotiating a newer and more expansive deal that extends these sunset clauses while also restricting Iran’s ballistic missile program and regional militant activities. He will say that easing sanctions is premised on a broader “follow on” deal to achieve these US goals. But the broader deal is unlikely to materialize anytime soon. The Iranians will commit to future talks but they will have no intention of agreeing to a more expansive deal unless forced. The country’s leaders will never abandon their nuclear program after witnessing the invasions of non-nuclear Libya and Ukraine – in stark contrast with nuclear-armed North Korea. Moreover Biden cannot possibly reassemble the P5+1 coalition with Russia and China anytime soon. The US is directly confronting these states. They could conceivably work with the US when Iran is on the brink of obtaining nuclear weapons but not before then. They did not prevent North Korea. The Supreme Leader Ali Khamenei, the soon-to-be-inaugurated President Ebrahim Raisi, the Iranian Revolutionary Guard Corps, the Ministry of Intelligence, and other pillars of the regime are focused exclusively on strengthening the regime in advance of Khamenei’s impending succession sometime in the coming decade. The succession could easily lead to domestic unrest and a political crisis, which makes the 2020s a critical period for the Islamic Republic. With Tehran focused on a delicate succession, it is not a foregone conclusion that Iran will go on the offensive to expand its sphere of influence immediately after the US deal. But sooner or later a major new geopolitical trend will emerge: the rise of Iran. With sanctions removed, trade and investment increasing, and Chinese and Russian support, Iran will be capable of pursuing its strategic aims in the region more effectively. It will extend its influence across the “Shia Crescent,” including Iraq. The fear that this will inspire in Israel and the Gulf Arab states has already generated a slow-boiling war in the region. This war will intensify as the US will be reluctant to intervene. The purpose of the deal is to enable the war-weary US to reduce its active involvement in the region. The US foreign policy and defense establishment do not entirely see it this way – they emphasize that the US will remain engaged. But US allies in the Middle East will not be convinced. The region already has a taste for the way this works after the US’s precipitous withdrawal from Iraq in 2011, which lead to the rise of the Islamic State terrorist group. Biden will try not to be so precipitous but the writing is on the wall: the US will reduce its focus and commitment. A scramble for power in the region will begin the moment the ink dries on Biden’s signature of the JCPA. Israel and the Arab states are forming a de facto alliance – based on last year’s Abraham Accords – to prepare for Iran’s push to dominate the region. Even if Iran is not overly aggressive (a big if), Israel and the Gulf Arabs will overreact as a result of their fear of abandonment. They will also seek to hedge their bets by improving ties with the Chinese and Russians, making the Middle East the scene of a major new proxy battle in the global great power struggle. As a risk to our view: if the Biden administration changes course this summer and refuses to lift sanctions or rejoin the Iran deal – low but not zero probability – then tensions with Iran will explode almost instantaneously. The Iranians will threaten to close the Strait of Hormuz and a crisis will erupt in the third or fourth quarter. Bottom Line: The US will most likely rejoin the Iranian nuclear deal by August to avoid an immediate crisis or war. The Biden administration will wager that it can lend enough support to regional allies to keep Iran contained. This might work, as the Iranians will focus on fortifying the regime ahead of its leadership succession. However, Iran’s hardline leadership will see an opportunity in America’s withdrawal from its “forever wars.” Iran will increasingly cooperate with Russia and China. Iran’s conflict with Israel and Saudi Arabia will be extremely difficult to manage and will escalate over time, quite possibly creating a revolution or war in Iraq. The Gulf Arabs are already under immense pressure from the green energy revolution. Thus while oil prices might temporarily fall on the return of Iranian exports, they will later see upward pressure from a new wave of Middle Eastern instability. European Political Risk Has (Probably) Bottomed By contrast with all the above we have viewed Europe as a negligible source of (geo)political risk in 2021. European policy uncertainty is falling in Europe relative to these other powers and the rest of the world (Chart 11). Chart 11Europe's Relative Policy Uncertainty Bottoming
Europe's Relative Policy Uncertainty Bottoming
Europe's Relative Policy Uncertainty Bottoming
Chart 12EU Break-Up Risk Hits Floor (Again)
EU Break-Up Risk Hits Floor (Again)
EU Break-Up Risk Hits Floor (Again)
The risk of a break-up of the European Union has wilted and remains at historic lows (Chart 12). There is no immediate threat of any European countries emulating the UK and attempting to exit. Even Italian support for the euro has surged. Immigration flows have plummeted. European solidarity is not on the ballot in the upcoming German and French elections. Germany is choosing between the status quo and a “green revolution” that would not really be a revolution due to the constraints of coalition politics. The Greens have lost some momentum relative to their polling earlier this year but underlying trends suggest they will surprise to the upside in the September 26 vote (Charts 13A and 13B). They embrace EU solidarity, robust government spending, weariness with the Merkel regime, and concerns about climate change, Russia, China, and social justice. Chart 13AGerman Greens Will Surprise To Upside
Third Quarter Outlook 2021: The Pivot To Asia Runs Through Iran
Third Quarter Outlook 2021: The Pivot To Asia Runs Through Iran
Chart 13BGerman Greens Will Surprise To Upside
Third Quarter Outlook 2021: The Pivot To Asia Runs Through Iran
Third Quarter Outlook 2021: The Pivot To Asia Runs Through Iran
We expect the Greens to surprise to the upside. But as they are forced into a coalition with the ruling Christian Democrats then they will be limited to raising spending rather raising taxes (Table 2). The market will cheer this result. Table 2German Greens’ Ambitious Tax Hike Proposals
Third Quarter Outlook 2021: The Pivot To Asia Runs Through Iran
Third Quarter Outlook 2021: The Pivot To Asia Runs Through Iran
If the Greens disappoint then a right-leaning government and too early fiscal tightening could become a risk – but it is a minor risk because Merkel’s hand-picked successor, the CDU Chancellor Candidate Armin Laschet, will be pro-Europe and fiscally dovish, just like the mainstream of his party under Merkel. The only limitation on this dovishness is that it would take another global shock for there to be enough votes in the Bundestag to loosen the schuldenbremse or “debt brake.” In France, President Emmanuel Macron is likely to win re-election – the populist candidate Marine Le Pen remains an underdog who is unlikely to make it through France’s two-round electoral system. In Italy, Prime Minister Mario Draghi is overseeing a national unity coalition that will dole out EU recovery funds. An election cannot be held ahead of the presidential election in January, which will be secured by the establishment parties as a major check on any future populist ruling coalition. The risk in these countries, as in Spain and elsewhere, is that neoliberal structural reform and competitiveness are falling by the wayside. Fiscal largesse is positive for securing the recovery but long-term growth potential will remain depressed (Chart 14). Chart 14European And Global Fiscal Stimulus (Updated June 2021)
Third Quarter Outlook 2021: The Pivot To Asia Runs Through Iran
Third Quarter Outlook 2021: The Pivot To Asia Runs Through Iran
Europe remains stuck in a liquidity trap over the long run. It depends on the rest of the world for growth. This is a problem given that China’s potential growth is slowing and there is no ready substitute that will prop up global growth. Europe is increasingly ripe for negative “black swan” events. The power vacuum in the Middle East described above will lead to instability and regime failures that will threaten European security. Russia will remain aggressive, a reflection of its crumbling structural foundations. The Putin administration has not changed its strategy of building a sphere of influence in the former Soviet Union and pushing back against the West, as signaled by the threat to bomb ships that sail in Crimean waters – a unilateral expansion of Russia’s territorial waters following the Crimean invasion. The Biden administration is not seeking anything comparable to the diplomatic “reset” with Russia from 2009-11, which ended in acrimony. In other words, European political risk may be bottoming as we speak. Investment Takeaways Chart 15Limited Equity Upside From Likely US Infrastructure Bill
Limited Equity Upside From Likely US Infrastructure Bill
Limited Equity Upside From Likely US Infrastructure Bill
US Peak Fiscal Stimulus: The Biden administration is highly likely to pass an infrastructure package through Congress, either as a bipartisan deal with Republicans or as part of the American Jobs Plan. The result is another $1-$1.5 trillion fiscal stimulus, albeit over an eight-year period, with infrastructure funding taking until 2024-25 to ramp up. Biden’s other plans probably will not pass before the 2022 midterm election, which will likely bring gridlock. Investors are well aware of these proposals and the policy setting will probably be frozen after this year. Hence there is limited remaining upside for global materials sector and US infrastructure plays (Chart 15). The extravagant US fiscal thrust of 2020-21 will turn into a huge fiscal drag in 2022 (Chart 16). The Federal Reserve, however, will remain ultra-dovish as long as labor market slack persists – regardless of who is at the helm. Chart 16US Fiscal Drag Very Large In 2022
Third Quarter Outlook 2021: The Pivot To Asia Runs Through Iran
Third Quarter Outlook 2021: The Pivot To Asia Runs Through Iran
Chart 17Go Long Large Caps And Defensives
Go Long Large Caps And Defensives
Go Long Large Caps And Defensives
China’s Headwinds Persist: China may or may not ease policy in time to prevent a market riot. China plays and industrial metals are highly exposed to a correction and we recommend steering clear. US-Iran Deal Weighs On Oil Price: Tactically we are neutral on oil and oil plays. An Iran deal could depress oil prices temporarily – and potentially in a major way if the Saudis agree with the Russians on increasing production. Fundamentals are positive but depend on the OPEC 2.0 cartel. The cartel faces the risk that higher prices will incentivize both alternative oil providers and the green revolution. Europe’s Opportunity: We continue to see the euro and European stocks offering value. Given the troubles with Russia we favor developed Europe plays over emerging Europe. The German election would be a bullish catalyst for European assets but headwinds from China will prevail, which is negative for cyclical European stocks. The Russian Duma election, also in September, creates high potential for Russia to clash with the West between now and then. Tactically, go long global large caps and defensives (Chart 17). Matt Gertken Vice President Geopolitical Strategy mattg@bcaresearch.com Footnotes 1 Independent Vermont Senator Bernie Sanders recently felt it was necessary to warn against a second cold war. Sanders, a democratic socialist, is a reliable indicator of the left wing of the Democratic Party and a dissenter who puts pressure on the center-left Biden administration. His fears underscore the dominance of the new hawkish consensus. Appendix China
China: GeoRisk Indicator
China: GeoRisk Indicator
Russia
Russia: GeoRisk Indicator
Russia: GeoRisk Indicator
UK
UK: GeoRisk Indicator
UK: GeoRisk Indicator
Germany
Germany: GeoRisk Indicator
Germany: GeoRisk Indicator
France
France: GeoRisk Indicator
France: GeoRisk Indicator
Italy
Italy: GeoRisk Indicator
Italy: GeoRisk Indicator
Canada
Canada: GeoRisk Indicator
Canada: GeoRisk Indicator
Spain
Spain: GeoRisk Indicator
Spain: GeoRisk Indicator
Taiwan – Province Of China
Taiwan Territory: GeoRisk Indicator
Taiwan Territory: GeoRisk Indicator
Korea
Korea: GeoRisk Indicator
Korea: GeoRisk Indicator
Turkey
Turkey: GeoRisk Indicator
Turkey: GeoRisk Indicator
Brazil
Brazil: GeoRisk Indicator
Brazil: GeoRisk Indicator
Australia
Australia: GeoRisk Indicator
Australia: GeoRisk Indicator
The S&P 500 raced through the seasonally strong spring months rising by more than 10% from early March. Now, there is the chance that the US equity market will find it difficult grinding higher if the proverbial “sell in May and go away” attitude kicks in. As a reminder, we also recently rotated into quality growth names and took down some of the high-octane cyclical sectors such as the S&P steel index. Both of these moves should protect our portfolio if volatility comes back this summer. Bottom Line: If history is any guide, we expect market to be range bound throughout the summer.
Brace For Summer
Brace For Summer
Highlights The ongoing transition to a post-pandemic state and fiscal policy are either positive or net-neutral for risky asset prices. Fiscal thrust will turn to fiscal drag over the coming year, but the negative impact this will have on goods spending will likely be offset by a significant improvement in services spending, and thus is not likely to cause a concerning slowdown in overall economic activity. A modestly hawkish shift in the outlook for monetary policy is likely over the coming year, potentially occurring over the late summer or early fall in response to outsized jobs growth. However, such a shift is not likely to become a negative driver for risky asset prices over the coming 6-12 months, barring a major rise in market expectations for the neutral rate of interest. This may very well occur once the Fed begins to raise interest rates, but not likely before. Investors should overweight risky assets within a multi-asset portfolio, and fixed-income investors should maintain a below-benchmark duration position. We continue to favor value over growth on a 6-12 month time horizon, although growth may outperform in the near term. A bias toward value over the coming year supports an overweight stance toward global ex-US equities, and an overall pro-risk stance favors bearish US dollar bets. Feature Three factors continue to drive our global macroeconomic outlook and our cyclical investment recommendations. The first factor is our assessment of the global progress that is being made on the path to a post-pandemic state, and the return to pre-COVID economic conditions; the second is the likely contribution to growth from fiscal policy over the coming year; and the third is the outlook for monetary policy and whether or not monetary conditions will remain stimulative for both economic activity and financial markets. If the world continues to progress meaningfully on the path to a post-pandemic state, and if the impact of fiscal and monetary policy remains in line with market expectations, then we see no reason to alter our recommended investment stance. Equity market returns will be modest over the coming 6 to 12 months in this scenario given how significantly stocks have rebounded from their low last year, but we would still expect stocks to outperform bonds and would generally be pro-cyclically positioned. We present below our assessment of these three factors and their potential to deviate from consensus expectations over the coming year, to determine their likely impact on economic activity and financial markets. The Ongoing Transition To A Post-Pandemic World Chart I-1Enormous Progress Has Been Made In The Fight Against COVID-19
Enormous Progress Has Been Made In The Fight Against COVID-19
Enormous Progress Has Been Made In The Fight Against COVID-19
Chart I-1 highlights that meaningful progress continues to be made in vaccinating the world's population against COVID-19. North America and Europe continue to lead the rest of the world based on the share of people who have received at least one dose, but South America continues to make significant gains, and recent data updates highlight that Asia and Oceania are also making meaningful progress. Africa is the clear laggard in the war against SARS-COV-2 and its variants, but progress there has been delayed, at least in part, by India’s export restrictions of the Oxford-AstraZeneca/COVISHIELD vaccine. This suggests that, while Africa will continue to lag, the share of Africans provided with a first dose of vaccine will begin to rise once India resumes its exports and deliveries to African countries under the COVAX program continue. If variants of the disease were not a source of concern, Chart I-1 would highlight that the full transition to a post-pandemic economy over the next several months would be near certain. However, as evidenced by the recent decision in the UK to postpone the lifting of COVID-19 restrictions by 4 weeks due to the spreading of the Delta variant, the global economy is not entirely out of the woods yet. Encouragingly, the delay in the UK genuinely appears to be temporary. Chart I-2 highlights that while the number of confirmed UK COVID-19 cases has been rising over the past month, the uptick in hospitalizations and fatalities has so far been quite muted. Importantly, the rise in hospitalizations appears to be occurring among those who have not yet been fully vaccinated, underscoring that variants of the disease are only truly concerning if they are vaccine-resistant. The evidence so far is that the Delta variant is more transmissible and may increase the risk of hospitalization, but that two doses of COVID-19 vaccine offer high protection. Of course, vaccines only offer protection if you get them, and evidence of vaccination hesitancy in the US is thus a somewhat worrying sign. Chart I-3 shows that the daily pace of vaccinations in the US has slowed significantly from mid-April levels, resulting in a slower rise in the share of the population that has received at least one dose (second panel). On this metric, the US has recently been outpaced by Canada, and the gap between the UK and the US is now widening. Germany and France are close behind the US and may surpass it soon. Chart I-2The UK Delay In Removing Restrictions Seems Genuinely Temporary
The UK Delay In Removing Restrictions Seems Genuinely Temporary
The UK Delay In Removing Restrictions Seems Genuinely Temporary
Chart I-3Recent Vaccination Progress In The US Has Been Underwhelming
Recent Vaccination Progress In The US Has Been Underwhelming
Recent Vaccination Progress In The US Has Been Underwhelming
Sadly, Chart I-4 highlights that there is a political dimension to vaccine hesitancy in the US. The chart shows that state by state vaccination rates as a share of the population are strongly predicted by the share of the popular vote for Donald Trump in the 2020 US presidential election. Admittedly, part of this relationship may also be capturing an urban/rural divide, with residents in less-dense rural areas (which typically support Republican presidential candidates) perhaps feeling a lower sense of urgency to become vaccinated against the disease. Chart I-4The US Politicization Of Vaccines Raises The Risk From COVID-19 Variants
July 2021
July 2021
But given the clear politicization that has already occurred over some pandemic control measures, such as the wearing of masks, Chart I-4 makes it difficult to avoid the conclusion that the same thing has occurred for vaccines. This is unfortunate, and seemingly raises the risk that the Delta variant may spread widely in red states over the coming several months, potentially delaying economic reopening, or risking the reintroduction of pandemic control measures. However, there are two counterarguments to this concern. First, non-vaccine immunity is probably higher in red than blue states, and CDC data suggest that this effect could be large. While this figure is still preliminary and subject to change (and likely will), the CDC estimates that only 1 out of 4.3 cases of COVID-19 were reported from February 2020 to March 2021. Taken at face value, this implies that there were approximately 115 million infections during that period, compared with under 30 million reported cases. That gap accounts for 25% of the US population, and given that red states were slower to implement pandemic control measures last year and their residents often more resistant to the measures, it stands to reason that a disproportionate share of unreported cases occurred in these states. Second, as noted above, the evidence thus far suggests that the Delta variant is not vaccine resistant, at least for those who are fully vaccinated. This is significant because if Delta were to spread widely in red states over the coming several months, the resulting increase in hospitalizations would likely convince many vaccine hesitant Americans to become vaccinated out of fear and self-interest – two powerfully motivating factors. Thus, the Delta variant may become a problem for the US in the fall, but if that occurs a solution is not far from sight. And, in other developed countries where vaccine hesitancy rates appear to be lower, it would seem that a new, vaccine-resistant variant of the disease would likely be required in order to cause a major disruption in the transition to a post-pandemic state. Such a variant could emerge, but we have seen no evidence thus far that one will before vaccination rates reach levels that would slash the odds of further widespread mutation. Fiscal Policy: Passing The Baton To Services Spending Chart I-5 highlights that US fiscal policy is set to detract from growth over the coming 6-12 months, reflecting the one-off nature of some of the fiscal response to the pandemic. This is true outside of the US as well, as Chart I-6 highlights that the IMF is forecasting a two percentage point increase in the Euro Area’s cyclically-adjusted primary budget balance, representing a significant amount of fiscal drag relative to the past two decades. Chart I-5Fiscal Thrust Will Eventually Turn To Fiscal Drag In The US…
July 2021
July 2021
Should investors be concerned about the impact of fiscal drag on advanced economies over the coming year? In our view, the answer is no. The reason is that much of the fiscal response in the US and Europe has been aimed at supporting income that has been lost due to a drastic reduction in services spending, which will continue to recover over the coming months as the effect of the pandemic continues to ebb. Chart I-7 underscores this point by highlighting the “gap” in US consumer goods and services spending relative to its pre-pandemic trend. The chart highlights that US goods spending is running well above what would be expected, whereas there is a sizeable gap in services spending (which accounts for approximately 70% of US personal consumption expenditures). Goods spending will likely slow as fiscal thrust turns to fiscal drag, but services spending will improve meaningfully – aided not just by a post-pandemic normalization in economic activity, but also by the sizeable amount of excess savings that US households have accumulated over the past year (Chart I-7, panel 2). Chart I-6... And In Europe
... And In Europe
... And In Europe
Chart I-7But Reduced Transfers Will Only Impact Spending On Goods, Not Services
But Reduced Transfers Will Only Impact Spending On Goods, Not Services
But Reduced Transfers Will Only Impact Spending On Goods, Not Services
While some of these savings have already been deployed to pay down debt and some may be permanently saved in anticipation of higher future taxes, the key point for investors is that the negative impact on goods spending from reduced fiscal thrust will be offset by a significant improvement in services spending, and thus is not likely to cause a concerning slowdown in overall economic activity. Monetary Policy: A Modestly Hawkish Shift Is Likely This leaves us with the question of whether or not monetary policy will become a negative driver for risky asset prices over the coming 6-12 months, which is especially relevant following last week’s FOMC meeting. The updated “dot plot” following the meeting shows that 7 of the 18 FOMC participants anticipate a rate hike in 2022, and the majority (13 members) expect at least one rate hike before the end of 2023, raising the median forecast for the Fed funds rate to 0.6% by the end of that year. Chart I-8 highlights that while 10-year Treasury yields remains mostly unchanged following the meeting, yields moved higher at the short-end and middle of the curve. Chart I-8The FOMC Meeting Resulted In Higher Short- And Mid-Term Yields
The FOMC Meeting Resulted In Higher Short- And Mid-Term Yields
The FOMC Meeting Resulted In Higher Short- And Mid-Term Yields
Investor fears that the Fed may shift in a significantly hawkish direction at some point over the next year have been far too focused on inflation, and far too little focused on employment. It is not a coincidence that the Fed’s guidance was updated following the May jobs report, which saw a stronger pace of jobs growth relative to April. Table I-1 updates our US Bond Strategy service’s calculations showing the average monthly nonfarm payroll growth that will be required for the unemployment rate to reach 3.5-4.5% assuming a full recovery in the participation rate, which is the range of the Fed’s NAIRU estimates. May’s payroll growth number of 560k implies that the Fed’s maximum employment criterion will be met sometime between June and September next year, if monthly payroll growth continues at that pace. Table I-1Calculating The Distance To Maximum Employment
July 2021
July 2021
Chart I-9Lighter Restrictions In Blue States Will Push Down The Unemployment Rate
Lighter Restrictions In Blue States Will Push Down The Unemployment Rate
Lighter Restrictions In Blue States Will Push Down The Unemployment Rate
It is currently difficult to assess with great confidence what average payroll growth will prevail over the coming year, but we noted in last month’s report that there were compelling arguments in favor of outsized jobs growth this fall.1 In addition to those points, we note the following: Blue states have generally been slower to reopen their economies, and Chart I-9 highlights that these states have consequently been slower to return to their pre-pandemic unemployment rate. Among blue states, California and New York are the largest by population, and it is notable that both states only lifted most COVID-19 restrictions on June 15 – including the wearing of masks in most settings. This implies that services jobs are likely to grow significantly in these states over the coming few months. Both consensus private forecasts as well as the Fed’s expectation for real GDP growth imply that the output gap will be closed by Q4 of this year (Chart I-10). These expectations appear to be reasonable, given the substantial amount of excess savings that have been accumulated by US households and the fact that monetary policy remains extremely stimulative. When the output gap turned positive during the last economic cycle, the unemployment rate was approximately 4% – well within the Fed’s NAIRU range. Chart I-10 also shows that the Fed’s 7% real GDP growth forecast for this year would put the output gap above its pre-pandemic level, when the unemployment rate stood at 3.5%. In fact, it is possible that annualized Q2 real GDP growth will disappoint current consensus expectations of 10%, due to the scarcity of labor supply (scarcity that will be eased by labor day when supplemental unemployment insurance benefit programs end). Were Q2 GDP to disappoint due to supply-side limitations, it would strengthen the view that job gains will be very strong this fall ceteris paribus, as it would highlight that real output per worker cannot rise meaningfully further in the short-term and that stronger growth later in the year will necessitate very large job gains. Chart I-11 highlights that US air travel and New York City subway ridership have already returned close to 75% and 50% of their pre-pandemic levels, respectively. Based on the trend over the past three months, the chart implies that air travel will return to its pre-pandemic levels by mid-October of this year, and New York City subway ridership by June 2022. This underscores that travel-related services employment will recover significantly in the fall, and that jobs in downtown cores will rebound as office workers progressively return to work. Chart I-10Expectations For Growth This Year Suggest A Rapid Decline In The Unemployment Rate
Expectations For Growth This Year Suggest A Rapid Decline In The Unemployment Rate
Expectations For Growth This Year Suggest A Rapid Decline In The Unemployment Rate
Chart I-11Services Employment Will Recover In The Fall
Services Employment Will Recover In The Fall
Services Employment Will Recover In The Fall
On the latter point, one major outstanding question affecting the outlook for monetary policy is the magnitude of the likely permanent impact of work from home policies on employment in central business districts. Fewer office workers commuting to downtown office locations suggests that some jobs in the leisure & hospitality, retail trade, professional & business services, and other services industries will never return or will be very slow to do so, arguing for a longer return to maximum employment (and the Fed’s liftoff date). We examine this question in depth in Section 2 of this month’s report, and find that the “stickiness” of work from home policies will likely cause permanent central business job losses on the order of 575k (or 0.35% of the February 2020 labor force). While this would be non-trivial, when compared with a pre-pandemic unemployment rate of 3.5%, WFH policies alone are not likely to cause a long-term deviation from the Fed’s maximum employment objective. Outsized jobs growth this fall, at a pace that quickly reduces the unemployment rate, argues for a first Fed rate hike that is even earlier than the market expects. Chart I-12 presents The Bank Credit Analyst service’s current assessment of the cumulative odds of the Fed’s liftoff date by quarter; we believe that it is likely that the Fed will have raised rates by Q3 of next year, and that a rate hike in the first half of 2022 is a possibility. These odds are slightly more aggressive than those presented by our fixed-income strategists in a recent Special Report,2 but are consistent with their view that the Fed will raise interest rates by the end of next year. Chart I-12The Bank Credit Analyst’s Assessment Of The Odds Of The First Rate Hike
July 2021
July 2021
The odds presented in Chart I-12 are also more hawkish than the Fed funds rate path currently implied by the OIS curve, meaning that we expect investors to be somewhat surprised by a shifting monetary policy outlook at some point over the coming year, potentially over the next 3-6 months. Payroll growth during the late summer and early fall will be a major test for the employment outlook, and is the most likely point for a hawkish shift in the market’s view of monetary policy. Is this likely to become a negative driver for risky asset prices over the coming 6-12 months? In our view, the answer is “probably not.” While investors tend to focus heavily on the timing of the first rate hike as monetary policy begins to tighten, the reality is that it is the least relevant factor driving the fair value of 10-year Treasury yields. Investor expectations for the pace of tightening and especially for the terminal Fed funds rate are far more important, and, while it is quite possible that expectations for the neutral rate of interest will eventually rise, it seems unlikely that this will occur before the Fed actually begins to raise interest rates given that most investors accept the secular stagnation narrative and the view that “R-star” is well below trend rates of growth (we disagree).3 Chart I-13 highlights the fair value path of 10-year Treasury yields until the end of next year, assuming a 2.5% terminal Fed funds rate, no term premium, and a rate hike pace of 1% per year. The chart highlights that while government bond yields are set to move higher over the coming 6-12 months, they are likely to remain between 2-2.5%. This would drop the equity risk premium to a post-2008 low (Chart I-14), which would further reduce the attractiveness of stocks relative to bonds. But we doubt that this would be enough of a decline to cause a selloff, and it would still imply a stimulative level of interest rates for households and firms. Chart I-1310-Year Yields Will Rise Over The Coming Year, But Not Sharply
10-Year Yields Will Rise Over The Coming Year, But Not Sharply
10-Year Yields Will Rise Over The Coming Year, But Not Sharply
Chart I-14Rising Yields Will Cause An Unwelcome But Contained Decline In The ERP
Rising Yields Will Cause An Unwelcome But Contained Decline In The ERP
Rising Yields Will Cause An Unwelcome But Contained Decline In The ERP
Investment Conclusions Among the three factors driving our global macroeconomic outlook and our cyclical investment recommendations, continued progress on the path toward a post-pandemic state and fiscal policy remain either positive or mostly neutral for risky assets. A potentially hawkish shift in the outlook for monetary policy this fall remains the chief risk, but we expect the rise in bond yields over the coming year to remain well-contained barring a sea change in investor expectations for the terminal Fed funds rate – which we believe is unlikely to occur before the Fed begins to raise interest rates. Consequently, we continue to recommend that investors should overweight risky assets within a multi-asset portfolio, and that fixed-income investors should maintain a below-benchmark duration position. We expect modest absolute returns from global equities, but even mid-single digit returns are likely to beat those from long-dated government bonds and cash positions. While value stocks may underperform growth stocks over the coming 3-4 months,4 rising bond yields over the coming year will ultimately favor value stocks and will likely weigh on elevated tech sector (and therefore growth stock) valuations (Chart I-15). Chart I-16 highlights that the attractiveness of US value versus growth is meaningfully less compelling for the S&P 500 Citigroup indexes, suggesting that investors should continue to favor MSCI-benchmarked value over growth positions over a 6-12 month time horizon.5 Chart I-15Value Is Extremely Cheap
Value Is Extremely Cheap
Value Is Extremely Cheap
Chart I-16Value Vs. Growth: The Benchmark Matters
Value Vs. Growth: The Benchmark Matters
Value Vs. Growth: The Benchmark Matters
The likely outperformance of value versus growth also has implications for regional allocation within a global equity portfolio. The US is significantly overweight broadly-defined technology relative to global ex-US stocks, and financials – which are overrepresented in value indexes – have already meaningfully outperformed in the US this year compared with their global peers and are now rolling over (Chart I-17). This underscores that investors should favor ex-US stocks over the coming year, skewed in favor of DM ex-US given that China’s credit impulse continues to slow (Chart I-18). Chart I-17Favor Global Ex-US Stocks Over The Coming Year
Favor Global Ex-US Stocks Over The Coming Year
Favor Global Ex-US Stocks Over The Coming Year
Chart I-18Concentrate Global Ex-US Exposure In Developed Markets
Concentrate Global Ex-US Exposure In Developed Markets
Concentrate Global Ex-US Exposure In Developed Markets
Finally, global ex-US stocks also tend to outperform when the US dollar is falling, and we would recommend that investors maintain a short dollar position on a 6-12 month time horizon despite the recent bounce in the greenback. Chart I-19 highlights that the dollar remains strongly negatively correlated with global equity returns, and that the dollar’s performance over the past year has been almost exactly in line with what one would have expected given this relationship. Thus, a bullish view toward global stocks implies both US dollar weakness and global ex-US outperformance over the coming year. Chart I-19A Bullish View Towards Global Stocks Implies A Dollar Bear Market
A Bullish View Towards Global Stocks Implies A Dollar Bear Market
A Bullish View Towards Global Stocks Implies A Dollar Bear Market
Jonathan LaBerge, CFA Vice President The Bank Credit Analyst June 24, 2021 Next Report: July 29, 2021 II. Work From Home “Stickiness” And The Outlook For Monetary Policy Work from home policies, originally designed as emergency measures in the early phase of the COVID-19 pandemic, are likely to be “sticky” in a post-pandemic world. This will negatively impact the labor market in central business districts, via reduced spending on services by office workers. The potential impact of working from home is often cited as an example of what is likely to be a lasting and negative effect on jobs growth, but we find that it is not likely to be a barrier to the labor market returning to the Fed’s assessment of “maximum employment.” The size of the impact depends importantly on whether employee preferences or employer plans for WFH prevail, but our sense is that the latter is more likely. A weaker pace of structures investment in response to elevated office vacancy rates will likely have an even smaller impact on growth than the effect of reduced central business district services employment. The contribution to growth from structures investment has been small over the past few decades, office building construction is a small portion of overall nonresidential structures, and there are compelling arguments that the net stock of office structures will stay flat, rather than decline. Our analysis suggests that job growth over the coming year could be even stronger than the Fed and investors expect, possibly resulting in a first rate hike by the middle of next year. This would be earlier than we currently anticipate, but it underscores that fixed-income investors should remain short duration on a 6-12 month time horizon, and that equity investors should favor value over growth positions beyond the coming 3-4 months. The outlook for US monetary policy over the next 12 to 18 months depends almost entirely on the outlook for employment. Many investors are focused on the potential for elevated inflation to force the Fed to raise interest rates earlier than it currently anticipates, but it is the progress in returning to “maximum employment” that will determine the timing of the first Fed rate hike – and potentially the speed at which interest rates rise once policy begins to tighten. In this report, we estimate the extent to which the “stickiness” of working from home (WFH) policies and practices could leave a lasting negative impact on the US labor market. We noted in last month's report that a large portion of the employment gap relative to pre-pandemic levels can be traced to the leisure & hospitality and professional and business services industries, both of which – along with retail employment – stand to be permanently impaired if the office worker footprint is much lower in a post-COVID world.6 Using employee surveys and a Monte Carlo approach, we present a range of estimates for the permanent impact of WFH policies on the unemployment rate, and separately examine the potential for lower construction of office properties to weigh on growth. We find that the impact of reduced office building construction is likely to be minimal, and that WFH policies may structurally raise the unemployment rate by 0.3 to 0.4%. While non-trivial, when compared with a pre-pandemic unemployment rate of 3.5%, WFH policies alone are not likely to cause a long-term deviation from the Fed’s maximum employment objective. Relative to the Fed’s expectations of a strong, lasting impact on the labor market from the pandemic, this suggests that job growth over the coming year could be even stronger than the Fed and investors expect, possibly resulting in a first rate hike by the middle of next year. This would be earlier than we currently anticipate, but it underscores that fixed-income investors should remain short duration on a 6-12 month time horizon, and that equity investors should favor value over growth positions beyond the coming 3-4 months (a period that may see outperformance of the latter). Quantifying The Labor Market Impact Of The New Normal For Work In a January paper, Barrero, Bloom, and Davis (“BBD”) presented evidence arguing why working from home will “stick.” The authors surveyed 22,500 working-age Americans across several survey “waves” between May and December 2020, and asked about both their preferences and their employer’s plans about working from home after the pandemic. Chart II-1 highlights that the desired amount of paid work from home days (among workers who can work from home) reported by the survey respondents is to approximately 55% of a work week, suggesting that a dramatic reduction in office presence would likely occur if post-pandemic WFH policies were set fully in accordance with worker preferences. Chart II-1Employee Preferences Imply A Dramatic Reduction In Post-COVID Office Presence
July 2021
July 2021
However, Table II-1 highlights that employer plans for work from home policies are meaningfully different than those of employees. The table highlights that employers plan for employees to work from home for roughly 22% of paid days post-pandemic, which essentially translates to one day per week on average.7 BBD noted that CEOs and managers have cited the need to support innovation, employee motivation, and company culture as reasons for employees’ physical presence. Managers believe physical interactions are important for these reasons, but employees need only be on premises for about three to four days a week to achieve this. Table II-1 also shows that employers plan to allow higher-income employees more flexibility in terms of working from home, and less flexibility to employees whose earnings are between $20-50k per year. Table II-1Employer Plans, However, Imply Less Working From Home Than Employees Prefer
July 2021
July 2021
Based on the survey results, BBD forecast that expenditure in major cities such as Manhattan and San Francisco will fall on the order of 5 to 10%. In order to understand the national labor market impact of work from home policies and what implications this may have on monetary policy, we scale up BBD’s calculations using a Monte Carlo approach that incorporates estimate ranges for several factors: The percent of paid days now working from home for office workers The amount of money spent per week by office workers in central business districts (“CBDs”) The number of total jobs in CBDs The percent of CBD jobs in industries likely to be negatively impacted by reduced office worker expenditure The average weekly earnings of affected CBD workers The average share of business revenue not attributable to strictly variable expenses The percent of affected jobs likely to be recovered outside of CBDs Our approach is as follows. First, we calculate the likely reduction in nationwide CBD spending from reduced office worker presence by multiplying the likely percent of paid days now permanently working from home by the number of total jobs in CBDs and the average weekly spending of office workers. This figure is then increased due to the estimated acceleration in net move outs from principal urban centers in 2020 (Chart II-2); we assume a 5% savings rate and an average annual salary of $50k for these resident workers, and assume that all of their spending occurred within CBDs. We also assume that roughly 50% of jobs connected to this spending are recovered. Chart II-2Fewer Residents Will Also Lower Spending In Central Business Districts
July 2021
July 2021
Then, we calculate the gross number of jobs lost in leisure & hospitality, retail trade, and other services by multiplying this estimate of lost spending by an estimate of non-variable costs as a share of revenue for affected industries, and dividing the result by average weekly earnings of affected employees. For affected CBD employees in the administrative and waste services industry, we simply assume that the share of jobs lost matches the percent of paid days now permanently working from home. Finally, we adjust the number of jobs lost by multiplying by 1 minus an assumed “recovery” rate, given that some of the reduction in spending in CBDs will simply be shifted to areas near remote workers’ residences. We assume a slightly lower recovery rate for lost jobs in the administrative and waste services industry. Table II-2 highlights the range of outcomes for each variable used in our simulation, and Charts II-3 and II-4 present the results. The charts highlight that the distribution of outcomes based on employer WFH intensions suggest high odds that nationwide job losses in CBDs due to reduced office worker presence will not exceed 400k. Based on average employee preferences, that number rises to roughly 800-900k. Table II-2The Factors Affecting Permanent Central Business District Job Losses
July 2021
July 2021
Chart II-3The Probability Distribution Of CBD Jobs Lost…
July 2021
July 2021
Chart II-4…Based On Our Monte Carlo Approach
July 2021
July 2021
This raises the question of whether employer plans or employee preferences for WFH arrangements will prevail. Our sense is that it will be closer to the former, given that we noted above that employer WFH plans are the least flexible for employees whose earnings are between $20-50k per year (who are presumably employees who have less ability to influence the policy of firms). Chart II-5 re-presents the projected job losses shown in Chart II-4 as a share of the February 2020 labor force, along with a probability-weighted path that assumes a 75% chance that employer WFH plans will prevail. The chart highlights that WFH arrangements would have the effect of raising the unemployment rate by approximately 0.35%. However, relative to a pre-pandemic starting point of 3.5%, this would raise the unemployment rate to a level that would still be within the Fed’s NAIRU estimates (Chart II-6). Therefore, the “stickiness” of WFH arrangements alone do not seem to be a barrier to the labor market returning to the Fed’s assessment of “maximum employment,” suggesting that the conditions for liftoff may be met earlier than currently anticipated by investors. Chart II-5CBD Job Losses Will Not Be Trivial, But They Will Not Be Enormous
July 2021
July 2021
Chart II-6Sticky WFH Policies Will Not Prevent A Return To Maximum Employment
Sticky WFH Policies Will Not Prevent A Return To Maximum Employment
Sticky WFH Policies Will Not Prevent A Return To Maximum Employment
The Impact Of Lower Office Building Construction A permanently reduced office footprint could also conceivably impact the US economy through reduced nonresidential structures investment, as builders of commercial real estate cease to construct new office towers in response to expectations of a long-lasting glut. However, several points highlight that the negative impact on growth from US office tower construction will be even smaller than the CBD employment impact of reduced office worker presence that we noted above. First, Chart II-7 highlights the overall muted impact that nonresidential building investment has had on real GDP growth by removing the contribution to growth from nonresidential structures and for overall nonresidential investment. The chart clearly highlights that the historically positive contribution to real US output from capital expenditures over the past four decades has come from investment in equipment and intellectual property products, not from structures. Chart II-8 echoes this point, by highlighting that US real investment in nonresidential structures has in fact been flat since the early-1980s, contributing positively and negatively to growth only on a cyclical basis (not on a structural basis). Chart II-7Structures Have Not Contributed Significantly To US Growth For Some Time
Structures Have Not Contributed Significantly To US Growth For Some Time
Structures Have Not Contributed Significantly To US Growth For Some Time
Chart II-8Nonresidential Structures Investment Has Been Flat For Four Decades
Nonresidential Structures Investment Has Been Flat For Four Decades
Nonresidential Structures Investment Has Been Flat For Four Decades
Second, Table II-3 highlights that office properties make up a small portion of investment in private nonresidential structures. In 2019, nominal investment in office structures amounted to $85 billion, compared with $630 billion in overall structures investment, meaning that office properties amounted to just 13% of structures investment. Table II-3Office Structures Investment Is A Small Share Of Total Structures Investment
July 2021
July 2021
Table II-4Conceivably, Vacant Office Properties Could Be Converted To Luxury Residential Units
July 2021
July 2021
Third, it is true that investment is a flow and not a stock variable, meaning that, if the net stock of office buildings were to fall as a result from WFH policies, then the US economy would see a potentially persistently negative rate of growth from nonresidential structures (which would constitute a drag on growth). But if the net stock were instead to remain flat, then gross office property investment should equal the depreciation of those structures. The second column of Table II-3 highlights that current-cost depreciation of office structures was $53 billion in 2019 (versus nominal gross investment of $85 billion). Had office property investment been ~$30 billion lower in 2019, it would have reduced nominal GDP by a mere 14 basis points (resulting in an annual growth rate of 3.84%, rather than 3.98%). Fourth, there is good reason to believe that the net stock of office properties will stay flat, as the economics of converting offices to luxury housing units (whose demand is not substantially affected by factors such as commuting) – either fully or partially into mixed-use buildings – appear to be plausible. Table II-4 highlights that the average annual asking rent for office space per square foot in Manhattan was $73.23 in Q1 2021, and that the recent median listing home price per square foot is roughly $1,400. In a frictionless world where office space could be instantly and effortlessly sold as residential property, existing prices would imply a healthy (gross) rental yield of 5.2%. Thoughts On The Future Of Office Properties Of course, reality is far from frictionless. There are several barriers that will slow office-to-residential conversion as well as construction costs, which will meaningfully lower the net value of existing office real estate in large central business districts such as Manhattan. In a recent article in the Washington Post, Roger K. Lewis, retired architect and Professor Emeritus of Architecture at the University of Maryland, College Park, detailed several of these technical barriers (which we summarize below).8 Office buildings are typically much wider than residential buildings, the latter usually being 60 to 65 feet in width in order to enable windows and natural light in living/dining rooms and bedrooms. This suggests that office-to-residential conversion might require modifying the basic structure of office buildings, including cutting open parts of roof and floor plates on upper building levels to bring natural light into habitable and interior rooms, and other costly structural modifications to address the additional plumbing and infrastructure that will be needed. Lewis noted that floor-to-floor dimensions are typically larger in office buildings, which is beneficial for office-to-residential conversion because increased room heights augments the sense of space and openness, while allowing natural light to penetrate farther into the apartment. It also allows for extra space to place needed additional building infrastructure, such as sprinkler pipes, electrical conduits, light fixtures, and air ducts. But unique apartment layouts are often needed to use available floor space effectively in an office-to-residential conversion, which will increase design costs and raise the risk that nonstandard layouts may result in unforeseen quality-of-living problems that will necessitate additional future construction to correct. Zoning regulations and building code constraints will likely add another layer of costs to office-to-housing conversions, as these rules are written for conventional buildings, meaning that special exceptions or even regulatory changes are likely to be required. So it is clear that the process of converting office space to residential property will be a costly endeavor for office tower owners, which will likely reduce the net present value of these properties relative to pre-pandemic levels. But; this process appears to be feasible and, when faced with the alternative of persistently high vacancy rates and lost revenue, our sense is that office tower owners will choose this route – thus significantly reducing the likelihood that the growth in national gross investment in office properties will fall below the rate of depreciation. In addition, the trend in suburban and CBD office property prices suggests that there are two other possible alternatives to widespread office-to-residential conversion that would also argue against a significant and long-lasting decline in office structures investment. Chart II-9 highlights that the average asking rent has already fallen significantly in most Manhattan submarkets, and Chart II-10 highlights that suburban office prices are accelerating and rising at the strongest pace relative to CBD office prices over the past two decades, possibly in response to increased demand for workspace that is closer to home for many workers who previously commuted to CBDs. Chart II-9Working From The Office Is Getting Cheaper
July 2021
July 2021
Chart II-10Suburban Offices Are Getting More Expensive
Suburban Offices Are Getting More Expensive
Suburban Offices Are Getting More Expensive
Thus, the first alternative outcome to CBD office-to-residential conversion is that an increase in suburban office construction offsets the negative impact of outright reductions in CBD office investment if residential conversions prove to be too costly or too technically challenging. The second alternative is that owners of CBD office properties “clear the market” by dramatically cutting rental rates even further, to alter the cost/benefit calculation for firms planning permissive WFH policies. We doubt that existing rents reflect the extent of vacancies in large cities such as Manhattan, so we would expect further CBD office price declines in this scenario. But if owners of centrally-located office properties face significant conversion costs and a decline in the net present value of these buildings is unavoidable and its magnitude uncertain, owners may choose to cut prices drastically as the simpler solution. Investment Conclusions Holding all else equal, the fact that owners of CBD office properties are likely to experience some permanent decline in the value of these real estate assets is not a positive development for economic activity. But these losses will be experienced by firms, investors, and ultra-high net worth individuals with strong marginal propensities to save, suggesting that the economic impact from this shock will be minimal. And as we highlighted above, a decline in the pace of gross office building investment to the depreciation rate will have a minimal impact on the overall economy. This leaves the likely impact on CBD employment as the main channel by which WFH policies are likely to affect monetary policy. As we noted above and as discussed in Section 1 of our report, the Fed is now focused entirely on the return of the labor market to maximum employment, which we interpret as an unemployment rate within the range of the Fed’s NAIRU estimates (3.5% - 4.5%) and a return to a pre-pandemic labor force participation rate. Chart II-11On A One-Year Time Horizon, Favor Value Over Growth
On A One-Year Time Horizon, Favor Value Over Growth
On A One-Year Time Horizon, Favor Value Over Growth
Our analysis indicates that WFH policies may structurally raise the unemployment rate by 0.3 to 0.4%. While non-trivial, when compared with a pre-pandemic unemployment rate of 3.5%, this suggests that WFH policies alone are not likely to cause a long-term deviation from the Fed’s maximum employment objective. The implication is that job growth over the coming year could be even stronger than the Fed and investors expect, which could mean that the Fed may begin lifting rates by the middle of next year barring a major disruption in the ongoing transition to a post-pandemic world. This is earlier than we currently expect, but the fact that it would also be earlier than what is currently priced into the OIS curve underscores that fixed-income investors should remain short duration on a 6-12 month time horizon. In addition, as noted in Section 1 of our report, while value stocks may underperform growth stocks over the coming 3-4 months,9 rising bond yields over the coming year will ultimately favor value stocks and will likely weigh on elevated tech sector valuations. Chart II-11 highlights that the relative valuation of growth stocks remains above its pre-pandemic starting point (Chart II-11), suggesting that investors should continue to favor MSCI-benchmarked value over growth positions over a 6-12 month time horizon. Finally, as also noted in Section 1 of our report, we do not expect rising bond yields to prevent stock prices from grinding higher over the coming year, unless investor expectations for the terminal fed funds rate move sharply higher – an event that seems unlikely, although not impossible, before monetary policy actually begins to tighten. Jonathan LaBerge, CFA Vice President The Bank Credit Analyst III. Indicators And Reference Charts BCA’s equity indicators highlight that the “easy” money from expectations of an eventual end to the pandemic have already been made. Our technical, valuation, and sentiment indicators are very extended, highlighting that investors should expect positive but more modest returns from stocks over the coming 6-12 months. Our monetary indicator has aggressively retreated from its high last year, reflecting a meaningful recovery in government bond yields since last August. The indicator still remains above the boom/bust line, however, highlighting that monetary policy remains supportive for risky asset prices. Forward equity earnings already price in a complete earnings recovery, but for now there is no meaningful sign of waning forward earnings momentum. Net revisions remain very strong, and positive earnings surprises have risen to their highest levels on record. Within a global equity portfolio, there has been a modest tick down in global ex-US equity performance, driven by a rally in growth stocks (which may persist for a few months). EM stocks had previously dragged down global ex-US performance, and they continue to languish. A bias towards value stocks on a 1-year time horizon means that investors should still favor ex-US stocks over the coming year, skewed in favor of DM ex-US given that China’s credit impulse continues to slow. The US 10-Year Treasury yield has trended modestly lower since mid-March, after having risen to levels that were extremely technically stretched. Despite this pause, our valuation index highlights that bonds are still expensive, and we expect that yields will move higher over the cyclical investment horizon if employment growth in Q3/Q4 implies a faster return to maximum employment than currently projected by the Fed. We expect the rise to be more modest than our valuation index would imply, but we would still recommend a short duration stance within a fixed-income portfolio. The extreme rise in some commodity prices over the past several months is beginning to ease. Lumber prices have fallen close to 50% from their recent high, whereas industrial metals and agricultural prices are down roughly 5% and 17%, respectively. We had previously argued that a breather in commodity prices was likely at some point over the coming several months, and we would expect further declines as supply chains normalize, labor supply recovers, and Chinese demand for metals slows. US and global LEIs remain in a solid uptrend, and global manufacturing PMIs are strong. Our global LEI diffusion index has declined significantly, but this likely reflects the outsized impact of a few emerging market countries (whose vaccination progress is still lagging). Strong leading and coincident indicators underscore that the global demand for goods is robust, and that output is below pre-pandemic levels in most economies because of very weak services spending. The latter will recover significantly later this year, as social distancing and other pandemic control measures disappear. EQUITIES: Chart III-1US Equity Indicators
US Equity Indicators
US Equity Indicators
Chart III-2Willingness To Pay For Risk
Willingness To Pay For Risk
Willingness To Pay For Risk
Chart III-3US Equity Sentiment Indicators
US Equity Sentiment Indicators
US Equity Sentiment Indicators
Chart III-4US Stock Market Breadth
US Stock Market Breadth
US Stock Market Breadth
Chart III-5US Stock Market Valuation
US Stock Market Valuation
US Stock Market Valuation
Chart III-6US Earnings
US Earnings
US Earnings
Chart III-7Global Stock Market And Earnings: Relative Performance
Global Stock Market And Earnings: Relative Performance
Global Stock Market And Earnings: Relative Performance
Chart III-8Global Stock Market And Earnings: Relative Performance
Global Stock Market And Earnings: Relative Performance
Global Stock Market And Earnings: Relative Performance
FIXED INCOME: Chart III-9US Treasurys And Valuations
US Treasurys And Valuations
US Treasurys And Valuations
Chart III-10Yield Curve Slopes
Yield Curve Slopes
Yield Curve Slopes
Chart III-11Selected US Bond Yields
Selected US Bond Yields
Selected US Bond Yields
Chart III-1210-Year Treasury Yield Components
10-Year Treasury Yield Components
10-Year Treasury Yield Components
Chart III-13US Corporate Bonds And Health Monitor
US Corporate Bonds And Health Monitor
US Corporate Bonds And Health Monitor
Chart III-14Global Bonds: Developed Markets
Global Bonds: Developed Markets
Global Bonds: Developed Markets
Chart III-15Global Bonds: Emerging Markets
Global Bonds: Emerging Markets
Global Bonds: Emerging Markets
CURRENCIES: Chart III-16US Dollar And PPP
US Dollar And PPP
US Dollar And PPP
Chart III-17US Dollar And Indicator
US Dollar And Indicator
US Dollar And Indicator
Chart III-18US Dollar Fundamentals
US Dollar Fundamentals
US Dollar Fundamentals
Chart III-19Japanese Yen Technicals
Japanese Yen Technicals
Japanese Yen Technicals
Chart III-20Euro Technicals
Euro Technicals
Euro Technicals
Chart III-21Euro/Yen Technicals
Euro/Yen Technicals
Euro/Yen Technicals
Chart III-22Euro/Pound Technicals
Euro/Pound Technicals
Euro/Pound Technicals
COMMODITIES: Chart III-23Broad Commodity Indicators
Broad Commodity Indicators
Broad Commodity Indicators
Chart III-24Commodity Prices
Commodity Prices
Commodity Prices
Chart III-25Commodity Prices
Commodity Prices
Commodity Prices
Chart III-26Commodity Sentiment
Commodity Sentiment
Commodity Sentiment
Chart III-27Speculative Positioning
Speculative Positioning
Speculative Positioning
ECONOMY: Chart III-28US And Global Macro Backdrop
US And Global Macro Backdrop
US And Global Macro Backdrop
Chart III-29US Macro Snapshot
US Macro Snapshot
US Macro Snapshot
Chart III-30US Growth Outlook
US Growth Outlook
US Growth Outlook
Chart III-31US Cyclical Spending
US Cyclical Spending
US Cyclical Spending
Chart III-32US Labor Market
US Labor Market
US Labor Market
Chart III-33US Consumption
US Consumption
US Consumption
Chart III-34US Housing
US Housing
US Housing
Chart III-35US Debt And Deleveraging
US Debt And Deleveraging
US Debt And Deleveraging
Chart III-36US Financial Conditions
US Financial Conditions
US Financial Conditions
Chart III-37Global Economic Snapshot: Europe
Global Economic Snapshot: Europe
Global Economic Snapshot: Europe
Chart III-38Global Economic Snapshot: China
Global Economic Snapshot: China
Global Economic Snapshot: China
Jonathan LaBerge, CFA Vice President The Bank Credit Analyst Footnotes 1 Please see The Bank Credit Analyst "June 2021," dated May 27, 2021, available at bca.bcaresearch.com 2 Please see US Bond Strategy/Global Fixed Income Strategy Special Report "A Central Bank Timeline For The Next Two Years," dated June 1, 2021, available at usbs.bcaresearch.com 3 Please see The Bank Credit Analyst Special Report "R-star, And The Structural Risk To Stocks," dated March 31, 2021, available at bca.bcaresearch.com 4 Please see US Equity Strategy "Rotate Into Growth Stocks, Be Granular In The Selection Of Cyclicals," dated June 14, 2021, available at uses.bcaresearch.com 5 For a discussion of the differences in value and growth benchmarks, please see Global Asset Allocation Special Report “Value? Growth? It Really Depends!” dated September 19, 2019, available at gaa.bcaresearch.com 6 Please see The Bank Credit Analyst "June 2021," dated May 27, 2021, available at bca.bcaresearch.com 7 Readers should note that the desired share of paid work from home days post-COVID among employees is shown to be lower in Table II-1 than what is implied by Chart II-1 on a weighted-average basis. This is due to the fact that Table II-1 excludes responses from the May 2020 survey wave, because the authors did not ask about employer intensions during that wave. This underscores that the average desired number of paid days working from home declined somewhat over time, and thus argues for the value shown in Table II-1 as the best estimate for employee preferences. 8 Roger K. Lewis, “Following pandemic, converting office buildings into housing may become new ‘normal,’ Washington Post, April 3, 2021. 9 Please see US Equity Strategy "Rotate Into Growth Stocks, Be Granular In The Selection Of Cyclicals," dated June 14, 2021, available at uses.bcaresearch.com
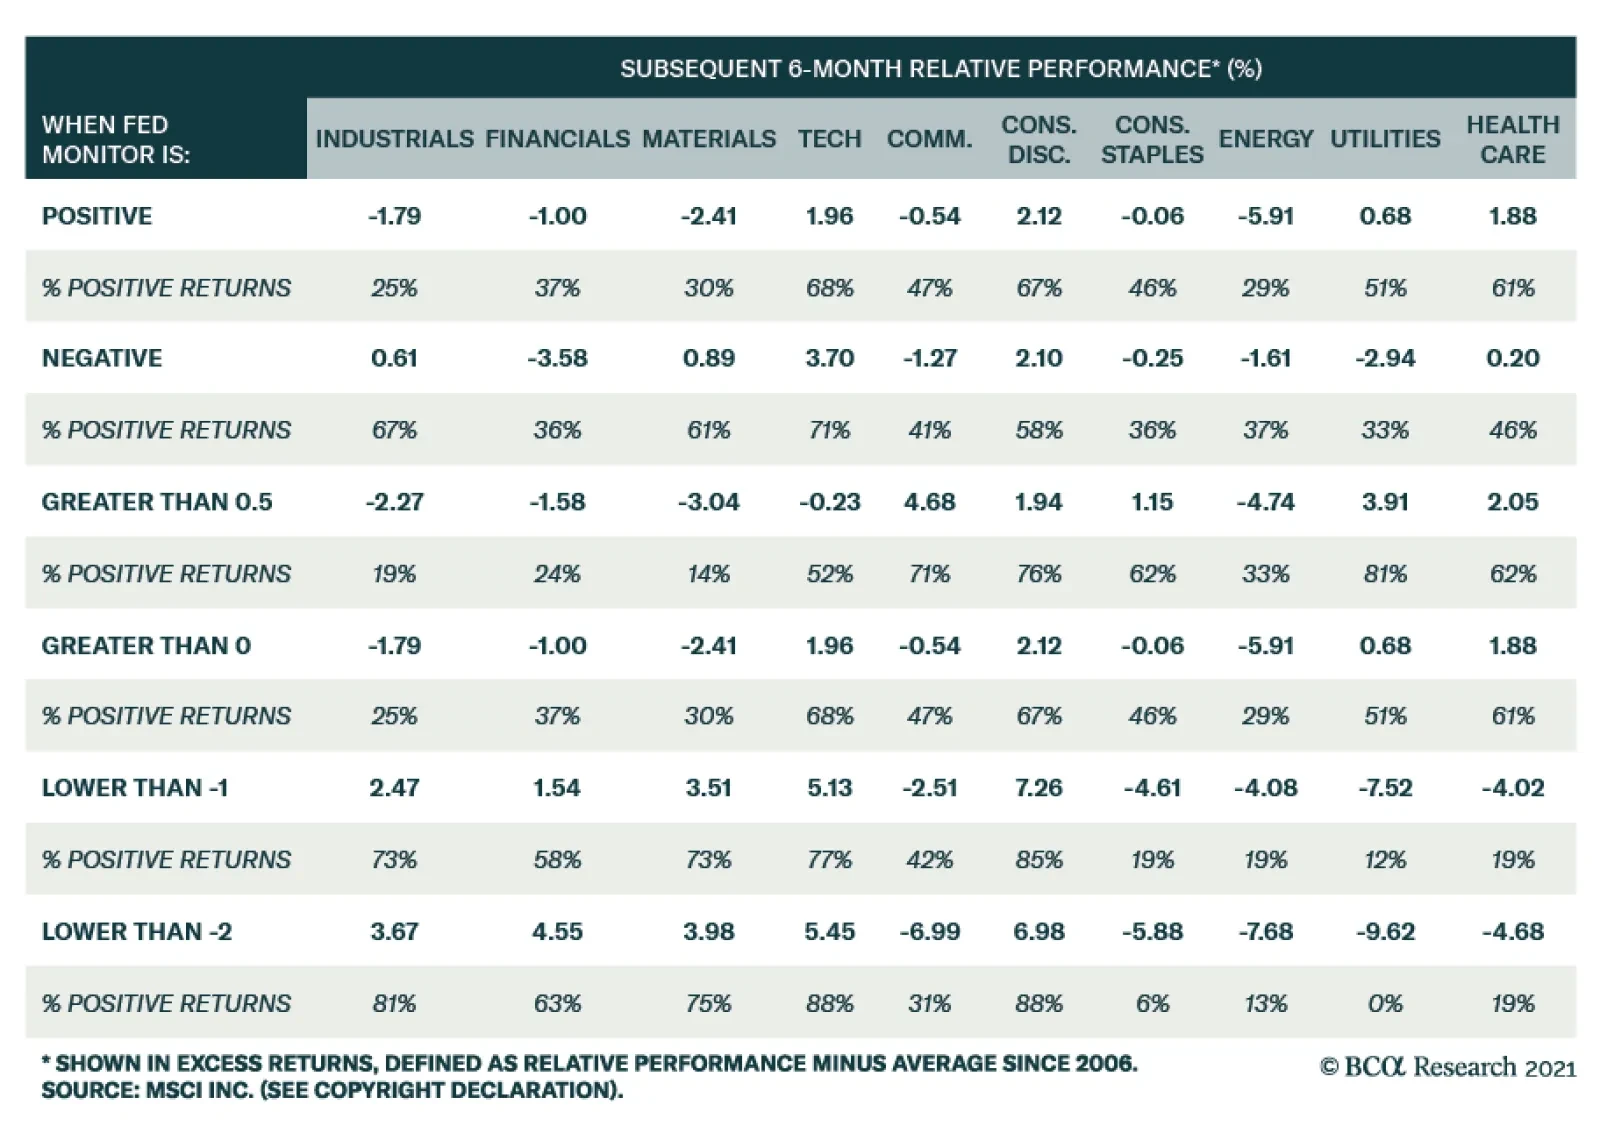
Last week our Global Fixed Income strategists published an update of their BCA Central Bank Monitor Chartbook. The monitors for all major central banks are surging, indicating that policymakers face a need to tighten policy amid strong economic growth,…