Equities

Highlights The Indian rupee is about 7% cheaper than its fair value versus the US dollar. Expanding capital expenditures will boost India’s productivity and raise returns on capital. That will attract higher capital inflows, propelling the rupee. India also has a better inflation outlook compared to the US because of the government’s prudent fiscal policy and muted wage pressures. Foreign bond investors should stay overweight India in an EM local currency bond portfolio. Equity investors should upgrade India from neutral to overweight in view of receding pandemic-related disruptions. Feature The outlook for the Indian rupee over the medium term (six months to three years) is positive. In this report we will identify the two primary drivers of the rupee/US dollar exchange rate over this time horizon. The first is the relative purchasing power in the two economies. The second is return on capital; more specifically, relative return on capital in the two countries. Both indicate that the rupee will likely benefit from a tailwind over the next few years. The robust currency outlook also supports our bullish view on Indian local currency bonds versus their EM peers and US Treasuries. In this report, we will explain how this context, and the Indian market’s own idiosyncrasies, warrants favoring Indian bonds in a global fixed-income portfolio. Finally, we are upgrading Indian stocks back to overweight in an EM equity portfolio. Relative Purchasing Power Chart 1The Indian Rupee Is Below Its Fair Value
The Rupee Has A Tailwind, And Bonds Offer Good Value
The Rupee Has A Tailwind, And Bonds Offer Good Value
The concept of “purchasing power parity (PPP)” theorizes that the currency of an economy with higher inflation will adjust lower (i.e., depreciate) relative to the currency of an economy that has lower inflation. The upshot is that the relative inflation dynamics of the two countries could provide insight into their exchange rate outlook. The top panel of Chart 1 shows that the rupee is currently cheap when measured against what would be its “fair value”. The latter has been derived from a regression analysis between the manufacturers’ relative producer prices of the two countries and the exchange rate. Notably, a deviation from the fair value has also been a good predictor of where the nominal exchange rate will head in the years to come. Whenever the rupee appeared cheap relative to its fair value, it tended to appreciate over the next few years. The opposite has also been true. The current deviation from the fair value implies that the rupee could appreciate by 7% in the coming years (Chart 1, bottom panel). A deeper look into the inflation dynamics reveals that almost all significant directional moves in the rupee-dollar exchange rate over the past 25 years can be explained by movements in the relative inflation differential between the two economies. The rupee typically depreciates versus the dollar when Indian inflation is rising relative to that of the US; and appreciates when the relative inflation is falling. The only times they briefly diverged were during or in the immediate aftermath of a crisis, such as the global financial crisis or the COVID-19 pandemic. However, they were quick to return to their long-term correlations. Relative Inflation Outlook Going forward, the relative inflation outlook favors the rupee. This is because the fiscal and monetary policies in India will likely be tighter in India than in the US for the foreseeable future. Incidentally, India’s core inflation has fallen significantly relative to that of the US in the past decade (Chart 2). India’s inflation is driven mainly by two factors. The first is food prices; more specifically, the “minimum support price” that the Indian government pays to the farmers to procure food grains. Since the government is by far the single largest purchaser, the price it pays usually sets the floor in the market. The ebbs and flows of this procurement price have had a telling impact on the country’s inflation over the past few decades (Chart 3, top panel). Chart 2India's Inflation Has Fallen Significantly In The Past Decade
The Rupee Has A Tailwind, And Bonds Offer Good Value
The Rupee Has A Tailwind, And Bonds Offer Good Value
Chart 3Notwithstanding The Temporary Pandemic-Era Surge In Fiscal Spending …
The Rupee Has A Tailwind, And Bonds Offer Good Value
The Rupee Has A Tailwind, And Bonds Offer Good Value
In recent years, however, the authorities have been careful and did not hike the procurement prices over much. That has helped to keep headline CPI in check. Further, the government legislated new farm laws last year, which will usher in private capital in the agriculture sector. This will help improve farm productivity and keep food prices under control1 in the future. Chart 4...Fiscal Policy Has Been Very Prudent Since The GFC
The Rupee Has A Tailwind, And Bonds Offer Good Value
The Rupee Has A Tailwind, And Bonds Offer Good Value
The other driver of Indian inflation is fiscal expenditure. The rise and fall in government spending leads core inflation by about a year (Chart 3, bottom panel). Notably, even though fiscal spending has swelled over the past year to provide relief to a pandemic-stricken economy, this one-off surge is offset by collapse in output and demand. Besides, the odds are high that the government will revert to a tighter stance as soon as the pandemic is brought under control. Indeed, such a fiscal splurge represents a departure rather than a fixture in India’s fiscal policy. Ever since the global financial crisis, successive Indian governments adopted a rather prudent fiscal stance. Chart 4 shows that fiscal spending steadily declined from 17% of GDP in 2009 to 12% by 2019. The conservative stance was implemented by both the previous UPA government and the current NDA government which came to power in 2014. Such a stance not only helped to substantially reduce the country’s fiscal and primary deficits but was also instrumental to the steady decline in inflationary pressures. The wage pressures in the economy are also rather muted. In rural areas, both farm and non-farm wages have been growing at a slow pace and have often remained below consumer inflation for the past six years (Chart 5, top panel). A similar picture is seen in the central banks’ (RBI) industrial outlook surveys. The assessment for salary and remuneration shows a subdued outlook; in fact, the indicator is below zero (Chart 5, bottom panel). This implies that wage pressures in the industrial sector have also been very low since 2017. Going forward, as tens of millions of young people continue to join the work force every year, the broader picture is unlikely to change. Overall, subdued wage pressures will also keep a tab on general inflation in the economy. Relative Return On Capital The other important driver of the rupee versus the dollar over the medium term is the direction of Indian companies’ return on capital relative to those of the US. When the return on capital rises, especially relative to that of the US, foreign capital flows into India in search of higher profits. Those capital inflows help boost the rupee. Chart 6 shows that over the past 25 years the rupee strengthened versus the dollar during those periods when return on assets of Indian non-financial corporates rose. The rupee depreciated when this ratio dropped. Chart 5Inflation Outlook Remains Sanguine As Wage Pressures Are Muted
The Rupee Has A Tailwind, And Bonds Offer Good Value
The Rupee Has A Tailwind, And Bonds Offer Good Value
Chart 6Rupee Strengthens When Relative Return On Capital In India Rises...
The Rupee Has A Tailwind, And Bonds Offer Good Value
The Rupee Has A Tailwind, And Bonds Offer Good Value
The same holds true when Indian firms’ return on assets are compared relative to those of the US. All major moves in rupee strength and weakness largely coincided with the relative rise and fall in return on assets (Chart 6, bottom panel). Chart 7...As Foreign Capital Inflows Into India Boosts The Rupee
The Rupee Has A Tailwind, And Bonds Offer Good Value
The Rupee Has A Tailwind, And Bonds Offer Good Value
Thus, relative profitability clearly has a major influence on the exchange rate. And as alluded to earlier, the link is via capital inflows. The ebbs and flows of capital into India have a very explicit impact on the rupee (Chart 7). Going forward, a pertinent question is in which way will India’s return on capital be headed. Our bias is that, beyond the pandemic-related disruptions, it is heading higher over the medium term. We have the following observations: A sustainable rise in return on capital is highly contingent on productivity gains. And the latter depends on capital investment in new plants, machinery, technology, as well as on infrastructure. Thus, a meaningful and sustained rise in capital expenditures could be a harbinger of higher returns in the future. Firms, on their part, would engage in new capital expenditures once they are sanguine of future demand as well as profits. Notably, both gross and net profits of India’s non-financial sector have rebounded rather strongly. Capital expenditure has recovered in tandem (Chart 8). The latter indicates that companies do not consider profit recovery a fluke and are confident demand will remain upbeat. Corroborating the above, imports of capital goods have skyrocketed. This is also a precursor to higher capex down the road (Chart 9). Chart 8Rebounding Profits Have Encouraged Firms To Resume Capex...
The Rupee Has A Tailwind, And Bonds Offer Good Value
The Rupee Has A Tailwind, And Bonds Offer Good Value
Chart 9...As Evidenced In Accelerating Capital Goods Imports
The Rupee Has A Tailwind, And Bonds Offer Good Value
The Rupee Has A Tailwind, And Bonds Offer Good Value
Chart 10Capital Goods Imports Have Been Rising For The Past Several Years
The Rupee Has A Tailwind, And Bonds Offer Good Value
The Rupee Has A Tailwind, And Bonds Offer Good Value
Markedly, India’s import profile has been encouraging in recent years. The share of capital goods in total imports and non-oil imports have been rising (Chart 10). This indicates that firms have not been averse to capital expenditure. This also shows that unlike in some other EM countries, imported consumer goods did not overwhelm India’s capital goods imports. The last time India saw a surge in capital goods imports was in the 2000s, a period when the country’s capex and profits also surged. That period coincided with a multi-year bull run in the rupee and stocks. The early 2010s, on the other hand, saw a deceleration in capex and capital goods imports – and was followed by a period of sub-par return on capital. Now, the tides are turning again. Finally, the quality of capital inflows has also improved over the past decade. India has been receiving ever higher amounts of FDI compared to portfolio inflows (Chart 11). The former is a much more efficient form of capital and are also more likely to boost capital expenditures enhancing productivity in the economy. Incidentally, India’s real gross fixed capital formation has hovered between 30% and 35% of GDP since 2008 – easily the highest rate globally, save China (Chart 12). Hence, if a new capex cycle ensues, which seems likely, it will happen over and above the base built over the past decades. That should help drive labor productivity and profits up by a notch. Chart 11...Along With Steady Growth In FDI
The Rupee Has A Tailwind, And Bonds Offer Good Value
The Rupee Has A Tailwind, And Bonds Offer Good Value
Chart 12A New Capex Cycle On Top Of The Previous Base Will Boost Productivity
The Rupee Has A Tailwind, And Bonds Offer Good Value
The Rupee Has A Tailwind, And Bonds Offer Good Value
All in all, odds are that Indian productivity will improve going forward, which in turn will boost firms’ profitability metrics. That should help propel the rupee. Bond Bullish The combination of a stable currency, prudent fiscal policy, and a benign inflation outlook make Indian bonds highly desirable to foreign investors. Notably, thanks to some systemic factors, Indian bonds are not as sensitive to bouts of fiscal profligacy and/or inflation in India: Over the past 20 years or so, ten-year bond yields hovered in a rather narrow band of 6%- 9%. A crucial reason for that stability is very limited foreign holdings: only about 2% of Indian government bonds are held by foreign investors. This has reduced yield volatility substantially. In many EM countries, where foreign holdings are much higher, a negative growth shock usually leads to both rising bond yields and a depreciating currency – which perpetuate each other – as foreign investors head for the exit. In the case of India, a negative shock is tempered by falling bond yields, as domestic investors switch from riskier assets to government bonds. Not only are the foreign holdings in India too small to push up yields but the falling yields also encourage them to stay invested. That explains why bond yields in India fell during each of the crises: in 2008-09, 2014-15 and more recently in 2020. A second reason is the existence of captive domestic bond investors: commercial banks. As per the Reserve Bank of India mandate, all banks in India are obligated to hold a certain percentage (currently 18%) of their total deposits in government securities (called Statutory Liquidity Ratio, or SLR). These mandatory holdings have also helped reduce yield volatility. The impact of the above factors can often be seen at play. For one, a surge in India’s fiscal expenditure does not necessarily cause a spike in bond yields. This is because, devoid of any fear of dumping by foreign bond holders, India can and does ramp up government spending when growth is very weak. Those are the times when domestic investors shed riskier assets and move to the safety of government bonds. Hence, we see accelerating fiscal spending coinciding with low and falling bond yields, unlike in many other EM countries (Chart 13, top panel). For a similar reason, a surge in India’s fiscal deficit does not necessarily cause a spike in bond yields either. If anything, widening budget deficits usually coincide with falling bond yields; and shrinking deficits with rising bond yields (Chart 13, bottom panel). The explanation for this apparent anomaly is as follows: periods of stronger growth bring in more fiscal revenues and thus reduce the deficit. But strong growth and rising inflationary pressures also lead to higher interest rate expectations reflected in higher bond yields. The opposite happens when growth slows. Even though fiscal deficit goes up as revenues drop, decelerating inflationary pressures pave the way for lower bond yields. A pertinent question here is, given the idiosyncrasies of Indian bond markets, what then drives Indian bond yields? The simple answer is the business cycle. This is why rising bond yields coincide with stronger bank credit growth and falling yields with weaker credit growth (Chart 14). Chart 13A Surge In Fiscal Spending Or Deficits Doesn't Mean A Spike In Bond Yields
The Rupee Has A Tailwind, And Bonds Offer Good Value
The Rupee Has A Tailwind, And Bonds Offer Good Value
Chart 14The Business Cycle Is The Ultimate Driver Of Indian Bond Yields
The Rupee Has A Tailwind, And Bonds Offer Good Value
The Rupee Has A Tailwind, And Bonds Offer Good Value
What is also notable is that the impact of any spike in consumer and/or producer price inflation on bond yields is not very pronounced (Chart 14, bottom panel). A crucial reason for that is again the SLR. Because of it, regardless of commercial banks’ own inflation expectations, they cannot dump government bonds. That puts a cap on bond yields even when inflation is rising. Besides, a rise in inflation usually coincides with accelerating bank credit and bank deposits. The latter causes higher demand for government bonds from banks (to maintain SLR). That in turn helps keep the bond yield lower than it otherwise would be. Chart 15The Spike In Public Debt Is Temporary, And Bond Investors Are Not Worried
The Rupee Has A Tailwind, And Bonds Offer Good Value
The Rupee Has A Tailwind, And Bonds Offer Good Value
Bottom Line: The absence of foreign investors, the presence of large captive domestic investors and a long-held orthodox fiscal stance have turned the Indian bond market into a different ball game than many other EM local currency bond markets. One takeaway from this idiosyncrasy is that the current steep, but temporary, fiscal deficit should not be a matter of concern for bond investors. For a similar reason, the recent rise in the public debt-to-GDP ratio should have little impact on bond yields (Chart 15). Finally, a moderate rise in inflation is also unlikely to cause Indian bond yields to soar. Investment Conclusions The medium-term outlook for the Indian rupee is positive. It is also quite competitive, especially when compared to the currencies of India’s major competitors vying for multinationals to establish their manufacturing capacity (Chart 16). This means the rupee has some room for nominal appreciation without hurting its competitiveness. Chart 16The Indian Rupee is Quite Competitive
The Rupee Has A Tailwind, And Bonds Offer Good Value
The Rupee Has A Tailwind, And Bonds Offer Good Value
This emphasizes our view that investors should continue to overweight India in an EM fixed-income portfolio. While strong growth and higher US bond yields can drive up Indian government bond yields, the former will also push up the rupee – as detailed in a previous section. The currency returns will offset any possible capital loss owing to rising yields, while a positive carry will boost total returns. Notably, because of the latter, a similar rise in yields (say, 100 basis points) in India and US bonds will have a much less negative impact on total return terms for Indian bonds than in the case of US Treasurys. The long end of the Indian yield curve offers value: the 10-year bond yield is 200 basis points above the policy rate. The spread of India’s 5-year bond over that of the US is an impressive 550 basis points (Chart 17, top panel). Given the sanguine rupee outlook, odds are that Indian government bonds will continue to outpace US treasuries in total return terms – even when Indian growth accelerates and inflation rises modestly (Chart 18). Chart 17Indian Bonds Offer Value Relative To US And EM Counterparts
The Rupee Has A Tailwind, And Bonds Offer Good Value
The Rupee Has A Tailwind, And Bonds Offer Good Value
Chart 18Higher Carry And A Stronger Currency Will Lead To Total Return Outperformance
The Rupee Has A Tailwind, And Bonds Offer Good Value
The Rupee Has A Tailwind, And Bonds Offer Good Value
When compared to the same-duration JP Morgan GBI-EM bond index, India offers a spread of 100 basis points. India has steadily outperformed that index in US dollar total return terms over the past several years (Chart 17, bottom panel). That is unlikely to change in future, thanks to the high carry and a relatively more stable currency. As such, investors should stay on with our recommendation of overweighting India in an EM local currency bond portfolio (Chart 18). Chart 19Go Overweight Indian Stocks In An EM Equity Portfolio
The Rupee Has A Tailwind, And Bonds Offer Good Value
The Rupee Has A Tailwind, And Bonds Offer Good Value
Several factors that make the outlook for the rupee positive also argue for a positive outlook for Indian stocks. Like most other EM currencies, the rupee is pro-cyclical, and it tends to move with Indian share prices. Notably, Indian stocks have broken out of their previous highs (Chart 19). On a separate note, as the number of daily COVID-19 cases in the country have subsided, so have the chances of debilitating lockdowns. As such, economic activity is slated to gather steam. We had tactically downgraded India from overweight to neutral in an EM equity portfolio on April 22 in view of skyrocketing COVID-19 cases and deaths back then. Even though the pandemic situation had deteriorated considerably after our downgrade, share prices have staged a nice rebound to our surprise. It’s time to upgrade this bourse back to overweight (Chart 19, bottom panel). Investors should also stick with our sectoral recommendation of long Indian Banks and short EM banks. As we elaborated in our report on Indian banks, a recovery in the business and capex cycles would be very positive for Indian private sector banks (that make up 90% of the MSCI India Banks index) – given that they have aggressively cleansed their balance sheets of NPLs and have thereby already taken the hit in their earnings. Fixed-income investors should close the trade of receiving 10-year swap rates in India. We had recommended it along with other EM local rates back in April 2020 as a play on lower interest rates in EM. India’s 10-year swap rates have risen by 166 basis points since then. Rajeeb Pramanik Senior EM Strategist rajeeb.pramanik@bcaresearch.com Footnotes 1 For more details see our report India’s Reform Drive: How Momentous (Part 1) dated 19 November 2020.
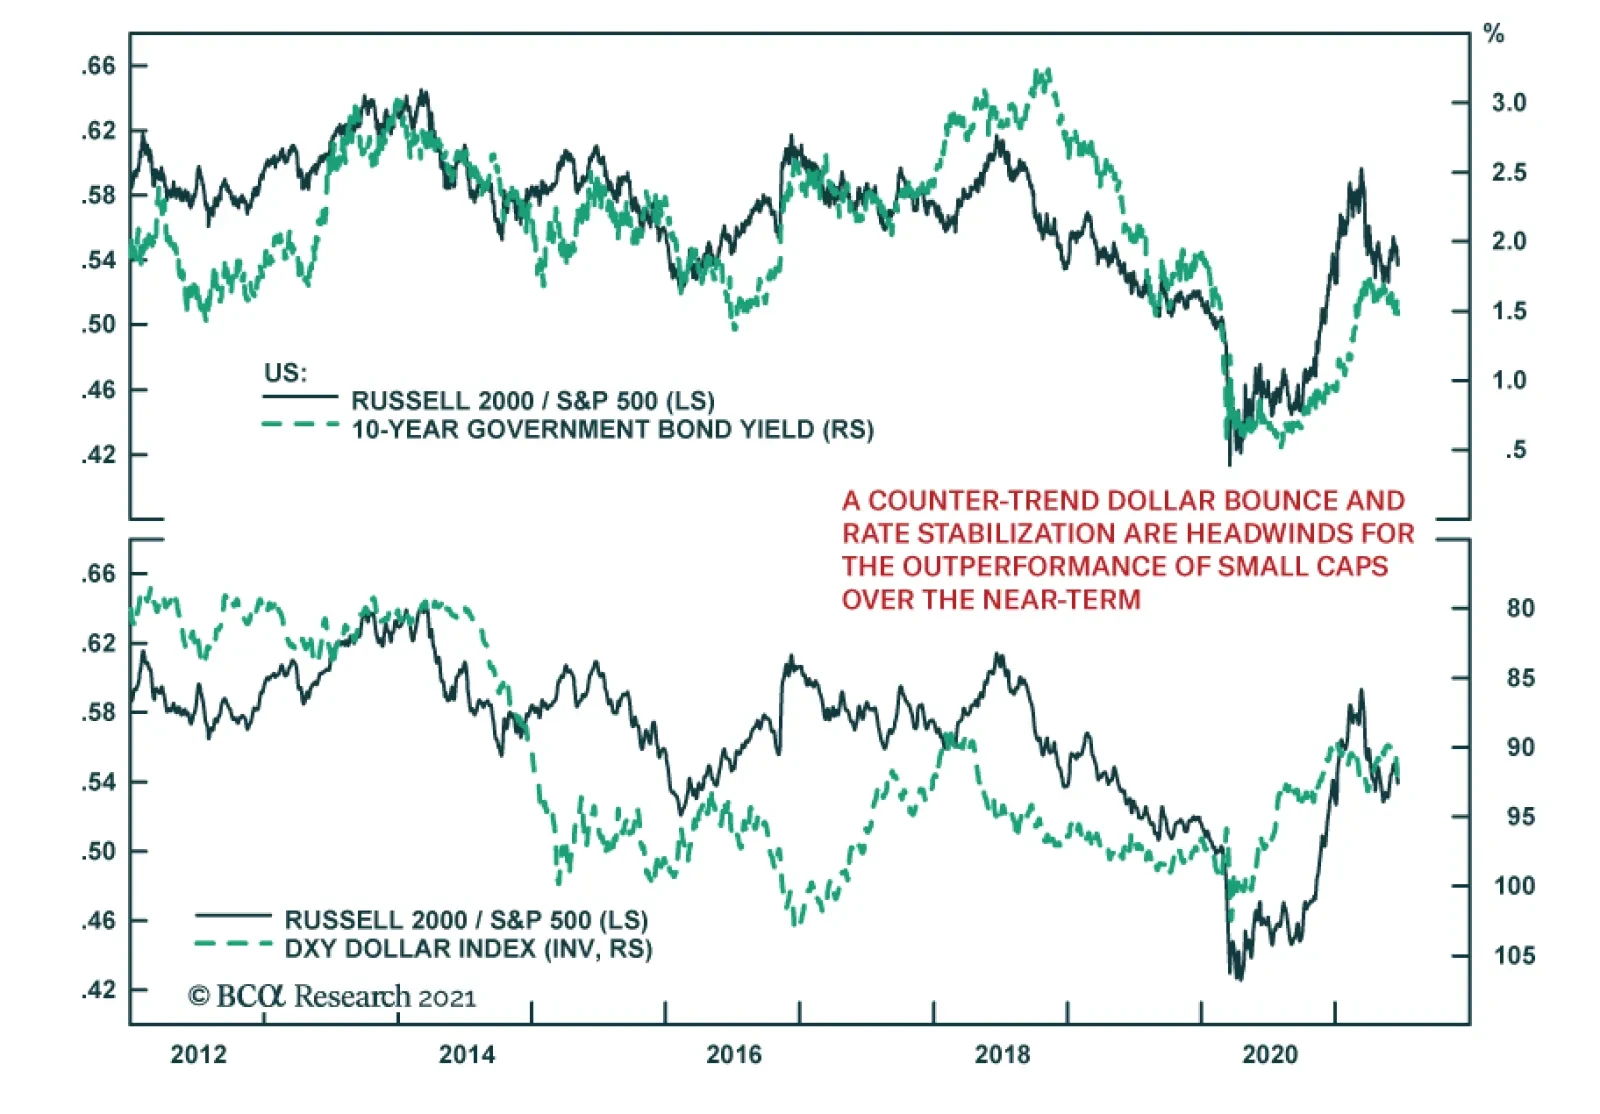
US small cap equities outperformed their large cap peers between early October 2020 and mid-March 2021 – during which US 10-year Treasury yields climbed 106 bps. However, since the beginning of Q2, small cap stocks have once again mostly underperformed…
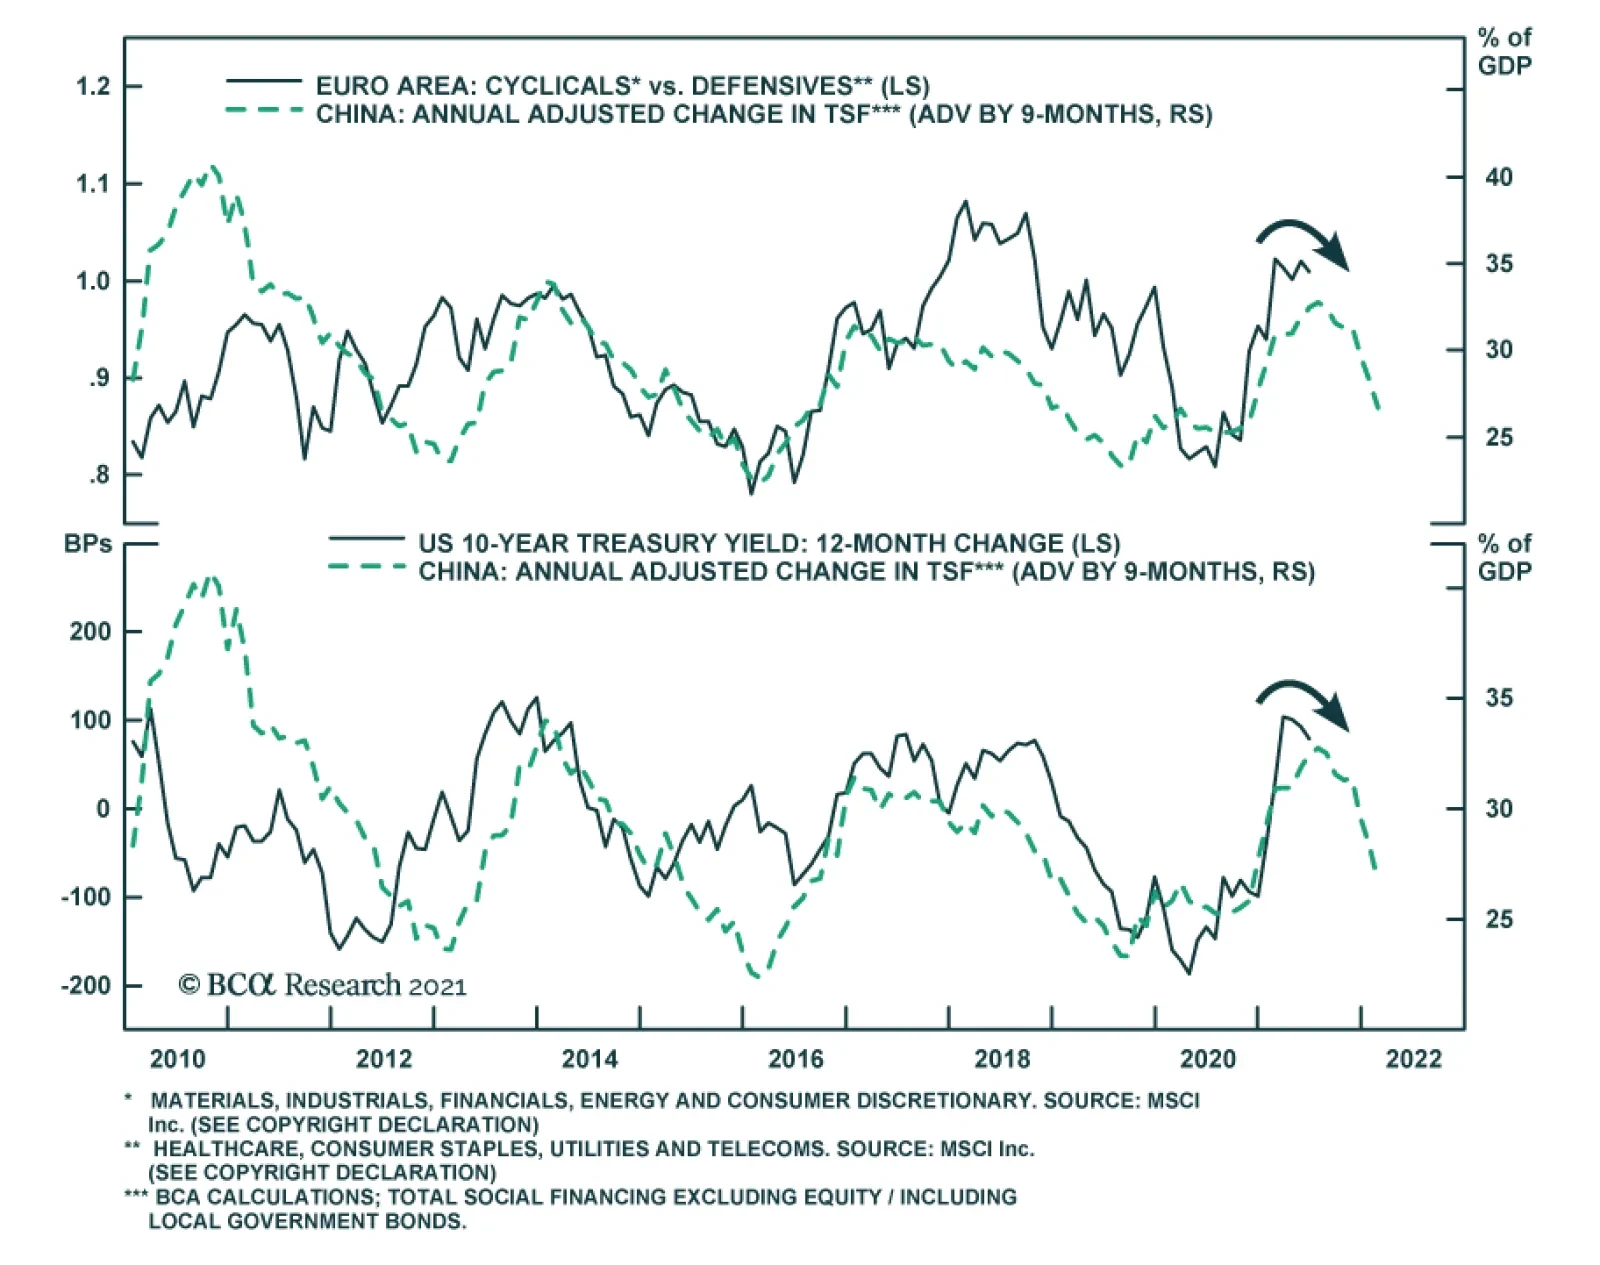
BCA Research’s European Investment Strategy service recommends that investors tactically downgrade cyclical equities from overweight in Europe. This summer, three forces will feed some downside risk in the market and, more specifically, an underperformance…
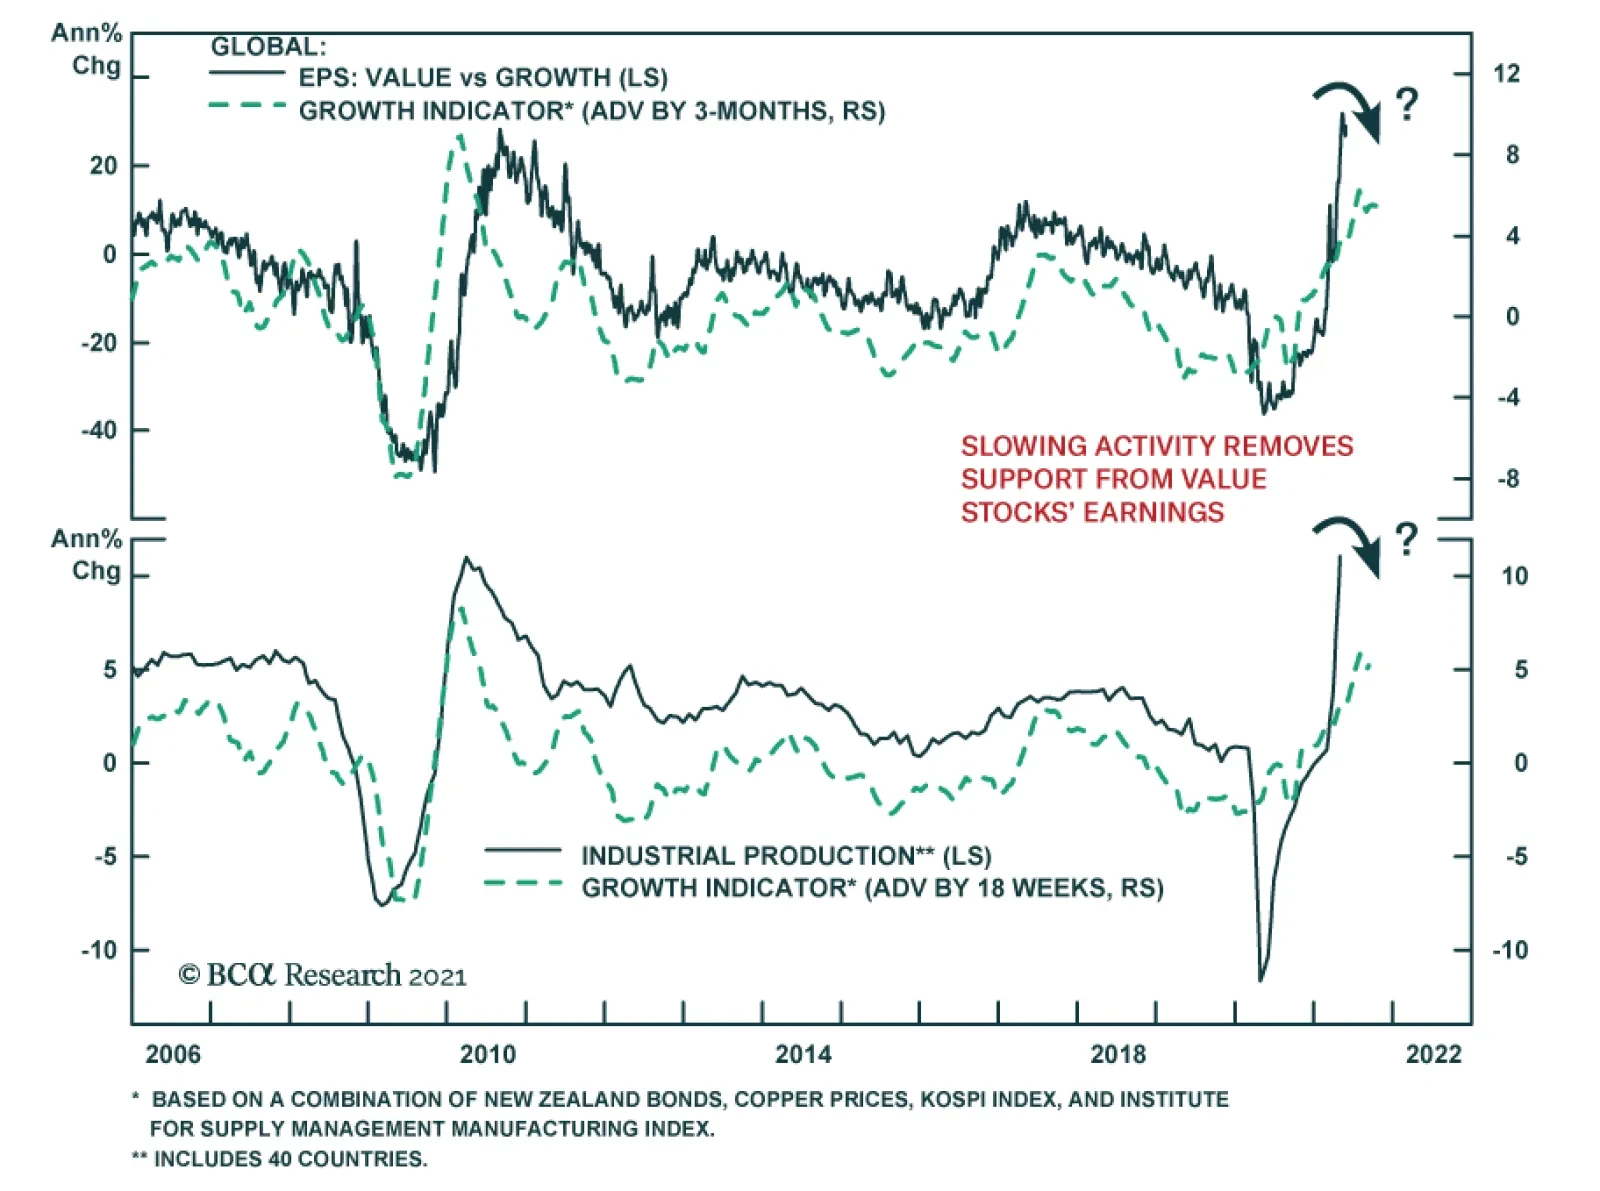
BCA Research’s Global Growth Indicator, which is based on the price of copper, Korean equities, Kiwi bonds and the US ISM manufacturing index, is sending a warning to value stocks. Its latest readings have ticked down from the late-March peak, suggesting that…
Highlights Tactically downgrade cyclical equities from overweight in Europe. The shift in global growth drivers, the beginning of the global liquidity withdrawal, and lingering COVID worries create headwinds for the cyclicals-to-defensives ratio this summer. Weaker global inflation expectations, commodity prices, and a dollar rebound will accompany this period of turbulence. The relative technical and valuation backdrop will also contribute to this period. Short consumer discretionary / long telecommunication is a high-octane version of the trade. Short technology / long healthcare is its lower-risk / lower-reward cousin. This temporary portfolio shift is a risk management move to capitalize on our positive 18- to 24- month view on cyclicals. Feature Last week, we recommended investors adopt a more defensive tactical posture. They should raise cash and shift into defensive quality names in order to weather a summer replete with potential downside risk. This will place investors in a good position to shift back into a more aggressive stance this fall, when cyclical sectors should resume their outperformance. This week, we explore this idea in more detail. The combination of a Chinese credit slowdown, a potential transition in the driver of growth away from goods into services, and a shift in tone from global central banks will feed the expected market volatility this summer. European defensive stocks are set to outperform during this period. Buying telecommunication equities / selling consumer discretionary stocks is a high octane bet on this trend, while going long healthcare / short technology shares is its low-risk incarnation. Summer Storms This summer, three forces will feed some downside risk in the market and, more specifically, an underperformance of cyclical sectors relative to defensive ones: a transition in global growth, preliminary signs that global central banks will begin to take away the punch bowl, and disappointments caused by COVID variants. Growth Transition The global economy is set to cool down as we transition away from the first stage of the post-pandemic recovery. As we showed last week, China’s deteriorating credit impulse is consistent with global industrial activity receding from its extremely robust pace of expansion (Chart 1). The continued decline in China’s banking system excess reserve ratio suggests that total social financing flows will slow further. Consequently, China’s intake of raw materials and industrial goods will decelerate, which will impact global industrial activity negatively. Already, the New Orders component of China’s Manufacturing PMI has rolled over. The disappointment of Chinese retail sales last week further indicates that China will act as a drag on global growth in the coming quarters. We have also highlighted that the combined effect of higher yields and oil prices has become strong enough to alter negatively the path of global industrial activity going forward. Our Global Growth Tax indicator, which includes both variables, shows that the US ISM Manufacturing survey and the global manufacturing PMI have reached their apex and will moderate this summer (Chart 2). Chart 1The China Drag
The China Drag
The China Drag
Chart 2Rising Costs Bite
Rising Costs Bite
Rising Costs Bite
The problem for global growth is one of changing leadership. Global economic activity is not about to collapse, but the extraordinary surge in goods consumption that started in 2020 will make room for a catch-up in the service sector. As an example, US retail sales stand 15% above their pre-pandemic trends; however, services spending still lies 7% below its pre-pandemic tendency (Chart 3). Thus, as summer progresses, the recent deceleration in consumer spending on goods will continue and services will progressively pick up the slack. The change in growth leadership will cause some temporary trepidation in global economic activity, because it is happening when the effect of both the Chinese credit slowdown and the previous increase in yields and oil will be most potent. As a result, we expect the G-10 Economic Surprises Index to follow that of China and experience an air pocket this summer (Chart 4). Chart 3From Goods To Services
From Goods To Services
From Goods To Services
Chart 4Where China Goes, So Will The G-10
Where China Goes, So Will The G-10
Where China Goes, So Will The G-10
The Chaperone Is On The Way More than 65 years ago, former Fed Chair William McChesney Martin noted that the job of central bankers was to be “the chaperone who has ordered the punch bowl removed just as the party was really warming up.” Chart 5The Chaperone Is Waking Up
The Chaperone Is Waking Up
The Chaperone Is Waking Up
Today, the party is a rager, and central bankers are indicating that they will remove the punch bowl soon. Real estate speculation is worrying the Bank of Canada, and its balance sheet has already shrunk by C$99 billion, to C$476 billion. The Norges Bank has indicted that it will lift interest rates twice this year. The Reserve Bank of New Zealand is set to lift the Official Cash Rate soon. The Bank of England has begun to adjust its asset purchases and could begin a full-fledge tapering this year. The 800-pound gorilla is the Fed, which telegraphed more clearly last week its intention to raise rates twice in 2023, and therefore moved closer to the pricing of the OIS curve (Chart 5). Implied in this forecast, the Fed will start tapering its asset purchase in early 2022 at the latest. This change in tone by global central banks is not a major problem for the business cycle – global rates are still far below any reasonable estimates of the neutral rate of interest, but periods of transition in monetary policy are often associated with transitory market turbulences. This time will not be an exception, especially because it is happening when global growth is downshifting. Delta, Gamma, Epsilon, etc? Chart 6Depressed Macro Volatility
Depressed Macro Volatility
Depressed Macro Volatility
With the rapid progress of vaccination, the worst of the COVID tragedy is behind us. Nonetheless, the pandemic is not yet fully in the rear-view mirror, not even in the Western nations that lead the global inoculation campaign. SARS-CoV-2 continues to evolve and will therefore produce new variants over time, some of which will be problematic. The UK illustrates this phenomenon. The government has postponed the so-called Freedom Day, when life returns to normal, by five weeks despite the country’s high vaccination rate. The Delta variant is significantly increasing among the unvaccinated and not fully inoculated Britons. Many countries will also face this problem. These delays will be minor and will not threaten national recoveries. However, they will feed market tensions in a context where global macro volatility is low (Chart 6), global growth is already peaking, and monetary accommodation is receding. Global Market Implications… The confluence of the change in global economic growth leadership, the upcoming liquidity removal, and the potential for short-lived delays to the global economic re-opening point toward a decline in global inflation expectations, a rebound in the US dollar, weaker commodity prices, and an underperformance of global cyclical relative to defensive equities. Over the coming months, inflation breakeven rates are likely to soften, while real yields will rise modestly. In May, US inflation breakeven rates peaked near 2.6%, their highest level in ten years. A weaker global growth impulse in combination with a Fed that is more willing to remove some monetary accommodation will cool inflationary fears among investors and cause inflation expectations to decline further. However, the specter of tighter policy will also support TIPS yields. Bond yields are likely to correct somewhat more over the summer. Bond prices have not yet fully purged their oversold conditions (Chart 7); thus, a decrease in inflation expectations will temporarily support Treasury prices, even if real yields do not fall. Recent market action is moving in this direction. Last week, by Thursday evening, 10-year Treasury yields had already lost their 9 bps rise that followed Wednesday’s FOMC meeting. 30-year Treasury yields have plunged to a four-month low. Bund yields are unable to hang on to their gains either. The dollar has more upside this summer. Higher real US yields offer a potent backing for a DXY that still refuses to drop below 89. Moreover, the greenback is a highly counter-cyclical currency and is particularly sensitive to the gyrations in the global industrial cycle. Thus, the deceleration in the global manufacturing cycle will create a temporary tailwind for the greenback. Over the past three years, the gap between US TIPS yields and the Chinese Economic Surprise index explained the fluctuation of the DXY; it currently points toward a continued rebound in the USD (Chart 8). Even if this move is ephemeral, it will have implications for investors this summer. Chart 7Technical Backdrop For Bonds
Technical Backdrop For Bonds
Technical Backdrop For Bonds
Chart 8Near-Term Upside For The DXY
Near-Term Upside For The DXY
Near-Term Upside For The DXY
Commodities will also suffer. Natural resource prices have rallied in a parabolic fashion and our Composite Technical Indicator is massively overbought (Chart 9). Meanwhile, Chinese authorities are verbally jawboning industrial metal prices and have begun to release copper, zinc, aluminum, and nickel from their stockpiles. In this context, the Chinese credit slowdown and the imminent removal of monetary accommodation in various corners of the globe will catalyze a correction in commodities, even if a new supercycle has begun. The recent travails of lumber prices, which have collapsed 47% since May 7 (while they still remain in technical bull market!), may constitute a canary in the coalmine for the wider commodity complex. Global cyclical equities have greater downside against their defensive counterparts. US markets are global trendsetters; while the S&P cyclicals have lost some altitude compared to defensives, they have yet to purge their oversold state and remain very expensive (Chart 10). This backdrop makes them vulnerable to slowing Chinese import growth, a stronger dollar, and weaker commodity prices. Chart 9Will The GSCI Follow Lumber?
Will The GSCI Follow Lumber?
Will The GSCI Follow Lumber?
Chart 10Vulnerable Global Cyclicals
Vulnerable Global Cyclicals
Vulnerable Global Cyclicals
… And European Investment Implications Chart 11European Cyclicals Are Also At Risk
European Cyclicals Are Also At Risk
European Cyclicals Are Also At Risk
The European cyclicals-to-defensives ratio is vulnerable, like it is in the US. Hence, a more defensive portfolio bias makes sense for the summer, which should allow investors to regain maximum cyclical exposure later this year. Short consumer discretionary / long telecommunications and short technology / long healthcare are pair trades with particularly attractive risk profiles. The cyclicals-to-defensives ratio is technically unattractive. The relative share prices stand toward the top of their 16-year trading range (Chart 11). Moreover, their 52-week momentum measure is rolling over at a highly elevated level, while the 13-week rate of change is deteriorating. Meanwhile, the Combined Mechanical Valuation Indicator1 (CMVI) of the cyclicals towers far above that of the defensives and is consistent with a corrective episode (Chart 11, bottom panel). The drivers of the performance of Eurozone cyclical relative to defensive sectors confirm that cyclicals could suffer a turbulent summer. For instance: The potential for further declines in global yields does not bode well for the European cyclicals-to-defensives ratio (Chart 12). Weaknesses in market-based inflation expectations would prove particularly threatening (Chart 12, bottom panel). The deceleration in China’s total social financing flows anticipates an underperformance of European cyclicals (Chart 13). As China’s credit decelerates, so will the earnings revisions of cyclical equities. Moreover, a weaker Chinese TSF is consistent with falling Treasury yields. Chart 12Lower Inflation Expectations Equals Underperforming Cyclicals
Lower Inflation Expectations Equals Underperforming Cyclicals
Lower Inflation Expectations Equals Underperforming Cyclicals
Chart 13Cyclicals Listen To China
Cyclicals Listen To China
Cyclicals Listen To China
The potential for weaker commodity prices is another problem for European cyclical equities (Chart 14). Commodities capture the ebb and flow of global growth sentiment, which is also a driver of the earnings revisions of cyclicals relative to defensives. Moreover, commodity prices greatly affect the earnings of cyclical equities. Unsurprisingly, the momentum of the European cyclicals-to-defensives ratio correlates closely with the BCA Commodity Composite Technical Indicator (Chart 14, bottom panel). Cyclicals perform poorly when the dollar appreciates. The Eurozone’s cyclicals-to-defensives ratio moves in lock-step with the euro and high-beta cyclical currencies (Chart 15). These relationships reflect the counter-cyclicality of the dollar, as well as the negative effect on global financial conditions of its rallies, and thus, on the earnings outlook for cyclicals. Chart 14Beware The Impact Of Weaker Commodities
Beware The Impact Of Weaker Commodities
Beware The Impact Of Weaker Commodities
Chart 15A Strong Dollar Hurts European Cyclicals
A Strong Dollar Hurts European Cyclicals
A Strong Dollar Hurts European Cyclicals
Chart 16Short Consumer Discretionary And Long Telecommunication
Short Consumer Discretionary And Long Telecommunication
Short Consumer Discretionary And Long Telecommunication
Based on these observations, we are tactically downgrading cyclicals from our overweight stance for the summer, despite our conviction that cyclicals have upside on an 18- to 24-month basis. We look at this move as risk management. For investors looking to bet on a potential underperformance of cyclical equities in Europe, we recommend two positions: a high-octane pair trade and a lower-risk one. The high-octane version is to sell consumer discretionary stocks and buy telecommunications ones (Chart 16). This pair trade is exposed to lower yields, lower inflation expectations, and the shift in growth drivers from China and goods consumption to services expenditures. Additionally, the relative 52-week momentum measure is overextended, while the 13-week rate of change is already sagging. The CMVI of the consumer discretionary sector is extremely elevated, while that of telecommunication stocks is the most depressed of any Eurozone sector. Consequently, the gap between the two sectors’ CMVI stands at nearly three-sigma, which is concerning because the RoE of consumer discretionary shares lies 7% below that of the telecoms industry (Chart 16, third and fourth panel). Because higher RoEs should justify higher valuations, consumer discretionary and telecommunication stand out as the greatest outliers among European sectors (Chart 17). As an added benefit, this trade enjoys a positive dividend carry of more than 2.5%. Chart 17Spot The Outliers
Summertime Blues
Summertime Blues
Chart 18Short Technology And Long Healthcare
Short Technology And Long Healthcare
Short Technology And Long Healthcare
The low octane pair trade is to sell technology stocks and buy healthcare names instead. This position offers lower expected returns but also a lower risk, because both sectors are growth stocks and they will benefit from falling yields and inflation expectations. However, based on their respective CMVI, tech equities are much more expensive than healthcare ones (Chart 18), while they are also extremely overbought. Thus, healthcare should benefit more from falling yields and inflation expectations than tech. Moreover, technology is a more cyclical sector than healthcare; it will therefore be more sensitive to the evolution of global growth. Bottom Line: We remain positive on the outlook for cyclical equities on an 18- to 24-month horizon, but the changing global growth leadership, the imminent removal of global monetary accommodation, and the demanding valuation and technical backdrop of the European cyclicals-to-defensives ratio suggest that a period of turbulence will materialize this summer. Thus, we are tactically downgrading cyclicals. Investors should consider going long telecommunications / short consumer discretionary as a high-octane tactical bet on this portfolio stance. Buying healthcare / selling technology would constitute a lower risk / lower return play. Mathieu Savary, Chief European Investment Strategist Mathieu@bcaresearch.com Footnotes 1 For a detailed explanation of the Combined Mechanical Valuation Indicator, see Special Report, “Valuation – A Mechanical Approach,” dated May 31, 2021. Currency Performance
Summertime Blues
Summertime Blues
Fixed Income Performance Government Bonds
Summertime Blues
Summertime Blues
Corporate Bonds
Summertime Blues
Summertime Blues
Equity Performance Major Stock Indices
Summertime Blues
Summertime Blues
Geographic Performance
Summertime Blues
Summertime Blues
Sector Performance
Summertime Blues
Summertime Blues
Dear Client, Next week, instead of our regular report, we will be sending you a Special Report from BCA Research’s MacroQuant tactical global asset allocation team. Titled “MacroQuant: A Quantitative Solution For Forecasting Macro-Driven Financial Trends,” this white paper will discuss the purpose, coverage, and methodology of the MacroQuant model. I hope you will find the report insightful. We will be back the following week with the GIS Quarterly Strategy Outlook, where we will explore the major trends that are set to drive financial markets for the rest of 2021 and beyond. We will also be holding a webcast on Thursday, July 8 at 10:00 AM EDT (3:00 PM BST, 4:00 PM CEST, 10:00 PM HKT) to discuss the outlook. Best regards, Peter Berezin Chief Global Strategist Highlights Although the Fed delivered a hawkish surprise on Wednesday, monetary policy is likely to remain highly accommodative for the foreseeable future. We continue to see high US inflation as a long-term risk rather than a short-term problem. Outside of a few industries, wage inflation remains well contained. In those industries suffering from labor shortages, the expiration of emergency unemployment benefits, increased immigration, and the opening up of schools should replenish labor supply. Bottlenecks in the global supply chain are starting to ease. Many key input prices have already rolled over, suggesting that producer price inflation has peaked and is heading down. A slowdown in Chinese credit growth could weigh on metals prices during the summer months, which would further temper inflationary pressures. We are downgrading our view on US TIPS from overweight to neutral. Owning bank shares is a cheaper inflation hedge. Look Who’s Talking The Fed jolted markets on Wednesday after the FOMC signaled it may raise rates twice in 2023. Back in March, the Fed projected no hikes until 2024 (Chart 1). Chart 1Fed Forecasts Converge Toward Market Expectations
Don’t Sweat US Inflation…Just Yet
Don’t Sweat US Inflation…Just Yet
Seven of 18 committee members expected lift-off as early as 2022, up from four in March. Only five participants expected the Fed to start raising rates in 2024 or later, down from 11 previously. The Fed acknowledged recent upward inflation surprises by lifting its forecast of core PCE inflation to 3.4% for 2021 compared with the March projection of 2.4%. These forecast revisions bring the Fed closer to market expectations, although the latter are proving to be a moving target. Going into the FOMC meeting, the OIS curve was pricing in 85 bps of rate tightening by the end of 2023. At present, the market is pricing in about 105 bps of tightening. At his press conference, Chair Powell acknowledged that FOMC members had discussed scaling back asset purchases. “You can think of this meeting as the ‘talking about talking about’ meeting,” he said. A rate hike in 2023 would imply the start of tapering early next year. The key question for investors is whether this week’s FOMC meeting marks the first of many hawkish surprises from the Fed. We do not think it does. As Chair Powell himself noted, the dot-plot is “not a great forecaster of future rate moves,” before adding that “Lift-off is well into the future.” Ultimately, a major monetary tightening cycle would require that inflation remain stubbornly high. As we discuss below, while there are good reasons to think that the US economy will eventually overheat, the current bout of inflation is indeed likely to be “transitory.” This implies that bond yields are unlikely to rise into restrictive territory anytime soon, which should provide continued support to stocks. Inflation: A Long-Term Risk Rather Than A Short-Term Problem Chart 2Globalization Plateaued More Than A Decade Ago
Globalization Plateaued More Than A Decade Ago
Globalization Plateaued More Than A Decade Ago
There are plenty of reasons to worry that US inflation will eventually move persistently higher. As we discussed in a recent report, many of the structural factors that have suppressed inflation over the past 40 years are reversing direction: Globalization is in retreat: The ratio of global trade-to-manufacturing output has been flat for over a decade (Chart 2). Looking out, the ratio could even decline as more companies shift production back home in order to gain greater control over unruly global supply chains. Baby boomers are leaving the labor force en masse. As a group, baby boomers control more than half of US wealth (Chart 3). They will continue to run down their wealth once they retire. However, since they will no longer be working, they will no longer contribute to national output. Continued spending against a backdrop of diminished production could be inflationary. Chart 3Baby Boomers Have Accumulated A Lot Of Wealth
Don’t Sweat US Inflation…Just Yet
Don’t Sweat US Inflation…Just Yet
Despite a pandemic-induced bounce, underlying productivity growth remains disappointing (Chart 4). Slow productivity growth could cause aggregate supply to fall short of aggregate demand. Social stability is in peril, as exemplified by the recent dramatic increase in the US homicide rate. In the past, social instability and higher inflation have gone hand in hand (Chart 5). Chart 4Trend Productivity Growth Has Been Disappointing
Trend Productivity Growth Has Been Disappointing
Trend Productivity Growth Has Been Disappointing
Chart 5Historically, Social Unrest And Higher Inflation Move In Lock-Step
Historically, Social Unrest And Higher Inflation Move In Lock-Step
Historically, Social Unrest And Higher Inflation Move In Lock-Step
Perhaps most importantly, policymakers are aiming to run the economy hot. A tight labor market will lift wage growth (Chart 6). Not only could higher wage growth push up inflation through the usual “cost-push” channel, but by boosting labor’s share of income, a tight labor market could spur aggregate demand. Despite these structural inflationary forces, history suggests that it will take a while – perhaps another two-to-four years – for the US economy to overheat to the point that persistently higher inflation becomes a serious risk. Consider the case of the 1960s. While the labor market reached its full employment level in 1962, it was not until 1966 – when the unemployment rate was a full two percentage points below NAIRU – that inflation finally took off (Chart 7). Chart 6A Tight Labor Market Eventually Bolsters Wages
A Tight Labor Market Eventually Bolsters Wages
A Tight Labor Market Eventually Bolsters Wages
Chart 7Inflation Started Accelerating Quickly Only When Unemployment Reached Very Low Levels In The 1960s
Inflation Started Accelerating Quickly Only When Unemployment Reached Very Low Levels In The 1960s
Inflation Started Accelerating Quickly Only When Unemployment Reached Very Low Levels In The 1960s
In May, 4.4% fewer Americans were employed than in January 2020 (Chart 8). The employment-to-population ratio for prime-aged workers stood at 77.1%, 3.4 percentage points below its pre-pandemic level (Chart 9). Chart 8US Employment Still More Than 4% Below Pre-Pandemic Levels
Don’t Sweat US Inflation…Just Yet
Don’t Sweat US Inflation…Just Yet
Chart 9Prime-Age Employment-To-Population Ratio Remains Below Pre-Pandemic Levels
Prime-Age Employment-To-Population Ratio Remains Below Pre-Pandemic Levels
Prime-Age Employment-To-Population Ratio Remains Below Pre-Pandemic Levels
A Labor Market Puzzle Admittedly, if one were to ask most companies if they were finding it easy to hire suitable workers, one would hear a resounding “no.” According to the National Federation of Independent Business (NFIB), 48% of firms reported difficulty in filling vacant positions in May, the highest share in the 46-year history of the survey (Chart 10). Chart 10US Labor Market Shortages (I)
US Labor Market Shortages (I)
US Labor Market Shortages (I)
Chart 11US Labor Market Shortages (II)
US Labor Market Shortages (II)
US Labor Market Shortages (II)
Nationwide, the job openings rate reached a record high of 6% in April, up from 4.5% in January 2020. The share of workers quitting their jobs voluntarily – a measure of worker confidence – also hit a record of 2.7% (Chart 11). How can we reconcile the apparent tightness in the labor market with the fact that employment is still well below where it was at the outset of the pandemic? Four explanations stand out. First, unemployment benefits remain extremely generous. For most low-wage workers, benefits exceed the pay they received while employed. It is not surprising that labor shortages have been most pronounced in sectors such as leisure and hospitality where average wages are relatively low (Chart 12). The good news for struggling firms is that the disincentive to working will largely evaporate by September when enhanced unemployment benefits expire. Chart 12Labor Scarcity Prevalent In Low-Wage Sectors
Don’t Sweat US Inflation…Just Yet
Don’t Sweat US Inflation…Just Yet
Chart 13School Closures Have Curbed Labor Supply
Don’t Sweat US Inflation…Just Yet
Don’t Sweat US Inflation…Just Yet
Second, lingering fears of the virus and ongoing school closures continue to depress labor force participation. Chart 13 shows that participation rates have recovered less for mothers with young children than for other demographic groups. This problem will also fade away by the fall when schools reopen. Third, the number of foreign workers coming to the US fell dramatically during the pandemic. State Department data show that visas dropped by 88% in the nine months between April and December of last year compared to the same period in 2019 (Chart 14). President Biden revoked President Trump’s visa ban in February, which should pave the way for renewed migration to the US. Chart 14US Migrant Worker Supply Is Depressed
Don’t Sweat US Inflation…Just Yet
Don’t Sweat US Inflation…Just Yet
Chart 15The Pandemic Accelerated Early Retirement
The Pandemic Accelerated Early Retirement
The Pandemic Accelerated Early Retirement
Fourth, about 1.5 million more workers retired during the pandemic than one would have expected based on the pre-pandemic trend (Chart 15). Most of these workers were near retirement age anyway. Thus, there will likely be a decline in new retirements over the next couple of years before the baby boomer exodus described earlier in this report resumes in earnest. Other Input Prices Set To Ease Just as labor shortages in a number of industries will ease later this year, some of the bottlenecks gripping the global supply chain should also diminish. The prices of various key inputs – ranging from lumber, steel, soybeans, corn, to DRAM prices – have rolled over (Chart 16). This suggests that producer price inflation for manufactured goods, which hit a multi-decade high of 13.5% in May – has peaked and is heading lower. Chart 16Input Prices Have Rolled Over
Input Prices Have Rolled Over
Input Prices Have Rolled Over
The jump in prices largely reflected one-off pandemic effects. For example, rental car companies, desperate to raise cash at the start of the pandemic, liquidated part of their fleets. Now that the US economy is reopening, they have found themselves short of vehicles. With fewer rental vehicles hitting the used car market, households flush with cash, and new vehicle production constrained by the global semiconductor shortage, both new and used car prices have soared. Vehicle prices have essentially moved sideways since the mid-1990s (Chart 17). Thus, it is doubtful that the recent surge in prices represents a structural break. More likely, prices will come down as supply increases. According to a recent report from Goldman Sachs, auto production schedules already imply an almost complete return to January output levels in June. Chart 17Vehicle Prices Have Essentially Moved Sideways Since The Mid-1990s
Vehicle Prices Have Essentially Moved Sideways Since The Mid-1990s
Vehicle Prices Have Essentially Moved Sideways Since The Mid-1990s
Chart 18Rebounding Pandemic-Affected Services Prices Are Pushing Up Overall CPI
Don’t Sweat US Inflation…Just Yet
Don’t Sweat US Inflation…Just Yet
As Chart 18 shows, more than half of the increase in consumer prices in April and May can be explained by higher vehicle prices, along with a rebound in pandemic-affected service prices (airfares, hotels, and event admissions). Outside those sectors, the level of the CPI remains below its pre-pandemic trend (Chart 19). Chart 19Unwinding Of "Base Effects"
Unwinding Of "Base Effects"
Unwinding Of "Base Effects"
Chart 20"Supercore" Inflation Measures Remain Well Contained
"Supercore" Inflation Measures Remain Well Contained
"Supercore" Inflation Measures Remain Well Contained
More refined measures of underlying inflation such as the trimmed-mean CPI, median CPI, and sticky price CPI are all running well below their official core CPI counterpart (Chart 20). While certain components of the CPI basket, such as residential rental payments, are likely to exhibit higher inflation in the months ahead, others such as vehicle and food prices will see lower inflation, and perhaps even outright deflation. Slower Chinese Credit Growth Should Temper Commodity Inflation Chart 21Chinese Credit Growth And Metal Prices Move Together
Chinese Credit Growth And Metal Prices Move Together
Chinese Credit Growth And Metal Prices Move Together
Chinese credit growth and base metals prices are strongly correlated (Chart 21). We do not expect the Chinese authorities to embark on a new deleveraging campaign. Credit growth has already fallen back to 11%, which is close to the prior bottom reached in late-2018. Nevertheless, to the extent that changes in Chinese credit growth affect commodity prices with a lag of about six months, metals prices could struggle to maintain altitude over the summer months. China’s plan to release metal reserves into the market could further dampen prices. We remain short the global copper ETF (COPX) relative to the global energy ETF (IXC) in our trade recommendations. The trade is up 18.4% since we initiated on May 27, 2021. We will close this trade if it reaches our profit target of 30%. Bank Shares Are A Better Hedge Against Inflation Than TIPS We have been overweight TIPS in our view matrix. However, with 5-year/5-year forward breakevens trading near pre-pandemic levels, any near-term upside for inflation expectations is limited (Chart 22). As such, we are downgrading TIPS from overweight to neutral in our fixed-income recommendations. Investors looking to hedge inflation risk should consider bank shares. Our baseline view is that the 10-year Treasury yield will rise to about 1.9% by the end of the year. If inflation fails to come down as fast as we anticipate, bond yields would increase even more than that. Chart 23 shows that banks almost always outperform the S&P 500 when bond yields are rising. Chart 22Limited Near-Term Upside For Inflation Expectations
Limited Near-Term Upside For Inflation Expectations
Limited Near-Term Upside For Inflation Expectations
Chart 23Bank Shares Thrive in A Rising Yield Environment
Bank Shares Thrive in A Rising Yield Environment
Bank Shares Thrive in A Rising Yield Environment
Banks are also cheap. US banks trade at 12.2-times forward earnings compared with 21.9-times for the S&P 500. Non-US banks trade at 10-times forward earnings compared to 16.4-times for the MSCI ACW ex-US index. Finally, we like gold as a long-term inflation hedge. We would go long gold in our structural trade recommendations if the price were to fall to $1700/ounce. Peter Berezin Chief Global Strategist pberezin@bcaresearch.com Global Investment Strategy View Matrix
Don’t Sweat US Inflation…Just Yet
Don’t Sweat US Inflation…Just Yet
Special Trade Recommendations
Don’t Sweat US Inflation…Just Yet
Don’t Sweat US Inflation…Just Yet
Current MacroQuant Model Scores
Don’t Sweat US Inflation…Just Yet
Don’t Sweat US Inflation…Just Yet

Weekly Performance Update For the week ending Thu Jun 17, 2021 The Market Monitor displays the trailing 1-quarter performance of strategies based around the BCA Score. For each region, we construct an equal-weighted, monthly rebalanced portfolio consisting of the top 3 stocks per sector and compare it with the regional benchmark. For each portfolio, we show the weekly performance of individual holdings in the Top Contributors/Detractors table. In addition, the Top Prospects table shows the holdings that currently have the highest BCA Score within the portfolio. For more details, click the region headers below to be redirected to the full historical backtest for the strategy. BCA US Portfolio
Market Monitor (Jun 17, 2021)
Market Monitor (Jun 17, 2021)
Total Weekly Return BCA US Portfolio S&P500 TRI -2.34% -0.37% Top Contributors WAT:US IT:US PSA:US KOF:US MPLX:US Weekly Return 12 bps 4 bps 2 bps 1 bps 0 bps Top Detractors TX:US SCCO:US STX:US LPX:US AN:US Weekly Return -38 bps -33 bps -27 bps -14 bps -13 bps Top Prospects TX:US BRK.A:US ESGR:US ANAT:US UHAL:US BCA Score 99.09% 98.99% 97.29% 96.86% 96.54% BCA Canada Portfolio
Market Monitor (Jun 17, 2021)
Market Monitor (Jun 17, 2021)
Total Weekly Return BCA Canada Portfolio S&P/TSX TRI -0.74% 0.54% Top Contributors TOY:CA CSU:CA CPX:CA TCN:CA DSG:CA Weekly Return 14 bps 11 bps 9 bps 9 bps 8 bps Top Detractors CS:CA PXT:CA TCL.A:CA LNR:CA IMO:CA Weekly Return -43 bps -29 bps -19 bps -19 bps -18 bps Top Prospects CS:CA LNF:CA IFP:CA RUS:CA CFP:CA BCA Score 99.79% 98.75% 98.48% 98.39% 96.94% BCA UK Portfolio
Market Monitor (Jun 17, 2021)
Market Monitor (Jun 17, 2021)
Total Weekly Return BCA UK Portfolio FTSE 100 TRI -0.22% 0.94% Top Contributors OXIG:GB POLR:GB CVSG:GB AAF:GB AGRO:GB Weekly Return 21 bps 16 bps 15 bps 10 bps 8 bps Top Detractors FDEV:GB HSBK:GB SVST:GB DRX:GB VVO:GB Weekly Return -36 bps -14 bps -13 bps -11 bps -10 bps Top Prospects SVST:GB GLTR:GB NLMK:GB RMG:GB BPCR:GB BCA Score 99.77% 98.61% 98.37% 97.91% 96.67% BCA Eurozone Portfolio
Market Monitor (Jun 17, 2021)
Market Monitor (Jun 17, 2021)
Total Weekly Return BCA EMU Portfolio MSCI EMU TRI 0.12% 1.27% Top Contributors STR:AT PHA:FR AOF:DE GTT:FR EDNR:IT Weekly Return 22 bps 19 bps 13 bps 12 bps 8 bps Top Detractors SOLV:BE CEM:IT MMT:FR TKA:AT MS:IT Weekly Return -11 bps -8 bps -8 bps -7 bps -7 bps Top Prospects STR:AT SOLV:BE POST:AT CNV:FR BB:FR BCA Score 99.02% 98.56% 98.44% 97.93% 97.52% BCA Japan Portfolio
Market Monitor (Jun 17, 2021)
Market Monitor (Jun 17, 2021)
Total Weekly Return BCA Japan Portfolio TOPIX TRI 0.90% 0.35% Top Contributors 2791:JP 4966:JP 3132:JP 6676:JP 7994:JP Weekly Return 32 bps 31 bps 27 bps 19 bps 18 bps Top Detractors 8117:JP 8850:JP 3291:JP 8595:JP 6345:JP Weekly Return -14 bps -13 bps -12 bps -11 bps -10 bps Top Prospects 5930:JP 3291:JP 4966:JP 9436:JP 7994:JP BCA Score 99.48% 98.95% 98.66% 98.34% 98.32% BCA Hong Kong Portfolio
Image
Total Weekly Return BCA Hong Kong Portfolio Hang Seng TRI 0.79% -0.61% Top Contributors 990:HK 3600:HK 857:HK 215:HK 1919:HK Weekly Return 58 bps 51 bps 21 bps 18 bps 15 bps Top Detractors 1258:HK 2877:HK 2768:HK 323:HK 743:HK Weekly Return -25 bps -19 bps -15 bps -12 bps -11 bps Top Prospects 990:HK 1606:HK 2232:HK 86:HK 116:HK BCA Score 98.85% 98.22% 97.78% 97.60% 97.38% BCA Australia Portfolio
Market Monitor (Jun 17, 2021)
Market Monitor (Jun 17, 2021)
Total Weekly Return BCA Australia Portfolio S&P/ASX All Ord. TRI -0.99% 0.56% Top Contributors JLG:AU FLN:AU NEW:AU PL8:AU ELD:AU Weekly Return 24 bps 21 bps 16 bps 8 bps 8 bps Top Detractors PDN:AU GRR:AU CIA:AU SRV:AU CAJ:AU Weekly Return -50 bps -23 bps -18 bps -17 bps -13 bps Top Prospects GRR:AU PIC:AU CIA:AU BFG:AU BLX:AU BCA Score 98.90% 98.01% 97.03% 96.38% 96.21%
Highlights China’s Communist Party has overcome a range of challenges over the past 100 years, performed especially well over the past 42 years, but the macro and geopolitical outlook is darkening. The “East Asian miracle” phase of Chinese growth has ended. Potential GDP growth is slowing and it will be harder for Beijing to maintain financial and sociopolitical stability. The Communist Party has shifted the basis of its legitimacy from rapid growth to quality of life and nationalist foreign policy. The latter, however, will undermine the former by stirring up foreign protectionism. In the near term, global investors should favor developed market equities over China/EM equities. But they should favor China and Hong Kong stocks over Taiwanese stocks given significant geopolitical risk over the Taiwan Strait. Structurally, favor the US dollar and euro over the renminbi. Feature Ten years ago, in the lead up to the Communist Party’s 90th anniversary, I wrote a report called “China and the End of the Deng Dynasty,” referring to Deng Xiaoping, the Chinese Communist Party’s great pro-market reformer.1 The argument rested on three points: the end of the export-manufacturing economic model, an increasingly assertive foreign policy, and the revival of Maoist nationalism. After ten years the report holds up reasonably well but it did not venture to forecast what precisely would come next. In reality it is the rule of the Communist Party, and not the leader of any one man, that fits into China’s history of dynastic cycles. As the party celebrates a hundred years since its founding on July 23, 1921, it is necessary to pause and reflect on what the party has achieved over the past century and what the current Xi Jinping era implies for the country’s next 100 years. Single-Party Rule Can Bring Economic Success. Communism Cannot. Regime type does not preclude wealth. Countries can prosper regardless of whether they are ruled by one person, one party, or many parties. The richest countries in the world grew rich over centuries in which their governments evolved from monarchy to democracy and sometimes back again. Even today several of the world’s wealthy democracies are better described as republics or oligarchies. Chart 1China Outperformed Communism But Not Liberal Democracy
China’s Communist Party Turns 100: So What?
China’s Communist Party Turns 100: So What?
The rule of one person, or autocracy, is not necessarily bad for economic growth. For every Kim Il Sung of North Korea there is a Lee Kuan Yew of Singapore. But authority based on a single person often expires with that person and rarely survives his grandchild. In China, Chairman Mao Zedong’s death occasioned a power struggle. Deng Xiaoping’s attempts to step down led to popular unrest that threatened the Communist Party’s rule on two separate occasions in the 1980s. The rule of a single party is thought to be more sustainable. Japan and Singapore are effectively single-party states and the wealthiest countries in Asia. They are democracies with leadership rotation and a popular voice in national affairs. And yet South Korea’s boom times occurred under single-party military rule. The same goes for the renegade province of Taiwan. Only around the time these two reached about $11,000-$14,000 GDP per capita did they evolve into multi-party democracies – though their wealth grew rapidly in the wake of that transition. China and soon Vietnam will test whether non-democratic, single-party rule can persist beyond the middle-income economic status that brought about democratic transition in Taiwan (Chart 1). Vietnam and Taiwan are the closest communist and non-communist governing systems, respectively, to mainland China. Insofar as China and Vietnam succeed at catching up with Taiwan it will be for reasons other than Marxist-Leninist ideology. Most communist systems have failed. At the height of international communism in the twentieth century there were 44 states ruled by communist parties; today there are five. China and Vietnam are the rare examples of communist states that not only survived the Soviet Union’s fall but also unleashed market forces and prospered (Chart 2). North Korea survived in squalor; Cuba’s experience is mixed. States that close off their economies do not have a good record of generating wealth. Closed economies lack competition and investment, struggle with stagflation, and often succumb to corruption and political strife. Openness seems to be a more diagnostic variable than government type or ideology, given the prosperity of democratic Japan and non-democratic China. Has the CPC performed better than other communist regimes? Arguably. It performs better than Vietnam but worse than Cuba on critical measures like infant mortality rates and life expectancy. Has it performed better than comparable non-communist regimes? Not really, though it is fast approaching Taiwan in all of these measures (Chart 3). Chart 2Communist States Get Rich By Compromising Their Communism
China’s Communist Party Turns 100: So What?
China’s Communist Party Turns 100: So What?
Chart 3China Catching Up To Cuba On Basic Wellbeing
China’s Communist Party Turns 100: So What?
China’s Communist Party Turns 100: So What?
What can be said for certain is that, since China’s 1979 reform and opening up, the CPC has avoided many errors and catastrophes. It survived the 1980s, 1990s, and 2000s without succumbing to international isolation, internal divisions, or economic crisis. It has drastically increased its share of global power (Table 1). Contrast this global ascent with the litany of mistakes and crises in the US since the year 2000. The CPC also managed the past decade relatively well despite the Chinese financial turmoil of 2015-16, the US trade war of 2018-19, and the COVID-19 pandemic. However, these events hint at greater challenges to come. China’s transition to a consumer-oriented economy has hardly begun. The struggle to manage systemic financial risk is intensifying today at risk to growth and stability (Chart 4). The trade war is simmering despite the Phase One trade deal and the change of party in the White House. And it is too soon to draw conclusions about the impact of the global pandemic, though China suppressed the virus more rapidly than other countries and led the world into recovery. Table 1China’s Global Rise After ‘Reform And Opening Up’
China’s Communist Party Turns 100: So What?
China’s Communist Party Turns 100: So What?
Chart 4China To Keep Struggling With Financial Instability
China To Keep Struggling With Financial Instability
China To Keep Struggling With Financial Instability
Judging by the points above, there are two significant risks on the horizon. First, the CPC’s revival of neo-Maoist ideology, particularly the new economic mantra of self-reliance and “dual circulation” (import substitution), poses the risk of closing the economy and undermining productivity.2 Second, China’s sliding back into the rule of a single person – after the “consensus rule” that prevailed after Deng Xiaoping – increases the risk of unpredictable decision-making and a succession crisis whenever General Secretary Xi Jinping steps down. The party’s internal logic holds that China’s economic and geopolitical challenges are so enormous as to require a strongman leader at the helm of a single-party and centralized state. But because of the traditional problems with one-man rule, there is no guarantee that the country will remain as stable as it has been over the past 42 years. Slowing Growth Drives Clash With Foreign Powers Every major East Asian economy has enjoyed a “miracle” phase of growth – and every one of them has seen this phase come to an end. Now it is China’s turn. The country’s potential GDP growth is slowing as the population peaks, the labor force shrinks, wages rise, and companies outsource production to cheaper neighbors (Charts 5A & 5B). The Communist Party is attempting to reverse the collapse in the fertility rate by shifting from its historic “one Child policy,” which sharply reduced births. It shifted to a two-child policy in 2016 and a three-child policy in 2021 but the results have not been encouraging over the past five years. Chart 5AChina’s Demographic Decline Accelerating
China’s Communist Party Turns 100: So What?
China’s Communist Party Turns 100: So What?
Chart 5BChina’s Demographic Decline Accelerating
China’s Communist Party Turns 100: So What?
China’s Communist Party Turns 100: So What?
In the best case China’s growth will follow the trajectory of Taiwan and South Korea, which implies at most a 6% yearly growth rate over the next decade (Chart 6). This is not too slow but it will induce financial instability as well as hardship for overly indebted households, firms, and local governments. Chart 6China's Growth Rates Will Converge With Taiwan, South Korea
China's Growth Rates Will Converge With Taiwan, South Korea
China's Growth Rates Will Converge With Taiwan, South Korea
The Communist Party’s legitimacy was not originally based on rapid economic growth but it came to be seen that way over the roaring decades of the 1980s through the 2000s. Thus when the Great Recession struck the party had to shift the party’s base of legitimacy. The new focus became quality of life, as marked by the Xi administration’s ongoing initiatives to cut back on corruption, pollution, poverty, credit excesses, and industrial overcapacity while increasing spending on health, education, and society (Chart 7). Chart 7China’s Fiscal Burdens Will Rise On Social Welfare Needs
China’s Communist Party Turns 100: So What?
China’s Communist Party Turns 100: So What?
The party’s efforts to improve standards of living and consumer safety also coincided with an increase in propaganda, censorship, and repression to foreclose political dissent. The country falls far short in global governance indicators (Chart 8). Chart 8China Lags In Governance, Rule Of Law
China’s Communist Party Turns 100: So What?
China’s Communist Party Turns 100: So What?
A second major new source of party legitimacy is nationalist foreign policy. China adopted a “more assertive” foreign and trade policy in the mid-2000s as its import dependencies ballooned. It helped that the US was distracted with wars of choice and financial crises. After the Great Recession the CPC’s foreign policy nationalism became a tool of generating domestic popular support amid slower economic growth. This was apparent in the clashes with Japan and other countries in the East and South China Seas in the early 2010s, in territorial disputes with India throughout the past decade, in political spats with Norway and most recently Australia, and in military showdowns over the Korean peninsula (2015-16) and today the Taiwan Strait (Chart 9). Chart 9Proxy Wars A Real Risk In China’s Periphery
China’s Communist Party Turns 100: So What?
China’s Communist Party Turns 100: So What?
If China were primarily focused on foreign policy and global strategy then it would not provoke multiple neighbors on opposite sides of its territory at the same time. This is a good way to motivate the formation of a global balance-of-power coalition that can constrain China in the coming years. But China’s outward assertiveness is not driven primarily by foreign policy considerations. It is driven by the secular economic slowdown at home and the need to use nationalism to drum up domestic support. This is why China seems indifferent to offending multiple countries at once (like India and Australia) as well as more distant trade partners whom it “should be” courting rather than offending (like Europe). Such assertive foreign policy threatens to undermine quality of life, namely by provoking international protectionism and sanctions on trade and investment. The US is galvanizing a coalition of democracies to put pressure on China over its trade practices and human rights. The Asian allies are mostly in step with the US because they fear China’s growing clout. The European states do not have as much to fear from China’s military but they do fear China’s state-backed industry and technological rise. Europe’s elites also worry about anti-establishment political movements just like American elites and therefore are trying to win back the hearts and minds of the working class through a more proactive use of fiscal and industrial policy. This entails a more assertive trade policy. China has so far not adapted to the potential for a unified front among the democracies, other than through rhetoric. Thus the international horizon is darkening even as China’s growth rates shift downward. China’s Geopolitical Outlook Is Dimming China’s government has overcome a range of challenges and crises. The country takes an ever larger role in global trade despite its falling share of global population because of its productivity and competitiveness. The drop in China’s outward direct investment is tied to the global pandemic and may not mark a top, given that the country will still run substantial current account surpluses for the foreseeable future and will need to recycle these into natural resources and foreign production (Chart 10). However, the limited adoption of the renminbi as a reserve currency in the face of this formidable commercial power reveals the world’s reservations about Beijing’s ability to maintain macroeconomic stability, good governance, and peaceful foreign relations. Chart 10China's Rise Continues
China's Rise Continues
China's Rise Continues
Chart 11China's Policy Uncertainty: A Structural Uptrend
China's Policy Uncertainty: A Structural Uptrend
China's Policy Uncertainty: A Structural Uptrend
China is not in a position to alter the course of national policy dramatically prior to the Communist Party’s twentieth national congress in 2022. The Xi administration is focused on normalizing monetary and fiscal policy and heading off any sociopolitical disturbances prior to that critical event, in which General Secretary Xi Jinping, who was originally slated to step down at this time according to the old rules, may be anointed the overarching “chairman” position that Mao Zedong once held. The seventh generation of Chinese leaders will be promoted at this five-year rotation of the Central Committee and will further consolidate the Xi administration’s grip. It will also cement the party’s rotation back to leaders who have ideological educations, as opposed to the norm in the 1990s and early 2000s of promoting leaders with technocratic skills and scientific educations.3 This does not mean that President Xi will refuse to hold a summit with US President Biden in the coming months nor does it mean that US-China strategic and economic dialogue will remain defunct. But it does mean that Beijing is unlikely to make any major course correction until after the 2022 reshuffle – and even then a course correction is unlikely. China has taken its current path because the Communist Party fears the sociopolitical consequences of relinquishing economic control just as potential growth slows. The new ruling philosophy holds that the Soviet Union fell because of Mikhail Gorbachev’s glasnost and perestroika, not because openness and restructuring came too late. Moreover it is far from clear that the US, Europe, and other democratic allies will apply such significant and sustained pressure as to force China to change its overall strategy. America is still internally divided and its foreign policy incoherent; the EU remains reactive and risk-averse. China has a well-established set of strategic goals for 2035 and 2049, the 100th anniversary of the People’s Republic, and the broad outlines will not be abandoned. The implication is that tensions with the US and China’s Asian neighbors will persist. Rising policy uncertainty is a secular trend that will pick back up sooner rather than later (Chart 11), to the detriment of a stable and predictable investment environment. Chart 12Chinese Government’s Net Worth High But Hidden Liabilities Pose Risks
China’s Communist Party Turns 100: So What?
China’s Communist Party Turns 100: So What?
Monetary and fiscal dovishness and a continued debt buildup are the obvious and necessary solutions to China’s combination of falling growth potential, rising social liabilities, the need to maintain the rapid military buildup in the face of geopolitical challenges. Sovereign countries can amass vast debts if they own their own debt and keep nominal growth above average bond yields. China’s government has a very favorable balance sheet when national assets are taken into consideration as well as liabilities, according to the IMF (Chart 12). On the other hand, China’s government is having to assume a lot of hidden liabilities from inefficient state-owned companies and local governments. In the short run there are major systemic financial risks even though in the long run Beijing will be able to increase its borrowing and bail out failing entities in order to maintain stability, just like Japan, the US, and Europe have had to do. The question for China is whether the social and political system will be able to handle major crises as well as the US and Europe have done, which is not that well. Investment Takeaways The rule of a single party is not a bar to economic success – but the rule of a single person is a liability due to the problem of succession. Marxism-Leninism is terrible for productivity unless it is compromised to allow for markets to operate, as in China and Vietnam. States that close their economies to the outside world usually atrophy. There is no compelling evidence that China’s Communist Party has performed better than a non-communist alternative would have done, given the province of Taiwan’s superior performance on most economic indicators. Since 1979, the Communist Party has avoided catastrophic errors. It has capitalized on domestic economic potential and a favorable international environment. Now, in the 2020s, both of these factors are changing for the worse. China’s “miracle” phase of growth has expired, as it did for other East Asian states before it. The maturation of the economy and slowdown of potential GDP have forced the Communist Party to shift the base of its political legitimacy to something other than rapid income growth: namely, quality of life and nationalist foreign policy. An aggressive foreign policy works against quality of life by provoking protectionism from foreign powers, particularly the United States, which is capable of leading a coalition of states to pressure China. The Communist Party’s policy trajectory is unlikely to change much through the twentieth national party congress in 2022. After that, a major course correction to improve relations with the West is conceivable, though we would not bet on it. Between 2021 and China’s 2035 and 2049 milestones, the Communist Party must navigate between rising socioeconomic pressures at home and rising geopolitical pressures abroad. An economic or political breakdown at home, or a total breakdown in relations with the US, could lead to proxy wars in China’s periphery, including but not limited to the Taiwan Strait. For now, global investors should favor the euro and US dollar over the renminbi (Chart 13). Chart 13Prefer The Dollar And Euro To The Renminbi
Prefer The Dollar And Euro To The Renminbi
Prefer The Dollar And Euro To The Renminbi
Mainland investors should favor government bonds relative to stocks. Chinese stocks hit a major peak earlier this year and the government’s seizure of control over the tech sector is taking a toll. Investors should prefer developed market equities relative to Chinese equities until China’s current phase of policy tightening ends and there is at least a temporary improvement in relations with the United States. But investors should also prefer Chinese and Hong Kong stocks relative to Taiwanese due to the high risk of a diplomatic crisis and the tail risk of a war. Matt Gertken Vice President Geopolitical Strategy mattg@bcaresearch.com Footnotes 1 The report concluded, “the emerging trends suggest a likely break from Deng's position toward heavier state intervention in the economy, more contentious relationships with neighbors, and a Party that rules primarily through ideology and social control.” Co-written with Jennifer Richmond, "China and the End of the Deng Dynasty," Stratfor, April 19, 2011, worldview.stratfor.com. 2 The Xi administration’s new concept of “dual circulation” entails that state policy will encourage the domestic economy whereas the international economy will play a secondary role. This is a reversal of the outward and trade-oriented economic model under Deng Xiaoping. See “Xi: China’s economy has potential to maintain long-term stable development,” November 4, 2020, news.cgtn.com. 3 See Willy Wo-Lap Lam, "China’s Seventh-Generation Leadership Emerges onto the Stage," Jamestown Foundation, China Brief 19:7, April 9, 2019, Jamestown.org.
Highlights New variants of SARS-Cov-2 will create new waves of infection, the inflation bubble is bursting, and massive slack in the US labour market will keep US inflation structurally subdued. The coming years will be defined by a trifecta of surging productivity, massive slack in the labour market, and ultra-low inflation. Overweight US T-bonds both tactically and structurally. Equity investors should overweight growth versus value… …overweight defensives versus cyclicals… …overweight the US versus the euro area… …and overweight DM versus EM, both tactically and structurally. Tactically underweight US REITS. Tactically overweight Nike versus L’Oréal. Feature Chart of the WeekThe Global Pandemic Is Still In Flow
Viral Variants Strike Down The Reflation Trade
Viral Variants Strike Down The Reflation Trade
The UK will have to wait for its ‘freedom day.’ Lifting the remaining pandemic-related restrictions has been postponed because a new and more vaccine-resistant ‘delta’ variant of the virus is threatening to unleash a third wave of UK infections. The UK experience is important because it was the first major developed economy to roll out its mass vaccination program. Thereby, the UK experience could be the harbinger of things to come in other major economies like the US and the euro area. Vaccines Against RNA Viruses Are Not Highly Effective The general public and financial markets have high expectations that mass vaccination programs can banish Covid forever. Such expectations are unrealistic, just as it is unrealistic to expect vaccinations to banish the flu forever. It is unrealistic to expect vaccinations to banish Covid forever. Covid, the flu, and measles are all diseases caused by ‘RNA viruses.’ The defining characteristic of RNA viruses is their poor proofreading ability during replication, resulting in high rates of mutation. The resulting variant strains make RNA viruses highly effective at evading vaccinations. As the Journal of Immunology Research puts it:1 “No vaccine or specific treatment is available for many of these RNA viruses and some of the available vaccines and treatments are not highly effective.” Measles is an exception because its virus is ‘antigenically monotypic.’ The spike proteins (antigens) that the measles virus uses to infect a cell cannot mutate even slightly without breaking. However, the SARS-CoV-2 spike proteins can mutate and still infect. This we know because the virus has already evolved several infectious variants – including the latest delta variant – with increasing abilities to evade the current spike-based vaccines (Figure I-1). Figure I-1How Variants Of SARS-CoV-2 Evade Spike-Based Vaccines
Viral Variants Strike Down The Reflation Trade
Viral Variants Strike Down The Reflation Trade
SARS-Cov-2 doesn’t care who it infects or in which country they live. Sadly, the pandemic has claimed more fatalities in the first half of 2021 than in the whole of 2020 (Chart of the Week). And the virus will continue to mutate liberally given that its reproduction rate is still close to 1 (Chart I-2). Chart I-2The Reproduction Rate Is Still Close To 1
Viral Variants Strike Down The Reflation Trade
Viral Variants Strike Down The Reflation Trade
Crucially, the mutations of the virus that evade vaccinations are the ones that are more likely to spread and become the new dominant strains. After the delta variant will come the epsilon variant, the zeta variant, the eta variant… and so on until we run out of Greek alphabet. In which case, should we just adopt the same strategy for Covid as we use for the seasonal flu – remove all pandemic-related restrictions, while offering booster vaccinations to the most medically vulnerable once or twice a year? There are two problems with this strategy: First, it could still overwhelm our healthcare systems during surges in demand. This we know because a bad flu season, by itself, was already pushing some healthcare systems to the limit. There is very little spare capacity to cope with additional demand. Second, unlike the flu, Covid appears to have long-term sequelae, colloquially called ‘long Covid’ with unknown chronic damage to health. As the Lancet points out: “Long-term sequelae of Covid-19 are unknown… we owe good answers on the long-term consequences of the disease to our patients and healthcare providers” Without these answers, policymakers cannot adopt the same strategy for Covid as for the flu. So yes, we can certainly offer vaccinations to the most medically vulnerable once or twice a year. But managing infections will also require non-pharmaceutical interventions, dialled up and down based on the severity of future waves of infection. A Productivity Super-Boom Is Coming Periodic non-pharmaceutical interventions which include restrictions to national and international movement will be around for much longer than the general public and financial markets expect. This will solidify a more remote way of working, shopping, interacting, and doing business. The good news is that this will create the mother of all productivity booms. Productivity tends to surge after every recession. This is because the period immediately after a recession is when the economy experiences the most intensive clearing out of dead wood, restructuring of capital and labour, and absorption of new technologies and ways of working. The pandemic has forced nearly every company and every worker to adopt new technologies and ways of working and living. But whereas most recessions upend one or two sectors of the economy, the pandemic has upended all sectors – forcing nearly every company and every worker to adopt new technologies and ways of working and living. This will make the pandemic productivity boom a super-boom unlike anything experienced in recent history (Chart I-3). Chart I-3The Pandemic Productivity Boom Will Be A Super-Boom
Viral Variants Strike Down The Reflation Trade
Viral Variants Strike Down The Reflation Trade
The unfortunate corollary of this productivity super-boom is that the pace of absorption of the excess unemployed and inactive will be slower, meaning that it will take a long time to reach the goal of ‘full employment’ (Chart I-4). Chart I-4It Will Take A Long Time To Reach 'Full Employment'
Viral Variants Strike Down The Reflation Trade
Viral Variants Strike Down The Reflation Trade
In the US, the Federal Reserve is acutely aware of this. As Jay Powell has pointed out: “It’s going to be a different economy. We’ve been hearing a lot from companies looking at deploying better technology and perhaps fewer people, including in some of the services industries that have been employing a lot of people. It seems quite likely that a number of the people who had those service sector jobs will struggle to find the same job, and may need time to find work” Without full employment, it will be difficult to maintain US inflation at or above the Fed’s 2 percent target. The transmission mechanism is that the (permanent) unemployment rate establishes the ability to pay rent. Thereby, it is the main driver of ‘rent of shelter’, which comprises almost half of the core consumer price index. Empirically, unless rent of shelter inflation gets to 3 percent and remains there, it will be very difficult for core inflation to remain at over 2 percent (Chart I-5 and Chart I-6). For reference, rent of shelter inflation is now running well short of 3 percent, at 2.2 percent. Chart I-5Full Employment Is Needed To Lift Rent Inflation To 3 Percent...
Viral Variants Strike Down The Reflation Trade
Viral Variants Strike Down The Reflation Trade
Chart I-6...And Rent Inflation At 3 Percent Is Needed To Keep Core Inflation At 2 Percent
Viral Variants Strike Down The Reflation Trade
Viral Variants Strike Down The Reflation Trade
In a nutshell, the coming years will be defined by a trifecta of surging productivity, massive slack in the labour market, and ultra-low inflation. Overweight Growth, And Overweight The US Given that new variants of the virus will create new waves of infection, that The Inflation Bubble Will Burst, and that the massive slack in the labour market will keep inflation structurally subdued, investors should own US T-bonds both tactically and structurally. There is massive slack in the US labour market. Furthermore, The Pareto Principle Of Investment tells us that if you get the direction of the bond yield right, you will get your whole investment strategy right. Declining bond yields boost growth stocks. This is because the ‘net present value’ of cashflows that are weighted deep into the future are highly leveraged to a falling discount rate. In addition, the productivity super-boom will be facilitated by technology and new economy sectors. As such, equity investors should avoid value, and steer towards growth, both tactically and structurally (Chart I-7). This extends to overweighting defensives versus cyclicals, overweighting the growth-heavy US versus the value-heavy euro area, and so on. In effect, all these positions are just one massive correlated trade (Charts I-8-Chart I-11). Chart I-7Structurally Overweight Growth Versus Value
Viral Variants Strike Down The Reflation Trade
Viral Variants Strike Down The Reflation Trade
Chart I-8Correlated Trades: Bond Price, Growth Versus Value...
Viral Variants Strike Down The Reflation Trade
Viral Variants Strike Down The Reflation Trade
Chart I-9...Tech Versus ##br##Market...
Viral Variants Strike Down The Reflation Trade
Viral Variants Strike Down The Reflation Trade
Chart I-10...Defensive Versus Cyclical...
Viral Variants Strike Down The Reflation Trade
Viral Variants Strike Down The Reflation Trade
Chart I-11...And US Versus Euro Area
Viral Variants Strike Down The Reflation Trade
Viral Variants Strike Down The Reflation Trade
These sector preferences also imply an overweight to developed markets (DM) versus emerging markets (EM). Tactically Underweight US REITS, And Tactically Overweight Nike Versus L’Oréal Finally, and corroborating the preceding sections, the rally in ‘reopening plays’ has become fractally fragile. One way to play this tactically is to underweight US REITS (Chart I-12). Chart I-12'Reopening Plays' Are Fractally Fragile: US REITS
Viral Variants Strike Down The Reflation Trade
Viral Variants Strike Down The Reflation Trade
But our preferred tactical expression is to overweight Nike versus L’Oréal (Chart I-13), setting the profit target and symmetrical stop-loss at 9 percent. Chart I-13'Reopening Plays' Are Fractally Fragile: L'Oreal Versus Nike
Viral Variants Strike Down The Reflation Trade
Viral Variants Strike Down The Reflation Trade
Dhaval Joshi Chief Strategist dhaval@bcaresearch.com Footnotes 1 Journal of Immunology Research, Volume 218: Immune Responses to RNA Viruses, by Elias A. Said Fractal Trading System Fractal Trades 6-Month Recommendations Structural Recommendations Closed Fractal Trades Closed Trades Asset Performance Equity Market Performance Indicators To Watch - Bond Yields Chart II-1Indicators To Watch - Bond Yields - Euro Area
Viral Variants Strike Down The Reflation Trade
Viral Variants Strike Down The Reflation Trade
Chart II-2Indicators To Watch - Bond Yields - Europe Ex Euro Area
Viral Variants Strike Down The Reflation Trade
Viral Variants Strike Down The Reflation Trade
Chart II-3Indicators To Watch - Bond Yields - Asia
Viral Variants Strike Down The Reflation Trade
Viral Variants Strike Down The Reflation Trade
Chart II-4Indicators To Watch - Bond Yields - Other Developed
Viral Variants Strike Down The Reflation Trade
Viral Variants Strike Down The Reflation Trade
Indicators To Watch - Interest Rate Expectations Chart II-5Indicators To Watch - Interest Rate Expectations
Viral Variants Strike Down The Reflation Trade
Viral Variants Strike Down The Reflation Trade
Chart II-6Indicators To Watch - Interest Rate Expectations
Viral Variants Strike Down The Reflation Trade
Viral Variants Strike Down The Reflation Trade
Chart II-7Indicators To Watch - Interest Rate Expectations
Viral Variants Strike Down The Reflation Trade
Viral Variants Strike Down The Reflation Trade
Chart II-8Indicators To Watch - Interest Rate Expectations
Viral Variants Strike Down The Reflation Trade
Viral Variants Strike Down The Reflation Trade
Dear Client, Next week, in lieu of our regular weekly report, I will be hosting two webcasts where I will discuss the outlook for China’s economy and financial markets, a year into policy normalization. The webcasts will be held on Tuesday, June 22 at 10:00 am EDT (English), and Thursday, June 24 at 9:00 am HKT (Mandarin). We will return to our regular publishing schedule on Wednesday, June 30. Best regards, Jing Sima, China Strategist Feature China’s onshore stocks rebounded in the past two months on the back of a rapidly appreciating RMB versus the US dollar and accelerating foreign capital inflows (Chart 1). However, in our view, China’s domestic policy backdrop and economic fundamentals do not support a sustained rally in Chinese stocks in the next six months. The RMB’s rise vis-à-vis the US dollar will likely falter in the second half of the year as China’s growth weakens. A narrowing in real yields later this year between China’s government bonds and US Treasuries will also discourage foreign flows into Chinese assets. Performance of Chinese cyclical stocks versus defensives failed to decisively breakout in both the onshore and offshore equity markets. An underperformance in cyclical stocks relative to defensives has historically pointed to waning market sentiment towards the Chinese economy (Chart 2). Chart 1Rapid Appreciation In The RMB Buoyed A Recent Rebound In A-Shares
Rapid Appreciation In The RMB Buoyed A Recent Rebound In A-Shares
Rapid Appreciation In The RMB Buoyed A Recent Rebound In A-Shares
Chart 2Cyclical Stocks Continued To Underperform Defensives
Cyclical Stocks Continued To Underperform Defensives
Cyclical Stocks Continued To Underperform Defensives
The number of onshore stocks with prices rising versus falling remains low, even though there has been a slight improvement this year from Q4 2020. The narrow breath in the equity market implies that recent rebound in A-share stocks has been largely driven by a handful of companies (Chart 3). Such narrow breadth suggests that the rebound in Chinese stock prices will not sustain (Chart 4). Chart 3A Narrow-Based Market Rally in A-Shares
A Narrow-Based Market Rally in A-Shares
A Narrow-Based Market Rally in A-Shares
Chart 4Narrowing Market Breadth Has Historically Led To Price Pullbacks
Narrowing Market Breadth Has Historically Led To Price Pullbacks
Narrowing Market Breadth Has Historically Led To Price Pullbacks
A tightened monetary and credit environment has created obstacles for Chinese equities since early this year. Credit numbers released last week show that credit growth deceleration has gathered speed in May, raising the risk of policy overtightening, i.e. credit growth undershooting the government’s 2021 targets. We could see some moderation in the credit growth deceleration into 2H21. A delay in the rollout of local government (LG) bonds and LG special purpose bonds (SPBs) in the first five months of the year means the pace of LG bond issuance between June and October will escalate, which will help to stabilize credit growth. However, weak corporate bond net financing and contracting shadow banking will cap the upside in credit expansion. Chart 5The Economy Could Surprise The Market To The Downside In Q3
The Economy Could Surprise The Market To The Downside In Q3
The Economy Could Surprise The Market To The Downside In Q3
Additionally, if more LG bonds come onto the market in Q3, then we could see tighter interbank liquidity conditions and higher bond yields. This, in turn, would partially offset the positive effects on the economy and equity market from a slower pace in credit growth deceleration. For the next six months, we continue to hold an underweight position in Chinese onshore and investable stocks, in both absolute terms and within a global equity portfolio. Policy tightening has not reversed course and there is an escalating risk that economic data will surprise the market to the downside in Q3 (Chart 5). Qingyun Xu, CFA Associate Editor qingyunx@bcaresearch.com Macro Policy Conditions Are Still Unfavorable For Risk Assets A further deterioration in the credit impulse in May reflects Chinese authorities’ efforts to reduce local government leverage and shadow banking activities. Net corporate bond financing contracted for the first time since early 2018, driven by shrinking local government financing vehicle (LGFV) bonds (Chart 6). Meanwhile, the pace of contraction in shadow-bank loans climbed. At this rate of deceleration, credit growth will undershoot the government’s 2021 target, which is expected to be in line with this year’s nominal GDP growth. The pace in credit expansion on a year-over-year basis has dropped to its previous cycle’s trough (Chart 7). Moreover, the speed of the deceleration in credit growth has outpaced the 2017/18 tightening cycle. It has been seven months since Chinese credit growth peaked (October 2020), which is significantly less than the 13 months it took for credit to decline from top to bottom in 2017/18. Chart 6Contraction In Net Corporate Bond Financing And Shadow Banking Dragged Down Credit Growth In May
Contraction In Net Corporate Bond Financing And Shadow Banking Dragged Down Credit Growth In May
Contraction In Net Corporate Bond Financing And Shadow Banking Dragged Down Credit Growth In May
Chart 7Credit Growth Has Decelerated To Its Trough Reached In 2017/18 Tightening Cycle
Credit Growth Has Decelerated To Its Trough Reached In 2017/18 Tightening Cycle
Credit Growth Has Decelerated To Its Trough Reached In 2017/18 Tightening Cycle
Chart 8Most Of LG Bonds Issued In The First Five Months Are Refinancing Bonds
The Stars Are Not Yet Aligned For Chinese Stocks
The Stars Are Not Yet Aligned For Chinese Stocks
So far this year, LG bond issuance is also behind schedule. About 63% of LG bonds issued in the first five months are refinancing bonds (Chart 8). The new LG bonds and LG SPBs issued to date account for only 21% and 16.5%, respectively, of their 2021 quotas. A delay in LG bond issuance in the first five months means that much more bonds will be on the market between June and October, which may help to stabilize credit growth in Q3. However, weak corporate bond financing and an acceleration in contracting shadow banking activities will cap the upside on broad credit. We do not expect a reversal in policy tightening. Instead, credit growth will likely hover near current levels for the rest of the year. In the past, Chinese policymakers eased when the global manufacturing backdrop faltered. Given that global growth is robust, Chinese policymakers will not feel any urgency to reverse policy setting and will likely use the strong external environment as an opportunity for domestic deleveraging. Chinese Exports Will Face Challenges In The Second Half Of The Year Chart 9A Broad-Based Moderation In China's Exports to DMs
A Broad-Based Moderation In China's Exports to DMs
A Broad-Based Moderation In China's Exports to DMs
Export growth slowed in May with a broad-based moderation in the country’s exports to developed markets (DMs), albeit from a very elevated level (Chart 9). The easing in exports reflects an ongoing demand shift in the DMs away from goods to services as economic activity normalizes (Chart 10). China’s robust exports, which have been driven by strong and partly pandemic-induced global demand for goods, will likely gradually lose strength in the second half of the year. China’s weakening new export orders component in the May manufacturing PMI reflects this trend (Chart 11). Chart 10Global Consumption Recovery In Services Will Likely Outpace Goods
Global Consumption Recovery In Services Will Likely Outpace Goods
Global Consumption Recovery In Services Will Likely Outpace Goods
Chart 11China's Softening New Export Orders Signal Further Export-Sector Weakness
China's Softening New Export Orders Signal Further Export-Sector Weakness
China's Softening New Export Orders Signal Further Export-Sector Weakness
An appreciating RMB versus the US dollar is also a headwind for Chinese exports. The USD/CNY historically has led Chinese new export orders by around six months, with the exception of the pandemic-hit outlier in 2020 (Chart 12). The recent sharp RMB appreciation is starting to weight on Chinese exports. Moreover, BCA’s Geopolitical strategists do not expect that China will principally benefit from US President Biden’s $2.4 trillion infrastructure and green energy plan . US explicitly aims to diminish China’s role as a supplier of US goods and materials. The widening divergence between US’s trade deficit with China and the rest of world already shows evidence (Chart 13). Chart 12The RMB's Rapid Rise Creates Headwinds For Chinese Exports
The RMB's Rapid Rise Creates Headwinds For Chinese Exports
The RMB's Rapid Rise Creates Headwinds For Chinese Exports
Chart 13China's Exports May Not Benefit From Biden's Infrastructure Plan
China's Exports May Not Benefit From Biden's Infrastructure Plan
China's Exports May Not Benefit From Biden's Infrastructure Plan
Still No Inflation Pass-Through Chart 14Chinese Producers Are Unable To Pass Rising Input Costs On To Consumers
Chinese Producers Are Unable To Pass Rising Input Costs On To Consumers
Chinese Producers Are Unable To Pass Rising Input Costs On To Consumers
Chinese surging producer prices overstate domestic inflationary pressures. Inflation in the Producer Price Index (PPI) surged by 9.0% year-over-year in May, jumping to its highest level since 2009. High PPI inflation reflects rising commodity prices and a low base effect. Meanwhile, inflationary pressures are much more muted for consumer goods and services. The gap between producer and consumer prices widened to the highest level since 1990, highlighting the absence of price inflation pass-through from producers to consumers (Chart 14). We expect soaring PPI inflation to be transitory; it will ease when low-base factors from last year and global supply constraints are removed later this year. CPI inflation will remain tame through the year. As such, Chinese authorities are unlikely to tighten monetary policy in response to high PPI readings. Instead, Beijing will continue to use regulatory measures to curb speculation in the commodity market and window-guide industries to readjust material inventories to help ease the pace of rising commodity prices. Historically, PPI inflation’s impact on consumer prices has been weak when prices on producer goods were pushed up by supply shocks rather than mounting domestic demand. The sharp uptick in the PPI during the 2017/18 cycle was mostly due to China’s supply-side reforms and a rapid consolidation in the upstream industries. Global supply constraints linked to the pandemic have also resulted in a sharp upturn in the Chinese PPI since mid-2020. Moreover, Chart 15 shows that the pass-through from PPI inflation to consumers is closely correlated to household income growth. The pass-through has weakened significantly since 2011 when household income growth subdued along with a declining Chinese working population (Chart 16). Chart 15Subdued Household Income Growth Since 2011 Has Suppressed CPI Inflation
Subdued Household Income Growth Since 2011 Has Suppressed CPI Inflation
Subdued Household Income Growth Since 2011 Has Suppressed CPI Inflation
Chart 16Income Growth Decelerated After China's Working Population Peaked
Income Growth Decelerated After China's Working Population Peaked
Income Growth Decelerated After China's Working Population Peaked
Chart 17Profits Diverged Between Upstream And Mid & Downstream Industries
The Stars Are Not Yet Aligned For Chinese Stocks
The Stars Are Not Yet Aligned For Chinese Stocks
Lacking inflation pass-through from producers to consumers has led to a bifurcated profit recovery between upstream and mid & downstream industries. Since late last year, the share of upstream industries in total profits increased sharply at the expense of mid and downstream businesses (Chart 17). A deterioration in the profits of mid and downstream industries will weigh on the outlook for their capex, which in turn, will reduce the demand for upstream goods. Domestic Demand Remains China’s Weakest Link Investments and household demand remain the weakest links in China’s economy. Sluggish household consumption reflects a fragile post-pandemic recovery in manufacturing and services employment, and a rising propensity for precautionary savings (Chart 18). A PBoC survey shows that households’ preference for more saving deposits soared in 2020 (Chart 19). Although it has slightly diminished since late 2020, the reading is still much higher than its pre-pandemic level and will likely persist to year-end on the back of a subdued outlook for employment and income. Chart 18Weak Employment In Both Manufacturing And Service Industries
Weak Employment In Both Manufacturing And Service Industries
Weak Employment In Both Manufacturing And Service Industries
Chart 19Propensity For Precautionary Savings Is Still Elevated
Propensity For Precautionary Savings Is Still Elevated
Propensity For Precautionary Savings Is Still Elevated
Manufacturing investment continued its rebound in April, but the growth has not rallied to its pre-pandemic state and the recovery was more than offset by falling old-economy infrastructure and real estate investment growth (Chart 20). Although a pickup in LG SPB issuance in Q3 will provide some support to infrastructure expenditures, the effect on aggregate infrastructure investment probably will be muted. China’s Ministry of Finance has raised the requirements for approvals of new investment projects, which have decreased notably since early this year (Chart 21). Hence, growth in infrastructure investment may not significantly improve in 2H21 without a harmonized policy impetus for more bank loans and loosened regulations on local government spending. Chart 20Recovery In Manufacturing Investment Was More Than Offset By Falling Infrastructure And Real Estate Investment Growth
Recovery In Manufacturing Investment Was More Than Offset By Falling Infrastructure And Real Estate Investment Growth
Recovery In Manufacturing Investment Was More Than Offset By Falling Infrastructure And Real Estate Investment Growth
Chart 21Falling New Projects Approval
Falling New Projects Approval
Falling New Projects Approval
Real Estate Sector: Mounting Deleverage Pressure Property developers face challenges from heightened government scrutiny on bank loans and limits on the sector’s leverage ratio, along with curtailed off-balance sheet funding due to Asset Management Regulation (AMR) . Bank loans to real estate developers and household mortgages have tumbled to historical lows and will likely slow further in the next few months (Chart 22, top panel). The tightened financing policies have started to cool demand in the real estate market (Chart 22, bottom panel). Softer housing demand will start to drag down property developers’ capital spending and real estate construction activities (Chart 23). Chart 22Deteriorating Financing Starting To Cool The Property Market
Deteriorating Financing Starting To Cool The Property Market
Deteriorating Financing Starting To Cool The Property Market
Chart 23Real Estate Investments And Construction Activities May Slow Further
Real Estate Investments And Construction Activities May Slow Further
Real Estate Investments And Construction Activities May Slow Further
Table 1China Macro Data Summary
The Stars Are Not Yet Aligned For Chinese Stocks
The Stars Are Not Yet Aligned For Chinese Stocks
Table 2China Financial Market Performance Summary
The Stars Are Not Yet Aligned For Chinese Stocks
The Stars Are Not Yet Aligned For Chinese Stocks
Footnotes Cyclical Investment Stance Equity Sector Recommendations