Equities
Relative to history, global equity markets have become richly valued over the past several years, particularly in the US. While stock prices are not expensive relative to competing assets such as government bonds and cash, this simply reflects the degree to…
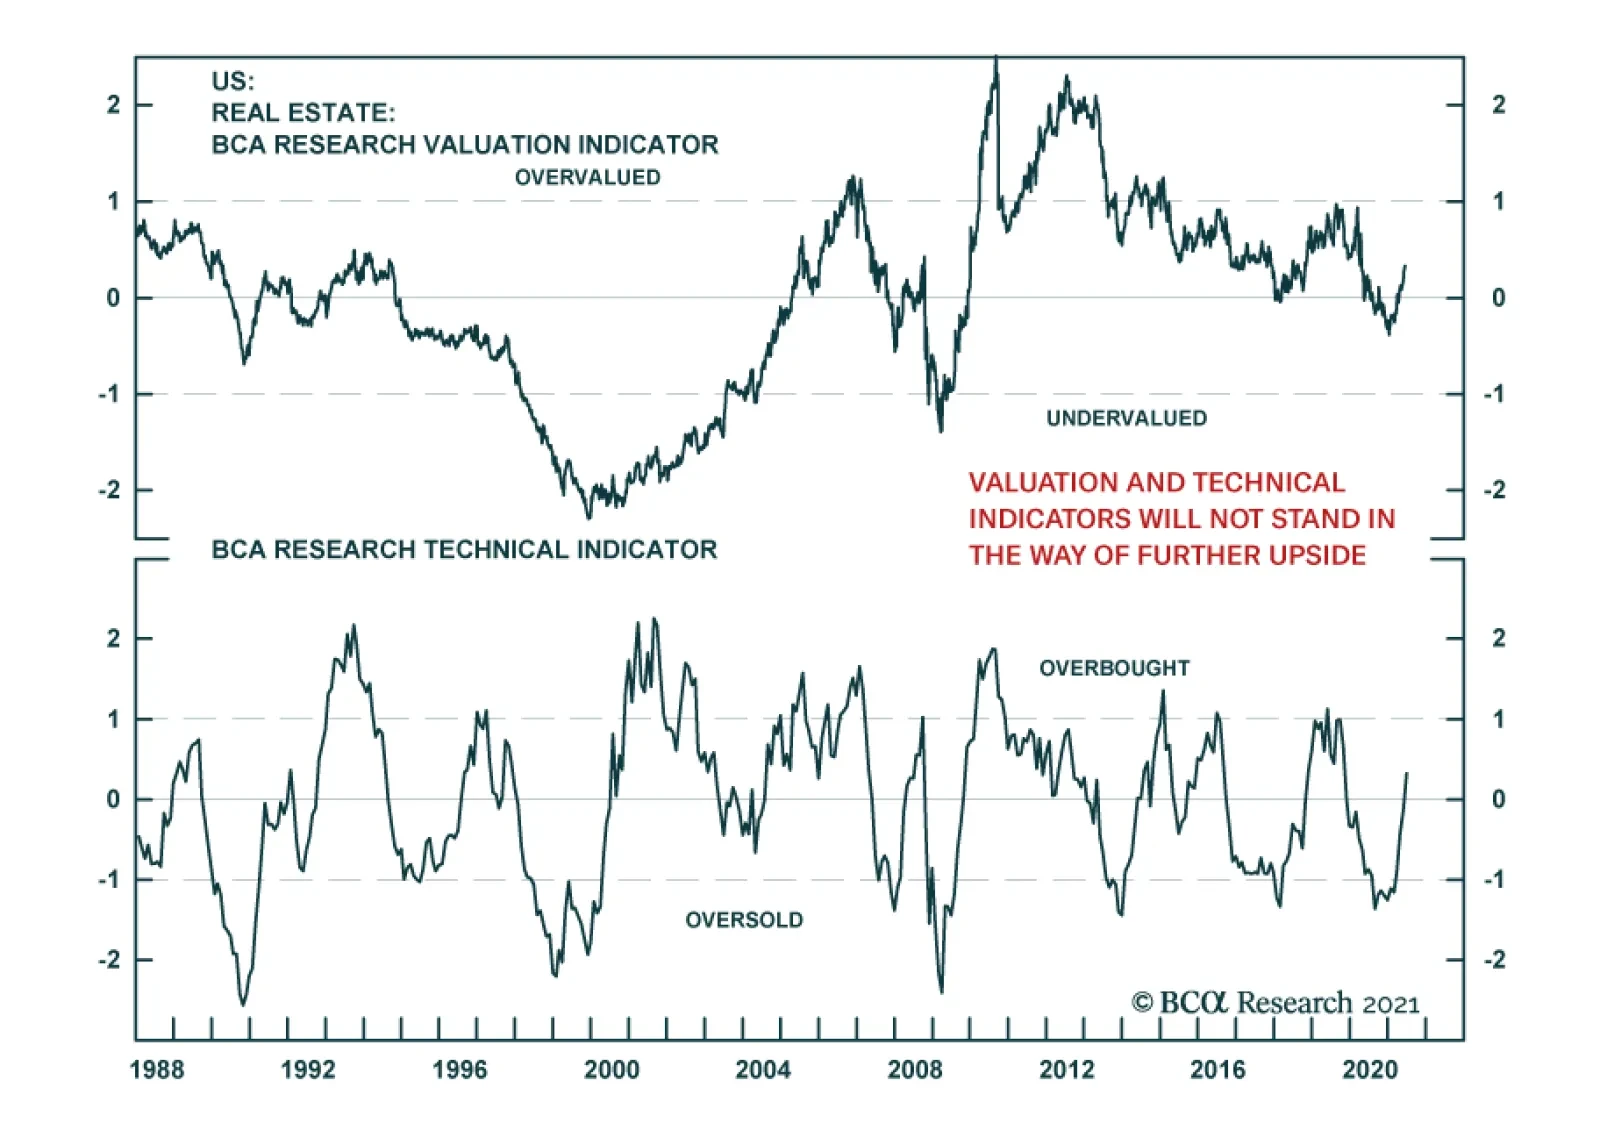
Real estate is the best performing S&P 500 sector so far this quarter. It is up 14.8% since March 31, beating the broad index by 7.4 percentage points and bringing its year-to-date gains to 24.4%. The outperformance is somewhat puzzling given the…
BCA Research’s US Equity Strategy service recommends a barbell positioning for equity portfolios. The US business cycle is shifting into a slowdown stage: US economic and earnings growth will remain robust but decelerate from their peak. Meanwhile,…

Highlights The US business cycle is shifting into a slowdown stage: US economic and earnings growth will remain robust but decelerate from their peak. Treasury rates have stabilized, and inflation fears, if not dissipated, have become priced in. The consumer is flash with cash, and pent-up demand has not yet faded. Demand for services exceeds demand for goods. Valuations are rich, and short-term consolidation is likely. Considering this market backdrop, we recommend a barbell positioning for equity portfolios – a combination of Growth and Cyclicals: Shift allocation towards stable growth sectors, such as Technology, which are getting a shot in the arm from rates stabilization and the growth slowdown. Take a granular approach to selection of cyclical sectors and industries, with preference for the ones most exposed to consumer pent-up demand for goods and services and to a revival of global trade flows. Differentiate between Value and Cyclicals: Cyclicals are more “growthy” than run-of-the-mill Value sectors. Feature In our report of June 7, 2021, we outlined our investment framework. In this report we apply our investment principles to analyze the state of the equity markets today and derive investment recommendations. Business Cycle Is Shifting Into A Slowdown Stage The pandemic is barely over, but the markets have already galloped through both the recovery and expansion stages of the business cycle on the back of economic reopening, fiscal and monetary stimulus, and pent-up demand (Table 1). Table 1Stages Of The Business Cycle
Rotate Into Growth Stocks, Be Granular In The Selection Of Cyclicals
Rotate Into Growth Stocks, Be Granular In The Selection Of Cyclicals
We posit that the business cycle is at the crest of the expansion stage and is shifting into a moderate slowdown. While growth is to remain robust, it has most likely peaked and is starting to decelerate: The ISM Composite reading is elevated but has slipped from a high of 64.2 in March to 62.6 in June (Chart 1). According to Bloomberg consensus estimates, GDP growth is to slow from 6.4% in 2021 to 4% in 2022. The earnings cycle is also peaking. In Q1-2021 US equities delivered 53% YoY earnings growth. Going forward, expectations are for 21% (Chart 2). Chart 1ISM Composite Has Peaked
ISM Composite Has Peaked
ISM Composite Has Peaked
Chart 2EPS Growth Has Also Peaked
EPS Growth Has Also Peaked
EPS Growth Has Also Peaked
While earnings growth is expected to remain robust, a change in pace often manifests itself in a change of market leadership from Value to Growth. Prices Set To Rise But At A Slower Pace Since the beginning of this year, investors’ eyes have been fixed on rising inflation readings. The crux of the debate was centered on whether high inflation is here to stay or is a transitory phenomenon. While we don’t have a definitive answer yet, there is a sufficient body of evidence to suggest that inflation is likely to decelerate. First, the 5-year inflation breakeven has stabilized indicating that the market expects consumer price increases to moderate (Chart 3). Second, the recent spike in the inflation reading has been exacerbated by the base effect of comparison with the darkest days of the pandemic in March-May 2020. Inflation troughed in June of 2020, which will anchor this coming summer’s inflation numbers to a higher base. (Chart 4). Chart 3Inflation Breakeven Stabilized
Inflation Breakeven Stabilized
Inflation Breakeven Stabilized
Chart 4Base Effects Of The Spring 2020 Are To Roll Off
Base Effects Of The Spring 2020 Are To Roll Off
Base Effects Of The Spring 2020 Are To Roll Off
Third, inflation is likely to dissipate to more normal levels later in the year thanks to millions rejoining the labor force upon expiration of supplemental employment insurance benefits in the fall, and the supply chain gradually becoming unclogged. Last, the bubble in commodities prices has burst with prices of lumber, corn and steel coming down from their highs by more than 30%, keeping a lid on PPI, and subsequently on the price of finished goods (Chart 5 & Chart 6) . Chart 5Bubble In Commodities Burst
Bubble In Commodities Burst
Bubble In Commodities Burst
Chart 6PPI To Follow Commodity Prices
PPI To Follow Commodity Prices
PPI To Follow Commodity Prices
Rates Are Stabilizing After rising by nearly 1% from 0.5% to 1.5% in the course of just four months from November 2020 to February 2021, the 10-year Treasury yield has been range bound between 1.5% and 1.7% despite fireworks in the US economic data ranging from CPI readings to unemployment beats (Chart 7). The fact that the bond market is refusing to budge no matter how positive a macro release number we get, confirms our view that a post Covid-19 economic revival and accelerated growth have been priced in. Case in point: The Citi Economic Surprise Index (CESI) turned down from its February highs and is approaching zero. Chart 7Rates Are Range Bound Since March
Rates Are Range Bound Since March
Rates Are Range Bound Since March
Given the tight positive correlation (44%) between CESI and UST10Y, and inflation moderating, it is unlikely that the bond market will enter another aggressive sell-off phase (Chart 8). It is possible that rates will continue to grind higher over the summer, but the rate of ascent, which is more important for growth-oriented assets than the level (excluding extreme readings), is likely to be slow. Chart 8Positive Economic Data Is Priced In
Positive Economic Data Is Priced In
Positive Economic Data Is Priced In
Consumers Are Flash With Cash After a series of helicopter cash drops, most consumers came out of the recession in a better financial shape than they entered it. According estimates by Peter G Peterson Foundation, only 22% and 19% of second and third round of stimulus checks have been spent (in addition, some of the money was used to pay off debt). Personal savings have increased by roughly $1.5 trillion from January 2020 trough, and disposable income has increased by 6% (Chart 9). With plentiful jobs and quit rates off the map, we expect consumer confidence to remain high and support spending. The investment implication is that we favor parts of the equity market most exposed to American consumer. Chart 9Consumers Are Flash With Cash
Consumers Are Flash With Cash
Consumers Are Flash With Cash
Services Are In Higher Demand Than Goods After months of consumer behavior altered by fears of the pandemic, economic reopening has brought about strong demand for services. Indeed, the latest Non-manufacturing ISM PMI reading was 64 compared to 61 for Manufacturing, which has clearly peaked. As a result, we favor service sectors, both in the consumer and industrial space (Chart 10). Chart 10Demand For Services Outstrips Demand For Goods
Demand For Services Outstrips Demand For Goods
Demand For Services Outstrips Demand For Goods
Global Trade Flows Are Soaring The global push for vaccinations and pent-up demand have jump-started trade flows around the globe. Despite shipping bottlenecks and container shortages, global trade is thriving, strengthening demand for industrial goods and transportation services (Chart 11). Chart 11Global Trade Soars
Global Trade Soars
Global Trade Soars
Valuations Are Elevated The US equity market had a fantastic run over the past year, delivering 93% return from March 2020 trough, and is now trading at 30x trailing PE. Forward-looking PE is also elevated at 23x. About 40% of S&P 500 industry groups are trading in the top 10% of their historical valuations. In a way, markets have borrowed returns from the future (Chart 12). With valuations close to an all-time high, equity markets do not have much safety margin and are vulnerable to a correction which may be triggered by hawkish rhetoric from the Fed, or upside inflation or employment surprises. Having said that, we are bullish on equity markets on a three to six months horizon. Chart 12US Equities Are Expensive
US Equities Are Expensive
US Equities Are Expensive
Lastly, high valuation is not necessarily an impediment to a continued bull market but more of a speed limit: Returns of US equities are to be modest going forward. To keep portfolio return volatility down and enhance compounding effects, we recommend carrying a healthy allocation to such defensive sectors as Health Care. We would stay away from bond proxies like Utilities and Telecom. Investment Implications To sum it all up: Economic and earnings growth is to remain robust but come down from the peak, inflation is to decelerate but stay high, rates are to remain stable, consumer spending is to stay robust, demand for services is to exceed demand for goods and global trade flows are soaring. What do these economic developments mean for portfolio positioning? What styles and sectors will fare best in the current economic environment? Growth does well when rates and inflation are stabilizing thanks to the long duration nature of its earnings stream, and shines in a slowdown when growth becomes scarcer. Cyclicals thrive in an environment of falling inflation, but a mature cycle is not an ideal backdrop for their outperformance. In terms of sector selection, we favor Cyclicals with exposure to consumers, playing growth through the “new economy”, i.e. Software and Services, and Internet Retailing. We will fund the new positions by taking profits from recent winners, Financials and Materials. The following is a brief rationale for these allocations. Value/Growth Rotation Between November 5, 2020 and May 7, 2021, long-duration Growth equities underperformed Value equities by 16%, beaten down by rising rates and accelerating economic growth. However, recently the case for Growth has strengthened. With rates stabilizing and inflation decelerating, there are already early signs that Growth stocks are staging a comeback, outperforming Value by 2.5% since May 10. Chart 13 shows that, in an enviroment of slowing inflation, Growth tends to outperform Value (Chart 14). Chart 13Growth Underperforms Value Since October 2020
Growth Underperforms Value Since October 2020
Growth Underperforms Value Since October 2020
Chart 14Growth Has Outperformed When Inflation Decelerates
Rotate Into Growth Stocks, Be Granular In The Selection Of Cyclicals
Rotate Into Growth Stocks, Be Granular In The Selection Of Cyclicals
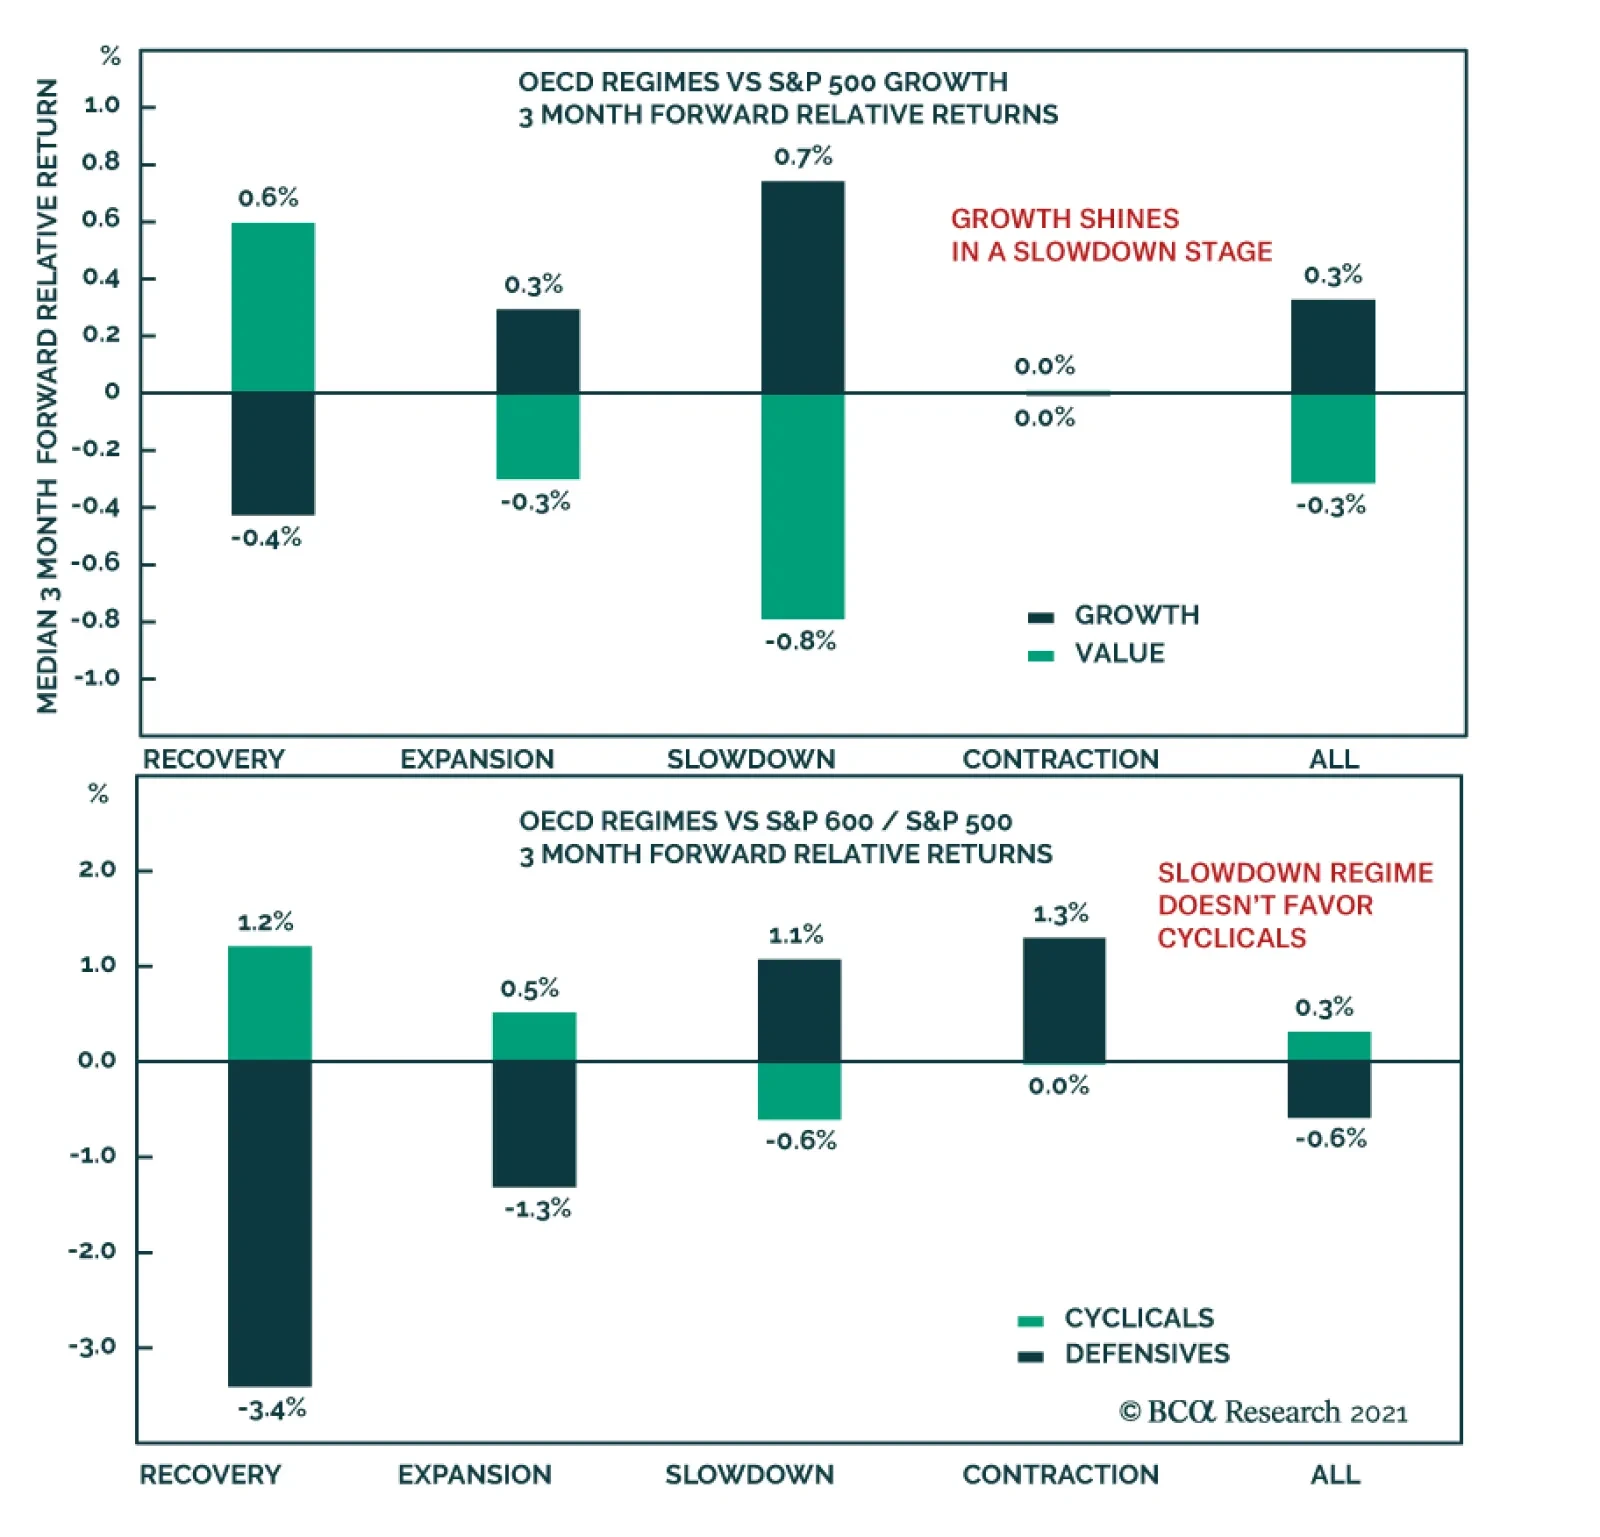
Further, peak economic and earnings growth, as well as the business cycle moving into a slowdown stage, bode well for Growth sectors (Chart 15). Chart 15Growth Shines In A Slowdown Stage
Rotate Into Growth Stocks, Be Granular In The Selection Of Cyclicals
Rotate Into Growth Stocks, Be Granular In The Selection Of Cyclicals
Chart 16Growth Is Less Frothy Now
Growth Is Less Frothy Now
Growth Is Less Frothy Now
Further, zooming into fundamentals and valuations, we observe that Growth stocks remain expensive, trading at a forward multiple of 27x, which is a 53% premium to Value, but some of the froth has come off as the style is now trading 3 points lower than back in December 2020 (Chart 16). Comparing Growth and Value earnings expectations, Value stocks are expected to grow about 10% faster than Growth stocks (Chart 17). The crux of the current Growth/Value dilemma is that, while optically Value is more attractive: cheaper than Growth and offering higher earnings growth, it is also much more sensitive to a slowdown in economic growth and rates stabilization (even if rates remain high). Thus, if we are right and rates and inflation have indeed steadied, and growth is slowing. Growth will outperform Value despite the latter’s superior fundamentals. The explanation lies in a sector composition of the two styles. Value’s top allocation is Financials, for which stabilizing rates and a flattening yield curve are detrimental. Growth’s top allocation is Information Technology (40% of the index), which thrives in an environment of lower growth and stable rates (Chart 18). All in all, we recommend topping up Growth sectors in a portfolio to be better positioned for an imminent change in regime. Chart 17Value Is Expected To Have Higher Earnings Growth
Value Is Expected To Have Higher Earnings Growth
Value Is Expected To Have Higher Earnings Growth
Chart 18Growth Is Exposed To Tech, Value To Financials
Rotate Into Growth Stocks, Be Granular In The Selection Of Cyclicals
Rotate Into Growth Stocks, Be Granular In The Selection Of Cyclicals
Cyclicals Vs Defensives Similarly to Value, Cyclicals have outperformed Defensives by about 10.7% since November. However, in March this rally ran out of steam, and relative returns remain range bound Chart 19. Further, performance of Cyclicals is sensitive to the stages of the business cycle. Normally, in a slowdown stage, Cyclicals lag. Chart 20 shows performance of Cyclicals during the slowdown stage of the business cycles. Chart 19Cyclicals Have Not Outperformed Defensives Since March
Cyclicals Have Not Outperformed Defensives Since March
Cyclicals Have Not Outperformed Defensives Since March
Chart 20Slowdown Regime Doesn’t Favor Cyclicals
Rotate Into Growth Stocks, Be Granular In The Selection Of Cyclicals
Rotate Into Growth Stocks, Be Granular In The Selection Of Cyclicals
However, this cycle may turn out somewhat different due to supply-chain disruptions and pent-up demand. Many of the conditions supporting Cyclicals are still in place: The potential infrastructure package, improving global trade and easy financial conditions. Earnings expectations relative to Defensives remain robust, and valuations have recently compressed from a 97% premium in February 2021, to 17% in May (Chart 21). Hence, we are not yet ready to give up on Cyclical stocks but will be granular in our allocations, favoring industry groups most exposed to services, global trade, infrastructure, and the US consumer. Chart 21Cyclicals Have Rerated Rel To Defensives
Cyclicals Have Rerated Rel To Defensives
Cyclicals Have Rerated Rel To Defensives
Are Cyclicals The Same As Value? The reader may observe that we favor Cyclicals over Value and wonder if they are not one and the same. While recently Value and Cyclicals have been nearly 90% correlated (Chart 22), this relationship changes over time. Cyclicals have higher exposure than Value to stable growth sectors like Technology, and Consumer Discretionary (Chart 23). We prefer Cyclicals to Value because Technology is a quintessential growth sector favored by the current macroeconomic backdrop, and the Consumer Discretionary sector is exposed to increases in discretionary income and consumer demand for services. Choosing between Value and Cyclicals, we pick Cyclicals (Chart 23). Chart 22Relationship Between Value And Cyclicals Changes Over Time
Rotate Into Growth Stocks, Be Granular In The Selection Of Cyclicals
Rotate Into Growth Stocks, Be Granular In The Selection Of Cyclicals
Chart 23Cyclicals Have More Exposure To Stable Growth Than Value
Rotate Into Growth Stocks, Be Granular In The Selection Of Cyclicals
Rotate Into Growth Stocks, Be Granular In The Selection Of Cyclicals
Investment Recommendations Overweight Growth-Oriented And Cyclical Sectors Growth-oriented industries groups and industries benefiting from rate stabilization, such as Software and IT Services, Semiconductors, and Internet Retail. Valuations are expensive but are justified by strong expected long-term earnings growth. Cyclical industries exposed to consumer demand for services and experiences, such as Hotels, Restaurants, Entertainment, and Airlines. Discretionary goods industry groups such as Autos & Components, and Consumer Durables. Industrial service-oriented industry groups, such as Transportation and Professional Services Global trade and infrastructure exposed industries such as Transportation, Construction and Engineering, and Building Materials. Equal Weight Defensive Sectors Health care valuations and returns have been subdued due to disruptions wrecked by the pandemic. However, in addition to trading at 16x forward earnings, the sector expects solid earnings growth (10% over the next 12 months) and is likely to benefit from post-Covid-19 normalization in health care and diminished policy risks. To be more specific, policy risk for Big Pharma is higher as it is a bipartisan target, while managed health care got a big positive policy surprise when Biden wisely decided earlier this year not to re-fight the health care battles of the Obama administration. Underweight Sectors Negatively Affected By Rate And Inflation Stabilization (Off High Levels) Rate stabilization and yield-curve flattening is detrimental to rate-sensitive sectors such as Banks and Insurance. Inflation deceleration will be detrimental to industry groups with high pricing power and high exposure to raw materials. Since commodities prices have rolled over, the Metals and Mining industry group may take a pause. We will also avoid bond-proxy sectors like Utilities and Consumer Staples: Rates have stabilized but a bull market in bonds is highly unlikely Bottom Line Peak growth, inflation and rates stabilization herald a new lease of life for Growth stocks. Strong consumption and pent-up demand for goods and services as well as a revival of global trade support further outperformance of Cyclicals. Irene Tunkel Chief Strategist, US Equity Strategy irene.tunkel@bcaresearch.com Recommended Allocation
Rotate Into Growth Stocks, Be Granular In The Selection Of Cyclicals
Rotate Into Growth Stocks, Be Granular In The Selection Of Cyclicals
Highlights The ECB did not tighten policy, despite its upgrade to the Euro Area growth outlook. The rise in the Eurozone inflation will be transitory. The Euro Area continues to suffer from excessive slack, and current price pressures are narrow. The ECB rightfully worries about tightening financial conditions by prematurely removing monetary accommodation. The ECB does not want to move ahead of the release of its Strategy Review. Global growth is likely to experience a temporary hiccup this summer. The ECB will only taper its PEPP program in Q1 2022 with no firm announcement until Q4 2021. Stay overweight European peripheral bonds. Despite a favorable 18-month outlook, European cyclical equities face pronounced risks this summer. Investors should raise cash levels for now to keep dry powder for this fall. Feature At its policy meeting last week, the ECB refrained from adjusting policy. While the euro and bund yields barely budged on the news, Italian and Greek spreads narrowed a few basis point, welcoming the dissipating risk of decreased bond purchases. The ECB’s decision is in line with the analysis we published two weeks ago, which argued against the Governing Council hinting at a tapering of asset purchases at its June meeting. Growing signs that the expected pick-up in the Eurozone inflation will be transitory and that China’s credit slowdown will negatively impact Europe increase our confidence that the ECB will not announce any adjustment to its asset purchases until the fourth quarter of 2021. This setup supports European peripheral bonds. However, it also points to a correction in European cyclical stocks. The ECB Announcement ECB President Christine Lagarde highlighted the need for a steady hand, with no policy change. The risks to growth are now “broadly balanced,” but enough uncertainty remains that removing accommodation too early still creates a much poorer risk/reward trade-off than maintaining the current policy. The ECB boosted its growth forecast in 2021 and 2022. As Table 1A illustrates, 2021 GDP growth was raised to 4.6% from 4% in March, and 2022 GDP growth was raised to 4.7% from 4.1%. Activity was left unchanged at 2.1% in 2023. The ECB and this publication are on the same page; Euro Area domestic activity will enjoy a welcomed fillip as a result of the re-opening of the economy, a response to the improving pace of vaccination across the continent. Moreover, the NGEU program will start disbursing funds this summer and will add another boost to growth. Despite this significant upgrade to anticipated growth, the ECB kept its accelerated pace of asset purchases in place, at least through the summer, because the inflation outlook remains below its target of “close but below 2%” durably. As Table 1B shows, the ECB expects HICP to hit 1.9% in 2021, but it will subsequently slow to 1.5% in 2022 and 1.4% in 2021. Table 1AUpgraded Growth Forecast
Slow Ride
Slow Ride
Table 1BBelow Target Inflation
Slow Ride
Slow Ride
Bottom Line: The ECB did not taper its PEPP purchases, because of uncertainty and below-target inflation. Too Many Deflationary Risks The policy stance of the ECB is appropriate on three levels. First, the case for Eurozone inflation to be transitory is even stronger than it is in the US. Second, financial conditions could easily deteriorate if the ECB were to tighten policy too early. Finally, the Strategy Review due this fall further paralyzes the ECB for now. Transitory Inflation Headline and core CPI in the Eurozone will increase significantly in the coming months but will slow next year. The ECB’s core CPI measure, which excludes food and energy, is set to rise above the levels of the past 15 years. As the US re-opened, core CPI spiked on both yearly and monthly bases. The presence of bottlenecks across domestic and global supply chains indicates that the Euro Area will experience a similar outcome. Assuming that monthly inflation rates will settle between 0.2% and 0.25% for the remainder of 2021, by year’s end, annual inflation will stand between 2% and 2.5% (Chart 1). The European PMI indices confirm the upside for the Euro Area’s core inflation. Service inflation has been more stable than in the US, but goods inflation is rising in line with the higher manufacturing PMI (Chart 2). Services inflation will accelerate according to the services PMI. Chart 1Higher Inflation For 2021
Higher Inflation For 2021
Higher Inflation For 2021
Chart 12Accelerating Goods And Services Inflation
Accelerating Goods And Services Inflation
Accelerating Goods And Services Inflation
Surveys confirm that this summer’s re-opening will jumpstart inflation. The employment components of both the European Commission’s Retail and Services Surveys are consistent with a rapid pickup in employment (Chart 3). This will support household income and consumption. Additionally, the EC’s Consumer Survey indicates that European households are ready to increase their purchase of homes and cars compared to last year (Chart 3, bottom panel). When stronger demand meets supply bottlenecks, higher prices ensue. Already, the EC’s Retail Survey points to this outcome (Chart 4). Despite these inflationary developments, most economic forces indicate that the Eurozone’s core and headline CPI will not stay elevated for long. Chart 3Stronger Employment In Pandemic-Hit Sectors
Stronger Employment In Pandemic-Hit Sectors
Stronger Employment In Pandemic-Hit Sectors
Chart 4Re-Opening Pricing Pressures
Re-Opening Pricing Pressures
Re-Opening Pricing Pressures
Our Trimmed Mean Inflation measure for the Euro Area (which mimics the construction of the Cleveland Fed Trimmed-Mean CPI in the US) has weakened to 0.1% (Chart 5). Hence, underlying inflation trends are still muted and the recent uptick in core CPI reflects outliers, as has been the case in the US. The outlook for the components of CPI confirms that any uptick in Euro Area inflation will be temporary. Shelter inflation, which accounts for 24% of the ECB core CPI, will rise as the unemployment rate declines. However, the strength in the euro is limiting import prices, which will cap non-energy industrial goods inflation (Chart 6). Moreover, the peak in oil price annual increases points toward a rollover in transportation inflation. Together, these two categories represent almost 60% of the core CPI components. Chart 5Inflation Is Not Broad-Based
Inflation Is Not Broad-Based
Inflation Is Not Broad-Based
Chart 6Key CPI Components Will Slow
Key CPI Components Will Slow
Key CPI Components Will Slow
Labor market dynamics are also consistent with a temporary inflation spurt. Total hours worked remain 6.5% below their pre-COVID-19 summit and underneath the level congruent with full employment based on the size of the Eurozone’s working-age population (Chart 7). This model understates the slack in the labor market, because the reforms implemented in peripheral economies in the wake of last decade’s Euro Area crisis have brought down structural unemployment. Moreover, the chart shows that, after total hours worked return to their equilibrium, it still takes a few years before negotiated wages firm up. Even if labor shortages materialized earlier than we anticipate, it does not guarantee a pickup in core CPI. From 2016 to 2019, a large proportion of Euro Area businesses cited labor shortages as a key factor limiting production. Yet, despite both this perceived tightness and a trendless euro, core CPI remained flat, averaging 1% per annum (Chart 8). Chart 7Still Too Much Slack
Still Too Much Slack
Still Too Much Slack
Chart 8Labor Shortages Do Not Guarantee Inflation
Labor Shortages Do Not Guarantee Inflation
Labor Shortages Do Not Guarantee Inflation
Outside of the labor market, the amount of stimulus injections also argues against a permanent increase in European inflation. BCA’s US Bond Strategy, Global Investment Strategy, and Bank Credit Analyst services believe that the current spurt of US Inflation is temporary, despite vast monetary and fiscal stimuli. In relation to 2019 GDP, the ECB’s liquidity injections have been larger than those of the Fed; however, the US fiscal activism greatly outdid that of the Eurozone (Chart 9). Consequently, the combined monetary and fiscal impulse in the US is larger, and its greater weight toward fiscal policy makes it more inflationary. Thus, if the US is unlikely to see durable inflation, the Eurozone is even less at risk. Chart 9More Timid European Stimulus
Slow Ride
Slow Ride
Chart 10Lower European Inflation Expectations
Lower European Inflation Expectations
Lower European Inflation Expectations
Euro Area inflation expectations are also muted compared to that of the US (Chart 10). This development confirms that Eurozone policy is less inflationary than that of the US. It also creates an anchor for realized inflation, which will constrain the acceleration in the Euro Area CPI. Financial Conditions The ECB is deeply concerned about the impact of the hurried removal of monetary accommodation on the Eurozone’s financial conditions. Chart 11The Euro Is Deflationary
The Euro Is Deflationary
The Euro Is Deflationary
The ECB does not want to see a much more rapid pace of appreciation in the euro. If it begins to slow its QE program when the Fed remains reluctant to talk about tapering, EUR/USD will surge. This will feed into weaker core inflation in the region. The ECB’s broad trade-weighted euro, based on 41 currencies, has already rallied to a record high. Thus, an even more rapid euro rally would spell deeper deflationary pressures in the region (Chart 11). Peripheral spreads remain fragile. The ECB will not want to cause a rapid widening of Italian, Spanish, or Greek government bond spreads by decreasing its asset purchases prematurely. Otherwise, the health of the banking sector in the periphery will once again deteriorate, which will both harm the recovery and ignite deflationary tendencies. Strategy Review The ECB’s Strategy Review also prevents the Governing Council from adjusting policy. The ECB will release its Strategy Review in September or October. This exercise could result in a change to the inflation target. In line with the new Fed Average Inflation Target, the ECB objective may become more symmetric. Inflation has not hit the ECB’s target of nearly 2% since 2012, and the level of HICP stands 8% below what the target implies. Therefore, if the ECB adjusts its target this fall, it will become harder to justify the removal of accommodation. Bottom Line: The ECB wants to avoid a repeat of its 2011 policy mistake, when it tightened policy prematurely and catalyzed a period of profound weakness in the European economy. Eurozone inflation will increase this year; however, this bump is transitory and inflation will once again decline in 2022. Moreover, the ECB rightfully worries about tightening financial conditions, because the euro is exerting profound deflationary forces on the continent and peripheral spreads remain fragile. Finally, the ongoing Strategy Review limits what the ECB can do until its results are known. Look Out For Q4 2021 The ECB will keep the PEPP program in place until March 2022, as was originally announced. Therefore, the ECB will only telegraph its intention after the summer and will most likely announce in December its firm commitment to begin tapering. The program size does not constrain the ECB. The total envelope of the PEPP stands at EUR1850 billion, and the ECB has already purchased EUR1100 billion (Chart 12). Based on the current accelerated pace of purchases, the ECB will run out of room in February 2022. Thus, the ECB continues to enjoy great flexibility without adjusting the PEPP program meaningfully. Chart 12Plentiful PEPP Room
Plentiful PEPP Room
Plentiful PEPP Room
Chart 13China Will Act As A Drag
China Will Act As A Drag
China Will Act As A Drag
Chart 14The Global Growth Tax Is Biding
The Global Growth Tax Is Biding
The Global Growth Tax Is Biding
The expanding threat of a global growth scare will likely limit the ability of the ECB to tighten policy ahead of Q4. China’s credit impulse is decelerating, which portends an imminent peak in our BCA Global Industrial Activity Nowcast (Chart 13). Moreover, the rise in global yields since August 2020 and the rapid rally in oil prices since April 2020 are consistent with a meaningful deceleration in global manufacturing activity. The collapse in our Global Leading Economic Indicator Diffusion Index also hints at a coming global soft patch (Chart 14). Hence, the heightened sensitivity of the Euro Area economy to the global manufacturing sector points toward softer-than-anticipated growth this summer. Historically, a deceleration of the Chinese PMI New Orders components warns of a decline in the 1-year forward EONIA (Chart 15). While the ECB is unlikely to flag a rate reduction in response to the upcoming global deterioration, it could respond by delaying its tapering decision. Ultimately, the accumulation of constraints and risks suggests that, even after the PEPP taper starts in 2022, the ECB will roll it into the older PSPP program. The ECB will want to keep a lid on peripheral spreads and guarantee that the euro does not melt up. Germany is unlikely to block this initiative, because its large Target 2 surplus means that problems in the periphery will percolate to the German banking system (Chart 16). Moreover, Germany’s export sector will benefit from a euro whose appreciation is contained. Chart 15Chinese New Orders Are Inconsistent With A Tighter ECB
Chinese New Orders Are Inconsistent With A Tighter ECB
Chinese New Orders Are Inconsistent With A Tighter ECB
Chart 16Germany Does Not Want Italian Troubles
Germany Does Not Want Italian Troubles
Germany Does Not Want Italian Troubles
Bottom Line: The ECB will not formally announce its tapering until December 2021. The ECB still has considerable room to continue using the PEPP program, and the global economy is likely to generate a negative growth surprise this summer. Instead, once the PEPP taper begins in 2022, the program will be rolled into the PSPP rather than being completely discarded. European policy, therefore, will remain accommodative. Investment Implications A dovish ECB is consistent with a continued overweight in European peripheral bonds. Chart 17European Peripheral Bonds Remain Attractive
Slow Ride
Slow Ride
Portuguese, Greek, Spanish, and Italian bonds offer much more attractive valuations than the global or the European averages (Chart 17). The robust pace of ECB bond purchases, along with the increased fiscal risk-sharing created by the NGEU programs, will allow this value to continue to generate excess returns for investors. The growth scare, however, threatens our positive stance on European equities and cyclical stocks. We expect a correction to take place this summer or early fall. Thus, investors should raise cash now to buy cyclicals stocks once they correct. First, a deceleration in global growth catalyzed by a Chinese credit slowdown is consistent with an underperformance of cyclical stocks and European stocks in general. Second, the ECB Central Bank Monitor currently sports an elevated 2.1 reading, which is negative for cyclicals. A high reading for the monitor materializes when the Eurozone economy is experiencing strong momentum. However, markets are forward looking, and they rapidly internalize a brightened outlook. Once the price of cyclical stocks embed enough good news, they will start to generate poorer returns. Consequently, positive readings of the monitor are followed by negative relative excess returns for cyclical stocks, such as Industrials, Financials, Tech, and Consumer discretionary on both 6- and 12-month horizons (Table 2A). Table 2AThe Higher The ECB Monitor Rises, The More Poorly Cyclicals Perform
Slow Ride
Slow Ride
The higher the ECB Monitor reaches, the worse the cyclical sectors’ excess returns become, even if the ECB does not tighten policy. Moreover, outliers do not distort the results of the study. The batting averages confirm that, the higher the ECB Monitor, the lower the probability of a subsequent outperformance of cyclicals. The reverse is true for defensive sectors. The higher the ECB Monitor climbs, the greater the subsequent 6- and 12-month relative excess returns for Telecommunication, Consumer Staples, Utilities, and Healthcare turn out. Their probability of outperformance also increases (Table 2B). Table 2BThe Higher The ECB Monitor Rises, The More Poorly Cyclicals Perform
Slow Ride
Slow Ride
Investors should therefore curtail their exposure to risk over the coming months, tactically tilt toward some attractive defensive names and buy some hedges or raise some cash in order to participate more fully in the rest of the rally later this year. Bottom Line: An easy ECB policy favors an overweight stance in European peripheral bonds. However, if global growth slows, the current reading of our ECB Monitor is consistent with a period of underperformance for cyclical equities. Such underperformance should correlate with a corrective episode for the broad market as well as an underperformance of European stocks relative to the US. Investors, therefore, should raise cash levels and tactically move into attractive defensive names in order to buy back cyclicals later this year. Mathieu Savary, Chief European Investment Strategist Mathieu@bcaresearch.com Currency Performance
Slow Ride
Slow Ride
Fixed Income Performance Government Bonds
Slow Ride
Slow Ride
Corporate Bonds
Slow Ride
Slow Ride
Equity Performance Major Stock Indices
Slow Ride
Slow Ride
Geographic Performance
Slow Ride
Slow Ride
Sector Performance
Slow Ride
Slow Ride
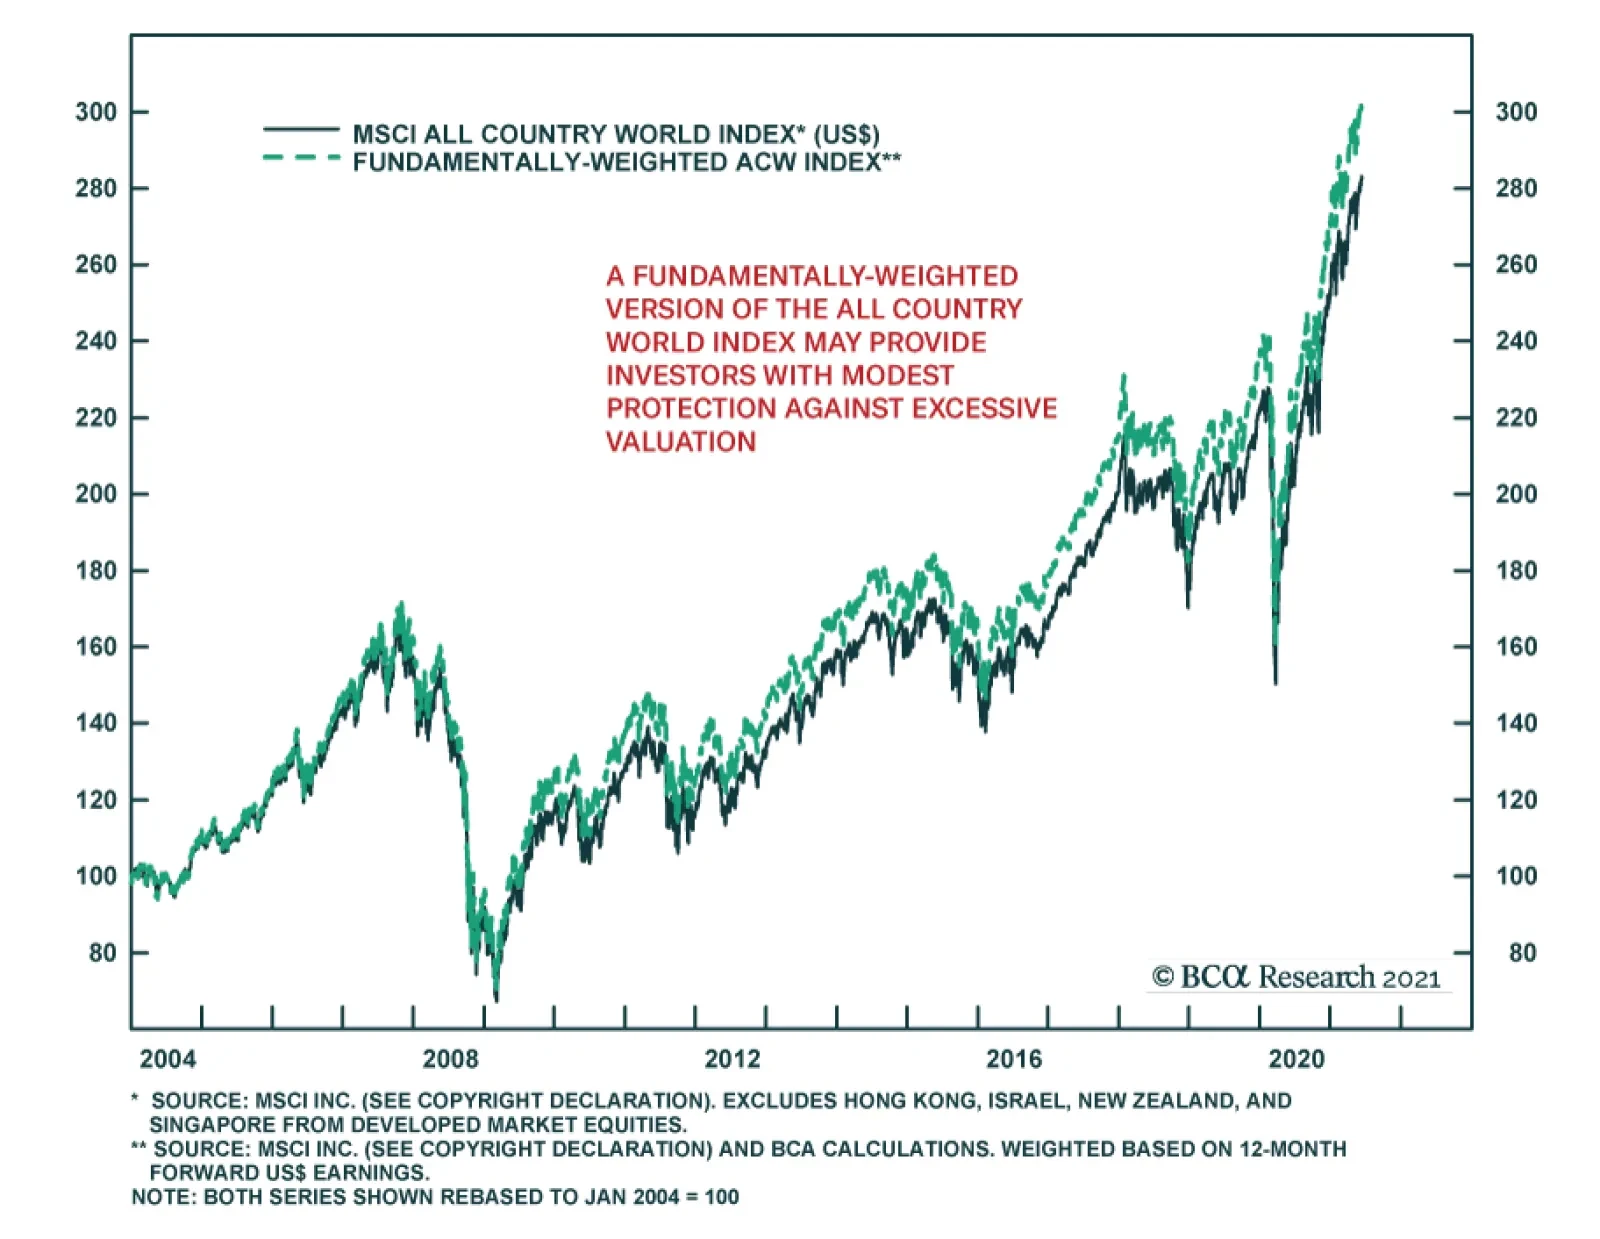
Where should you invest your money for the long term? This is a question that many investors struggle to answer in today’s environment. Low interest rates have made valuations unattractive in almost all traditional asset classes and, while valuations hold low…
According to BCA Research’s Global Investment Strategy service, the meme stock mania is unlikely to die down anytime soon. If one were so inclined, how should one trade meme stocks? A few observations stand out from an analysis of the six popular meme…
Our recent fascination with the Chinese data continues, and today we look at the real M1 money supply series. In our previous research we highlighted that the change in the 10-year US Treasury yield (UST10Y) moves in tandem with ebbs and flows of the global manufacturing cycle (Chart 1). Now that the Chinese real M1 money supply has decisively peaked, it foreshadows a deceleration phase in the global manufacturing activity (Chart 2), and by extension in the UST10Y. As a reminder, we have also recently shown how the decline in the Citigroup US economic surprise index sends a similar message, indicating that US yields are unlikely to advance meaningfully. Bottom Line: Stabilization of the US bond market will help revive some of the beaten down growth names Chart 1
Chart 1
Chart 1
Chart 2
Chart 2
Chart 2
Weekly Performance Update For the week ending Thu Jun 10, 2021 The Market Monitor displays the trailing 1-quarter performance of strategies based around the BCA Score. For each region, we construct an equal-weighted, monthly rebalanced portfolio consisting of the top 3 stocks per sector and compare it with the regional benchmark. For each portfolio, we show the weekly performance of individual holdings in the Top Contributors/Detractors table. In addition, the Top Prospects table shows the holdings that currently have the highest BCA Score within the portfolio. For more details, click the region headers below to be redirected to the full historical backtest for the strategy. BCA US Portfolio
Market Monitor (Jun 10, 2021)
Market Monitor (Jun 10, 2021)
Total Weekly Return BCA US Portfolio S&P500 TRI -0.07% 1.12% Top Contributors WES:US ET:US WAT:US KOF:US MPLX:US Weekly Return 26 bps 17 bps 16 bps 16 bps 12 bps Top Detractors LPX:US AN:US DE:US UPS:US PCH:US Weekly Return -22 bps -18 bps -15 bps -12 bps -12 bps Top Prospects ANAT:US BRK.A:US TX:US ESGR:US UHAL:US BCA Score 98.71% 98.37% 98.31% 96.17% 94.96% BCA Canada Portfolio
Market Monitor (Jun 10, 2021)
Market Monitor (Jun 10, 2021)
Total Weekly Return BCA Canada Portfolio S&P/TSX TRI 1.72% 0.59% Top Contributors TCL.A:CA DSG:CA LNF:CA PXT:CA DIR.UN:CA Weekly Return 51 bps 23 bps 17 bps 15 bps 11 bps Top Detractors CFP:CA TOY:CA QBR.A:CA ELF:CA GWO:CA Weekly Return -14 bps -10 bps -5 bps -4 bps -4 bps Top Prospects CS:CA LNF:CA IFP:CA RUS:CA CFP:CA BCA Score 99.55% 98.97% 98.96% 97.91% 97.68% BCA UK Portfolio
Market Monitor (Jun 10, 2021)
Market Monitor (Jun 10, 2021)
Total Weekly Return BCA UK Portfolio FTSE 100 TRI 0.31% 0.36% Top Contributors GLTR:GB FDEV:GB AGRO:GB SVST:GB LXI:GB Weekly Return 28 bps 19 bps 14 bps 13 bps 10 bps Top Detractors KNOS:GB POLR:GB CNE:GB AAF:GB BYG:GB Weekly Return -13 bps -11 bps -9 bps -8 bps -7 bps Top Prospects SVST:GB NLMK:GB RMG:GB GLTR:GB BPCR:GB BCA Score 99.69% 97.67% 97.63% 96.96% 94.39% BCA Eurozone Portfolio
Market Monitor (Jun 10, 2021)
Market Monitor (Jun 10, 2021)
Total Weekly Return BCA EMU Portfolio MSCI EMU TRI 1.51% 0.56% Top Contributors CNV:FR STR:AT TUB:BE MONT:BE POST:AT Weekly Return 52 bps 24 bps 18 bps 13 bps 12 bps Top Detractors ALTA:FR AOF:DE CEM:IT FSKRS:FI US:IT Weekly Return -10 bps -10 bps -5 bps -4 bps -4 bps Top Prospects POST:AT BB:FR STR:AT SOLV:BE PMAG:AT BCA Score 98.29% 98.07% 97.87% 97.75% 96.78% BCA Japan Portfolio
Market Monitor (Jun 10, 2021)
Market Monitor (Jun 10, 2021)
Total Weekly Return BCA Japan Portfolio TOPIX TRI -0.07% -0.10% Top Contributors 8117:JP 3291:JP 9532:JP 9509:JP 8922:JP Weekly Return 36 bps 13 bps 9 bps 9 bps 8 bps Top Detractors 7860:JP 8595:JP 9543:JP 8630:JP 5451:JP Weekly Return -21 bps -20 bps -18 bps -10 bps -8 bps Top Prospects 5930:JP 9543:JP 4966:JP 9436:JP 7994:JP BCA Score 99.38% 98.70% 98.40% 98.38% 98.34% BCA Hong Kong Portfolio
Image
Total Weekly Return BCA Hong Kong Portfolio Hang Seng TRI 2.12% -0.71% Top Contributors 316:HK 1919:HK 6118:HK 990:HK 1798:HK Weekly Return 84 bps 72 bps 29 bps 28 bps 26 bps Top Detractors 3600:HK 1258:HK 856:HK 86:HK 3329:HK Weekly Return -23 bps -21 bps -15 bps -12 bps -8 bps Top Prospects 990:HK 811:HK 86:HK 1606:HK 743:HK BCA Score 99.36% 98.61% 97.22% 96.97% 96.55% BCA Australia Portfolio
Market Monitor (Jun 10, 2021)
Market Monitor (Jun 10, 2021)
Total Weekly Return BCA Australia Portfolio S&P/ASX All Ord. TRI 2.14% 0.64% Top Contributors HSN:AU RUL:AU MNF:AU STX:AU PSQ:AU Weekly Return 51 bps 50 bps 28 bps 23 bps 19 bps Top Detractors BLX:AU AGI:AU EVT:AU EHE:AU CIA:AU Weekly Return -18 bps -10 bps -9 bps -6 bps -4 bps Top Prospects GRR:AU MGX:AU CIA:AU PIC:AU JLG:AU BCA Score 98.87% 98.06% 97.99% 97.29% 96.73%
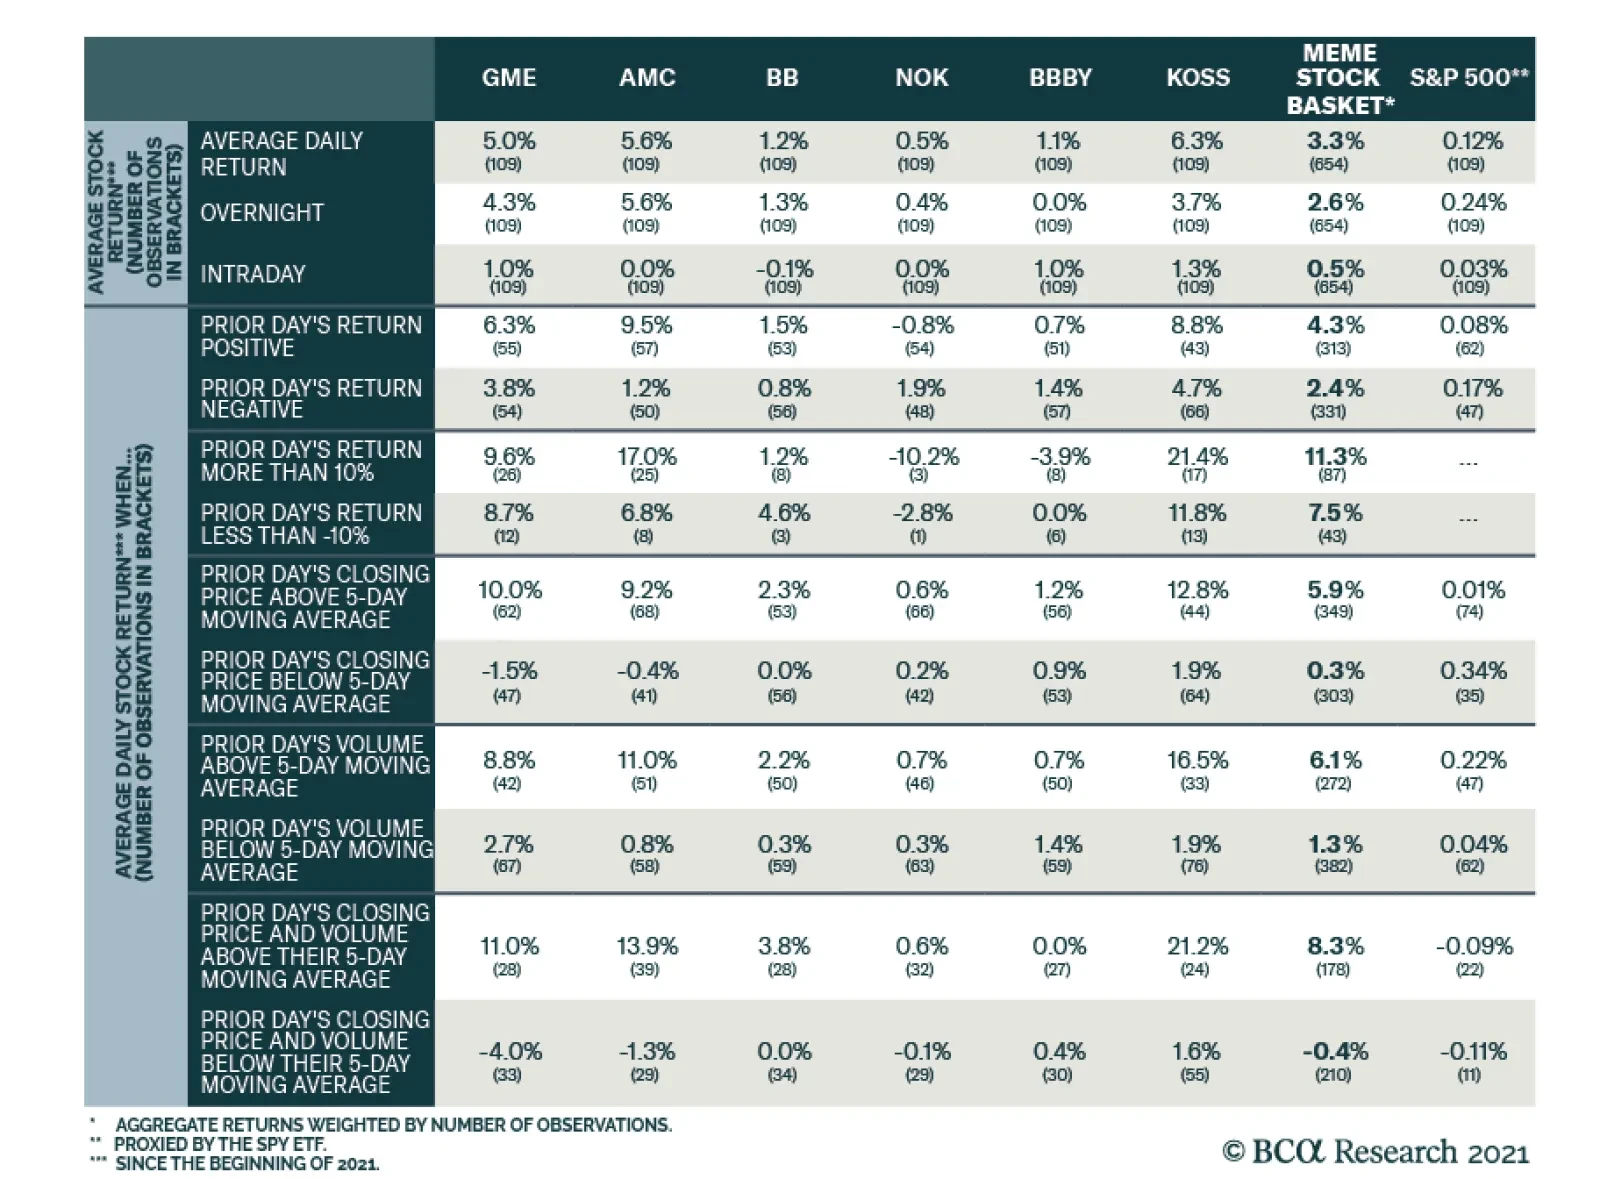
Dear Client, Last week, I had the pleasure of participating in a debate with my colleague, Dhaval Joshi, on the future of cryptocurrencies. You can access a replay of the event here. Best regards, Peter Berezin Highlights The meme stock mania is unlikely to die down anytime soon. Fueled by zero-commission trading and an anti-establishment mindset, social media has given millions of retail traders the ability to coordinate attacks on individual companies. An examination of the most popular meme stocks reveals that returns were highest when both the closing price and volume during the prior day’s session were above their moving averages. For GameStop and AMC, in particular, returns averaged 11.0% and 13.9%, respectively, when both the prior day’s closing price and volume were above their 5-day moving averages, compared with -4.0% and -1.3%, respectively, when the price and volume were below their 5-day moving averages. Nearly 80% of the returns on meme stocks were earned overnight (i.e., between the close of trading and the following day’s open). The ups and downs of meme stocks have generally had little impact on the overall direction of the stock market. Nevertheless, growing interest in meme stocks is positive for equities over a medium-term horizon of about 12 months. This is because the meme stock phenomenon is drawing funds into the stock market, boosting prices and liquidity in the process. #HedgiesGetWedgies Chart 1Word Du Jour: Meme
Word Du Jour: Meme
Word Du Jour: Meme
This January, the term “meme stock” entered the popular lexicon (Chart 1). That was the month that GameStop and a handful of other once-left-for-dead stocks soared to dizzying heights. Armed with stimulus checks, millions of amateur investors flocked to one of the few sources of entertainment still available to them: online trading. Tales of instant riches spread like wildfire, motivating yet more new investors to enter the fray. Whether it was stocks or cryptos, the allure of easy money was irresistible. The decision by most American brokerages to eliminate trading commissions in the fall of 2019 added fuel to the fire. Meanwhile, the proliferation of social media provided a ready-made mechanism for retail traders to coordinate attacks on individual stocks. And attack they did. Most of the companies targeted had high short interest, making them ripe for a short squeeze. The implosion of Melvin Capital demonstrated to the Reddit crowd that they, too, could beat hedge funds at their own game. “We can remain stupid longer than you can stay solvent” became their rallying cry. In a game of chicken, being perceived by your opponent as irrational boosts your odds of winning. Trading Meme Stocks For Fun And Profit If one were so inclined, how should one trade meme stocks? It helps to begin with some data. Table 1 displays average daily returns from the start of 2021 for six popular meme stocks: GameStop (GME), AMC Entertainment (AMC), Blackberry (BB), Nokia (NOK), Bed Bath & Beyond (BBBY) and Koss Corp (KOSS). A few observations stand out: There is strong price momentum. Looking across all six stocks, the average daily return was 5.9% when the prior day’s closing price was above its 5-day moving average, compared to 0.3% when the prior day’s close was below its 5-day moving average. The average daily return for stocks in our sample was 3.3%. Volatility predicts higher returns. Meme stocks gained 4.3%, on average, when the prior day’s return was positive compared to 2.4% when it was negative. Looking only at the subset of cases where the prior day’s return was either above 10% or below -10%, we find that meme stocks gained 11.3% when the price rose more than 10% during the prior day and gained a still-robust 7.5% when the price dropped more than 10% during the prior day. Strong volume predicts higher returns. Consistent with the volatility observation, meme stocks gained an average of 6.1% when the volume in the prior day’s trading session was above its 5-day moving average, compared to just 1.3% when the volume was below its 5-day moving average. Meme stocks do best after the close of trading. Nearly 80% of returns on meme stocks were earned overnight (i.e., between the close of trading and the following day’s open). We attribute this phenomenon to the tendency of many traders to exit positions before the closing bell and reopen them at the start of trading the following day. Such a pattern of selling and repurchasing tends to boost overnight returns. Historically, a similar pattern has held for most other US stocks (Chart 2). Table 1Meme Stock: Returns And Patterns
To The Moon: How To Trade Meme Stocks
To The Moon: How To Trade Meme Stocks
Chart 2Bear By Day, Bull By Night
To The Moon: How To Trade Meme Stocks
To The Moon: How To Trade Meme Stocks
In summary, meme stocks perform best when they are trading above their 5-day moving average. Both volatility and strong volume predict positive returns. Holding (hodling?)1 meme stocks overnight can significantly enhance returns. Be An Ape Chart 3The BUZZ ETF Is Off To A Lackluster Start
The BUZZ ETF Is Off To A Lackluster Start
The BUZZ ETF Is Off To A Lackluster Start
Fans of AMC often refer to themselves as “apes.” The moniker is fitting, if not ironic, given the tendency of meme investors to ape one another in their trading decisions. The VanEck Vectors Social Sentiment ETF (BUZZ) tries to get in front of the apes and other meme investors by buying stocks that are garnering increasing attention from social media, news articles, blog posts, and other sources. While it is too early to assess the value of this approach, it should be noted that the fund has lagged the S&P 500 for most of the time since its inception in March (Chart 3). A potentially more fruitful approach, and one that I myself have adopted, is to seek out meme stocks before they become meme stocks. For example, Cinemark (CNK) is the second biggest publicly-listed movie theater chain in the US. The share of its float sold short is almost identical to AMC’s. Yet, the Reddit crowd has largely ignored it. Could that change? Only time will tell. Don’t Get A Wedgie: How To Short Meme Stocks Safely While meme stocks can benefit from positive price momentum in the short term, it is at the expense of lower returns down the road. By any reasonable measure, the leading meme stocks are grossly overvalued. Knowing when a meme stock will fall back to earth is no easy task, however. The discussion in this report provides one avenue for short-term traders to mitigate risk: Short meme stocks only when price and volume are trending lower. The average daily return for GME and AMC was 11.0% and 13.9%, respectively, when both the prior day’s closing price and volume were above their 5-day moving averages, compared with -4.0% and -1.3%, respectively, when the price and volume were below their 5-day moving averages. With that in mind, we are opening a new tactical trade going short an equally-weighted basket of AMC and GME. The trade will only be active when the prior day’s closing price and volume are below their 5-day moving averages.2 Longer-term investors looking to short meme stocks without having to frequently open and close positions should consider using the “exponential” shorting technique discussed in a recent report. The technique flips the usual risk-reward trade-off from going short on its head. Rather than facing unlimited losses and a maximum gain of only 100% of the initial position, our shorting strategy caps the loss at 100% but allows for unlimited gains. Broad Market Implications As Chart 4 illustrates, the ups and downs of meme stocks have generally had little impact on the overall direction of the stock market. Nevertheless, growing interest in meme stocks is positive for equities over a medium-term horizon of about 12 months. This is because the meme stock phenomenon is drawing funds into the stock market, boosting prices and liquidity in the process. Chart 4Meme Stock Roller-Coaster: Little Impact On The Broader Market
Meme Stock Roller-Coaster: Little Impact On The Broader Market
Meme Stock Roller-Coaster: Little Impact On The Broader Market
Chart 5Global Equity Risk Premium Remains Quite High
Global Equity Risk Premium Remains Quite High
Global Equity Risk Premium Remains Quite High
While the “stimmy” checks have already been deposited into brokerage accounts, their impact on the stock market will linger on. As we explained in Savings Gluts, Asset Shortages, And The 60/40 Split, retail investors who bid up the price of stocks will generally force institutional investors to sell their holdings.3 This will leave institutions with excess cash on hand – cash that they can deploy in other parts of the stock market. The resulting game of “hot potato” will only end when the value of the stock market rises by enough to ensure that all investors are happy with how much stock they own in relation to how much cash they hold. Given that the equity risk premium remains quite high, this dynamic likely has further to run (Chart 5). Disclosure: At the time of writing, I am personally long CNK and short AMC and GME. I previously held a short position in KOSS. Peter Berezin Chief Global Strategist pberezin@bcaresearch.com Footnotes 1 HODL stands for “Hold On for Dear Life”. The term is widely used by traders on Wallstreetbets and other online forums. 2 The equal-weighted trade should be initiated if the conditions are met for either stock (GME, AMC) in the basket. The conditions are as follows: Both the price and volume should be below their 5-day moving average. The price and volume at the end of the day determine whether one enters the trade the next day or not. 3 An exception is when retail investors buy stock from the company itself, as has happened several times with meme stocks. Global Investment Strategy View Matrix
To The Moon: How To Trade Meme Stocks
To The Moon: How To Trade Meme Stocks
Special Trade Recommendations
To The Moon: How To Trade Meme Stocks
To The Moon: How To Trade Meme Stocks
Current MacroQuant Model Scores
To The Moon: How To Trade Meme Stocks
To The Moon: How To Trade Meme Stocks