Equities

Dear Client, I am delighted to take charge of the US Equity Strategy publication upon Anastasios Avgeriou’s departure. By way of introduction, I have been an investor for nearly 20 years, with my career spanning both the buy and sell side, bottom-up stock selection and top-down asset allocation, and fundamental and quantitative approaches to investing. I have invested through two business cycles (starting on the third one now), watched the internet stock bubble burst, and seen grown men shedding tears on Bloomberg keyboards in the summer of 2008 – the market has a way of humbling us, mere mortals. As a result of these diverse professional experiences, I became an agnostic and don’t believe there is one correct way to invest as long as a thesis is well thought through and backed up by numbers and in-depth analysis. I believe that different approaches to investing, fundamental and quant, bottom up and top down, should complement each other leading to “best of all worlds” results. I also rely on an investment framework which is disciplined enough to offer a structure to fall back on to minimize behavioral biases, and yet is flexible to rapidly accommodate both “black swan” and “grey rhino” themes into investment decision-making. The following are the guiding principles of this investment framework. I hope this week’s publication will provide insights into my approach to investing and the nature of the US Equity Strategy product under my stewardship. I look forward to your feedback and suggestions. Kind Regards, Irene Tunkel Chief Strategist, US Equity Strategy Principle 1: The Business Cycle Matters The business cycle and macroeconomic conditions are the cornerstones of any investment decision as they underpin the fundamentals of most assets, and preordain the types of assets likely to outperform based on their level of risk and sensitivity to economic growth. Analyzing the stages of the business cycle is a succinct way to summarize a wide range of economic data, such as capacity utilization, growth, policy, credit conditions and valuation. Each business cycle is different, yet on average across all cycles, the stages have the following characteristics (Table 1). Table 1Business Cycle Is In Expansion Stage
Eight Principles Of Successful Equity Investing
Eight Principles Of Successful Equity Investing
Recovery: Policy is easy, and liquidity is plentiful, profits rebound but growth is scarce, inflation is low, risk aversion elevated, and stocks are still cheap. In this environment cyclicals, small caps and value outperform. Expansion: Policy is neutral, inflation is moderate, growth is abundant, risk aversion is low. During this phase it is cyclicals and small caps that shine. Slowdown: Inflation is higher, and policy is tightened, growth is rolling over, valuations are extended, and risk aversion is rising. In this environment of slowing growth, growth stocks, large caps, defensives and real assets outperform (Chart 1). Contraction: Deflation (or fears thereof) ensues, output is falling, growth is scarce and risk aversion is high. In this environment defensives, quality and highly profitable stocks rule the day. Chart 1Performance Of Equities In Different Stages Of Business Cycle
Eight Principles Of Successful Equity Investing
Eight Principles Of Successful Equity Investing
Although the pandemic is barely over, the markets have galloped through the recovery stage and have landed squarely in expansion territory. US equities exhibited exceptional earnings growth of 52.5% year-on-year in Q1-2021 on the back of economic reopening, fiscal and monetary stimulus, and pent-up demand. Monetary and fiscal policy remain easy. The only deviation from a textbook description of expansion is low capacity utilization and a high unemployment rate which persist as aftereffects of factors specific to the pandemic: School closures and elevated unemployment benefits. High unemployment whilst demand for labor is high triggered inflationary pressures. However, we believe that we are near the end of the expansion stage and are about to transition into a moderate slowdown. While growth is to remain robust, it is bound to slow modestly from its peak: The Manufacturing ISM PMI came down from 64.7 in April to 61.2 in June. According to Bloomberg consensus estimates GDP growth is to slow from 6.4% in 2021 to 4% in 2022. The Fed is starting to “talk about talking about tightening”, and with inflation elevated many expect somewhat hawkish rhetoric/intervention from the Fed sooner than the end of 2022. Valuations are rich. Now may be opportune time to reposition for a slowdown to be ahead of the game. To do well in a slowdown stage, which may last for months but by no means heralds the end of a bull market in equities, we recommend dusting off growth, large-cap and defensive stocks and taking profits in some of the recent cyclical outperformers. A barbell approach may do well at this point, with portfolio overweights in both cyclical sectors such as energy and industrials along with more defensive plays such as health care and technology Principle 2: Shocks And Transient Themes Trump Both Macro And Fundamentals Macro is important on the cyclical time horizon but, intra-cycle, it is transient themes and macro shocks that move markets. These themes, also known as “black swans” and “grey rhinos”, are exogenous shocks and developments that dominate investor psyche. Mostly, they are policy driven, like trade war or fiscal stimulus, but occasionally are force majeure events, like Covid-19. Transient themes may have a positive or negative effect on the market. These are news and developments that are not immediately priced by the market but are not to be ignored or dismissed: They dominate investment outcomes irrespective of the normal market order of things. Usually transient themes are short-lived and fade once macroeconomic and fundamental data have readjusted to the new reality: Economic and earnings growth estimates have been revised, and relevant stock and sector returns have absorbed the shock. Back in March 2020, neither fundamentals nor valuations mattered. Nor did macro. Stocks were first sledgehammered by a “corona” theme, and then soared on a “liquidity is abundant” theme. It took analysts three months to downgrade US GDP growth to contraction (Chart 2)! Over the past few months, the only theme that seemed to matter to market participants was inflation, and inflation alone. Implications? Fear of inflation and sooner-than-expected Fed tightening have triggered an energetic selloff in bonds and defensive/growth equities. However, there are early signs that this theme is beginning to fade with rates stabilizing and growth stocks rebounding (Chart 3). Chart 2Markets Take Time To Price In Shocks
Markets Take Time To Price In Shocks
Markets Take Time To Price In Shocks
Chart 3Inflation Fears Triggered Equity Rotation
Inflation Fears Triggered Equity Rotation
Inflation Fears Triggered Equity Rotation
Principle 3: Interplay Between Valuations And Fundamentals Once the macro backdrop and transient themes are well understood, we zoom in our analysis to the valuations and fundamentals of individual styles and sectors to select the most attractive opportunities. Ideally, we are looking for the reasonably priced sectors that have solid fundamentals and can deliver strong growth. Finding sectors like that is easier said than done: Rarely do good and cheap exist in the same incarnation. Hence, investors need to compromise: Buy cheap stocks with poor earnings growth and challenged fundamentals or pay a premium for solid growth. A classic value/growth dilemma. Our approach is as follows: Cheap Sectors: Relative valuations are very important: Most value investments are mean-reversion plays (Chart 4) We don’t attach much weight to fundamentals – we don’t expect a stellar balance sheet or earnings growth In order to screen out value traps, we are looking for a catalyst for mean reversion For cheap stocks valuations are more important than fundamentals. Expensive Sectors: Relative valuations are much less important than growth expectations and fundamentals. Are fundamentals continuing to improve or have they reached a peak? Is earnings growth about to accelerate or slow? If fundamentals, e.g. RoE or margins are improving, and a slowdown in growth is not expected, then the valuation premium is justified. Chart 4Value Is Mean Reverting
Eight Principles Of Successful Equity Investing
Eight Principles Of Successful Equity Investing
The software industry group is a case in point. Back in 2019-2020 valuations were eyewatering (more than two standard deviations above 10 years of history) but earnings growth was resilient, and profitability was in a multi-year upward trend. The valuation premium was justified. But late in 2020 RoE started deteriorating, and the industry group experienced a pullback. More recently, RoE has stabilized and turned. Returns are following (Chart 5). Chart 5Changes In Profitability Drive Valuations
Changes In Profitability Drive Valuations
Changes In Profitability Drive Valuations
Principle 4: Stock Markets Are Markets Of Stocks Understanding the behavior of individual stocks makes top-down sector and style selection much more informed and nuanced. After all, we are dealing not just with a stock market, but with a market of stocks. Those glued to Bloomberg screens in March 2020 may have noticed a rare green with companies like Zoom, Citrix and Amazon rallying amidst stock Armageddon. These were green shoots (no pun intended) of one the most vigorous stock market rallies in history. Paying attention to stock-level data also gave an early pointer that pandemic shutdowns, as awful as they were, would be a boon for selected technology and e-commerce sectors (Chart 6). At present, we notice that cyclicals have not outperformed defensives since March. We also notice over the past two-to-three weeks the comeback of hot technology stocks, many of which are former “Covid-19 winners”, beaten up by a “back-to-work rally”. These are fintech and e-commerce names such as PayPal, Pinterest and Peloton, some of which are more than 50% off from their February peak. Reversal in performance of growth stocks is a sign that rates have stabilized, inflation fears are overdone, and US economic growth is gradually slowing. Chart 6Covid-19 Winners Led S&P 500 Rebound
Covid-19 Winners Led S&P 500 Rebound
Covid-19 Winners Led S&P 500 Rebound
Principle 5: Markets Are Forward Looking As Warren Buffet succinctly put it “buy risky assets when there is blood in the streets”, and “be fearful [i.e., sell], when others are greedy.” In other words, it is important to anticipate turning points, and be one step ahead of the market. Last year’s rally is a case in point, with the S&P 500 delivering the best return in history despite not having much to show for it in terms of earnings growth, with nearly 70% of S&P 500 returns coming from multiple expansion. Investors looked past shutdowns, rightly believing that the profit recession is transitory, companies are in sound financial health, valuations are at abysmal, once-in-a-lifetime, levels, and the V-shaped recovery will ensue once the pandemic is over (Chart 7). Chart 7Stocks Returns Lead Earnings
Stocks Returns Lead Earnings
Stocks Returns Lead Earnings
Conversely, the Q1-2021 earnings season was stellar, but many stocks, even those which exceeded expectations, have ceded gains: Stocks are priced to perfection, and investors concluded that, for some of them, the best days are behind, and growth is slowing (Chart 8). At present, trailing valuations of nearly all sectors and styles in the S&P 500 are at extreme levels, trading at 36x trailing earnings. However, forward PEs are on average 9 points lower, around 21x forward earnings. Hope is that the stock market will rerate and grow into its big shoes within the next 12 months with expected EPS growth of 23%. We think it will! Chart 8During Q1-2021 Earning Season, Beats Were Not Rewarded
During Q1-2021 Earning Season, Beats Were Not Rewarded
During Q1-2021 Earning Season, Beats Were Not Rewarded
Principle 6: Asset Prices Respond To The “Second Derivative” This principle is a corollary to “markets are forward looking”. Usually the rate of growth is already priced in, as markets are efficient and new information arrives as a change in expected growth, i.e. the impulse. Change in the growth outlook is absorbed by the markets and is a leading indicator of turning points in equity returns. Most often the impulse relates to change in economic or earnings growth expectations. For example, sales for the hotels industry group are still falling, but at a lower rate than before (the second derivative is improving). These “less bad” numbers are enough to send hotels returns soaring (Chart 9). Chart 9Hotels Are Rallying On “Less Bad” Sales
Hotels Are Rallying On “Less Bad” Sales
Hotels Are Rallying On “Less Bad” Sales
Principle 7: Thematic Investing: Channeling Cathie Woods Thematic investing is really “smart” momentum investing, but its appeal lies in being able to identify a theme/catalyst that unites stocks and makes them move in unison. Knowing a theme behind momentum helps one to understand its thematic drivers and anticipate turning points. Arguably, thematic investing is a nuisance for stock pickers, but a boon for top-down investors: Identifying a theme has a higher impact on portfolio returns than choosing the individual stocks to represent it. For example, identifying recovery in air travel and investing into the Jets ETF is a more important decision than choosing the right airline stock. Since February 2020, American Airlines is 94% and Delta is 98% correlated with Jets ETF (Chart 10). Knowing the drivers, we can brainstorm what can trigger a reversal of this theme, for example: An increase in the price of oil, a structural shift in business travel, falling consumer confidence, and a high household dissaving rate. Thematic investing is popular as it allows an investor to ride the momentum yet also be equipped to anticipate turning points. Chart 10Air Travel Stocks Are Highly Correlated
Air Travel Stocks Are Highly Correlated
Air Travel Stocks Are Highly Correlated
Thematic investing may be over a variety of investment horizons (stocks benefitting from retirement of baby boomers being an example of a structural theme versus stocks benefitting from post-corona supply-chain disruption being (hopefully) a short-lived theme). Further, themes can be high tech, such as autonomous driving or green energy, and low tech, such as the pandemic “puppy boom”. The most prominent and widely discussed themes in the recent months are “Covid-19 winners” vs “back to work”. Arguably, thematic investing is the “passive investing” of the future – a trend illustrated by the popularity of the ARK funds managed by Cathie Woods. Going forward, the US Equity service will be covering investment themes in a series of Special Reports. Principle 8: “No Country Is An Island” Lastly, while the focus of this publication is squarely on the US equity market, it is important to keep an eye on developments in the rest of the world. Companies in the S&P 500 derive 43% of sales from abroad. As a result, corporate earnings are highly sensitive to the direction of the trade-weighted dollar both due to the price of goods and to translation effects. Recent depreciation of the dollar will boost corporate earnings growth, especially for the technology (58% of earnings outside the US), materials (56%) and energy (50%) sectors. It takes roughly three to six months to fully absorb dollar moves into sales growth (Chart 11). Further, the economic growth rates of the major US trading partners, i.e., Europe, Mexico, Canada, and China, also have a profound effect on the US economy with transmission through the US trade balance, dollar movements and Treasury yields (Chart 12). Chart 11US Dollar Drives S&P 500 Sales
US Dollar Drives S&P 500 Sales
US Dollar Drives S&P 500 Sales
Chart 12Major US Trading Partners Affect US Economy
Major US Trading Partners Affect US Economy
Major US Trading Partners Affect US Economy
Bottom Line Markets are complex: Macro works until it does not, expensive stocks can be a good investment, and an equity rally may take off in the midst of an earnings recession. Yet, we believe that the eight principles of investing that we have outlined above will guide us through the noise and help successfully navigate equity markets. Irene Tunkel Chief Strategist, US Equity Strategy irene.tunkel@bcaresearch.com
The 10-year US Treasury yield has been range bound between 1.5% and 1.7% for the past three months despite fireworks in the US economic data, from CPI readings to unemployment beats. The fact that the bond market has refused to budge no matter how positive US data got, confirms our view that all the good news has already been priced in. Citigroup US economic surprise index (CESI) is hovering around zero, which corroborates the same message. Given a tight positive correlation (0.44) between CESI and UST10Y, and the fact that growth is peaking, it is unlikely that the bond market will enter another aggressive sell-off phase (see chart). The implication for equities is that long-duration growth equities, beaten down by rising yields, may stage a come back, especially once inflation data makes a clear ∩-turn on a year-over-year basis. Bottom Line: Bond market is likely to remain calm over the next three to six months, and it’s time to revisit beaten down growth names. Stay tuned for future research on the topic.
Time to Revisit Growth Names
Time to Revisit Growth Names
Highlights The Norwegian economy will continue to grow above trend for the next two years or so. Norwegian inflation will firm up. Among Advanced Economies, the Norges Bank will lead the way in terms of policy tightening; however, money markets already embed this view. Nonetheless, the Norwegian krone remains an appealing value play, a result of its pronounced pro-cyclicality. USD/NOK and EUR/NOK will depreciate over the next 24 months. Norwegian equities face structural headwinds, but they should outperform their US and Euro Area counterparts. However, Norwegian stocks will lag behind Swedish equities. Buy Norwegian stocks / sell Dutch ones. Feature Norway remains an example of how to handle the pandemic successfully. Since the onset of the COVID-19 crisis, Norway has registered the lowest rate of infections per capita, in part aided by its early decision to close its borders. Fiscal stimulus was prompt and finely tailored to the sectors most in need of emergency funds. Moreover, the Norges Bank cut interest rates to zero for the first time since its founding in 1816. As nations across the world coordinated monetary and fiscal accommodation during the pandemic, Nordic economies had already mastered this paradigm. Thus, counter-cyclical buffers worked like a charm in Norway. For example, the contraction in Norwegian GDP was the most subdued within the G10, and the recovery is also impressive. Today, Norwegian GDP is 2% above pre-pandemic levels, inflation is near the target rate of 2%, and the central bank will be among the first to lift interest rates. In this Special Report, we explore whether or not conditions remain ripe for strong performances by both Norwegian equities and the NOK. In our view, the global environment and the continued economic strength of Norway will create potent tailwind for Norwegian assets over the coming two years or so. A Robust Economic Outlook The Norwegian economy is set to continue growing at a robust above-trend pace and inflation will remain above the Norges Bank’s target. The Pandemic Norway has moved largely beyond the COVID-19 pandemic. The number of cases per 100 is a mere 2, which compares favorably to the US at 10, Germany at 4, France at 8, or its neighbor Sweden at 10. Norway closed its borders on March 12, 2020, to limit the entry of the virus on its territory, as health authorities opted for rapid containment measures. As a direct result of these policies, Norwegian consumers and workers gained greater peace of mind in their day-to-day dealings, and economic activity recovered rapidly. This process led to Norway’s GDP contracting by only 4.6% in Q2 2020, which compares favorably to contractions of 19.5% in the UK, 9.7% in Germany and 7.8% in Sweden. Norway’s vaccination campaign is also gaining momentum. At first, the country’s inoculation performance lagged. However, Norwegian procurement of vaccines has improved, and the pace of inoculation is accelerating (Chart 1, top panel). The result is that the share of the population that is fully vaccinated is inching toward 20% and accelerating. Authorities expect greater relaxation of containment measures this summer, which will allow mobility to improve (Chart 2). The local service sector will therefore receive a welcome fillip. Chart 1Norway's Vaccination Progress
Norway's Vaccination Progress
Norway's Vaccination Progress
Chart 2Mobility Will Pick Up
Mobility Will Pick Up
Mobility Will Pick Up
Fiscal Policy Fiscal policy remains an important complement to national health directives. During the crisis, the fiscal deficit reached 3.4% of GDP, which generated a fiscal thrust of 6% of GDP. Moreover, the drawdown from the Norwegian Oil Fund amounted to 12.5% of GDP. These provided targeted supports to industries, such as tourism and transport, while a furlough scheme protected household income. Thus, these programs effectively alleviated the pain on the sectors of the economy most affected by the pandemic. Going forward, Norway will also suffer from one of the smallest fiscal drag in the G10 for the remainder of 2021 and 2022 (Chart 3). Chart 3Norway's Advantageous Fiscal Backdrop
Norway's Advantageous Fiscal Backdrop
Norway's Advantageous Fiscal Backdrop
The Banking System The credit channel in Norway remains open and fluid, as a resilient banking system withstood the economic fallout from the pandemic. According to the Norges Bank, credit losses have been limited; they peaked at 1% of lending and are already declining. Additionally, banks have restricted exposure to the sectors hardest hit by the pandemic, such as travel and tourism, personal services, and transport (Chart 4). Moreover, the profitability of the banking system decreased, as global yields fell last year, but RoE remains around 10% and net interest margins hover near 2.5% and 1.5% for non-financial corporate loans and households lending, respectively. Crucially, the Norwegian banking system sports a regulatory Tier-1 capital-to-risk weighted-assets ratio of 20%, well above Basel III criteria or that of the Eurozone banks (Chart 4, bottom panel). Chart 4Norwegian Banks Are Faring Well
The Norwegian Method
The Norwegian Method
Household Consumption Household consumption will remain a source of strength over the coming quarters. Household net worth is growing robustly as a result of the rapid appreciation of house prices across the country (Chart 5, top panel). Moreover, the share of debt held by households with a high debt-to-income ratio or a low debt-servicing capacity remains low, which suggests household balance sheets are firming (Chart 5, middle panel). Employment is also recovering well. After peaking at 9.5% in March 2020, the headline unemployment rate fell to 3.3% last month (Chart 5, bottom panel). Meanwhile, the number of employed workers bottomed in July 2020 and has been steadily recovering ever since. The only blemish is that, as of Q4 2020, the rate of underemployment among the prime-age population remains at 3.5%, which is somewhat elevated by national standards. This balance sheet and employment backdrop confirms the Norges Bank’s projection: the household savings rate will decline significantly over the coming two years (Chart 6, top panel). Hence, the marked pick-up in consumer confidence should translate into a major recovery in real consumption growth (Chart 6, bottom panel). Nonetheless, the service sector will likely be the main beneficiary of this improvement, as real retail sales are already well above their historical trend Chart 5Positive Household Fundamentals
Positive Household Fundamentals
Positive Household Fundamentals
Chart 6Consumption Will Improve Further
Consumption Will Improve Further
Consumption Will Improve Further
Net Exports Chart 7Years Of Underinvestment In Oil & Gas
The Norwegian Method
The Norwegian Method
The external sector will create another tailwind for the Norwegian economy. Prior to the pandemic, 71% of Norway’s exports flowed to Europe. Moreover, oil and gas represented 53% of shipments, and cyclically sensitive exports amounted to 74% of total or 24% of GDP. Thus, even if China’s economy slows, Europe’s economic re-opening will raise the Norwegian trade balance, which sits near a multi-decade low.1 Moreover, greater mobility in Europe and around the world will elevate demand for petroleum. In light of the tepid pace of investment in global oil and gas extraction over the past five years, our commodity strategists forecast further oil and gas price appreciation2 (Chart 7), which will boost Norway’s terms of trade. The national income will therefore expand smartly, especially because oil and gas shipments will increase thanks to growing production from the new Johan Sverdrup field. Capital Spending This context suggests that capital spending, which accounts for 26% of Norway’s output (Chart 8), will constitute an important tailwind to domestic activity. Capex is even more important to the Norwegian economy than it is for other Nordic economies or even Germany (Chart 9). Chart 8Capital Spending Is Important For Norway
Capital Spending Is Important For Norway
Capital Spending Is Important For Norway
Chart 9The Capex Share Of GDP Is Higher In Norway
The Capex Share Of GDP Is Higher In Norway
The Capex Share Of GDP Is Higher In Norway
Norwegian capex is highly cyclical. Capital formation tracks our BCA Global Nowcast indicator (a combination of high-frequency economic and financial variables that proxy the global industrial cycle), as well as the domestic manufacturing PMI. These indicators suggest that capex should increase by 10-15% in the coming quarters (Chart 10). A Norges Bank survey of capex intentions, which are firming, corroborates this view. Chart 10Capex Will Recover Strongly Capex Will Recover
Capex Will Recover Strongly Capex Will Recover
Capex Will Recover Strongly Capex Will Recover
On the energy front, the new Johan Sverdrup oil and gas discovery marks a major turnaround in capital spending for Norway. According to the Norges Bank, real petroleum investment will increase from approximately NOK 175bn in 2021 to NOK 198bn by 2024 (Chart 11). Moreover, years of global underinvestment in oil extraction suggests Norway will gain market share in exports as production accelerates. Total petroleum production is slated to increase by 10% over the next 4 years. More importantly, by 2025, over 50% of production from Norwegian oil fields will be natural gas and associated liquids (Chart 12). Demand for natural gas and NGLs will be more inelastic than demand for crude because the latter is threatened by the rising electrification of vehicles, while the former faces more sustainable demand as China, among others, moves to replace its coal polluting plants with cleaner alternatives. Chart 11Real Petroleum Investment Will Increase By 13% In 2024
The Norwegian Method
The Norwegian Method
Chart 12Gas Production Is Rising In Importance
The Norwegian Method
The Norwegian Method
Inflation This positive economic outlook suggests that Norwegian inflation will remain above the central bank’s target of 2%. Already, headline CPI stands at 3%. Meanwhile, core inflation is at 2%, but it is decelerating. However, this slowdown should be temporary. According to a Norges Bank survey, both long-term and near-term inflation expectations among economists, business leaders, and households are rising, which indicates that a deflationary mentality has not taken root in Norway. Moreover, wage expectations have quickly normalized following the trauma of 2020 (Chart 13). Capacity constraints further reinforce the notion that inflation has upside. The Norges Bank Regional Network survey shows that capacity and labor supply constraints are tighter than they were in the 2014 to 2017 period, when inflation averaged 2.3% and the policy rate fell to 0.5% (Chart 14). Moreover, according to the same survey, selling prices are also stronger than they were during the 2016 oil collapse (Chart 14, bottom panel) Chart 13No Signs Of A Deflation Mentality
No Signs Of A Deflation Mentality
No Signs Of A Deflation Mentality
Chart 14Capacity Doesn’t Point To Falling Inflation
The Norwegian Method
The Norwegian Method
Bottom Line: The Norwegian economy will continue to grow above its trend rate of 1.5%, at least through to 2022. The acceleration in vaccination numbers will allow a reopening of the economy, while the fiscal drag will be limited and the banking system remains resilient. The outlook for households remains positive and employment is firming, which will lead to stronger consumption. Meanwhile, exports and capex have significant upside ahead. As a result, we anticipate Norwegian inflation will remain above target for the foreseeable future. The Norges Bank Will Lead The Pack The Norges Bank’s response to the pandemic was swift and all encompassing: It cut interest rates in the spring of 2020 from 1.5% to zero, the lowest level since the formation of the bank in 1816. It set up extraordinary F-loans at very generous interest rates, to provide ample liquidity to commercial banks. The longest maturity loan of 12 months had a prevailing interest rate of just 30 basis points. It also relaxed collateral requirements for these loans. It introduced swap lines with the Federal Reserve to provide US dollar funding to Norwegian firms. Since then, our Norges Bank monitor has rebounded powerfully from very depressed levels, which suggests that emergency policy settings have become unnecessary. Moreover, the Norwegian Central Bank Monitor towers above that of other G10 countries, which indicates that the Norges Bank should lead the pack in normalizing policy rates (Chart 15). Chart 15The Norges Bank Should Lead The Tightening Cycle
The Norges Bank Should Lead The Tightening Cycle
The Norges Bank Should Lead The Tightening Cycle
Chart 16The Growth Component Of Our Monitor Has Exploded Higher
The Growth Component Of Our Monitor Has Exploded Higher The Growth Component Of Our Monitor Has Exploded Higher
The Growth Component Of Our Monitor Has Exploded Higher The Growth Component Of Our Monitor Has Exploded Higher
The biggest improvement in our Norges Bank Monitor comes from its growth component, which has surged to its highest levels in over two decades. This improvement surpasses those that followed the global financial crisis and the burst of the dot-com bubble (Chart 16). In essence, the growth component of the Monitor signals that the Norwegian economy has achieved escape velocity. Norway’s robust economic turnover is increasing the velocity of money, which points to the need for higher interest rates. Money velocity can be regarded as the equilibrating mechanism between money supply and nominal output, from the classical Fisher equation MV=PQ (where M is the money supply, P is prices, Q is real output, and V is money velocity). Thus, rising money velocity (when PQ expands faster than M) signifies that the economy needs higher interest rates to encourage savings. In Norway’s case, the velocity of money is surging through 2021, which confirms that the Norges Bank may depart from its current emergency policy setting (Chart 17). Chart 17Money Velocity Is Rising In Norway
Money Velocity Is Rising In Norway
Money Velocity Is Rising In Norway
The OIS curve already reflects this reality. At the last central bank meeting in March, Governor Øystein Olsen stated that interest rates would increase in the second half of this year. Already, the central bank’s balance sheet has been expanding more slowly than that of its peers (Chart 18). In response to this messaging, investors now expect the Norges Bank to lead the Fed, ECB, Riksbank, and BoE in lifting interest rates (Chart 19). Chart 18The Norges Bank's Balance Sheet Impulse Has Rolled Over
The Norges Bank's Balance Sheet Impulse Has Rolled Over
The Norges Bank's Balance Sheet Impulse Has Rolled Over
Chart 19Money Markets Already Expect The Norges Bank To Tighten First
Money Markets Already Expect The Norges Bank To Tighten First
Money Markets Already Expect The Norges Bank To Tighten First
The Norges Bank must nonetheless manage a tough balancing act. Lifting rates too soon or too fast could torpedo the recovery, if the currency and bond yields increase too rapidly and tighten financial conditions in a disruptive fashion. However, not removing accommodation fast enough could lead to economic overheating. Bottom Line: The Norges Bank will be the first DM central bank to increase interest rates, most likely as soon as this September. The OIS curve already reflects this outlook; it prices in over 6 hikes by the end of 2023, more than any other DM money market curve. This pricing seems appropriate; thus, Norwegian money markets offer no compelling investment opportunity. Norway’s Problem: Sagging Productivity Both the OECD and the IMF view weak productivity growth as Norway’s biggest long-term hurdle. Despite the bright economic outlook for the next two years or so, we agree. Since 2004-2005, Norwegian productivity has sharply decelerated. At the turn of the millennium, the Norwegian’s mainland labor productivity was growing at 2.5%, or a percentage point above the average of the OECD. Today, labor productivity growth is a paltry 0.5%, placing Norway last among Nordic economies (Chart 20, left panel). Total factor productivity tells a similar story. After recording the fastest productivity expansion among G10 nation from 1990 to 2005, Norway’s TFP declined 11% and is now situated at the same level as it was in 1995. This deterioration is comparable to Italy’s TFP (Chart 20, left panel). Chart 20From Best To Last
The Norwegian Method
The Norwegian Method
According to the most recent OECD country report, one of the roots of Norway’s productivity problem is an absence of low-hanging fruit. Norway sports one of the highest GDP per hours worked in the world. This nation essentially sits near the global productivity frontier. Its product market regulations are generally not onerous (Chart 21, top panel). Likewise, more than 60% of both the service sector and the manufacturing sector’s workforce use ICT tools, which is at the highest level among OECD countries. Additionally, the jobs at risk of a negative impact from automation or technological changes represent a significantly smaller share of total employment than in most OECD nations (Chart 21, bottom panel). Chart 21Doing Things Right
The Norwegian Method
The Norwegian Method
The Dutch Disease, the hollowing out of the manufacturing sector due to a capital hungry resource sector, is the second root of Norway’s productivity problem. Historically and across countries, manufacturing is the sector that records the greatest productivity gains. However, since 1979, the oil and gas and the housing sectors have experienced the largest capital investments expansion in Norway. Meanwhile, the share of capex generated by the manufacturing sector has declined to a paltry 5% (Chart 22). Moreover, oil and gas represents a larger share of capex than the contribution of its gross value added to GDP. The same holds true for housing, whose share of capex doubled over the past 27 years. Meanwhile, manufacturing’s share of capex has consistently lagged its representation in GDP, which has steadily declined (Chart 23). These are the typical symptoms of the Dutch Disease; as long as oil prices remain in a secular decline, any cyclical improvement in productivity will prove to be transitory. Chart 22The Dutch Disease, Part I
The Dutch Disease, Part I
The Dutch Disease, Part I
Chart 23The Dutch Disease, Part II
The Dutch Disease, Part II
The Dutch Disease, Part II
Bottom Line: Despite an upbeat cyclical outlook, Norway’s deteriorating productivity trend constitutes a formidable structural headwind. There are no easy solutions, because Norway already sits near the global productivity frontier. Moreover, Norway suffers from a pronounced case of the Dutch Disease. For decades, the oil and gas sector has absorbed a share of capital that is greater than its role in the economy, starving the productivity-generating manufacturing sector from investments. With the oil sector entering a structural decline due to ESG concerns, this trend will not change without a significant change in the allocation of the Norwegian capital stock. Investment Implications The cyclical outlook (12 to 24 months) for the Norwegian currency and stock market remains appealing. The NOK’s Outlook Chart 24The Krone Is Undervalued On A PPP Basis
The Krone Is Undervalued On A PPP Basis
The Krone Is Undervalued On A PPP Basis
While money markets do not offer any compelling opportunities to play the Norges Bank’s hiking cycle, the krone remains attractive from a cyclical perspective. Over the next 12-18 months, the NOK should appreciate compared to both the US dollar and the euro on the back of four key pillars. On a purchasing power parity basis, the Norwegian krone is undervalued by 14%. This compares favorably with both the euro, which is undervalued by 12%, and the US dollar, which is overvalued by 12% (Chart 24). More importantly, our PPP model adjusts the consumption basket across countries, allowing for a more apples-to-apples comparison. The Norwegian krone is highly procyclical and will benefit from any improvement in the global backdrop. The performance of NOK/USD, NOK/EUR, and NOK/JPY moves in lockstep with global equities (Chart 25). Norwegian equities have greatly underperformed global bourses over the last decade, but, as we argue below, there is some room for mean reversion. Inflows into the Norwegian equity market should benefit the krone (Chart 26). Chart 25NOK Is A Procyclical ##br##Currency
NOK Is A Procyclical Currency
NOK Is A Procyclical Currency
Chart 26NOK Moves With A Rerating In Norwegian Shares
NOK Moves With A Rerating In Norwegian Shares
NOK Moves With A Rerating In Norwegian Shares
From a more fundamental perspective, the krone will benefit from positive income flows, given Norway’s large net international investment position (NIIP). In fact, ever since the first Norwegian oil fields began producing light sweet crude in the North Sea in the 1970s, Norway has maintained a structural trade surplus with most of its trading partners. This has allowed the country to build one of the biggest NIIP in the world (Chart 27), trailing only behind Hong Kong and Singapore. This large NIIP generates large income receipts that skew heavily toward equity dividends. This characteristic of the Norwegian balance of payment strengthens the bond between the NOK and global equities. Over the next few years, Norway’s trade balance should also get a boost, not only from rising oil and gas production, but also from an improvement in terms of trade, as we argued above. The trade balance has historically been the biggest driver of cross-border inflows into Norway, and that should remain positive for the basic balance and the NOK (Chart 28) Chart 28Norway's Basic Balance Should Improve Norway Balance Of Payments
Norway's Basic Balance Should Improve Norway Balance Of Payments
Norway's Basic Balance Should Improve Norway Balance Of Payments
Chart 27Norway Has A Large Net International Investment Position
Norway Has A Large Net International Investment Position
Norway Has A Large Net International Investment Position
On a structural basis, however, the Norwegian krone faces challenges. Declining productivity suggests that economic growth in Norway will be more inflationary. This will lower the fair value of the real exchange rate. Therefore, while we are positive on the NOK over the next 18 to 24 months, we will be cognizant not to overstay our welcome. Finally, as for NOK/SEK, the pair should rise as both oil and gas prices remain firm in the near term, but any structural challenges to both oil and/or Norwegian productivity will favor the SEK over the longer term (Chart 29). Chart 29NOK/SEK Will Track Crude Prices
NOK/SEK Will Track Crude Prices
NOK/SEK Will Track Crude Prices
The Equity Market Outlook Norwegian equities remain challenged as long-term holdings, but they are attractive on a cyclical basis. The poor profitability of Norwegian equities is their main long-term problem. Unlike Swedish stocks, Norwegian shares sport a return on equity in line with that of the Eurozone, not that of the US. Norway’s profit margins are weak and its asset turnover rivals that of the Euro Area (Chart 30). Additionally, the country’s poor productivity performance argues against a sudden reversal in RoEs. Chart 30Norway Is More Like The Eurozone Than Swden
Norway Is More Like The Eurozone Than Swden
Norway Is More Like The Eurozone Than Swden
Sectoral composition creates another structural handicap for the Norwegian market. Oslo overweighs Energy and Financials (Table 1). Energy stocks can experience periodic rallies, but their long-term outlook is bleak in a world moving away from carbon-based power. Meanwhile, financials are also likely to remain structural laggards. The regulatory legacy of the Great Financial Crisis has curtailed leverage, which is depressing the RoE of the banking sector. Greater competition and the emergence of the fintech industry are further undermining fee income. None of these factors will change anytime soon. Table 1Sectoral Breakdown
The Norwegian Method
The Norwegian Method
That being said, Norwegian equities remain a compelling opportunity for the next two years or so, despite their long-term problems. Norwegian stocks have an extremely negative beta to the US dollar. The historical sensitivity of the NOK to the USD in part explains this attribute, the other part being their elevated cyclicality. The dollar is one of the most counter-cyclical currencies in the world; thus, its weakness correlates with strong Norwegian forward earnings, which are heavily influenced by commodity prices and the global industrial cycle. This process also lifts Norwegian stock prices (Chart 31). Hence, BCA’s positive outlook on the global business cycle, as well as our negative stance on the dollar, points to significantly stronger Norwegian share prices.3 The slowdown in China’s economy is one risk that could cause some near-term tremors in Norwegian assets, which investors should use to build positions. In response to Beijing’s efforts to limit systemic risk, the Chinese credit impulse has slowed from 1.1% of GDP to 0.3%, and could flirt with the zero line. The ensuing investment slowdown will weigh on the global industrial sector and cause a temporary pullback in commodity prices. As Chart 32 illustrates, this will be negative for Norwegian equities; historically, following declines in Chinese yields, Norwegian forward earnings and stock prices weaken. However, global energy demand will remain robust even as China slows; therefore, correcting Norwegian equities create a buying opportunity. Chart 31Norwegian Stocks Are A Dollar-Bearish Bet
Norwegian Stocks Are A Dollar-Bearish Bet
Norwegian Stocks Are A Dollar-Bearish Bet
Chart 32A Chinese Slowdown Is A Risk
A Chinese Slowdown Is A Risk
A Chinese Slowdown Is A Risk
Norwegian stocks should also outperform US and Eurozone equities. Nonetheless, Norwegian equities enjoy their greatest appeal against the US benchmark. Norwegian stocks trade at valuation discounts ranging from 38% to 54% compared to their US counterparts. Meanwhile, Norway’s net earnings revisions remain depressed compared to the US. Most importantly, Norwegian stocks are more pro-cyclical and sensitive to EM and global financial conditions than US shares are. Consequently, Oslo outperforms New York when the broad trade-weighted dollar depreciates, EM currencies appreciate, and the global yield curve slope steepens (Chart 33). We expect these trends to intensify over the remainder of the business cycle. Chart 33Oslo Beats New York
Oslo Beats New York
Oslo Beats New York
Norwegian equities are also more responsive than Eurozone equities to global business-cycle oscillations. Norwegian equities outperform those of the Eurozone when the dollar depreciates (Chart 34). Additionally, a simple modelling exercise reveals that rising oil prices and global yields result in higher relative share prices in favor of Norway (Chart 35). Chart 34Norway Outperforms The Eurozone When The Dollar Weakens
Norway Outperforms The Eurozone When The Dollar Weakens
Norway Outperforms The Eurozone When The Dollar Weakens
Chart 35Favor Norway Over ##br##The Euro Area
Favor Norway Over The Euro Area
Favor Norway Over The Euro Area
Sweden is the one market that maintains a hedge over Norway.4 Swedish stocks not only sport a RoE nine percentage point above that of Norway, they are also sensitive to the global business cycle. However, the main advantage of Swedish equities is their sectoral breakdown. Sweden has an enormous overweight in industrials (38% of the benchmark), while Norway greatly overweighs materials. In an environment in which China is likely to decelerate, but global capex and infrastructure spending will remain firm, Sweden’s industrials’ weighting gives it a powerful advantage over its neighbor’s stock market. Finally, we recommend the following high-octane trade: Long Norwegian / short Dutch stocks. The Amsterdam bourse has a 47% allocation to tech stocks and a greater “growth” bias than the S&P 500. This means that the relative performance of Norwegian stocks compared to Dutch equities is even more sensitive to the global business cycle, oil prices, and bond yields. As a result, our simple model incorporating both Brent prices and yields currently sends a strong buy signal in favor of Norway (Chart 36). Chart 36Time To Buy Norway And Sell The Netherlands
Time To Buy Norway And Sell The Netherlands
Time To Buy Norway And Sell The Netherlands
Bottom Line: The NOK will perform strongly against both the USD and the EUR over the coming 18 to 24 months. Norwegian equities are not an appealing long-term bet; however, they will experience significant upside over the coming two years, both in absolute terms and relative to the US and Euro Area stocks. While Oslo is unlikely to outperform Stockholm over this period, we recommend buying Norwegian stocks and selling the Dutch index. Mathieu Savary Chief European Investment Strategist Mathieu@bcaresearch.com Chester Ntonifor Foreign Exchange Strategist chestern@bcaresearch.com Footnotes 1 Please see European Investment Strategy Report, "A Surprising Dance," dated May 10, 2021. 2 Please see Commodity & Energy Strategy Report, "OPEC’s 2.0 Production Strategy In Focus," dated May 20, 2021. 3 Please see Foreign Exchange Strategy Report, "Explaining Recent Weakness In The US Dollar," dated May 14, 2021. 4 Please see European Investment Strategy Report, "Take A Chance On Sweden," dated May 03, 2021.
Highlights The Norwegian economy will continue to grow above trend for the next two years or so. Norwegian inflation will firm up. Among Advanced Economies, the Norges Bank will lead the way in terms of policy tightening; however, money markets already embed this view. Nonetheless, the Norwegian krone remains an appealing value play, a result of its pronounced pro-cyclicality. USD/NOK and EUR/NOK will depreciate over the next 24 months. Norwegian equities face structural headwinds, but they should outperform their US and Euro Area counterparts. However, Norwegian stocks will lag behind Swedish equities. Buy Norwegian stocks / sell Dutch ones. Feature Norway remains an example of how to handle the pandemic successfully. Since the onset of the COVID-19 crisis, Norway has registered the lowest rate of infections per capita, in part aided by its early decision to close its borders. Fiscal stimulus was prompt and finely tailored to the sectors most in need of emergency funds. Moreover, the Norges Bank cut interest rates to zero for the first time since its founding in 1816. As nations across the world coordinated monetary and fiscal accommodation during the pandemic, Nordic economies had already mastered this paradigm. Thus, counter-cyclical buffers worked like a charm in Norway. For example, the contraction in Norwegian GDP was the most subdued within the G10, and the recovery is also impressive. Today, Norwegian GDP is 2% above pre-pandemic levels, inflation is near the target rate of 2%, and the central bank will be among the first to lift interest rates. In this Special Report, we explore whether or not conditions remain ripe for strong performances by both Norwegian equities and the NOK. In our view, the global environment and the continued economic strength of Norway will create potent tailwind for Norwegian assets over the coming two years or so. A Robust Economic Outlook The Norwegian economy is set to continue growing at a robust above-trend pace and inflation will remain above the Norges Bank’s target. The Pandemic Norway has moved largely beyond the COVID-19 pandemic. The number of cases per 100 is a mere 2, which compares favorably to the US at 10, Germany at 4, France at 8, or its neighbor Sweden at 10. Norway closed its borders on March 12, 2020, to limit the entry of the virus on its territory, as health authorities opted for rapid containment measures. As a direct result of these policies, Norwegian consumers and workers gained greater peace of mind in their day-to-day dealings, and economic activity recovered rapidly. This process led to Norway’s GDP contracting by only 4.6% in Q2 2020, which compares favorably to contractions of 19.5% in the UK, 9.7% in Germany and 7.8% in Sweden. Norway’s vaccination campaign is also gaining momentum. At first, the country’s inoculation performance lagged. However, Norwegian procurement of vaccines has improved, and the pace of inoculation is accelerating (Chart 1, top panel). The result is that the share of the population that is fully vaccinated is inching toward 20% and accelerating. Authorities expect greater relaxation of containment measures this summer, which will allow mobility to improve (Chart 2). The local service sector will therefore receive a welcome fillip. Chart 1Norway's Vaccination Progress
Norway's Vaccination Progress
Norway's Vaccination Progress
Chart 2Mobility Will Pick Up
Mobility Will Pick Up
Mobility Will Pick Up
Fiscal Policy Fiscal policy remains an important complement to national health directives. During the crisis, the fiscal deficit reached 3.4% of GDP, which generated a fiscal thrust of 6% of GDP. Moreover, the drawdown from the Norwegian Oil Fund amounted to 12.5% of GDP. These provided targeted supports to industries, such as tourism and transport, while a furlough scheme protected household income. Thus, these programs effectively alleviated the pain on the sectors of the economy most affected by the pandemic. Going forward, Norway will also suffer from one of the smallest fiscal drag in the G10 for the remainder of 2021 and 2022 (Chart 3). Chart 3Norway's Advantageous Fiscal Backdrop
Norway's Advantageous Fiscal Backdrop
Norway's Advantageous Fiscal Backdrop
The Banking System The credit channel in Norway remains open and fluid, as a resilient banking system withstood the economic fallout from the pandemic. According to the Norges Bank, credit losses have been limited; they peaked at 1% of lending and are already declining. Additionally, banks have restricted exposure to the sectors hardest hit by the pandemic, such as travel and tourism, personal services, and transport (Chart 4). Moreover, the profitability of the banking system decreased, as global yields fell last year, but RoE remains around 10% and net interest margins hover near 2.5% and 1.5% for non-financial corporate loans and households lending, respectively. Crucially, the Norwegian banking system sports a regulatory Tier-1 capital-to-risk weighted-assets ratio of 20%, well above Basel III criteria or that of the Eurozone banks (Chart 4, bottom panel). Chart 4Norwegian Banks Are Faring Well
The Norwegian Method
The Norwegian Method
Household Consumption Household consumption will remain a source of strength over the coming quarters. Household net worth is growing robustly as a result of the rapid appreciation of house prices across the country (Chart 5, top panel). Moreover, the share of debt held by households with a high debt-to-income ratio or a low debt-servicing capacity remains low, which suggests household balance sheets are firming (Chart 5, middle panel). Employment is also recovering well. After peaking at 9.5% in March 2020, the headline unemployment rate fell to 3.3% last month (Chart 5, bottom panel). Meanwhile, the number of employed workers bottomed in July 2020 and has been steadily recovering ever since. The only blemish is that, as of Q4 2020, the rate of underemployment among the prime-age population remains at 3.5%, which is somewhat elevated by national standards. This balance sheet and employment backdrop confirms the Norges Bank’s projection: the household savings rate will decline significantly over the coming two years (Chart 6, top panel). Hence, the marked pick-up in consumer confidence should translate into a major recovery in real consumption growth (Chart 6, bottom panel). Nonetheless, the service sector will likely be the main beneficiary of this improvement, as real retail sales are already well above their historical trend Chart 5Positive Household Fundamentals
Positive Household Fundamentals
Positive Household Fundamentals
Chart 6Consumption Will Improve Further
Consumption Will Improve Further
Consumption Will Improve Further
Net Exports Chart 7Years Of Underinvestment In Oil & Gas
The Norwegian Method
The Norwegian Method
The external sector will create another tailwind for the Norwegian economy. Prior to the pandemic, 71% of Norway’s exports flowed to Europe. Moreover, oil and gas represented 53% of shipments, and cyclically sensitive exports amounted to 74% of total or 24% of GDP. Thus, even if China’s economy slows, Europe’s economic re-opening will raise the Norwegian trade balance, which sits near a multi-decade low.1 Moreover, greater mobility in Europe and around the world will elevate demand for petroleum. In light of the tepid pace of investment in global oil and gas extraction over the past five years, our commodity strategists forecast further oil and gas price appreciation2 (Chart 7), which will boost Norway’s terms of trade. The national income will therefore expand smartly, especially because oil and gas shipments will increase thanks to growing production from the new Johan Sverdrup field. Capital Spending This context suggests that capital spending, which accounts for 26% of Norway’s output (Chart 8), will constitute an important tailwind to domestic activity. Capex is even more important to the Norwegian economy than it is for other Nordic economies or even Germany (Chart 9). Chart 8Capital Spending Is Important For Norway
Capital Spending Is Important For Norway
Capital Spending Is Important For Norway
Chart 9The Capex Share Of GDP Is Higher In Norway
The Capex Share Of GDP Is Higher In Norway
The Capex Share Of GDP Is Higher In Norway
Norwegian capex is highly cyclical. Capital formation tracks our BCA Global Nowcast indicator (a combination of high-frequency economic and financial variables that proxy the global industrial cycle), as well as the domestic manufacturing PMI. These indicators suggest that capex should increase by 10-15% in the coming quarters (Chart 10). A Norges Bank survey of capex intentions, which are firming, corroborates this view. Chart 10Capex Will Recover Strongly Capex Will Recover
Capex Will Recover Strongly Capex Will Recover
Capex Will Recover Strongly Capex Will Recover
On the energy front, the new Johan Sverdrup oil and gas discovery marks a major turnaround in capital spending for Norway. According to the Norges Bank, real petroleum investment will increase from approximately NOK 175bn in 2021 to NOK 198bn by 2024 (Chart 11). Moreover, years of global underinvestment in oil extraction suggests Norway will gain market share in exports as production accelerates. Total petroleum production is slated to increase by 10% over the next 4 years. More importantly, by 2025, over 50% of production from Norwegian oil fields will be natural gas and associated liquids (Chart 12). Demand for natural gas and NGLs will be more inelastic than demand for crude because the latter is threatened by the rising electrification of vehicles, while the former faces more sustainable demand as China, among others, moves to replace its coal polluting plants with cleaner alternatives. Chart 11Real Petroleum Investment Will Increase By 13% In 2024
The Norwegian Method
The Norwegian Method
Chart 12Gas Production Is Rising In Importance
The Norwegian Method
The Norwegian Method
Inflation This positive economic outlook suggests that Norwegian inflation will remain above the central bank’s target of 2%. Already, headline CPI stands at 3%. Meanwhile, core inflation is at 2%, but it is decelerating. However, this slowdown should be temporary. According to a Norges Bank survey, both long-term and near-term inflation expectations among economists, business leaders, and households are rising, which indicates that a deflationary mentality has not taken root in Norway. Moreover, wage expectations have quickly normalized following the trauma of 2020 (Chart 13). Capacity constraints further reinforce the notion that inflation has upside. The Norges Bank Regional Network survey shows that capacity and labor supply constraints are tighter than they were in the 2014 to 2017 period, when inflation averaged 2.3% and the policy rate fell to 0.5% (Chart 14). Moreover, according to the same survey, selling prices are also stronger than they were during the 2016 oil collapse (Chart 14, bottom panel) Chart 13No Signs Of A Deflation Mentality
No Signs Of A Deflation Mentality
No Signs Of A Deflation Mentality
Chart 14Capacity Doesn’t Point To Falling Inflation
The Norwegian Method
The Norwegian Method
Bottom Line: The Norwegian economy will continue to grow above its trend rate of 1.5%, at least through to 2022. The acceleration in vaccination numbers will allow a reopening of the economy, while the fiscal drag will be limited and the banking system remains resilient. The outlook for households remains positive and employment is firming, which will lead to stronger consumption. Meanwhile, exports and capex have significant upside ahead. As a result, we anticipate Norwegian inflation will remain above target for the foreseeable future. The Norges Bank Will Lead The Pack The Norges Bank’s response to the pandemic was swift and all encompassing: It cut interest rates in the spring of 2020 from 1.5% to zero, the lowest level since the formation of the bank in 1816. It set up extraordinary F-loans at very generous interest rates, to provide ample liquidity to commercial banks. The longest maturity loan of 12 months had a prevailing interest rate of just 30 basis points. It also relaxed collateral requirements for these loans. It introduced swap lines with the Federal Reserve to provide US dollar funding to Norwegian firms. Since then, our Norges Bank monitor has rebounded powerfully from very depressed levels, which suggests that emergency policy settings have become unnecessary. Moreover, the Norwegian Central Bank Monitor towers above that of other G10 countries, which indicates that the Norges Bank should lead the pack in normalizing policy rates (Chart 15). Chart 15The Norges Bank Should Lead The Tightening Cycle
The Norges Bank Should Lead The Tightening Cycle
The Norges Bank Should Lead The Tightening Cycle
Chart 16The Growth Component Of Our Monitor Has Exploded Higher
The Growth Component Of Our Monitor Has Exploded Higher The Growth Component Of Our Monitor Has Exploded Higher
The Growth Component Of Our Monitor Has Exploded Higher The Growth Component Of Our Monitor Has Exploded Higher
The biggest improvement in our Norges Bank Monitor comes from its growth component, which has surged to its highest levels in over two decades. This improvement surpasses those that followed the global financial crisis and the burst of the dot-com bubble (Chart 16). In essence, the growth component of the Monitor signals that the Norwegian economy has achieved escape velocity. Norway’s robust economic turnover is increasing the velocity of money, which points to the need for higher interest rates. Money velocity can be regarded as the equilibrating mechanism between money supply and nominal output, from the classical Fisher equation MV=PQ (where M is the money supply, P is prices, Q is real output, and V is money velocity). Thus, rising money velocity (when PQ expands faster than M) signifies that the economy needs higher interest rates to encourage savings. In Norway’s case, the velocity of money is surging through 2021, which confirms that the Norges Bank may depart from its current emergency policy setting (Chart 17). Chart 17Money Velocity Is Rising In Norway
Money Velocity Is Rising In Norway
Money Velocity Is Rising In Norway
The OIS curve already reflects this reality. At the last central bank meeting in March, Governor Øystein Olsen stated that interest rates would increase in the second half of this year. Already, the central bank’s balance sheet has been expanding more slowly than that of its peers (Chart 18). In response to this messaging, investors now expect the Norges Bank to lead the Fed, ECB, Riksbank, and BoE in lifting interest rates (Chart 19). Chart 18The Norges Bank's Balance Sheet Impulse Has Rolled Over
The Norges Bank's Balance Sheet Impulse Has Rolled Over
The Norges Bank's Balance Sheet Impulse Has Rolled Over
Chart 19Money Markets Already Expect The Norges Bank To Tighten First
Money Markets Already Expect The Norges Bank To Tighten First
Money Markets Already Expect The Norges Bank To Tighten First
The Norges Bank must nonetheless manage a tough balancing act. Lifting rates too soon or too fast could torpedo the recovery, if the currency and bond yields increase too rapidly and tighten financial conditions in a disruptive fashion. However, not removing accommodation fast enough could lead to economic overheating. Bottom Line: The Norges Bank will be the first DM central bank to increase interest rates, most likely as soon as this September. The OIS curve already reflects this outlook; it prices in over 6 hikes by the end of 2023, more than any other DM money market curve. This pricing seems appropriate; thus, Norwegian money markets offer no compelling investment opportunity. Norway’s Problem: Sagging Productivity Both the OECD and the IMF view weak productivity growth as Norway’s biggest long-term hurdle. Despite the bright economic outlook for the next two years or so, we agree. Since 2004-2005, Norwegian productivity has sharply decelerated. At the turn of the millennium, the Norwegian’s mainland labor productivity was growing at 2.5%, or a percentage point above the average of the OECD. Today, labor productivity growth is a paltry 0.5%, placing Norway last among Nordic economies (Chart 20, left panel). Total factor productivity tells a similar story. After recording the fastest productivity expansion among G10 nation from 1990 to 2005, Norway’s TFP declined 11% and is now situated at the same level as it was in 1995. This deterioration is comparable to Italy’s TFP (Chart 20, left panel). Chart 20From Best To Last
The Norwegian Method
The Norwegian Method
According to the most recent OECD country report, one of the roots of Norway’s productivity problem is an absence of low-hanging fruit. Norway sports one of the highest GDP per hours worked in the world. This nation essentially sits near the global productivity frontier. Its product market regulations are generally not onerous (Chart 21, top panel). Likewise, more than 60% of both the service sector and the manufacturing sector’s workforce use ICT tools, which is at the highest level among OECD countries. Additionally, the jobs at risk of a negative impact from automation or technological changes represent a significantly smaller share of total employment than in most OECD nations (Chart 21, bottom panel). Chart 21Doing Things Right
The Norwegian Method
The Norwegian Method
The Dutch Disease, the hollowing out of the manufacturing sector due to a capital hungry resource sector, is the second root of Norway’s productivity problem. Historically and across countries, manufacturing is the sector that records the greatest productivity gains. However, since 1979, the oil and gas and the housing sectors have experienced the largest capital investments expansion in Norway. Meanwhile, the share of capex generated by the manufacturing sector has declined to a paltry 5% (Chart 22). Moreover, oil and gas represents a larger share of capex than the contribution of its gross value added to GDP. The same holds true for housing, whose share of capex doubled over the past 27 years. Meanwhile, manufacturing’s share of capex has consistently lagged its representation in GDP, which has steadily declined (Chart 23). These are the typical symptoms of the Dutch Disease; as long as oil prices remain in a secular decline, any cyclical improvement in productivity will prove to be transitory. Chart 22The Dutch Disease, Part I
The Dutch Disease, Part I
The Dutch Disease, Part I
Chart 23The Dutch Disease, Part II
The Dutch Disease, Part II
The Dutch Disease, Part II
Bottom Line: Despite an upbeat cyclical outlook, Norway’s deteriorating productivity trend constitutes a formidable structural headwind. There are no easy solutions, because Norway already sits near the global productivity frontier. Moreover, Norway suffers from a pronounced case of the Dutch Disease. For decades, the oil and gas sector has absorbed a share of capital that is greater than its role in the economy, starving the productivity-generating manufacturing sector from investments. With the oil sector entering a structural decline due to ESG concerns, this trend will not change without a significant change in the allocation of the Norwegian capital stock. Investment Implications The cyclical outlook (12 to 24 months) for the Norwegian currency and stock market remains appealing. The NOK’s Outlook Chart 24The Krone Is Undervalued On A PPP Basis
The Krone Is Undervalued On A PPP Basis
The Krone Is Undervalued On A PPP Basis
While money markets do not offer any compelling opportunities to play the Norges Bank’s hiking cycle, the krone remains attractive from a cyclical perspective. Over the next 12-18 months, the NOK should appreciate compared to both the US dollar and the euro on the back of four key pillars. On a purchasing power parity basis, the Norwegian krone is undervalued by 14%. This compares favorably with both the euro, which is undervalued by 12%, and the US dollar, which is overvalued by 12% (Chart 24). More importantly, our PPP model adjusts the consumption basket across countries, allowing for a more apples-to-apples comparison. The Norwegian krone is highly procyclical and will benefit from any improvement in the global backdrop. The performance of NOK/USD, NOK/EUR, and NOK/JPY moves in lockstep with global equities (Chart 25). Norwegian equities have greatly underperformed global bourses over the last decade, but, as we argue below, there is some room for mean reversion. Inflows into the Norwegian equity market should benefit the krone (Chart 26). Chart 25NOK Is A Procyclical ##br##Currency
NOK Is A Procyclical Currency
NOK Is A Procyclical Currency
Chart 26NOK Moves With A Rerating In Norwegian Shares
NOK Moves With A Rerating In Norwegian Shares
NOK Moves With A Rerating In Norwegian Shares
From a more fundamental perspective, the krone will benefit from positive income flows, given Norway’s large net international investment position (NIIP). In fact, ever since the first Norwegian oil fields began producing light sweet crude in the North Sea in the 1970s, Norway has maintained a structural trade surplus with most of its trading partners. This has allowed the country to build one of the biggest NIIP in the world (Chart 27), trailing only behind Hong Kong and Singapore. This large NIIP generates large income receipts that skew heavily toward equity dividends. This characteristic of the Norwegian balance of payment strengthens the bond between the NOK and global equities. Over the next few years, Norway’s trade balance should also get a boost, not only from rising oil and gas production, but also from an improvement in terms of trade, as we argued above. The trade balance has historically been the biggest driver of cross-border inflows into Norway, and that should remain positive for the basic balance and the NOK (Chart 28) Chart 28Norway's Basic Balance Should Improve Norway Balance Of Payments
Norway's Basic Balance Should Improve Norway Balance Of Payments
Norway's Basic Balance Should Improve Norway Balance Of Payments
Chart 27Norway Has A Large Net International Investment Position
Norway Has A Large Net International Investment Position
Norway Has A Large Net International Investment Position
On a structural basis, however, the Norwegian krone faces challenges. Declining productivity suggests that economic growth in Norway will be more inflationary. This will lower the fair value of the real exchange rate. Therefore, while we are positive on the NOK over the next 18 to 24 months, we will be cognizant not to overstay our welcome. Finally, as for NOK/SEK, the pair should rise as both oil and gas prices remain firm in the near term, but any structural challenges to both oil and/or Norwegian productivity will favor the SEK over the longer term (Chart 29). Chart 29NOK/SEK Will Track Crude Prices
NOK/SEK Will Track Crude Prices
NOK/SEK Will Track Crude Prices
The Equity Market Outlook Norwegian equities remain challenged as long-term holdings, but they are attractive on a cyclical basis. The poor profitability of Norwegian equities is their main long-term problem. Unlike Swedish stocks, Norwegian shares sport a return on equity in line with that of the Eurozone, not that of the US. Norway’s profit margins are weak and its asset turnover rivals that of the Euro Area (Chart 30). Additionally, the country’s poor productivity performance argues against a sudden reversal in RoEs. Chart 30Norway Is More Like The Eurozone Than Swden
Norway Is More Like The Eurozone Than Swden
Norway Is More Like The Eurozone Than Swden
Sectoral composition creates another structural handicap for the Norwegian market. Oslo overweighs Energy and Financials (Table 1). Energy stocks can experience periodic rallies, but their long-term outlook is bleak in a world moving away from carbon-based power. Meanwhile, financials are also likely to remain structural laggards. The regulatory legacy of the Great Financial Crisis has curtailed leverage, which is depressing the RoE of the banking sector. Greater competition and the emergence of the fintech industry are further undermining fee income. None of these factors will change anytime soon. Table 1Sectoral Breakdown
The Norwegian Method
The Norwegian Method
That being said, Norwegian equities remain a compelling opportunity for the next two years or so, despite their long-term problems. Norwegian stocks have an extremely negative beta to the US dollar. The historical sensitivity of the NOK to the USD in part explains this attribute, the other part being their elevated cyclicality. The dollar is one of the most counter-cyclical currencies in the world; thus, its weakness correlates with strong Norwegian forward earnings, which are heavily influenced by commodity prices and the global industrial cycle. This process also lifts Norwegian stock prices (Chart 31). Hence, BCA’s positive outlook on the global business cycle, as well as our negative stance on the dollar, points to significantly stronger Norwegian share prices.3 The slowdown in China’s economy is one risk that could cause some near-term tremors in Norwegian assets, which investors should use to build positions. In response to Beijing’s efforts to limit systemic risk, the Chinese credit impulse has slowed from 1.1% of GDP to 0.3%, and could flirt with the zero line. The ensuing investment slowdown will weigh on the global industrial sector and cause a temporary pullback in commodity prices. As Chart 32 illustrates, this will be negative for Norwegian equities; historically, following declines in Chinese yields, Norwegian forward earnings and stock prices weaken. However, global energy demand will remain robust even as China slows; therefore, correcting Norwegian equities create a buying opportunity. Chart 31Norwegian Stocks Are A Dollar-Bearish Bet
Norwegian Stocks Are A Dollar-Bearish Bet
Norwegian Stocks Are A Dollar-Bearish Bet
Chart 32A Chinese Slowdown Is A Risk
A Chinese Slowdown Is A Risk
A Chinese Slowdown Is A Risk
Norwegian stocks should also outperform US and Eurozone equities. Nonetheless, Norwegian equities enjoy their greatest appeal against the US benchmark. Norwegian stocks trade at valuation discounts ranging from 38% to 54% compared to their US counterparts. Meanwhile, Norway’s net earnings revisions remain depressed compared to the US. Most importantly, Norwegian stocks are more pro-cyclical and sensitive to EM and global financial conditions than US shares are. Consequently, Oslo outperforms New York when the broad trade-weighted dollar depreciates, EM currencies appreciate, and the global yield curve slope steepens (Chart 33). We expect these trends to intensify over the remainder of the business cycle. Chart 33Oslo Beats New York
Oslo Beats New York
Oslo Beats New York
Norwegian equities are also more responsive than Eurozone equities to global business-cycle oscillations. Norwegian equities outperform those of the Eurozone when the dollar depreciates (Chart 34). Additionally, a simple modelling exercise reveals that rising oil prices and global yields result in higher relative share prices in favor of Norway (Chart 35). Chart 34Norway Outperforms The Eurozone When The Dollar Weakens
Norway Outperforms The Eurozone When The Dollar Weakens
Norway Outperforms The Eurozone When The Dollar Weakens
Chart 35Favor Norway Over ##br##The Euro Area
Favor Norway Over The Euro Area
Favor Norway Over The Euro Area
Sweden is the one market that maintains a hedge over Norway.4 Swedish stocks not only sport a RoE nine percentage point above that of Norway, they are also sensitive to the global business cycle. However, the main advantage of Swedish equities is their sectoral breakdown. Sweden has an enormous overweight in industrials (38% of the benchmark), while Norway greatly overweighs materials. In an environment in which China is likely to decelerate, but global capex and infrastructure spending will remain firm, Sweden’s industrials’ weighting gives it a powerful advantage over its neighbor’s stock market. Finally, we recommend the following high-octane trade: Long Norwegian / short Dutch stocks. The Amsterdam bourse has a 47% allocation to tech stocks and a greater “growth” bias than the S&P 500. This means that the relative performance of Norwegian stocks compared to Dutch equities is even more sensitive to the global business cycle, oil prices, and bond yields. As a result, our simple model incorporating both Brent prices and yields currently sends a strong buy signal in favor of Norway (Chart 36). Chart 36Time To Buy Norway And Sell The Netherlands
Time To Buy Norway And Sell The Netherlands
Time To Buy Norway And Sell The Netherlands
Bottom Line: The NOK will perform strongly against both the USD and the EUR over the coming 18 to 24 months. Norwegian equities are not an appealing long-term bet; however, they will experience significant upside over the coming two years, both in absolute terms and relative to the US and Euro Area stocks. While Oslo is unlikely to outperform Stockholm over this period, we recommend buying Norwegian stocks and selling the Dutch index. Mathieu Savary Chief European Investment Strategist Mathieu@bcaresearch.com Chester Ntonifor Foreign Exchange Strategist chestern@bcaresearch.com Footnotes 1 Please see European Investment Strategy Report, "A Surprising Dance," dated May 10, 2021. 2 Please see Commodity & Energy Strategy Report, "OPEC’s 2.0 Production Strategy In Focus," dated May 20, 2021. 3 Please see Foreign Exchange Strategy Report, "Explaining Recent Weakness In The US Dollar," dated May 14, 2021. 4 Please see European Investment Strategy Report, "Take A Chance On Sweden," dated May 03, 2021. Trades & Forecasts Forecast Summary Core Portfolio Tactical Trades Limit Orders Closed Trades
Dear Client, In this special report we are pleased to introduce Ritika Mankar, the newest Strategist to join BCA Research and Geopolitical Strategy. Ritika hails from Mumbai where she has led a distinguished career as a director at Ambit, an institutional equity brokerage, leading one of the top macro research franchises in India. She is also a director on the board of CFA Society India. Going forward Ritika will oversee Geopolitical Strategy’s India and South Asia analysis. In this report Ritika argues that owing to both under-investment and under-employment, India’s growth engine is set to misfire in FY22. Investors should pare their exposure to Indian assets for now. I trust you will find the report insightful and will look forward to Ritika’s regular contributions, which will deepen our global coverage of market-relevant geopolitical trends and themes. Sincerely, Matt Gertken Geopolitical Strategist Highlights Indian equities have outperformed emerging market equities decisively since March 2020. But a festering jobs problem in the informal sector and weak consumer confidence, will mean that both consumption and investment growth could disappoint in FY22. We recommend closing the Long Indian / Short Chinese Equities trade and the Long Indian Local Currency Bond / Short EM Bonds trade. We launch two new trades: Short India Banks and Long India Consumer Discretionary. Feature India has been the blue-eyed boy of the emerging market space since the dawn of the twenty-first century. Narratives about India have had a marked bullish tilt. To be fair, this optimism is justified most of the time for three very good reasons. Firstly, India’s geopolitical backdrop has improved. At home, the aftermath of the Great Recession saw the emergence of a new policy consensus consisting of nationalism and economic development. Indian policymakers recognize that if they undertake reforms to boost productivity then India has a chance of achieving a stronger strategic position in South Asia than military might alone can give it. Abroad, India is being courted by foreign powers and foreign investors. The United States has broken up the special relationship it maintained with China since the early 1970s. India stands to benefit from the West’s need now to counter-balance China. Secondly, India’s growth engine relies primarily on consumption as compared to more volatile components like net exports. Consumption makes up 56% of GDP. A consumption-powered economy that is young and not yet saturated with consumer goods, from washing machines to cars, deserves a premium. Growth in such an economy is likely to be far more predictable as compared to an export-driven economy that must contend with commodity price cycles, foreign business cycles, and de-globalization. Thirdly, India scores over other emerging markets as it offers political stability in a well-entrenched democratic framework. Despite having a low per capita income, India has a political system that is comparable to that of high-income developed countries. India’s head of state has been democratically elected since 1951 and the government at the centre has completed its full five-year term every time since 1999. More importantly, India’s institutions by design are “inclusive.”1 Institutions that provide checks and balances also deliver most of the time. So, unlike say in the case of China, Russia, Brazil, or even Turkey, India rarely gives an emerging market fund manager sleepless nights on account of politics or policy unpredictability. Whilst India deserves the premium it attracts most of the time, in this note we highlight that the market seems to be underpricing certain material risks that are building up in India. Distinct from the challenges created by COVID-19 (more on this later), India’s growth engine appears to be sputtering as two key faults develop: Under-investment: India has underinvested in capital creation for over a decade now. With government finances stretched, and with middling capacity utilization rates, investment growth in the short run is likely to stay compromised. Under-employment: India’s high GDP growth rate over the last few years has not been accompanied by an expansion in employment. Even before the pandemic, the Indian economy’s growth process had been asymmetric (or K-shaped) with the majority’s employment prospects worsening while a limited minority’s economic prospects were improving. This trend has become even more entrenched post-pandemic. Till India’s fast-compounding unemployment problem is solved, consumption growth in India will disappoint. And until then, only a select few upwardly mobile consumers of the service economy and business class will be supporting consumption growth in India. Both these dynamics will hurt India’s ability to grow its economy in the short term. These faults could force policymakers to take imprudent fiscal decisions to boost growth in the medium term too. Against this backdrop and with MSCI India trading at a 79% premium to EMs versus a two-year average of 57%, we reckon that the time is right for investors to scale down their exposure to segments of the Indian market where valuations look stretched. This report is divided into three segments: Segment 1: India’s GDP in FY22: Brace for disappointments Segment 2: COVID-19 in India: The road to normalcy will be long Segment 3: Investment conclusions India GDP In FY22: Brace For Disappointments Both the under-investment and the under-employment problem predate the COVID-19 crisis. Even as a degree of reflation kicks in as the second wave of COVID-19 infections abates, both these problems will act as a drag on India’s GDP growth in FY22. Investment Growth In India To Stay Constrained In FY22 The importance of investment in India is often underrated. Not only does gross fixed capital formation make up a third of India’s GDP each year, it also plays a critical role in driving consumption growth over the subsequent period (Chart 1). Occasional upcycles in investment are required to ensure that income growth remains robust, which in turn powers consumption growth. What is worrying is that India’s investment-to-GDP ratio had been trending downwards even before the onset of COVID-19 (Chart 2). This ratio in fact has been inching lower since the global financial crisis (GFC) from a peak of 36% to 29% in FY20. Unsurprisingly, investments have fallen further following the pandemic. The investment-to-GDP ratio fell to 27% in FY21 which is the lowest reading for this metric since the bursting of the dot-com bubble in 2001. Chart 1Consumption Growth Today, Is A Function Of Investments Made In The Past
India: Flying Without Wings
India: Flying Without Wings
Chart 2India’s Investment To Gdp Ratio Has Been Trending Lower Since The GFC
India: Flying Without Wings
India: Flying Without Wings
In addition, India’s investment-to-GDP ratio appears likely to stay constrained in FY22 as well. This is because the government sector and the private corporate sector (which together account for 62% of India’s investments) are unlikely to have the ability or incentive to expand capacity. Government “big push” is missing: The stock of capital in any country is created by the household sector, the private corporate sector, and the government sector. In India’s case, the government accounts for about 25% of capital formation on a cross-cycle basis. India’s government has consistently underinvested in growing its capital stock. For instance, the central government’s allocation towards capital expenditure has stayed range-bound between 1.5%-2.5% of GDP for over a decade now (see Chart 2). Hence India has not had the benefit of a big push from the government to create capital assets, such as the Four Asian Tigers undertook in the 1970-80s and China undertook in the 1990s. To be fair, the Union Budget for FY22 envisages an increase in capital expenditure to 2.5% of GDP from 2.2% of GDP last year. However, this increase is small, and we worry that the actual government spending on capital investments could well surprise to the downside. Moreover government revenues could get crimped owing to the second wave of COVID-19 in India. History suggests that government capital expenditure priorities are often set aside when India confronts a crisis. Following the GFC, the Indian central government expanded its fiscal deficit from 2.6% of GDP in FY08 to 6.1% of GDP in FY09. However, a breakdown of expenditure-side data suggests that this increase was mainly driven by higher revenue spends. Capital expenditure in fact was cut back from 2.4% of GDP in FY08 to 1.6% of GDP in FY09. Private sector faces low demand: The private sector accounts for about 37% of capital formation on a cross-cycle basis. The private corporate sector is unlikely to want to fire up investments in FY22 as the demand scenario looks weak and capacity utilization rates in the economy are middling. Whilst specific sectors and companies are growing, consumer confidence in India on an economy-wide level remains low thereby pointing to a lackluster demand environment. The post-2020 revival in consumer confidence in India, surveys suggest, has been weaker than that experienced by developed and developing country peers (Chart 3). History suggests that upturns in the investment cycle are triggered when capacity utilization rates hover at 74% or more (Chart 4). Reserve Bank of India’s latest capacity utilization survey suggests that utilization rates were recorded at only 67% in 4Q 2020. So, with consumer confidence levels low and with capacity utilization rates not being high enough, an economy-wide upsurge in investment growth in India at this stage appears unlikely. Chart 3Consumer Confidence In India Is Yet To Return To Pre-2020 Levels
India: Flying Without Wings
India: Flying Without Wings
Chart 4Capacity Utilization Rates In India Are Low And Hovering At Less Than 70% Levels
India: Flying Without Wings
India: Flying Without Wings
Finally, the household sector accounts for about 38% of capital formation and is the only source of hope. Whilst the upper-income segment of India’s household sector may have the financial firepower to support investment growth, the lower income segment is unlikely to be able to drive investments in an environment of poor jobs growth. Large-Scale Unemployment Likely In India’s Unreported Underbelly Unlike most developing and developed countries, data on India’s monthly employment situation is not collected. But piecing together jobs data from a range of sources makes it clear that India’s job market is undergoing a meaningful squeeze. These job losses in India’s mid- and low-income groups will restrain consumption growth in India in FY22. GDP growth not translating into employment growth: The last pan-India employment survey was conducted in 2019. An analysis of these historical surveys suggests that India’s high GDP growth rate has not been translating into high employment growth in India for a while. The formal employment data could be understating the extent of unemployment in India and even the official unemployment rate has not fallen despite high GDP growth (Chart 5). Chart 5Even When Gdp Growth Is High, Unemployment Rates In India Remain Elevated
India: Flying Without Wings
India: Flying Without Wings
Chart 6For Most Of India’s Population, Business Relevance Of Education And Digital Preparedness Is Poor
India: Flying Without Wings
India: Flying Without Wings
Unless India’s manufacturing sector grows rapidly, the widening rift between India’s GDP growth rate and jobs growth rate could become a structural phenomenon. Whilst labor supply in India is large, only part of this can be absorbed into India’s fast-growing service sector, as the business relevance of education as well as the digital preparedness of India’s labor force is low (Chart 6). Job losses in the informal sector: According to the Centre for Monitoring Indian Economy (CMIE), a private firm, India’s unemployment rate was recorded at 11.9% as at June 1, 2021. Even before the second COVID-19 wave and related lockdowns began, this metric was recorded at an elevated level of 7.5% over Dec 2020 to Feb 2021. Most of the job losses that have occurred are likely to be concentrated in the informal or unorganized sector, which employs 80% of India’s workforce. Rural wage inflation collapse points to excess supply: The supply of labor in the informal sector has increased at a faster pace than demand as evinced by the slowdown in rural wage inflation in India from an average of 12% over 2008-19 to 5% over 2019. This dynamic has worsened amid the pandemic as rural wage inflation fell to 2% in 2021YTD. This is after a challenging 2020 when unorganized sector wages could have contracted by 22%, according to a study conducted by the International Labor Organization (ILO). Informal sector’s market share loss suggests demand may stay weak: The Indian economy over the last five years has been undergoing a rapid pace of formalization. This was triggered by government action including the “de-monetization” move in 2016 (which outlawed high denomination notes that were in circulation) and then the introduction of the goods and services tax regime in 2017 (which discourages businesses from working with informal, non-tax paying businesses). The trend of formalization was then cemented in the pre-pandemic years by the fact that the economic health of the informal sector’s consumer was worsening. The formal sector on the other hand caters to a relatively high-income consumer whose incomes/jobs grew at a steady clip. The pandemic expedited this trend of formal sector businesses gaining market share as access to finance from unorganized sources either dried up or became prohibitively expensive, thereby leading to another wave of causalities in the informal sector. Also, it is worth noting that formal sector businesses tend to be more efficient and need fewer hands to generate each unit of profit so even as this sector grows it needs fewer workers. This trend of formalization has been particularly true for the retail, financial, building materials and real estate sectors in India, where the informal sector has shrunk and left behind a trail of job losses. Bottom Line: India’s growth prospects in FY22 could disappoint. With government finances strained and private demand weak, investment growth in FY22 is likely to decelerate. Additionally, employment growth is likely to stay low, especially for informal workers, as the economy rapidly formalizes. Given that wage growth has not slowed down for the top income strata as much as for the bottom, it is this top income group’s consumption growth which is likely to support consumption in FY22. However, the bulk of household consumption will falter. The interplay of these forces will mean that the two prime drivers of India’s growth engine, consumption and investment, will stay constrained in the short run. In view of these factors, we highlight the risk of India’s GDP growth rate in FY22 undershooting the Indian central bank’s forecast of 10.5% by 200-350bps. Now it is tempting to think that even a 7.5% real GDP growth rate appears decent compared to peers. But it is critical to note that India’s headline GDP growth data in FY22 has an unusual padding built into it. Strong low base effect: Whilst emerging markets’ GDP growth contracted by 2.2% in 2020 as per IMF, India’s GDP contracted by 7.3%. So, the contraction experienced by India in 2021 was 3x times more than that experienced by peer countries. FY22 GDP comparison with FY21 makes growth appear high, when it is not: If India’s GDP growth rate in FY22 were to be recorded at 8%, then this would in fact imply no growth over the real GDP recorded in FY20. COVID-19 Effect: The Road To Economic Normalcy Will Be Long Whilst the second wave of the pandemic has peaked in India, the time required for this peak to turn into a trough could take longer than was the case last year. Furthermore, India’s slow vaccine roll-out (particularly in India’s large states) adds to the probability of a potential third wave. The Second Wave In India Was 3.6 Times Stronger Than First Chart 7Second COVID-19 Wave Was 3.6x Stronger
India: Flying Without Wings
India: Flying Without Wings
The virus in the second wave has been far more virulent and necessitated another wave of lockdowns. In specific, the peak COVID-19 deaths during the second wave were recorded at 4,188 deaths per day (on a 7-day moving average basis), which is 3.6 times greater than the peak hit last year (Chart 7). Also, a range of sources2 suggest that actual daily deaths in India could be 1.5-2x the stated numbers. Given that this wave has been stronger, the journey to the trough too is likely to be longer and thus may need localized lockdowns to stay in place. Headline Vaccination Rates Hide Vast Regional Disparities Only 15% of India’s population has received at least one dose. Headline vaccination rates conceal the slow pace of vaccination underway in some of India’s largest states (Chart 8). For instance, less than 8% of the population has been given its first dose in India’s most populous state (i.e. Uttar Pradesh). Given that state borders are porous, persistently low vaccination rates in large states can allow the virus to spread and mutate. Chart 8India’s Largest States Are Lagging On Vaccinations
India: Flying Without Wings
India: Flying Without Wings
Even today only 3% of India’s population has received both doses of vaccines. Even as the government plans to vaccinate all of India’s adult population by December 2021, this goalpost could have to be shifted to early 2022. A Loaded State Election Calendar Cometh In 2022 Looking into 2022, the state election calendar will get busier than it was this year. This could be a problem if vaccination rates are slow because elections involve large-scale rallies and gatherings. It is worth noting that: Five state elections that account for about 20% of India’s population were held in 2021. Elections will be due in seven states that account for about 25% of India’s population in 2022. To provide context, the population involved in state elections in India in 2021 was almost equivalent to that of a national election in Brazil. The states in India undergoing elections in 2022 have a population comparable to the United States. Besides involving a larger population, state elections due in 2022 will also have higher political stakes. This is mainly because in five of the seven states, the ruling Bharatiya Janata Party (BJP) is the incumbent party and will want to defend its status. This contrasts with the 2021 elections when the BJP was the incumbent in only one of the five states. In specific, India’s most populous state, Uttar Pradesh, is scheduled to undergo elections in February 2022. This is easily the most important state election in India and will be a high stakes four-cornered contest. Vaccine rates in this state are currently lagging the national average. Bottom Line: During the first wave, it took about five months for the trough to form after the peak in September 2020. The current wave has been significantly stronger (causing 4x more deaths) with vaccine rates too being low. Therefore, this wave may take longer than 5-6 months to subside. The long road to the trough in turn implies that the road to economic normalcy too may be slower than anticipated. Investment Takeaways Chart 9India's Outperformance Since March 2020 - Driven More By P/E Expansion, Less By Earnings
India's Outperformance Since March 2020 - Driven More By P/E Expansion, Less By Earnings
India's Outperformance Since March 2020 - Driven More By P/E Expansion, Less By Earnings
The Indian stock market has outperformed relative to emerging markets (Chart 9). Given that we are increasingly worried about India’s growth capabilities, we will close our Long Indian / Short Chinese Equities trade for a gain of 11.7%. Tactically, excessive policy tightening remains a genuine risk for the Chinese economy. Incidentally, we also expect that the looming US-Iran diplomatic détente will weigh on bullish fundamentals for oil in the second half of the year, which would be good for Indian stocks. However, the pair trade is challenged from a technical perspective and so we will book gains and move to the sidelines for now. Moreover to mitigate the effects of the coming growth slowdown in India on client portfolios, we recommend initiating two sectoral trades, namely Short India Banks and Long India Consumer Discretionary. Our Emerging Markets Strategy has shown that Indian private banks have higher efficiency and better balance sheets vis-à-vis EM banks. Our concern is that markets have already priced this dynamic. Specifically, Indian banks’ return on equity has seen a sharp drop from pre-pandemic levels and yet valuations remain high (Chart 10). As GDP growth in India slows, credit growth will stay low. This along with rising domestic interest rates could mean that banks’ net interest margins disappoint. As India’s broader consumption story disappoints and a K-shaped recovery takes shape, we expect a limited set of high-income services and business sector professionals to drive demand for high end-consumer discretionary products. So these two sectoral trades tap into the differential growth rates that two different segments of the economy are set to experience. Finally, we recommend closing the Long Indian Local Currency Bond / Short EM Bonds trade which is currently in the money. This is for two sets of reasons. Firstly, history points to a tight correlation between the US 10-year bond yield and Indian local currency denominated 10-year bond yields. As the US 10-year yield moves upwards, we expect Indian yields also to inch higher. Secondly, we worry that India’s fiscal response to the pandemic has been relatively small thus far and so India could opt for an unexpected expansion in its fiscal deficit over the next 12 months (Chart 11). Chart 10Indian Banks Appear To Be Factoring In All Positives
India: Flying Without Wings
India: Flying Without Wings
Chart 11India’s Fiscal Response To The Pandemic Has Been Relatively Small So Far
India: Flying Without Wings
India: Flying Without Wings
Ritika Mankar, CFA Editor/Strategist ritika.mankar@bcaresearch.com Footnotes 1Daron Acemoglu and James Robinson, Why Nations Fail: The Origins of Power, Prosperity, and Poverty (New York: Crown, 2012) 2Please see Jeffrey Gettleman, Sameer Yasir, Hari Kumar, and Suhasini Raj, “As Covid-19 Devastates India, Deaths Go Undercounted,” New York Times, April 24, 2021, nytimes.com and Murad Banaji, “The Importance of Knowing How Many Have Died of COVID-19 in India,” The Wire, May 9, 2021, science.thewire.in.
Weekly Performance Update For the week ending Thu Jun 03, 2021 The Market Monitor displays the trailing 1-quarter performance of strategies based around the BCA Score. For each region, we construct an equal-weighted, monthly rebalanced portfolio consisting of the top 3 stocks per sector and compare it with the regional benchmark. For each portfolio, we show the weekly performance of individual holdings in the Top Contributors/Detractors table. In addition, the Top Prospects table shows the holdings that currently have the highest BCA Score within the portfolio. For more details, click the region headers below to be redirected to the full historical backtest for the strategy. BCA US Portfolio
Market Monitor (Jun 3, 2021)
Market Monitor (Jun 3, 2021)
Total Weekly Return BCA US Portfolio S&P500 TRI 0.08% -0.15% Top Contributors FLO:US ET:US PSA:US WES:US UGI:US Weekly Return 18 bps 15 bps 10 bps 10 bps 9 bps Top Detractors PCH:US WY:US LPX:US LH:US WAT:US Weekly Return -16 bps -15 bps -14 bps -11 bps -7 bps Top Prospects TX:US BRK.A:US ANAT:US UHAL:US ESGR:US BCA Score 99.36% 98.92% 98.48% 97.15% 95.72% BCA Canada Portfolio
Market Monitor (Jun 3, 2021)
Market Monitor (Jun 3, 2021)
Total Weekly Return BCA Canada Portfolio S&P/TSX TRI 0.24% 0.89% Top Contributors PXT:CA DSG:CA LNR:CA WEED:CA TOU:CA Weekly Return 27 bps 19 bps 11 bps 10 bps 10 bps Top Detractors AUP:CA CS:CA IFP:CA CFP:CA TOY:CA Weekly Return -30 bps -24 bps -20 bps -16 bps -14 bps Top Prospects CS:CA IFP:CA CFP:CA RUS:CA GWO:CA BCA Score 99.89% 99.69% 99.24% 98.78% 96.02% BCA UK Portfolio
Market Monitor (Jun 3, 2021)
Market Monitor (Jun 3, 2021)
Total Weekly Return BCA UK Portfolio FTSE 100 TRI 1.29% 0.71% Top Contributors ROSN:GB CNE:GB MTO:GB BYG:GB HSBK:GB Weekly Return 23 bps 18 bps 13 bps 11 bps 11 bps Top Detractors NLMK:GB FDM:GB FDEV:GB SVST:GB RMG:GB Weekly Return -6 bps -5 bps -4 bps -3 bps -3 bps Top Prospects SVST:GB NLMK:GB RMG:GB GLTR:GB BPCR:GB BCA Score 99.82% 98.66% 96.97% 96.53% 95.28% BCA Eurozone Portfolio
Market Monitor (Jun 3, 2021)
Market Monitor (Jun 3, 2021)
Total Weekly Return BCA EMU Portfolio MSCI EMU TRI 1.05% 1.13% Top Contributors CNV:FR OMV:AT GTT:FR MONT:BE MELE:BE Weekly Return 24 bps 19 bps 15 bps 12 bps 12 bps Top Detractors RIN:FR NOS:PT TIETO:FI IRE:IT SOL:IT Weekly Return -13 bps -11 bps -7 bps -6 bps -4 bps Top Prospects SOLV:BE STR:AT POST:AT BB:FR SOL:IT BCA Score 99.19% 98.49% 98.20% 97.47% 97.09% BCA Japan Portfolio
Market Monitor (Jun 3, 2021)
Market Monitor (Jun 3, 2021)
Total Weekly Return BCA Japan Portfolio TOPIX TRI 1.78% 2.57% Top Contributors 5021:JP 1925:JP 8117:JP 7958:JP 6345:JP Weekly Return 26 bps 23 bps 16 bps 16 bps 15 bps Top Detractors 4694:JP 9436:JP 2281:JP 4544:JP 3291:JP Weekly Return -11 bps -7 bps -5 bps -5 bps -3 bps Top Prospects 5930:JP 9436:JP 4966:JP 3291:JP 5451:JP BCA Score 99.06% 99.01% 98.65% 98.59% 98.38% BCA Hong Kong Portfolio
Image
Total Weekly Return BCA Hong Kong Portfolio Hang Seng TRI 2.91% -0.39% Top Contributors 3600:HK 316:HK 6118:HK 3329:HK 2232:HK Weekly Return 92 bps 51 bps 44 bps 31 bps 23 bps Top Detractors 856:HK 148:HK 435:HK 1798:HK 303:HK Weekly Return -18 bps -10 bps -9 bps -9 bps -8 bps Top Prospects 990:HK 323:HK 1606:HK 1258:HK 811:HK BCA Score 99.47% 98.75% 98.69% 97.22% 97.19% BCA Australia Portfolio
Market Monitor (Jun 3, 2021)
Market Monitor (Jun 3, 2021)
Total Weekly Return BCA Australia Portfolio S&P/ASX All Ord. TRI 0.92% 2.28% Top Contributors PDN:AU GRR:AU BLX:AU CAJ:AU AST:AU Weekly Return 42 bps 18 bps 12 bps 9 bps 6 bps Top Detractors JLG:AU MNF:AU HSN:AU PIC:AU SRV:AU Weekly Return -15 bps -14 bps -8 bps -5 bps -3 bps Top Prospects GRR:AU MGX:AU CIA:AU JLG:AU BFG:AU BCA Score 98.95% 98.89% 98.55% 96.96% 96.83%
Tactically Bearish, Cyclically Bullish
Tactically Bearish, Cyclically Bullish
In today’s Sector Insight report, we take the opportunity to summarize our views on the US equity market return expectations across different investment horizons. And by doing so help clients reconcile our views with the other BCA publications. Currently, US Equity Strategy is cyclically (6 to 12 months investment horizon) bullish on the prospects of the broad equity market. The reasons for that are numerous: Pent up demand does not show signs of waning, supply chain bottlenecks are yet to be resolved, and stimulus checks and excess savings are yet to be spend. All of the above is to contribute to robust earnings growth which we expect to surprise on the upside, just like during Q1-2021 earnings season. Looking ahead we do not anticipate a recession but only a modest slowdown in a current fast pace of economic growth. This business cycle bull market rally has not run its course. Having said that, we believe that in the near term the market is ripe for a correction. It is fully valued, if not outright expensive: nearly 50% of all industries have PEs ranking in top 10 percentile of their ten-year history. There is simply not much valuation cushion left to absorb any negative shocks. More specifically, there are two major risks that can serve as a catalyst for a selloff: 1) Fed may surprise the market with hawkish rhetoric if jobs data exceeds expectations or inflation exhibits a staying power; 2) China growth deceleration surprises further on the downside. And these are just the known risks. Further, we are mindful of the SPX risk/reward profile over the next 3-6 months. The market expects EPS NTM of $196 and if we assume an optimistic 22x forward P/E multiple, this equates to SPX target of 4,312 over the next 3-6 months. This is a 3% upside from the current level of 4200. Deploying new capital at these levels of valuations and with a limited upside is like picking up pennies in front of a steamroller. Our recommendation is to raise dry powder by taking profits from some of the recent winners like industrials and basic materials, and redeploying capital during the next market pullback which would provide a more favorable risk/return profile. Bottom Line: We remain cyclically bullish on the prospects of the broad equity market, but are keeping our guard up in the near-term.
On Friday 4th June, I will be debating my colleague Peter Berezin on the future of cryptocurrencies. I believe that the cryptocurrency asset-class has substantial further price upside, whereas Peter thinks that it is going to zero. So please join us for what will be a lively debate on Friday 4th June at 10am EDT, (3pm BST, 4pm CEST). Dhaval Joshi Feature Chart of the WeekThe Fractal Structure Of Cryptos Had Become Very Fragile
The Fractal Structure Of Cryptos Had Become Very Fragile
The Fractal Structure Of Cryptos Had Become Very Fragile
Today’s report is a brief review and update of the 22 short-term trades that we have recommended through the past three months, and it demonstrates the power of Fractals: The Competitive Advantage In Investing. At the end of the report we also introduce a new trade. Our 22 recommendations have comprised 10 structured trades – which include profit-targets, symmetrical stop-losses, and expiry dates – plus a further 12 recommendations without structured exit points. In summary, three structured recommendations have hit their profit targets: short NOK/PLN +2.6 percent, long European Personal Products versus Autos +15 percent, and long Finland versus Sweden +4.7 percent. Two open trades are in profit, and one is flat. Against this, two structured recommendations hit their stop-losses: short GBP/JPY -2.2 percent, and long New Zealand versus MSCI ACWI -4 percent. Meanwhile, long China versus Netherlands reached its expiry date at a slight loss -1.8 percent. And one open trade is in loss. This results in a ‘win ratio’ at a commendable 55 percent – counting a ‘full win’ as hitting the profit target, a ‘full loss’ as hitting the symmetrical stop-loss, and pro-rata for partial wins and losses. The win ratio at 55 percent is commendable because, in recent months, all financial assets been strongly correlated to the ebb and flow of bond yields and the ‘reflation trade’ – as we highlighted in The Pareto Principle Of Investment. This has made the current environment a difficult one to find genuinely independent investment ideas. Even more commendably, the 12 unstructured recommendations, which included Bitcoin, Ethereum, and several commodities, have all anticipated exhaustions or sharp reversals. The sections below review the structured and unstructured recommendations in chronological order. The 10 Structured Recommendations 1. 18th March: Short NOK/PLN Achieved its +2.6 percent profit target. 2. 25th March: Short GBP/JPY Hit its -2.2 percent stop-loss. 3. 1st April: Long European Personal Products vs. European Autos Achieved its +15 percent profit target. 4. 15th April: Long China vs. Netherlands Expired at -1.8 percent (versus its +5 percent profit target). 5. 15th April: Long Finland vs. Sweden Achieved its +4.7 percent profit target. 6. 22nd April: Long New Zealand vs. MSCI ACWI Hit its -4 percent stop-loss. 7. 6th May: Short Building and Construction (PKB) vs. Healthcare (XLV) In profit, and we expect further upside (Chart I-2). Chart I-2Short Building And Construction Versus Healthcare
Short Building And Construction Versus Healthcare
Short Building And Construction Versus Healthcare
8. 6th May: Short France vs. Japan In loss, but we expect upside. 9. 13th May: Long USD/CAD Flat, but we expect upside. 10. 20th May: Long 10-year T-bond vs. 10-year TIPS In profit, and we expect further upside (Chart I-3). Chart I-3Short Inflation Expectations
Short Inflation Expectations
Short Inflation Expectations
The 12 Unstructured Recommendations 1. 18th March: Stocks vs. Bonds (MSCI ACWI vs. 30-year T-bond) to consolidate As anticipated, global stocks have consolidated versus bonds since mid-March, and we expect the consolidation to continue. 2. 18th March: Long 30-year T-bond Likewise, exactly as anticipated, bond prices have rebounded since mid-March, and we expect the rebound to continue (Chart I-4). Chart I-4Bond Prices To Rebound
Bond Prices To Rebound
Bond Prices To Rebound
3. 25th March: Tactically short Bitcoin Bitcoin subsequently corrected by almost 40 percent, but the correction is mostly done (Chart I-1). 4. 25th March: Tactically short Ethereum Likewise, Ethereum subsequently corrected, but the correction is mostly done. 5. 15th April: Short Taiwan vs. China Taiwan subsequently corrected versus China, but the correction is mostly done. 6. 22nd April: Short PKR/USD As anticipated, PKR/USD corrected in the subsequent month. 7. 6th May: Short Corn vs. Wheat 8. 6th May: Short Timber (Chart I-5) Chart I-5Short Timber
Short Timber
Short Timber
9. 13th May: Short Soybeans 10. 20th May: Short Copper 11. 20th May: Short Tin 12. 27th May: Short Iron Ore As anticipated, all the above commodities have corrected, and in some cases very sharply. But the correction is still underway. New Recommendation Finally, this week’s new recommendation comes from the MSCI world equity index universe. The massive outperformance of Austria versus Chile – in large part due to the different sector compositions of the two markets – is fragile on all fractal dimensions: 65-day, 130-day, and 260-day (Chart I-6). Chart I-6Short Austria Vs. Chile
Short Austria Vs. Chile
Short Austria Vs. Chile
Accordingly, the recommendation is to short Austria versus Chile, setting the profit target and symmetrical stop-loss at 7 percent. Dhaval Joshi Chief Strategist dhaval@bcaresearch.com Fractal Trading System Fractal Trades 6-Month Recommendations Structural Recommendations Closed Fractal Trades Closed Trades Asset Performance Equity Market Performance Indicators To Watch - Bond Yields Chart I-1Indicators To Watch - Bond Yields ##br##- Euro Area
Indicators To Watch - Bond Yields - Euro Area
Indicators To Watch - Bond Yields - Euro Area
Chart I-2Indicators To Watch - Bond Yields ##br##- Europe Ex Euro Area
Indicators To Watch - Bond Yields - Europe Ex Euro Area
Indicators To Watch - Bond Yields - Europe Ex Euro Area
Chart I-3Indicators To Watch - Bond Yields ##br##- Asia
Indicators To Watch - Bond Yields - Asia
Indicators To Watch - Bond Yields - Asia
Chart I-4Indicators To Watch - Bond Yields ##br##- Other Developed
Indicators To Watch - Bond Yields - Other Developed
Indicators To Watch - Bond Yields - Other Developed
Indicators To Watch - Interest Rate Expectations Chart I-5Indicators To Watch - Interest Rate Expectations
Indicators To Watch - Interest Rate Expectations
Indicators To Watch - Interest Rate Expectations
Chart I-6Indicators To Watch - Interest Rate Expectations
Indicators To Watch - Interest Rate Expectations
Indicators To Watch - Interest Rate Expectations
Chart I-7Indicators To Watch - Interest Rate Expectations
Indicators To Watch - Interest Rate Expectations
Indicators To Watch - Interest Rate Expectations
Chart I-8Indicators To Watch - Interest Rate Expectations
Indicators To Watch - Interest Rate Expectations
Indicators To Watch - Interest Rate Expectations
Highlights President Biden’s FY2022 budget largely confirms consensus views of the economy – which means that it overrates the government’s tax-collecting powers and underrates its fiscal profligacy. The US fiscal thrust will turn negative as the budget deficit contracts in the coming years but the private economic recovery looks robust and positive government spending surprises will mitigate the fiscal cliff. The Biden administration may attempt to pass its capital gains tax hike in the next budget reconciliation bill and make it retroactive to 2021. We doubt this will occur but investors will need to book some profits to be on the safe side. Big Tech still faces a “slow boil” when it comes to government regulation. Stay long materials and infrastructure relative to tech. We were stopped out of our long energy large caps trade. The energy sector is still a beneficiary of a strong macro backdrop for oil and commodities. Close our long municipal bonds trade for a gain of 2%. Feature President Biden’s budget proposal for fiscal 2022 is a confirmation of macro policy trends that the market is well aware of and has already priced. The presidential budget, released on May 27, is a symbolic document. Congress controls the purse strings and congressional dynamics will work out differently from what the White House intends. Still, the budget is significant for highlighting the administration’s big spending preferences and the critical structural theme: the return of Big Government. That is not to say that Biden will fail to overcome various checks and balances with regard to his major legislative priorities, the American Jobs Plan (AJP) and American Families Plan (AFP). Biden’s measurable political capital is still moderate-to-strong. His popular approval remains above 50% and slightly improved in the latest opinion surveys (Chart 1). It should stay above the halfway line as the economy recovers. Chart 1ABiden’s Approval Rating Holding Up
Forget Biden's Budget
Forget Biden's Budget
Chart 1BBiden’s Approval Rating Holding Up
Forget Biden's Budget
Forget Biden's Budget
Consumer confidence improved again in May, on the back of what promises to be a rollicking disease-free summer for households. Political polarization continued to abate in the wake of the contested 2020 election. It may be hitting resistance levels (we expect polarization to remain elevated despite dropping off from Trump-era peaks) but the market implications will only become relevant after Biden’s legislative agenda grinds to a halt following the passage of his second reconciliation bill. Polarization will revive around September with the debt ceiling and the 2022 budget appropriations process and ahead of the 2022 midterm elections, which have a subjective 75% chance of gridlocking Congress. But that time has not yet come and Biden is still capable of signing one or two major bills into law. New data on government spending underscores the big government trend. Fiscal thrust – in this case the unadjusted change in the budget deficit – grew substantially in the first quarter of 2021 relative to the fourth quarter of 2020. It went from 4.6% of GDP in Q4 to 13.1% of GDP in Q1, an increase of 8.5%. The budget deficit will contract in the coming years, a headwind for the economy, but not too dangerous of a headwind as long as the private economy continues to recover, as it should. Real wages are growing at a steady pace, leaping up from a 1.9% growth rate in November to 11.7% in April. What is more notable is the continued decline in consumer loan delinquencies from 1.8% to 1.7% in the first quarter – i.e. flat and marginally declining. It is impressive that the US suffered a recession without considerable consumer or business bankruptcies or delinquencies. When government support ends – when the moratorium on home evictions expires this month and unemployment insurance dries up in September 6 – it will be critical to watch for an increase in distress to determine if the Fed will become more or less inclined to taper asset purchases, the preliminary to raising interest rates. Given that the pandemic caused the recession, and that the pandemic is ebbing on the back of vaccinations, our base case is that the private economy will recover even as government support declines. Most of the good news of the US recovery and government stimulus is priced into the market. Investors will now focus on the Federal Reserve and the passage of Biden’s two big bills. We agree with the BCA House View that the Fed will deliver dovish surprises despite the improving economy as it cannot afford to renege on its new monetary policy strategy but must convince the market that it remains dedicated to an inflation overshoot. Biden’s Budget In A Few Simple Charts Biden’s first presidential budget projects a sea change in US government spending, a “normalization” in US government taxation (reversal of President Trump’s tax cuts), and an economy whose underlying conditions remain the same despite the policy sea change. In reality the economy will respond to the sea change in policy. Real economic growth is projected to slow from 5.2% this calendar year to 4.3% in 2022 and then to settle at around 2% through 2031 (Chart 2). This is in line with forecasts from the Congressional Budget Office and consensus expectations of potential GDP growth. Productivity and labor force growth, which make up potential GDP, are hard to predict. We would note that the Biden administration has drastically cut back on immigration law enforcement. It will be hard to dislodge the Democrats in 2024 given that the economy will be robust and the Republican Party is divided. Therefore immigration policy will not undergo a substantial tightening at least through 2028, though bipartisan immigration reform is possible after 2022 and would marginally tighten inflows. Chart 2Presidential Budget Growth Rate Assumption
Forget Biden's Budget
Forget Biden's Budget
Meanwhile a substantial increase in federal funding for infrastructure, research and development, and STEM education could improve productivity later in the decade, if only on a cyclical rather than structural basis. In other words the administration is not too optimistic regarding growth assumptions even though it assumes higher growth than the Fed or CBO. Inflation is expected to peak at 2.3% in 2025 and continue at that rate throughout the decade (Chart 3). We will not enter into the inflation debate here. Suffice it to say that the risk lies to the upside despite the above points regarding potential growth. Republican voters have abandoned any semblance of fiscal austerity, as signified by President Trump’s success, while the Democrats under Biden are flirting with modern monetary theory. The Fed has adopted a new monetary policy that is aimed at fighting deflationary tail risks at all costs. The budget deficit and trade deficit are ballooning and the US dollar is weakening. The US has fundamentally shifted trade policy, at least with regard to China, which is pushing up input costs. Chinese and global demographics imply a falling ratio of workers to dependents, which implies a secular rise in wages. Chart 3Presidential Budget Inflation Assumption
Forget Biden's Budget
Forget Biden's Budget
In terms of taxing and spending, the presidential budget is overly optimistic about the ability of the federal government to maintain policy orthodoxy. Budgetary receipts are expected to rise on Biden’s tax hikes and the expiration of the Trump tax cuts in 2025. This is exaggerated, since Biden has already said he will accept a corporate tax hike half as large as that in the budget (25% instead of 28%). It is true that finding the votes to extend the Trump tax cuts will be politically difficult and the expiration date arrives at the beginning of a new administration in a non-election year when some fiscal tightening is manageable. But the projection that spending will stay stable at less than 25% of GDP despite Biden’s “Great Society”-style spending is infeasible (Chart 4). Chart 4Presidential Budget Tax-And-Spend Assumptions
Forget Biden's Budget
Forget Biden's Budget
Major spending cuts are far less likely in the foreseeable future than they were back in 2011, when the Budget Control Act was passed. True, Republicans will rediscover their fiscal rectitude in the opposition. But in a social environment of populism and anti-austerity they will either fail to obtain full control of Congress or they will fail to execute deep spending cuts. The party’s political base is now the working class so it will have to rethink cuts to entitlements (mandatory spending), just as it is already rethinking its commitment to corporate tax cuts. Democrats will not cut mandatory or non-defense discretionary spending and will oppose any Republican efforts aggressively (Chart 5). Chart 5Presidential Budget Mandatory Versus Discretionary Spending
Forget Biden's Budget
Forget Biden's Budget
While the presidential budget envisions stable defense spending, the truth is that the one area where Republicans are likely to succeed in influencing fiscal policy substantially lies in defense, which will grow. The US is phasing out its “small wars” and focusing on struggle among the Great Powers. Biden anticipates that defense spending will be flat while non-defense rises sharply but this is unlikely to occur. Regardless of Biden’s specific budget, the US is engaged in the largest government spending since the 1940s and yet there is neither a Great Depression nor a World War II taking place. However, this extravagant peacetime spending looks less extravagant when one considers that there are some historical parallels to the 1930s-40s. There have been two major economic shocks over the past 13 years and there is an emerging cold war with China. The US public has taken a populist turn, the political establishment is determined to provide more largesse to win back the hearts and minds of the people, and the defense and intelligence establishment are well aware of the rising security threats from China and Russia. Federal spending will persistently surprise to the upside while tax hikes could be stymied as early as the 2022 midterm elections. The result is a larger-than-expected budget deficit. The implication for the short-to-medium term is higher inflation and a weaker US dollar. But soaring geopolitical conflict and China’s structural slowdown will eventually put a floor under the dollar. Fiscal Thrust And Budget Deficit Projections Financial markets are already pretty well aware of these trends. The FY2022 presidential budget, which assumes that Biden’s entire legislative agenda passes Congress, does not project a budget deficit that is very different from a back-of-the-envelope “Status Quo” scenario, which assumes that the American Jobs and Families Plans do not pass (Chart 6). Chart 6Presidential Budget Deficit Scenario Alongside Previous Scenarios
Forget Biden's Budget
Forget Biden's Budget
Of course, the AJP, at least, is likely to pass. If a bipartisan deal is struck this week or shortly thereafter then full passage is possible by the end of July. The Democrats would then spend the entire fall legislative session crafting a bill that combines some of the remaining portions of the AJP with the high-priority parts of the AFP into a single budget reconciliation bill that would be likely to pass by Christmas or early 2022. Nevertheless Biden’s budget reveals that there is not much distance in budget deficit projections with regard to the AFP (Chart 7). Even though the price tag of the AFP is huge, at $1.8 trillion, the truth is that it will be watered down in negotiation and it will also be accompanied by at least some tax hikes. Thus the market already has most of the information it needs regarding US budget deficit projections. Everything else depends on events in the private economy and external sector. The good news of the US budget deficit blowout is largely priced. Future upward surprises in the deficit, which we expect, serve to mitigate the contraction in the budget deficit, i.e. to reduce the negative fiscal thrust that drags on the economy as stimulus wanes. In other words the looming “fiscal cliff” is probably overrated from an economic point of view even though it may contribute to a pullback in the stock market. Chart 7Small Difference Between Biden’s Two Plans
Forget Biden's Budget
Forget Biden's Budget
Changes In The Post-Infrastructure Agenda After Biden passes his infrastructure plan (the AJP), whether via bipartisanship or reconciliation, the AFP presents a much tougher political slog in Congress. The revised AFP promises to be a Frankenstein monster of social spending – a new “Alphabet Soup” of government programs including affordable child care, elderly care, universal pre-kindergarten schooling, subsidized community college, and paid leave. It will have to be pared back somewhat to appease moderate Democratic senators. The administration has tried to pitch the new social spending as “human infrastructure,” since infrastructure is more popular than welfare, but while Democrats accept this rhetorical gimmick, a majority of independent voters (along with opposition Republicans) apparently do not (Chart 8). Still the AFP could very well pass before the midterm on the condition that Biden signs the AJP this summer. We stick with our 50/50 odds for now. Chart 8Much Tougher Slog On Social Spending Bill
Forget Biden's Budget
Forget Biden's Budget
The presidential budget introduced a new risk regarding the impending capital gains tax hike: the possibility that it will be enacted retroactively, taking effect in 2021, rather than in 2022 or thereafter as expected. The administration proposes to raise the long-term capital gains rate to 39.6%, which, combined with the Obamacare surtax of 3.8% would result in a 43.4% rate on capital gains for investors making over $1 million. A compromise will be necessary but the top rate could still end up above 32%. If Biden completes a bipartisan infrastructure deal this summer then he is much more likely to get this and other individual tax hikes into the reconciliation bill at the end of this year. Retroactivity is possible but it would be bad politics ahead of the midterm election. Therefore we stick with our view that individual tax hikes will take effect in 2023 if at all. But from a prudential perspective, investors will have to book some gains to prepare for negative tax surprises and that suggests near-term profit taking could weigh on the stock market (Chart 9). Chart 9A Retroactive Capital Gains Tax?
A Retroactive Capital Gains Tax?
A Retroactive Capital Gains Tax?
Since Biden is guaranteed to get a lot of spending through two or three reconciliation bills (one already passed), he will not get much when it comes to regular appropriations. We are more likely to see the GOP refuse to cooperate on budgetary appropriations. This could lead to a debt ceiling crisis and government shutdown at the end of this year or early next year; hence the aforementioned return of polarization. However, these events will play out very differently from 2011-13. The GOP must tread carefully as they are already divided among pro-Trump and anti-Trump factions and will suffer even worse in public support if they induce a shutdown. A government shutdown would not be market negative in an already highly stimulated economy but it could jeopardize Republican odds in 2022, thus marginally increasing the risk of upward surprises in Democrats’ tax-and-spend policies. Congress is also moving forward on a raft of other legislative proposals, highlighted in Table 1. Most of these proposals will fall short of the bipartisan support necessary to get the required 60 votes in the Senate. The most promising bills involve efforts to resurrect US industrial policy, research and development, technological leadership (particularly in semiconductors), supply chain resilience, and domestic manufacturing. Anything that aims to coordinate the two parties in the face of geopolitical competition with China is likely to pass, as we have highlighted in our sister Geopolitical Strategy service. The result, as mentioned above, is likely to be a cyclical uptick in productivity (we will not speculate here on whether the structural downtrend will be broken). Table 1Pending Legislation In Congress Under Biden
Forget Biden's Budget
Forget Biden's Budget
The Slow Boil Of Tech Regulation In a recent report on the Biden administration’s regulatory threat to the tech sector we argued that while popular opinion and government interest were creating a “slow boil” for Big Tech, nevertheless the reflationary macroeconomic backdrop posed a much larger short-term risk. We stand by this view especially in light of recent developments. In particular, legislative priorities, gridlock in all key agencies, slow movement in the Department of Justice’s staffing, an evenly divided Senate, and a recent Supreme Court judgement against the Federal Trade Commission all lend confirmation to our thesis, at least for now. To elaborate: A bipartisan consensus in public opinion holds that Big Tech needs tougher regulation (Chart 10) and this consensus grew substantially over the controversial 2020 political cycle. However, not all surveys show strong majorities in favor of regulation, even if they show strong majorities are skeptical of Big Tech’s influence. And Republicans and Democrats disagree on the aims of regulation, with Republicans averse to “content moderation,” or ideological censorship, and Democrats eager to retain their advantage in political fundraising from Silicon Valley. Any bill requiring 60 votes in the Senate would be an opportunity for Republicans to demand that their speech and press rights be preserved, which would be a poison pill for Democrats. The lack of cooperation on the proposed commission to investigate the January 6 riot at the US Capitol highlights the inability to bridge the ideological gap. Chart 10Bipartisan Consensus On Tech Regulation
Forget Biden's Budget
Forget Biden's Budget
Most of the Democrats’ political capital will be spent on passing the infrastructure bill and the next budget reconciliation bill. There is limited space for other legislation, aside from the strategic competition with China. Minnesota Senator Amy Klobuchar’s anti-trust efforts, including parts of the Competition and Antitrust Enforcement Reform Act, have some chance of passage. She has proposed steps that Republicans can agree on, such as increasing fees on big mergers to fund anti-trust agencies, preventing anti-competitive pricing, and protecting whistleblowers. Her main bill avoids the debate over censorship and arguably preserves the almighty “consumer welfare” standard for determining where harm has occurred and government intervention may be necessary. Republican Senator Mike Lee of Utah has said some positive things about the bill and argues that it would not replace consumer welfare (though not all Republicans will agree and the judicial system will separately defend the consumer welfare standard). Regulatory reform is far more effective when backed by a new legislative overhaul. For example, reform of Section 230 of the Communications Decency Act becomes more difficult without new legislation. Regulation via the executive branch can be important but requires focus from the president and a strong consensus in key positions in the bureaucracy. Democrats must confirm two nominations to the Federal Communications Commission, which is currently deadlocked, in order to achieve a partisan majority and make headway on policy priorities (Table 2). Cybersecurity, net neutrality, and overseeing broadband internet expansion will compete with any regulatory probes into Big Tech. The Senate will also have to confirm two nominations for the Federal Trade Commission, which is also deadlocked at the moment (Table 3). One of these, for anti-trust scholar Lina Khan, a critic of Big Tech, is in process. Yet the FTC has possibly lost some of its bite after a Supreme Court ruling in April (AMG Capital v. FTC) determined that the agency cannot seek monetary relief under one of its most frequently used legal authorities (Section 13b of the Federal Trade Commmission Act). The FTC will thus lose some ability to impose penalties, particularly in consumer protection cases. Facebook is already attempting to use this ruling to dismiss the FTC’s case against it, which could result in a forced sale of popular subsidiaries WhatsApp and Instagram. Table 2Balance Of Power On The FCC
Forget Biden's Budget
Forget Biden's Budget
Table 3Balance Of Power On The FTC
Forget Biden's Budget
Forget Biden's Budget
As for the Department of Justice, while Biden’s appointments have all been confirmed, the anti-trust division is bogged down by ethics concerns since several officials would have to recuse themselves in cases against Big Tech due to their previous work representing plaintiffs against Big Tech. The bottom line is that Big Tech is in the hot seat after the various controversies of the pandemic and 2016-2020 elections, just as Big Banks faced tougher regulation in the wake of the subprime mortgage crisis. Both public and government willingness to prosecute and regulate Big Tech have gone up, creating a permanently higher level of regulatory risk. Yet government focus and capability are lacking in the short run. Investment Takeaways Most of the major reflation trades have taken a pause in recent weeks, as expected. The stock-to-bond ratio has stalled, the cyclicals to defensives ratio has peaked twice, and TIPS have lost momentum relative to duration-matched nominal treasuries. The big five tech firms’ shares have tentatively arrested their fall relative to the other 495 companies on the S&P500. It is not clear if they will break down further but the above analysis suggests that they will. We are sticking with our long materials / short tech trade (Chart 11). Chart 11Long Materials Versus Technology
Long Materials Versus Technology
Long Materials Versus Technology
Investors should stay invested, maintain pro-cyclical trades, favor value stocks relative to growth stocks, but avoid taking on large new risks in the current environment. The post-vaccine rally has lost steam but the overall macro backdrop remains favorable as the global economy recovers. We are closing our long municipal bonds trade for a gain of 2.3%. Our large cap energy trade has stopped out at -5% with small caps outperforming in the face of regulatory and ESG headwinds for the supermajors. Biden’s regulatory risk to energy small caps has been outweighed by the macro context but will become relevant at some point. Matt Gertken Vice President Geopolitical Strategy mattg@bcaresearch.com Jesse Anak Kuri Associate Editor jesse.Kuri@bcaresearch.com Appendix Table A1USPS Trade Table
Forget Biden's Budget
Forget Biden's Budget
Table A2Political Risk Matrix
Forget Biden's Budget
Forget Biden's Budget
Table A3Political Capital Index
Forget Biden's Budget
Forget Biden's Budget
Table A4APolitical Capital: White House And Congress
Forget Biden's Budget
Forget Biden's Budget
Table A4BPolitical Capital: Household And Business Sentiment
Forget Biden's Budget
Forget Biden's Budget
Table A4CPolitical Capital: The Economy And Markets
Forget Biden's Budget
Forget Biden's Budget
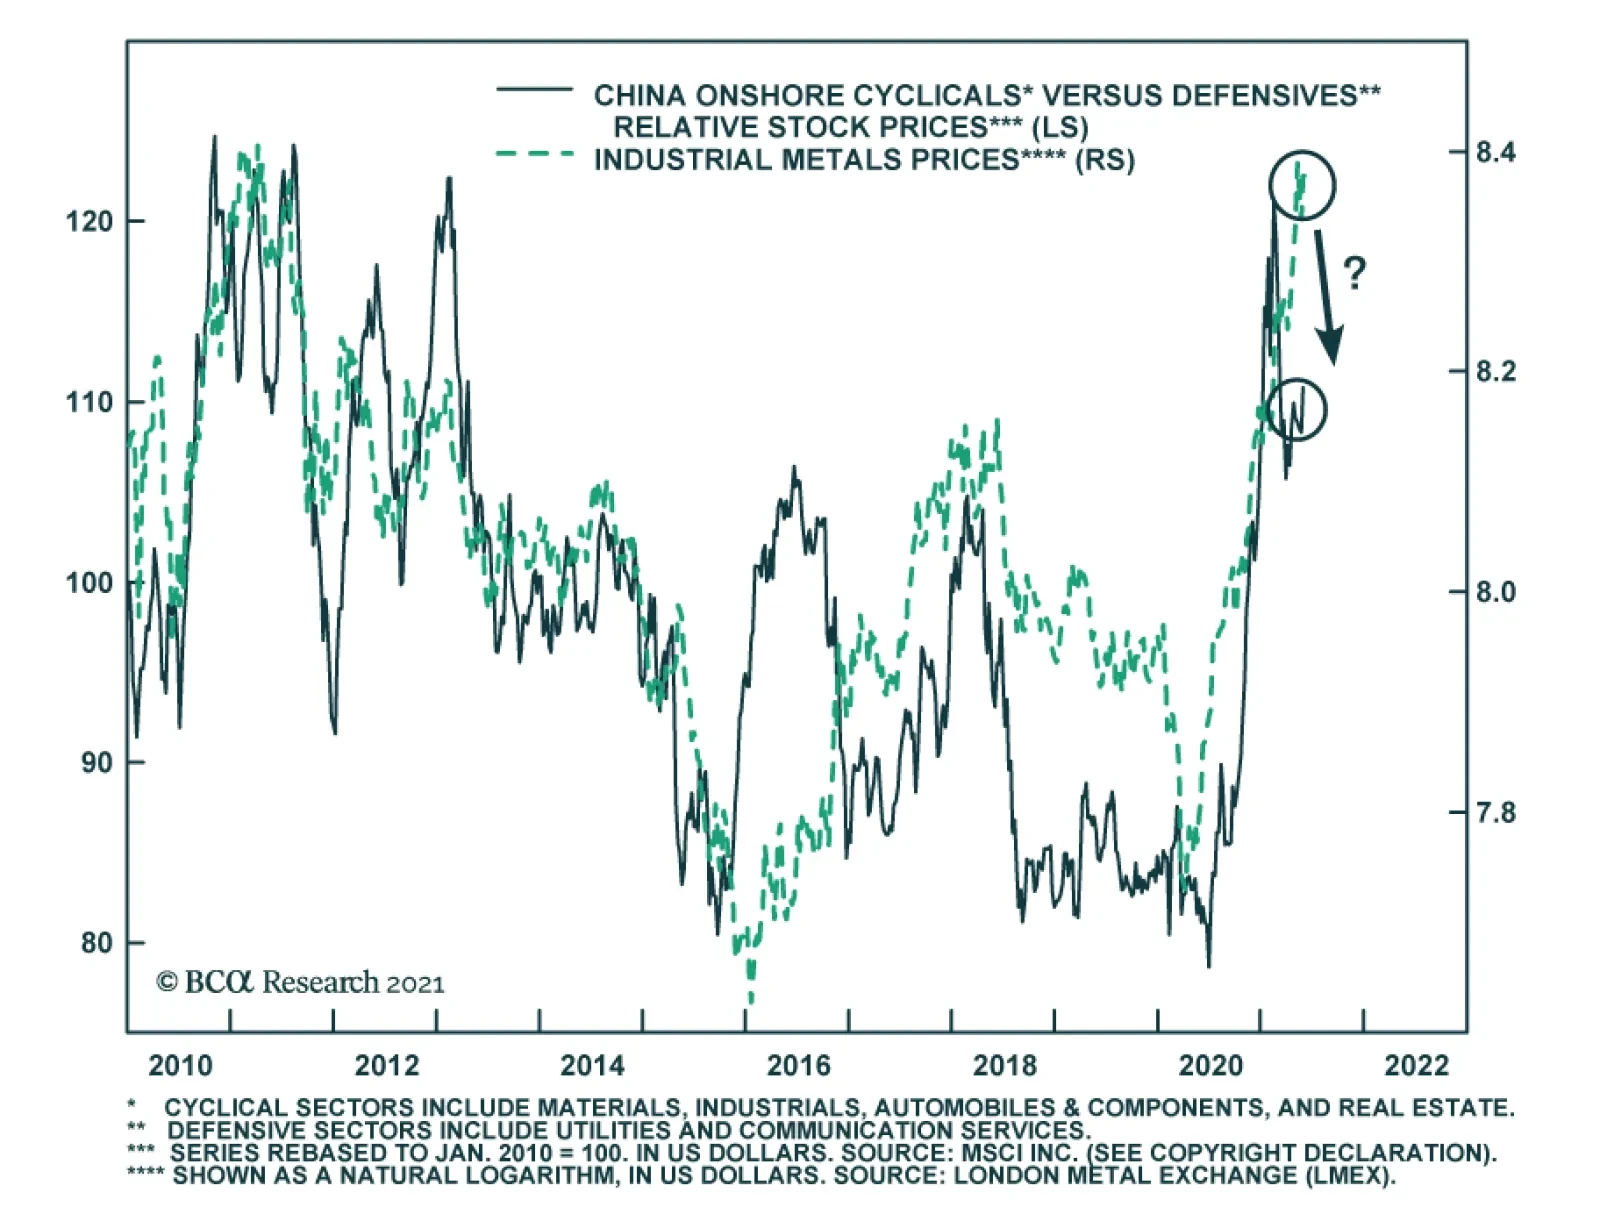
Total Social Financing, a broad measure of Chinese credit growth, has slowed from its peak last October. The current pace of credit growth is broadly in line with nominal GDP growth. The authorities have made it clear that they want to stabilize the ratio of…