Equities
Total Social Financing, a broad measure of Chinese credit growth, has slowed from its peak last October. The current pace of credit growth is broadly in line with nominal GDP growth. The authorities have made it clear that they want to stabilize the ratio of…
The global manufacturing recovery accelerated in May with the Markit Global Manufacturing PMI inching up to an 11-year high of 56. The stronger headline number partially reflects an increase in the pace of new orders to 57.3 from 56.8, while output and…
BCA Research’s European Investment Strategy service introduces its Combined Mechanical Valuation Indicator for European equities to identify extreme valuations at the country and sector level. At present, the Combined Mechanical Valuation Indicator only…

The bull market in global equities is entering a riskier spot. This does not mean that the bull market is ending, but it means that its quality will deteriorate as the frequency and intensity of drawdowns is likely to rise relative to expected returns. …

Dear client, This week, I am conducting a BCA Academy Marcroeconomic seminar in the Middle East. In lieu of our regular report, we are publishing a piece written by my colleague Jeremie Peloso. In it, Jeremie explores how to adjust valuation metrics to build country and sector selection tools which can be deployed to manage global equity portfolios. I trust you will find that this report provides a useful approach to equity selection. Best Regards, Mathieu Savary Chief European Strategist Highlights We introduce our Combined Mechanical Valuation Indicator for European equities to identify extreme valuations at the country and sector level. At the country level, the historical track record of relative valuations as an alpha-generating tool is mixed; however, they demonstrate impressive predictive power at the sector level on a 3- to 12-month time horizon. A trading strategy consisting of a basket of the five cheapest relative valuations generates excess returns with high batting averages. The current reading from our Combined Mechanical Valuation Indicator suggests investors should overweight the following European sectors: consumer discretionary relative to both Swedish and British counterparts, tech relative to Australian counterparts, communications relative to Spanish counterparts, and utilities relative to Italian counterparts. Also, favor UK energy stocks relative to their Eurozone competitors. Feature European equities have been underperforming their foreign peers for the past 10 years (Chart 1). The persistently lower profitability of European stocks partly explains their subpar performance; a DuPont decomposition of RoE reveals how Europe’s economic malaise affects corporate profitability (Chart 2). Chart 1Structural Underperformance From The Past...
Structural Underperformance From The Past...
Structural Underperformance From The Past...
Chart 2... And The Future
... And The Future
... And The Future
The Eurozone’s excessively large capital stock is chief among these culprits (Chart 2, bottom panel). It suggests that a large proportion of the capital stock in the Eurozone is misallocated which, in turn, hurts profit margins and renders the Euro Area’s asset turnover inferior to that of other countries. Compared to the US, greater economic rigidities and lower market power and concentration in Europe also hurt profitability. On net, these forces indicate that the case for overweighting European equities on a structural investment horizon (5 to 10 years) remains weak. Despite the poor long-term outlook, European stocks could still perform well on both a tactical and cyclical investment horizon. We currently recommend a modest overweight in European stocks for cyclical investors. One of our main investment themes for the remainder of 2021 is that European growth will surprise to the upside, once the re-opening of economic activity in the Eurozone gets fully underway, supported by the rapid recent progress of vaccination campaigns. This process will cause a re-rating of European assets. Our recent work shows that positive changes in economic surprises translate into generous returns for European equities and EUR/USD. Moreover, prolonged accommodative monetary policies via low rates and the ECB’s PEPP program, as well as continued fiscal support via the NGEU recovery fund, will be supportive for European assets in absolute terms. However, there are risks to our upbeat view, which we explored last week. They are as follows: (1) a slowdown in the Chinese economy, (2) a global credit impulse deterioration, and (3) inflation surges that are faster than expected. While none of these risks constitute our base case scenario, they could derail the positive cyclical environment we anticipate for European equities. In order to diversify portfolio risk away from traditional cyclical factors, this Special Report presents a mechanical valuation framework for European equities to identify high-probability attractive excess returns on a 3- to 12-month time horizon. At the country level, the historical track record of relative valuation as a selection tool is mixed; however, it demonstrates impressive predictive power at the sector level. Therefore, this method provides an attractive starting point for sector selection. The Mechanics Of The Mechanical Approach The starting point of this analysis is to select different valuation metrics. We opt for the following measures commonly accepted by the investment community: Price-to-earnings, Forward price-to-earnings, Price-to-sales, Price-to-book, Price-to-cash flows, Long-term growth in earnings. Next, we detrend each valuation measure by subtracting its 5-year moving average. We subsequently compute the difference between the detrended valuation metrics of the Euro Area MSCI equity benchmark and its chosen counterpart. For example, the calculation for the price-to-earnings ratio (P/E) with the US is as follows: Valuation Gap = (Euro Area P/E - 5-year m.a.) - (US P/E - 5-year m.a.) Then, we divide each of the valuation gaps shown above by their 5-year moving standard deviation: Mechanical Indicator = Valuation Gap / (5-year moving standard deviation of VG) The resulting valuation indicator mean-reverts and oscillates between +/- 2 standard deviations (Chart 3). We repeat this process for each valuation metric across 15 countries (including the All Country World and emerging markets MSCI indices) and the 10 GICS sectors. Considering the importance of relative sectoral biases, we create two versions of the mechanical indicators for the purpose of country analysis: a regular market-cap weighted version and a sector-neutral one, in which we weight all 10 GICS sectors equally. As Chart 4 illustrates, the differences in sector composition between the Eurozone and other regions lead to a sector-neutral valuation metric that deviates substantially from its market-cap weighted counterpart. Importantly, the sector-neutral mechanical indicators perform better on average than the market-cap weighted versions, thus reinforcing the importance of relative sectoral biases when it comes to equity valuation. Chart 3Mechanical Valuation Indicator Example
Mechanical Valuation Indicator Example
Mechanical Valuation Indicator Example
Chart 4Sector Composition Matters
Sector Composition Matters
Sector Composition Matters
Finally, given the sheer amount of computations performed, we only present the summary output from our analysis. The appendix, which starts on page 11, displays the detailed results for each of the valuation metrics, countries, and sectors. A Well-Oiled Mechanical Tool? Simple valuation measures make unreliable market timing tools. However, they are useful at extreme levels, which is precisely how the mechanical indicator is supposed to be used. The next step of our analysis is to assess our methodology and see where it displays predictive power. For this purpose, we back-tested trading rules relying on outlying readings of the relative Mechanical Valuation Indicator. More specifically, we calculated the common currency (US$) excess returns over 3-, 6-, and 12-month horizons generated by the following: Going long (overweight) European stocks, when they stood at 1 and 1.5 standard deviations on the cheap side of fair value. Going short (underweight) European stocks, when they stood at 1 and 1.5 standard deviations on the expensive side of fair value. We define excess returns as the returns in excess of the average returns observed over the past 10-year period. In other words, we want to ensure that the mechanical approach delivers more alpha than a passive buy-and-hold strategy. We use the 1.5 standard deviation threshold rather than the 2-sigma hurdle because of the lack of sufficient observations at the 2-standard deviation bar. If we had stuck to the 2-sigma threshold, the results from the back-test would not have been reliable, despite a sample with history going back to 2003. Table 1 presents the indicator’s batting average at the country level for all the valuation metrics - that is, the number of times both trading rules generated positive excess returns as a percent of the total number of signals. Table 1Mechanical Valuation Indicator (Sector-Neutral) Historical Track Record: Country Level
Valuation – A Mechanical Approach
Valuation – A Mechanical Approach
The results are mixed. Individually, none of the metrics display batting averages that significantly exceed 50% and none of the valuation metrics seem to perform uniformly across either time horizons or trading rules. On the bright side, we observe an improvement in excess returns between the +/- 1 and 1.5 standard deviation signals, especially when the mechanical indicators signal that European equities are the most expensive. Looking more closely at each valuation metric reveals that the long-term expected growth in earnings and the price-to-cash flows provided much better signals than the forward P/E and the price-to-book metrics. We repeat the same exercise at the sector level by calculating mechanical indicators for European sectors relative to comparable sectors from other regions - for example, European industrials relative to US or Chinese industrials. The results displayed in Table 2 consist of the average excess returns and batting averages across all sectors. The results for each sector can be found on page 19. Table 2Mechanical Valuation Indicator Historical Track Record: Sector Level
Valuation – A Mechanical Approach
Valuation – A Mechanical Approach
The historical track record of valuation-based trading rules yields much better results for sector selection than for country picking. All of the valuation metrics provide respectable predictive ability except for the long-term expected growth in earnings. In fact, the indicator generates positive excess returns more than two-thirds of the time; in half of the cases when the indicator fails to generate alpha, the Mechanical Valuation Indicator is computed using the long-term expected growth in earnings. Furthermore, the batting averages are above the 50% mark often, except over 12-month time horizons. Strength In Numbers: Combining The Signals The mixed results obtained from applying trading rules based on our mechanical indicator at the country level suggest we could improve the predictive power of this framework. Since individual valuation metrics do not cut it, we combine them into a simple average. Table 3Combined Mechanical Valuation Indicator (Sector-Neutral) Historical Track Record: Country Level
Valuation – A Mechanical Approach
Valuation – A Mechanical Approach
At the country level, the results are once again disappointing. As can be seen from Table 3, the quality of the signals from our combined mechanical indicator is not consistent across the board. The predictive power of the combined signals only appears to be effective when European equities are 1-sigma cheap or 1.5-sigma expensive. When the combined mechanical indicator is 1.5 standard deviations away from fair value on the expensive side, which, admittedly, is not a very common occurrence, going short (underweight) European equities deliver excess returns of 4.2%, 3.2%, and 2.6% over 3-, 6- and 12-month time horizons, respectively. Table 4Combined Mechanical Valuation Indicator Historical Track Record: Sector Level
Valuation – A Mechanical Approach
Valuation – A Mechanical Approach
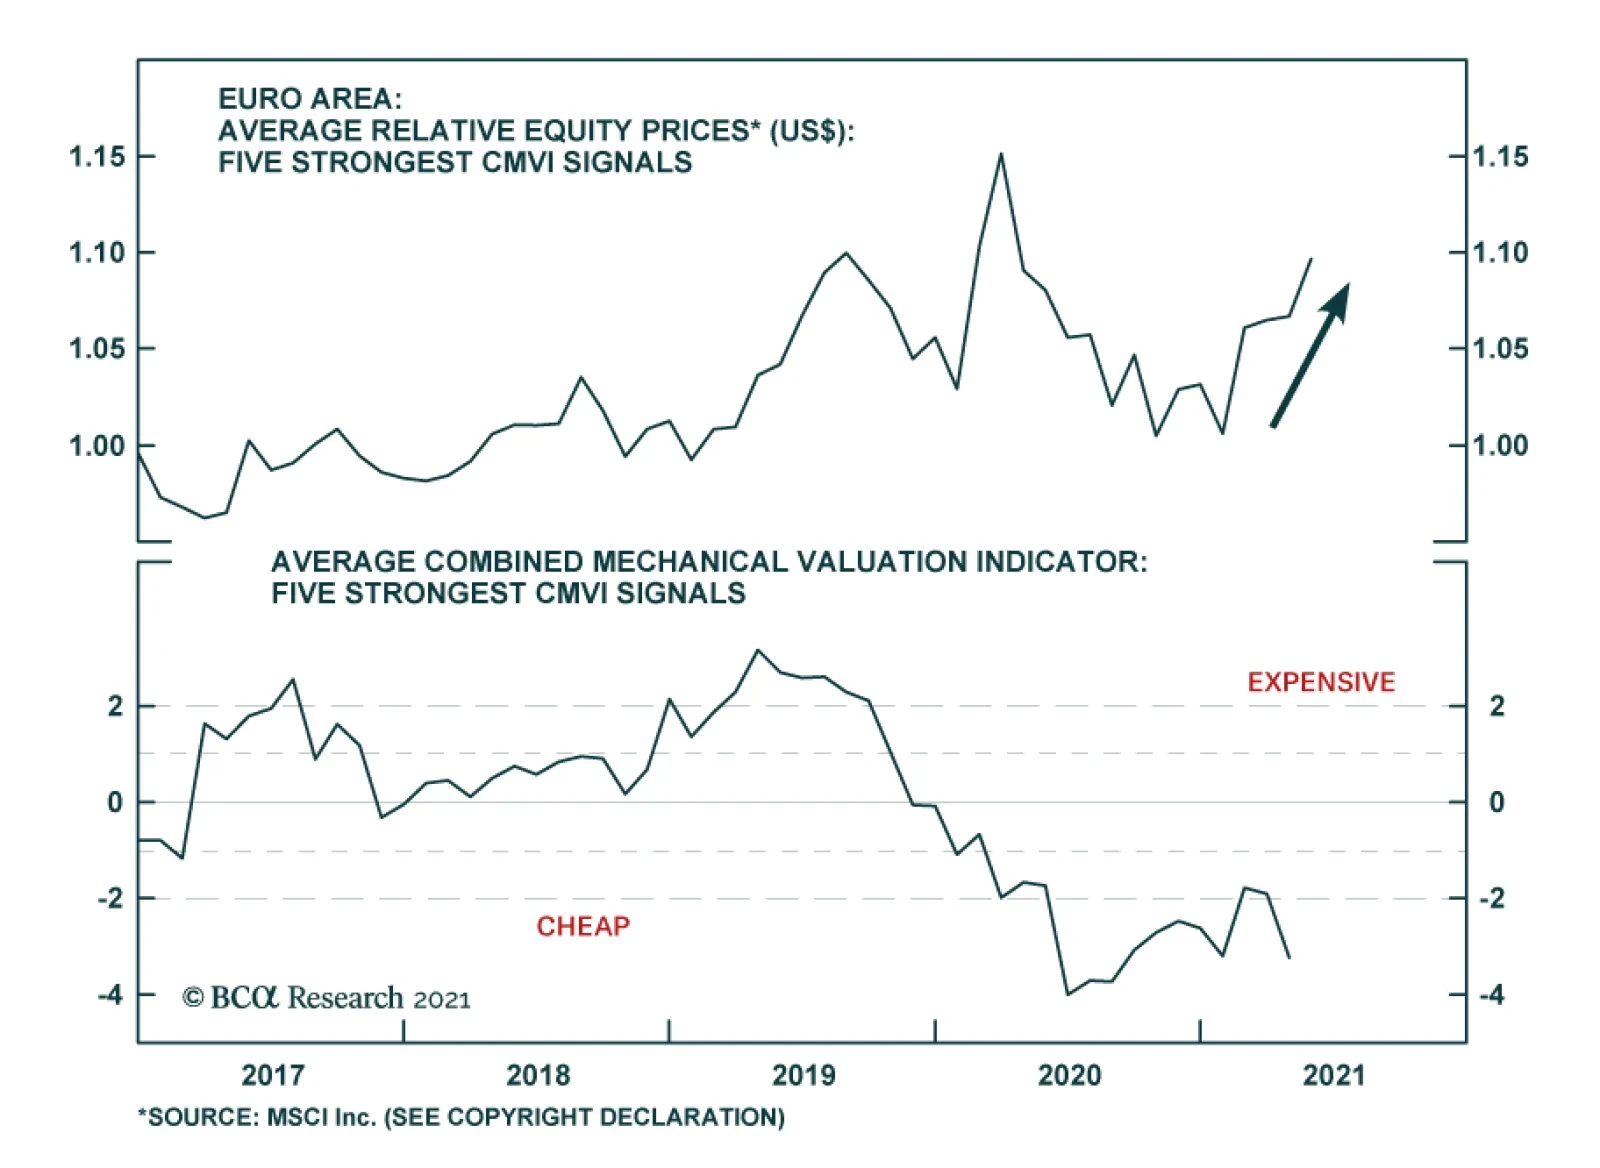
Despite this disappointment, the mechanical indicator once again truly shines at the sector level. Combining the valuation metrics, excluding the long-term expected growth rate of earnings (which, as we showed does a poor job), provides an excellent predictive power on all fronts (Table 4). All the excess returns are positive, and the batting averages are satisfying, especially on the 3-month and 6-month time horizons. The most impressive performance came from the mechanical indicator signaling European equity sectors were 1.5-sigma cheap. Out of 61 occurrences, following the signal resulted in earned excess returns of 3.3% and 4.8% on average over a 6- and 12-month time horizon, respectively. Importantly, the batting averages were both close to 60%. Bottom Line: Our Combined Mechanical Valuation Indicator is a useful tool, especially for sector selection in a global portfolio. It sports an impressive historical track record and allows us to identify pockets of attractive relative valuation that generate alpha for investors on a 3- to 12-month time horizon. Investment Implication What is the current message from our Combined Mechanical Valuation Indicator? Chart 5Combined Mechanical Valuation Indicators (Sector-Neutral): Country Level
Valuation – A Mechanical Approach
Valuation – A Mechanical Approach
At present, the approach only sends two signals at the +/- one-sigma threshold at the country level and both stand on the cheap side of fair value (Chart 5). According to the sector-neutral mechanical indicator, the European MSCI equity benchmark is cheap compared to emerging markets and Chinese benchmarks. And, while not at extremes, US and global equities are still expensive relative to Eurozone stocks. Chart 6 provides the current reading from the mechanical indicator for each sector. Chart 6ACombined Mechanical Valuation Indicators: Sector Level
Valuation – A Mechanical Approach
Valuation – A Mechanical Approach
Chart 6BCombined Mechanical Valuation Indicators: Sector Level
Valuation – A Mechanical Approach
Valuation – A Mechanical Approach
Chart 7Favor UK Energy Stocks Vs. European Ones
Favor UK Energy Stocks Vs. European Ones
Favor UK Energy Stocks Vs. European Ones
A few things stand out. First, there appears to be no extreme relative valuations within materials. Second, European energy stocks turn out to be expensive relative to all other regions included in the analysis, especially against energy stocks out of China and the UK. In fact, it makes a compelling case for investors to underweight Euro Area energy stocks relative to UK counterparts (Chart 7). Third, within the communications sector, Eurozone stocks are cheap against all their counterparts except for German ones. The relative valuation does not, however, stand at an extreme. Finally, if we were to select the five strongest signals, we would select the following pairs: Overweight European consumer discretionary stocks relative to Swedish counterparts Overweight European communications stocks relative to Spanish counterparts Overweight European tech stocks relative to Australian counterparts Overweight European consumer discretionary stocks relative to UK counterparts Overweight European utilities stocks relative to Italian counterparts This basket should deliver positive excess returns over a 3- to 12-month time horizon (Chart 8). Chart 8Going With The Strongest CMVI Signals
Going With The Strongest CMVI Signals
Going With The Strongest CMVI Signals
Jeremie Peloso, Associate Editor JeremieP@bcaresearch.com Appendix A The tables below present the historical track record of the sector-neutral mechanical valuation indicator for each of the valuation metrics at the country level. Euro Area vs. US
Valuation – A Mechanical Approach
Valuation – A Mechanical Approach
Euro Area vs. All Country World
Valuation – A Mechanical Approach
Valuation – A Mechanical Approach
Euro Area vs. Emerging Markets
Valuation – A Mechanical Approach
Valuation – A Mechanical Approach
Euro Area vs. Germany
Valuation – A Mechanical Approach
Valuation – A Mechanical Approach
Euro Area vs. France
Valuation – A Mechanical Approach
Valuation – A Mechanical Approach
Euro Area vs. Italy
Valuation – A Mechanical Approach
Valuation – A Mechanical Approach
Euro Area vs. Spain
Valuation – A Mechanical Approach
Valuation – A Mechanical Approach
Euro Area vs. The Netherlands
Valuation – A Mechanical Approach
Valuation – A Mechanical Approach
Euro Area vs. UK
Valuation – A Mechanical Approach
Valuation – A Mechanical Approach
Euro Area vs. Sweden
Valuation – A Mechanical Approach
Valuation – A Mechanical Approach
Euro Area vs. Switzerland
Valuation – A Mechanical Approach
Valuation – A Mechanical Approach
Euro Area vs. Japan
Valuation – A Mechanical Approach
Valuation – A Mechanical Approach
Euro Area vs. Canada
Valuation – A Mechanical Approach
Valuation – A Mechanical Approach
Euro Area vs. Australia
Valuation – A Mechanical Approach
Valuation – A Mechanical Approach
Euro Area vs. China
Valuation – A Mechanical Approach
Valuation – A Mechanical Approach
Appendix B The tables below present the historical track record of the mechanical valuation indicator for each of the valuation metrics at the sector level. Industrials
Valuation – A Mechanical Approach
Valuation – A Mechanical Approach
Materials
Valuation – A Mechanical Approach
Valuation – A Mechanical Approach
Consumer Discretionary
Valuation – A Mechanical Approach
Valuation – A Mechanical Approach
Consumer Staples
Valuation – A Mechanical Approach
Valuation – A Mechanical Approach
Energy
Valuation – A Mechanical Approach
Valuation – A Mechanical Approach
Financials
Valuation – A Mechanical Approach
Valuation – A Mechanical Approach
Technology
Valuation – A Mechanical Approach
Valuation – A Mechanical Approach
Communications
Valuation – A Mechanical Approach
Valuation – A Mechanical Approach
Utilities
Valuation – A Mechanical Approach
Valuation – A Mechanical Approach
Health Care
Valuation – A Mechanical Approach
Valuation – A Mechanical Approach
Appendix C The tables below present the historical track record of the sector-neutral combined mechanical valuation indicator (CMVI) at the country level. Euro Area vs. US
Valuation – A Mechanical Approach
Valuation – A Mechanical Approach
Euro Area vs. All Country World
Valuation – A Mechanical Approach
Valuation – A Mechanical Approach
Euro Area vs. Emerging Markets
Valuation – A Mechanical Approach
Valuation – A Mechanical Approach
Euro Area vs. Germany
Valuation – A Mechanical Approach
Valuation – A Mechanical Approach
Euro Area vs. France
Valuation – A Mechanical Approach
Valuation – A Mechanical Approach
Euro Area vs. Italy
Valuation – A Mechanical Approach
Valuation – A Mechanical Approach
Euro Area vs. Spain
Valuation – A Mechanical Approach
Valuation – A Mechanical Approach
Euro Area vs. The Netherlands
Valuation – A Mechanical Approach
Valuation – A Mechanical Approach
Euro Area vs. UK
Valuation – A Mechanical Approach
Valuation – A Mechanical Approach
Euro Area vs. Sweden
Valuation – A Mechanical Approach
Valuation – A Mechanical Approach
Euro Area vs. Switzerland
Valuation – A Mechanical Approach
Valuation – A Mechanical Approach
Euro Area vs. Japan
Valuation – A Mechanical Approach
Valuation – A Mechanical Approach
Euro Area vs. Canada
Valuation – A Mechanical Approach
Valuation – A Mechanical Approach
Euro Area vs. Australia
Valuation – A Mechanical Approach
Valuation – A Mechanical Approach
Euro Area vs. China
Valuation – A Mechanical Approach
Valuation – A Mechanical Approach
Appendix D The tables below present the historical track record of the Combined Mechanical Valuation Indicator (CMVI) at the sector level. Industrials
Valuation – A Mechanical Approach
Valuation – A Mechanical Approach
Materials
Valuation – A Mechanical Approach
Valuation – A Mechanical Approach
Consumer Discretionary
Valuation – A Mechanical Approach
Valuation – A Mechanical Approach
Consumer Staples
Valuation – A Mechanical Approach
Valuation – A Mechanical Approach
Energy
Valuation – A Mechanical Approach
Valuation – A Mechanical Approach
Financials
Valuation – A Mechanical Approach
Valuation – A Mechanical Approach
Technology
Valuation – A Mechanical Approach
Valuation – A Mechanical Approach
Communications
Valuation – A Mechanical Approach
Valuation – A Mechanical Approach
Utilities
Valuation – A Mechanical Approach
Valuation – A Mechanical Approach
Health Care
Valuation – A Mechanical Approach
Valuation – A Mechanical Approach
Footnotes
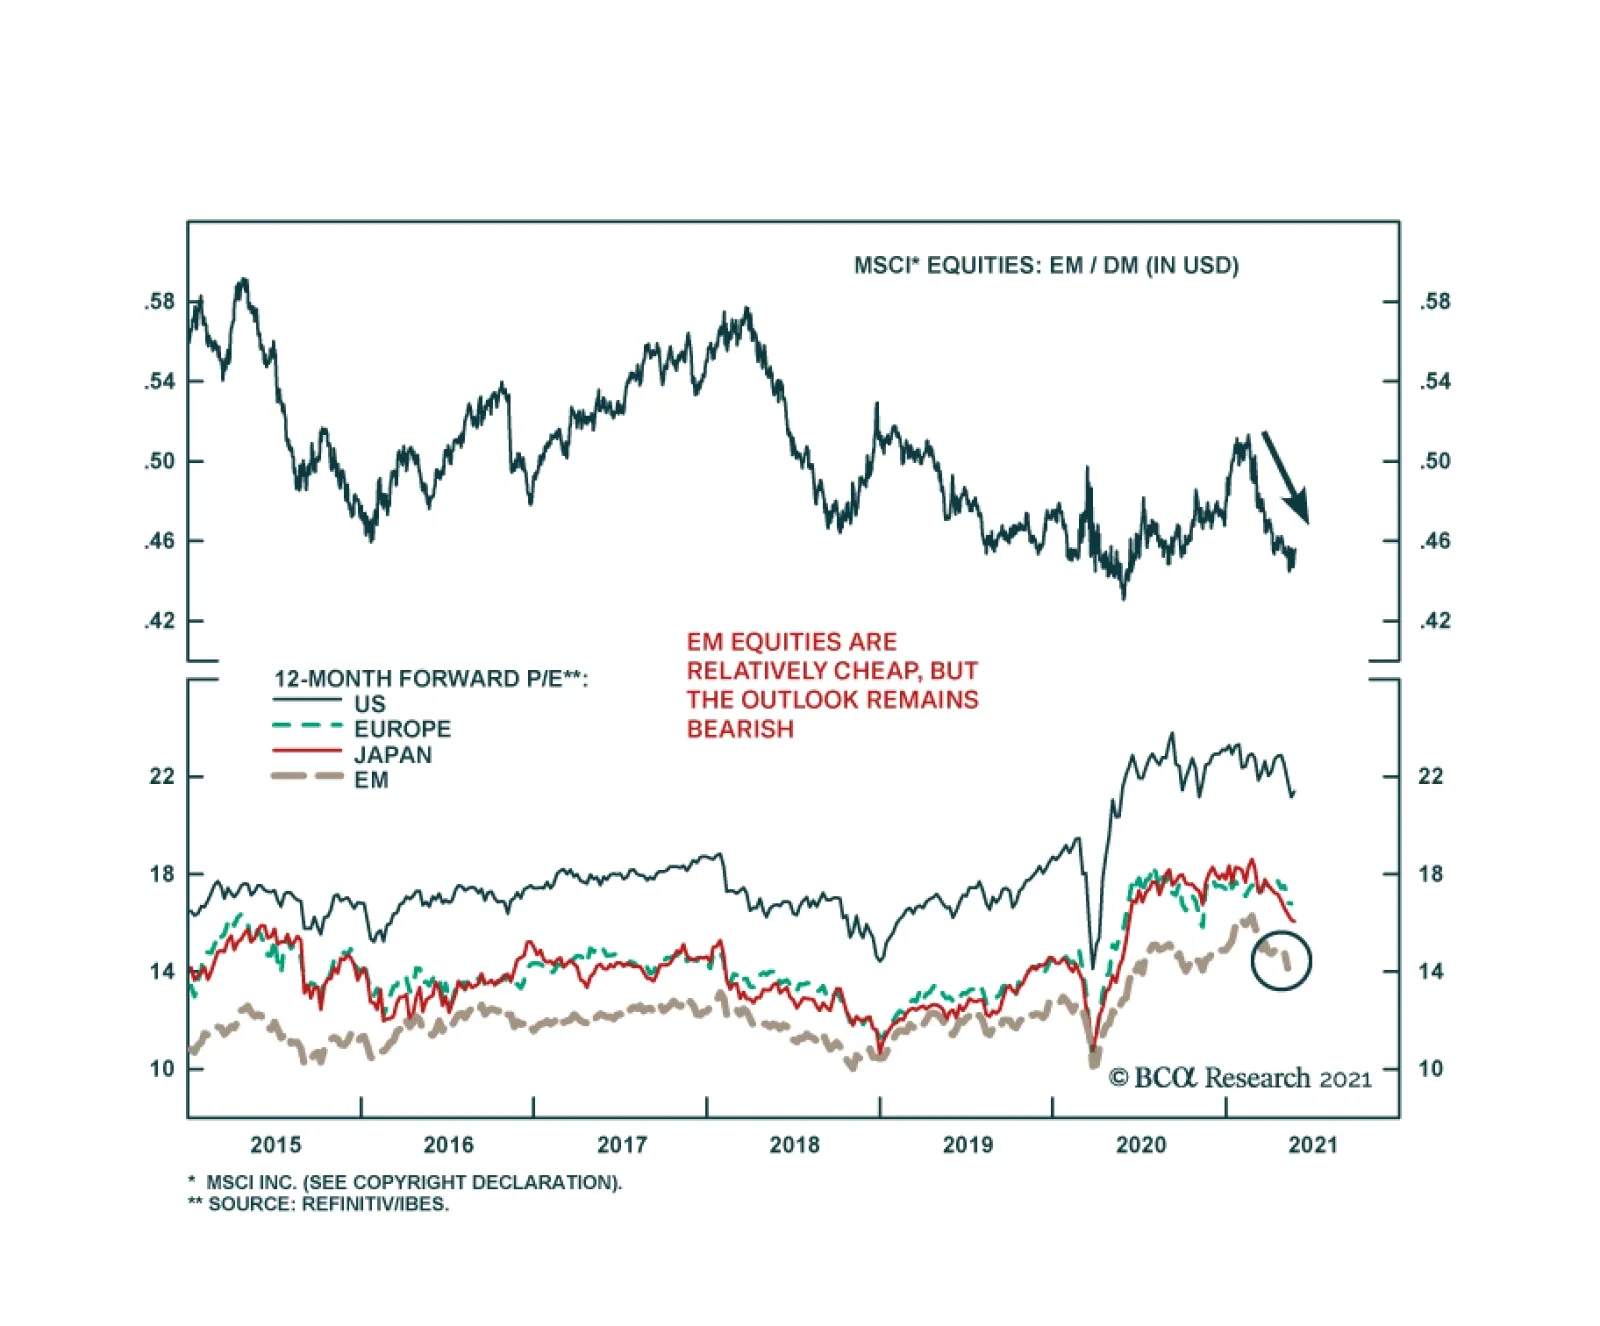
Since mid-February, emerging market equities have consistently underperformed their developed market peers. According to MSCI indices, the relative performance in common currency terms is heading towards last May’s lows. The MSCI EM index is down 6.3% since…
Weekly Performance Update For the week ending Thu May 27, 2021 The Market Monitor displays the trailing 1-quarter performance of strategies based around the BCA Score. For each region, we construct an equal-weighted, monthly rebalanced portfolio consisting of the top 3 stocks per sector and compare it with the regional benchmark. For each portfolio, we show the weekly performance of individual holdings in the Top Contributors/Detractors table. In addition, the Top Prospects table shows the holdings that currently have the highest BCA Score within the portfolio. For more details, click the region headers below to be redirected to the full historical backtest for the strategy. BCA US Portfolio
Market Monitor (May 27, 2021)
Market Monitor (May 27, 2021)
Total Weekly Return BCA US Portfolio S&P500 TRI 0.20% 1.03% Top Contributors AMKR:US AN:US HCA:US WY:US PCH:US Weekly Return 14 bps 13 bps 11 bps 9 bps 9 bps Top Detractors TX:US WES:US HE:US UTHR:US KOF:US Weekly Return -13 bps -13 bps -9 bps -8 bps -8 bps Top Prospects TX:US ESGR:US SCCO:US MPLX:US UHAL:US BCA Score 99.45% 95.61% 95.20% 94.61% 94.57% BCA Canada Portfolio
Market Monitor (May 27, 2021)
Market Monitor (May 27, 2021)
Total Weekly Return BCA Canada Portfolio S&P/TSX TRI 1.10% 1.23% Top Contributors AUP:CA LNR:CA WEED:CA PBL:CA NXE:CA Weekly Return 35 bps 21 bps 17 bps 14 bps 13 bps Top Detractors FTT:CA CSU:CA DIR.UN:CA GIB.A:CA EMP.A:CA Weekly Return -17 bps -8 bps -7 bps -7 bps -7 bps Top Prospects CS:CA IFP:CA CFP:CA RUS:CA LNF:CA BCA Score 99.88% 99.63% 99.18% 97.79% 97.27% BCA UK Portfolio
Market Monitor (May 27, 2021)
Market Monitor (May 27, 2021)
Total Weekly Return BCA UK Portfolio FTSE 100 TRI -0.37% 0.04% Top Contributors SPI:GB GLTR:GB IPO:GB BAKK:GB CVSG:GB Weekly Return 83 bps 10 bps 10 bps 9 bps 7 bps Top Detractors DEC:GB FDEV:GB VCP:GB NFC:GB SVST:GB Weekly Return -33 bps -32 bps -25 bps -14 bps -12 bps Top Prospects SVST:GB TUNE:GB NLMK:GB BPCR:GB GLTR:GB BCA Score 99.46% 97.73% 97.39% 95.76% 94.98% BCA Eurozone Portfolio
Market Monitor (May 27, 2021)
Market Monitor (May 27, 2021)
Total Weekly Return BCA EMU Portfolio MSCI EMU TRI 1.39% 1.18% Top Contributors ALTA:FR SES:IT FTK:DE POST:AT EURN:BE Weekly Return 24 bps 17 bps 17 bps 14 bps 14 bps Top Detractors SOL:IT TESB:BE CNV:FR SOLV:BE SO:FR Weekly Return -11 bps -7 bps -7 bps -6 bps -6 bps Top Prospects SOLV:BE STR:AT FSKRS:FI POST:AT SOL:IT BCA Score 99.15% 97.97% 97.56% 97.45% 96.59% BCA Japan Portfolio
Market Monitor (May 27, 2021)
Market Monitor (May 27, 2021)
Total Weekly Return BCA Japan Portfolio TOPIX TRI -2.13% 0.80% Top Contributors 4966:JP 8595:JP 6877:JP 4326:JP 4781:JP Weekly Return 24 bps 11 bps 8 bps 7 bps 4 bps Top Detractors 7545:JP 9729:JP 8795:JP 9543:JP 8131:JP Weekly Return -23 bps -22 bps -21 bps -20 bps -18 bps Top Prospects 6960:JP 4966:JP 8133:JP 3291:JP 9436:JP BCA Score 99.19% 99.13% 98.74% 98.18% 97.33% BCA Hong Kong Portfolio
Image
Total Weekly Return BCA Hong Kong Portfolio Hang Seng TRI 2.60% 2.62% Top Contributors 867:HK 116:HK 1830:HK 3798:HK 327:HK Weekly Return 43 bps 31 bps 26 bps 25 bps 22 bps Top Detractors 2798:HK 1816:HK 719:HK 1866:HK 2232:HK Weekly Return -17 bps -5 bps -4 bps -4 bps -3 bps Top Prospects 990:HK 1606:HK 323:HK 316:HK 2232:HK BCA Score 99.73% 99.33% 99.01% 98.76% 96.69% BCA Australia Portfolio
Market Monitor (May 27, 2021)
Market Monitor (May 27, 2021)
Total Weekly Return BCA Australia Portfolio S&P/ASX All Ord. TRI 1.62% 1.27% Top Contributors DDR:AU CDA:AU RIC:AU BSE:AU ADH:AU Weekly Return 43 bps 31 bps 30 bps 24 bps 20 bps Top Detractors MGX:AU CAJ:AU RBL:AU CVW:AU HT1:AU Weekly Return -24 bps -17 bps -16 bps -13 bps -9 bps Top Prospects GRR:AU MGX:AU BSE:AU PSQ:AU PL8:AU BCA Score 99.31% 98.55% 97.86% 97.63% 96.16%
Highlights President Biden has called for the US intelligence community to investigate the origins of COVID-19 and one of Biden’s top diplomats has stated the obvious: the era of “engagement” with China is over. This clinches our long-held view that any Democratic president would be a hawk like President Trump. The US-China conflict – and global geopolitical risk – will revive and undermine global risk appetite. China faces a confluence of geopolitical and macroeconomic challenges, suggesting that its equity underperformance will continue. Domestic Chinese investors should stay long government bonds. Foreign investors should sell into the bond rally to reduce exposure to any future sanctions. The impending agreement of a global minimum corporate tax rate has limited concrete implications that are not already known but it symbolizes the return of Big Government in the western world. Our updated GeoRisk Indicators are available in the Appendix, as well as our monthly geopolitical calendar. Feature In our quarterly webcast, “Geopolitics And Bull Markets,” we argued that geopolitical themes matter to investors when they have a demonstrable relationship with the macroeconomic backdrop. When geopolitics and macro are synchronized, a simple yet powerful investment thesis can be discerned. The US war on terror, Russia’s resurgence, the EU debt crisis, and Brexit each provided cases in which a geopolitically informed macro view was both accessible and actionable at an early stage. Investors generally did well if they sold the relevant country’s currency and disfavored its equities on a relative basis. Chart 1China's Decade Of Troubles
China's Decade Of Troubles
China's Decade Of Troubles
Of course, the market takeaway is not always so clear. When geopolitics and macroeconomics are desynchronized, the trick is to determine which framework will prevail over the financial markets and for how long. Sometimes the market moves to its own rhythm. The goal is not to trade on geopolitics but rather to invest with geopolitics. One of our key views for this year – headwinds for China – is an example of synchronization. Two weeks ago we discussed China’s macroeconomic challenge. In this report we discuss China’s foreign policy challenge: geopolitical pressure from the US and its allies. In particular we address President Biden’s call for a deeper intelligence dive into the origins of COVID-19. The takeaway is negative for China’s currency and risk assets. The Great Recession dealt a painful blow to the Chinese version of the East Asian economic miracle. By 2015, China’s financial turmoil and currency devaluation should have convinced even bullish investors to keep their distance from Chinese stocks and the renminbi. If investors stuck with this bearish view despite the post-2016 rally, on fear of trade war, they were rewarded in 2018-19. Only with China’s containment of COVID-19 and large economic stimulus in 2020 has CNY-USD threatened to break out (Chart 1). We expect the renminbi to weaken anew, especially once the Fed begins to taper asset purchases. Our cyclical view is still bullish but US-China relations are unstable so we remain tactically defensive. Forget Biden’s China Review, He’s A Hawk Chinese financial markets face a host of challenges this year, despite the positive factors for China’s manufacturing sector amid the global recovery. At home these challenges consist of a structural economic slowdown, a withdrawal of policy stimulus, bearish sentiment among households, and an ongoing government crackdown on systemic risk. Abroad the Democratic Party’s return to power in Washington means that the US will bring more allies to bear in its attempt to curb China’s rise. This combination of factors presents a headwind for Chinese equities and a tailwind for government bonds (Chart 2). This is true at least until the government should hit its pain threshold and re-stimulate. Chart 2Global Investors Still Wary
Global Investors Still Wary
Global Investors Still Wary
New stimulus may not occur in 2022. The Communist Party’s leadership rotation merely requires economic stability, not rapid growth. While the central government has a record of stimulating when its pain threshold is hit, even under the economically hawkish President Xi Jinping, a financial market riot is usually part of this threshold. This implies near-term downside, particularly for global commodities and metals, which are also facing a Chinese regulatory backlash to deter speculation. In this context, President Biden’s call for a deeper US intelligence investigation into the origin of COVID-19 is an important confirming signal of the US’s hawkish turn toward China. Biden gave 90 days for the intelligence community to report back to him. We will not enter into the debate about COVID-19’s origins. From a geopolitical point of view it is a moot point. The facts of the virus origin may never be established. According to Biden’s statement, at least one US intelligence agency believes the “lab leak theory” is the most likely source of the virus (while two other agencies decided in favor of animal-to-human transmission). Meanwhile Chinese government spokespeople continue to push the theory that the virus originated at the US’s Fort Detrick in Maryland or at a US-affiliated global research center. What is certain is that the first major outbreak of a highly contagious disease occurred in Wuhan. Both sides are demanding greater transparency and will reject each other’s claims based on a lack of transparency. If the US intelligence report concludes that COVID originated from the Wuhan Institute of Virology, the Chinese government and media will reject the report. If the report exonerates the Wuhan laboratory, at least half of the US public will disbelieve it and it will not deter Biden from drawing a hard line on more macro-relevant policy disputes with China. The US’s hawkish bipartisan consensus on China took shape before COVID. Biden’s decision to order the fresh report introduces skepticism regarding the World Health Organization’s narrative, which was until now the mainstream media’s narrative. Previously this skepticism was ghettoized in US public discourse: indeed, until Biden’s announcement on May 26, the social media company Facebook suppressed claims that the virus came from a lab accident or human failure. Thus Biden’s action will ensure that a large swathe of the American public will always tend to support this theory regardless of the next report’s findings. At the same time Biden discontinued a State Department effort to prove the lab leak theory, which shows that it is not a foregone conclusion what his administration will decide. The good news is that even if the report concluded in favor of the lab leak, the Biden administration would remain highly unlikely to demand that China pay “reparations,” like the Trump administration demanded in 2020. This demand, if actualized, would be explosive. The bad news is that a future nationalist administration could conceivably use the investigation as a basis to demand reparations. Nationalism is a force to be reckoned with in both countries and the dispute over COVID’s origin will exacerbate it. Traditionally the presidents of both countries would tamp down nationalism or attempt to keep it harnessed. But in the post-Xi, post-Trump era it is harder to control. The death toll of COVID-19 will be a permanent source of popular grievance around the world and a wedge between the US and China (Chart 3). China’s international image suffered dramatically in 2020. So far in 2021 China has not regained any diplomatic ground. Chart 3Death Toll Of COVID-19
Biden Confirmed As A China Hawk (GeoRisk Update)
Biden Confirmed As A China Hawk (GeoRisk Update)
The US is repairing its image via a return to multilateralism while the Europeans have put their Comprehensive Agreement on Investment with China on hold due to a spat over sanctions arising from western accusations of genocide (a subject on which China pointedly answered that it did not need to be lectured by Europeans). Notably Biden’s Department of State also endorsed its predecessor’s accusation of genocide in Xinjiang. Any authoritative US intelligence review that solidifies doubts about the WHO’s initial investigation – even if it should not affirm the lab leak theory – would give Biden more ammunition in global opinion to form a democratic alliance to pressure China (for example, in Europe). An important factor that enables the US to remain hawkish on China is fiscal stimulus. While stimulus helps bring about economic recovery, it also lowers the bar to political confrontation (Chart 4). Countries with supercharged domestic demand do not have as much to fear from punitive trade measures. The Biden administration has not taken new punitive measures against China but it is clearly not worried about Chinese retaliation. Chart 4Large Fiscal Stimulus Lowers The Bar To Geopolitical Conflict
Biden Confirmed As A China Hawk (GeoRisk Update)
Biden Confirmed As A China Hawk (GeoRisk Update)
China’s stimulus is underrated in this chart (which excludes non-fiscal measures) but it is still true that China’s policy has been somewhat restrained and it will need to stimulate its economy again in response to any new punitive measures or any global loss of confidence. At least China is limited in its ability to tighten policy due to the threat of US pressure and western trade protectionism. Simultaneous with Biden’s announcement on COVID-19, his administration’s coordinator for Indo-Pacific affairs, Kurt Campbell, proclaimed in a speech that the era of “engagement” with China is officially over and the new paradigm is one of “competition.” By now Campbell is stating the obvious. But this tone is a change both from his tone while serving in President Obama’s Department of State and from his article in Foreign Affairs last year (when he was basically auditioning for his current role in the Biden administration).1 Campbell even said in his latest remarks that the Trump administration was right about the “direction” of China policy (though not the “execution”), which is candid. Campbell was speaking at Stanford University but his comments were obviously aimed for broader consumption. Investors no longer need to wait for the outcome of the Biden administration’s comprehensive review of policy toward China. The answer is known: the Biden administration’s hawkishness is confirmed. The Department of Defense report on China policy, due in June, is very unlikely to strike a more dovish posture than the president’s health policy. Now investors must worry about how rapidly tensions will escalate and put a drag on global sentiment. Bottom Line: US-China relations are unstable and pose an immediate threat to global risk appetite. The fundamental geopolitical assessment of US-China relations has been confirmed yet again. The US is seeking to constrain China’s rise because China is the only country capable of rivaling the US for supremacy in Asia and the world. Meanwhile China is rejecting liberalization in favor of economic self-sufficiency and maintaining an offensive foreign policy as it is wary of US containment and interference. Presidents Biden and Xi Jinping are still capable of stabilizing relations in the medium term but they are unlikely to substantially de-escalate tensions. And at the moment tensions are escalating. China’s Reaction: The Example Of Australia How will China respond to Biden’s new inquiry into COVID’s origins? Obviously Beijing will react negatively but we would not expect anything concrete to occur until the result of the inquiry is released in 90 days. China will be more constrained in its response to the US than it has been with Australia, which called for an international inquiry early last year, as the US is a superior power. Australia was the first to ban Chinese telecom company Huawei from its 5G network (back in 2018) and it was the first to call for a COVID probe. Relations between China and Australia have deteriorated steadily since then, but macro trends have clearly driven the Aussie dollar. The AUD-JPY exchange rate is a good measure for global risk appetite and it is wavering in recent weeks (Chart 5). Chart 5Australian Dollar Follows Macro Trends, Rallies Amid China Trade Spat
Australian Dollar Follows Macro Trends, Rallies Amid China Trade Spat
Australian Dollar Follows Macro Trends, Rallies Amid China Trade Spat
Tensions have also escalated due to China’s dependency on Australian commodity exports at a time of spiking commodity prices. This is a recurring theme going back to the Stern Hu affair. The COVID spat led China to impose a series of sanctions against Australian beef, barley, wine, and coal. But because China cannot replace Australian resources (at least, not in the short term), its punitive measures are limited. It faces rising producer prices as a result of its trade restrictions (Chart 6). This dependency is a bigger problem for China today than it was in previous cycles so China will try to diversify. Chart 6Constraints On China's Tarrifs On Australia
Constraints On China's Tarrifs On Australia
Constraints On China's Tarrifs On Australia
By contrast, China is not likely to impose sanctions on the US in response to Biden’s investigation, unless Biden attacks first. China’s imports from the US are booming and its currency is appreciating sharply. Despite Beijing’s efforts to keep the Phase One trade deal from collapsing, Biden is maintaining Trump’s tariffs and the US-China trade divorce is proceeding (Chart 7). Bilateral tariff rates are still 16-17 percentage points higher than they were in 2018, with US tariffs on China at 19% (versus 3% on the rest of the world) while Chinese tariffs on the US stand at 21% (versus 6% on the rest of the world). The Biden administration timed this week’s hawkish statements to coincide with the first meeting of US trade negotiators with China, which was a more civil affair. Both countries acknowledged that the relationship is important and trade needs to be continued. However, US Trade Representative Katherine Tai’s comments were not overly optimistic (she told Reuters that the relationship is “very, very challenging”). She has also been explicit about maintaining policy continuity with the Trump administration. We highly doubt that China’s share of US imports will ever surpass its pre-Trump peaks. The Biden administration has also refrained so far from loosening export controls on high-tech trade with China. This has caused a bull market in Taiwan while causing problems for Chinese semiconductor stocks’ relative performance (Chart 8). If Biden’s policy review does not lead to any relaxation of export controls on commercial items then it will mark a further escalation in tensions. Chart 7US Tarrifs Reduce China In Trade Deficit
US Tarrifs Reduce China In Trade Deficit
US Tarrifs Reduce China In Trade Deficit
Bottom Line: Until Presidents Biden and Xi stabilize relations at the top, the trade negotiations over implementing the Phase One trade deal – and any new Phase Two talks – cannot bring major positive surprises for financial markets. Chart 8US Export Controls Amid Chip Shortage
US Export Controls Amid Chip Shortage
US Export Controls Amid Chip Shortage
Congress Is More Hawkish Than Biden Biden’s ability to reduce frictions with China, should he seek to, will also be limited by Congress and public opinion. With the US deeply politically divided, and polarization at historically high levels, China has emerged as one of the few areas of agreement. The hawkish consensus is symbolized by new legislation such as the Strategic Competition Act, which is making its way through the Senate rapidly. Congress is also trying to boost US competitiveness through bills such as the Endless Frontier Act. These bills would subject China to scrutiny and potential punitive measures over a broad range of issues but most of all they would ignite US industrial policy , STEM education, and R&D, and diversify the US’s supply chains. We would highlight three key points with regard to the global impact of this legislation: Global supply chains are shifting regardless: This trend is fairly well established in tech, defense, and pharmaceuticals. It will continue unless we see a major policy reversal from China to try to court western powers and reduce frictions. The EU and India are less enthusiastic than the US and Australia about removing China from supply chains but they are not opposed. The EU Commission has recommended new defensive economic measures that cover supply chains in batteries, cloud services, hydrogen energy, pharmaceuticals, materials, and semiconductors. As mentioned, the EU is also hesitating to ratify the Comprehensive Agreement on Investment with China. Hence the EU is moving in the US’s direction independently of proposed US laws. After all, China’s rise up the tech value chain (and its decision to stop cutting back the size of its manufacturing sector) ultimately threatens the EU’s comparative advantage. The EU is also aligned with the US on democratic values and network security. India has taken a harder stance on China than usual, which marks an important break with the past. India’s decision to exclude Huawei from its 5G network is not final but it is likely to be at least partially implemented. A working group of democracies is forming regardless. The Strategic Competition Act calls for the creation of a working group of democracies but the truth is that this is already happening through more effective forums like the G7 and bilateral summits. Just as the implementation of the act would will ultimately depend on President Biden, so the willingness of other countries to adopt the recommendations of the working group would depend on their own executives. Allies have leeway as Biden will not use punitive measures against them: Any policy change from the EU, UK, India, and Australia will be independent of the US Congress passing the Strategic Competition Act. These countries will be self-directed. The US would have to devote diplomatic energy to maintaining a sustained effort by these states to counter China in the face of economic costs. This will be limited by the fact that the Biden administration will be very reluctant to impose punitive measures on allies to insist on their cooperation. The allies will set the pace of pressure on China rather than the United States. This gives the EU an important position, particularly Germany. And yet the trends in Germany suggest that the government will be more hawkish on China after the federal elections in September. Bottom Line: The Biden administration is unlikely to use punitive measures against allies so new US laws are less important than overall US diplomacy with each of the allies. Some allies will be less compliant with US policies given their need for trade with China. But so far there appears to be a common position taking shape even with the EU that is prejudicial to China’s involvement in key sectors of emerging technologies. If China does not respond by reducing its foreign policy assertiveness, then China’s economic growth will suffer. That drag would have to be offset by new supply chain construction in Southeast Asia and other countries. Investment Takeaways The foregoing highlights the international risks facing China even at a time when its trend growth is slowing (Chart 9) and its ongoing struggle with domestic financial imbalances is intensifying. China’s debt-service costs have risen sharply and Beijing is putting pressure on corporations and local governments to straighten out their finances (Chart 10), resulting in a wave of defaults. This backdrop is worrisome for investors until policymakers reassure them that government support will continue. Chart 9China's Growth Potential Slowing
China's Growth Potential Slowing
China's Growth Potential Slowing
Chart 10China's Leaders Struggle With Debt
China's Leaders Struggle With Debt
China's Leaders Struggle With Debt
China’s domestic stability is a key indicator of whether geopolitical risks could spiral out of control. In particular we think aggressive action in the Taiwan Strait is likely to be delayed as long as the Chinese economy and regime are stable. China has rattled sabers over the strait this year in a warning to the United States not to cross its red line (Chart 11). It is not yet clear how Biden’s policy continuity with the Trump administration will affect cross-strait stability. We see no basis yet for changing our view that there is a 60% chance of a market-negative geopolitical incident in 2021-22 and a 5% chance of full-scale war in the short run. Chart 11China PLA Flights Over Taiwan Strait
Biden Confirmed As A China Hawk (GeoRisk Update)
Biden Confirmed As A China Hawk (GeoRisk Update)
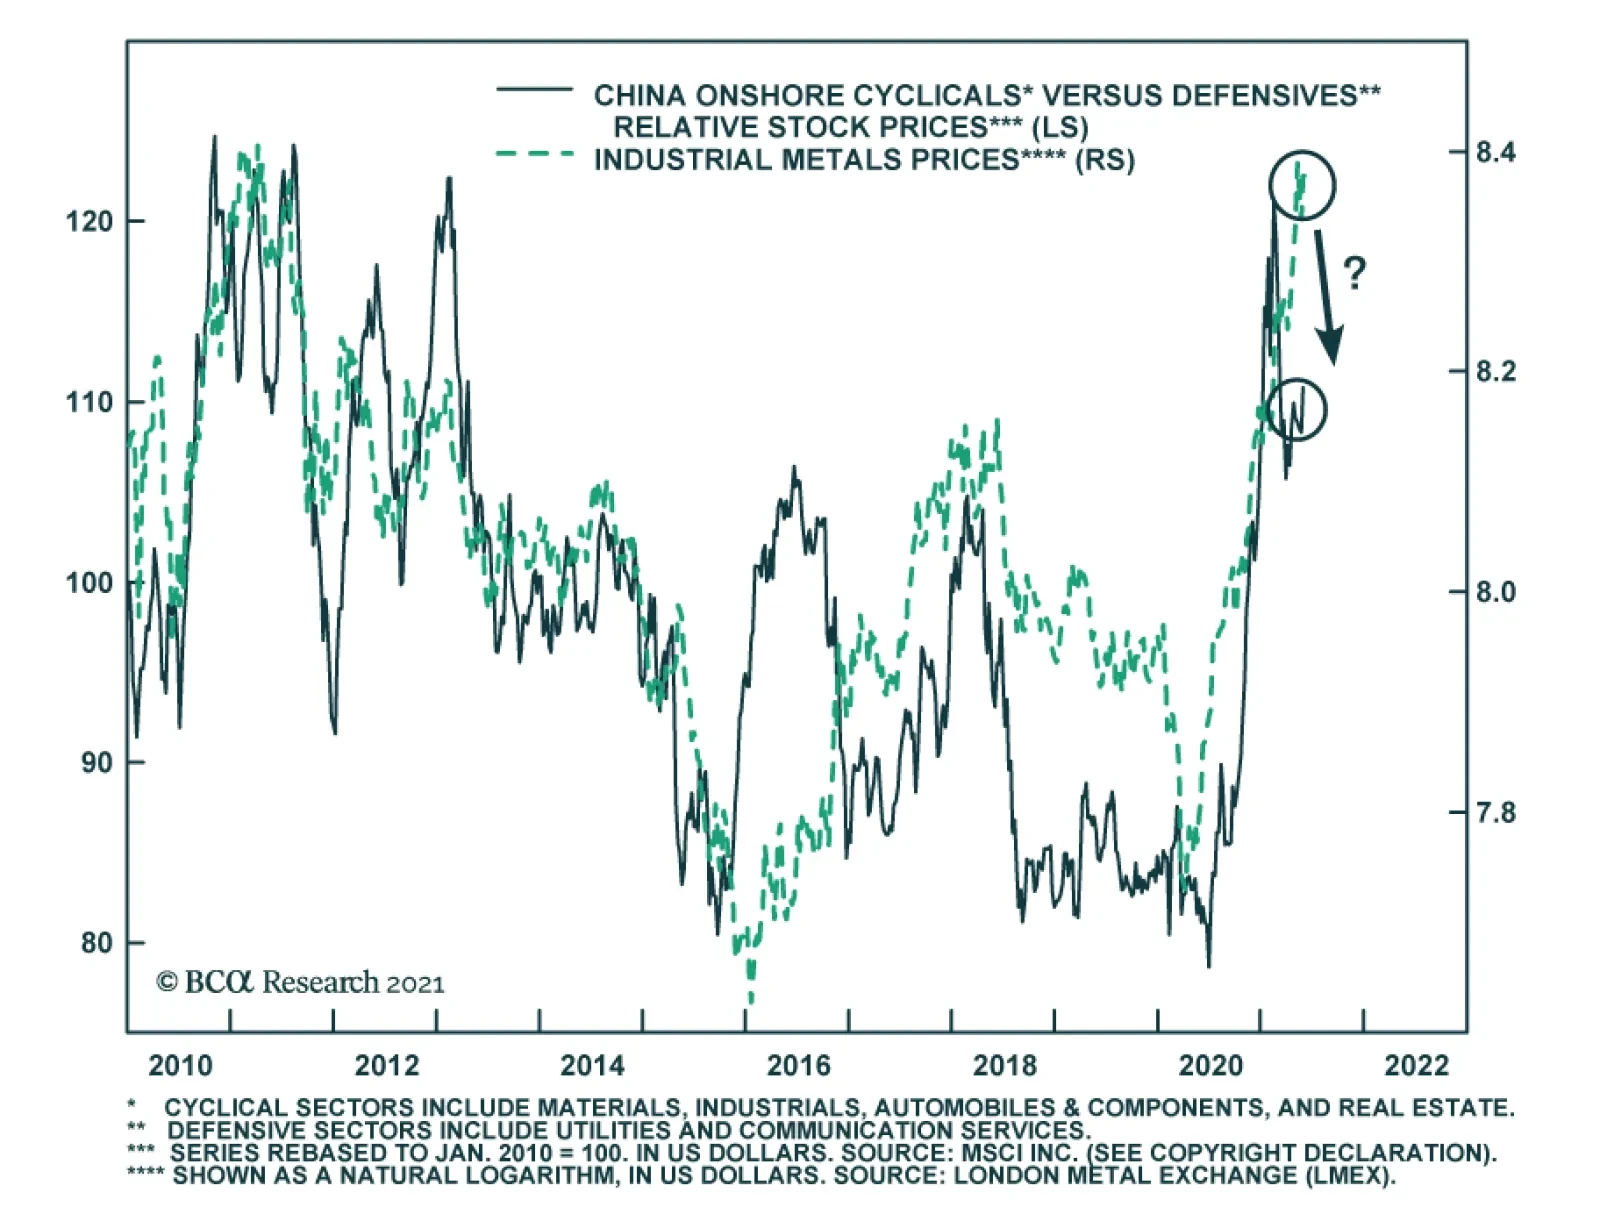
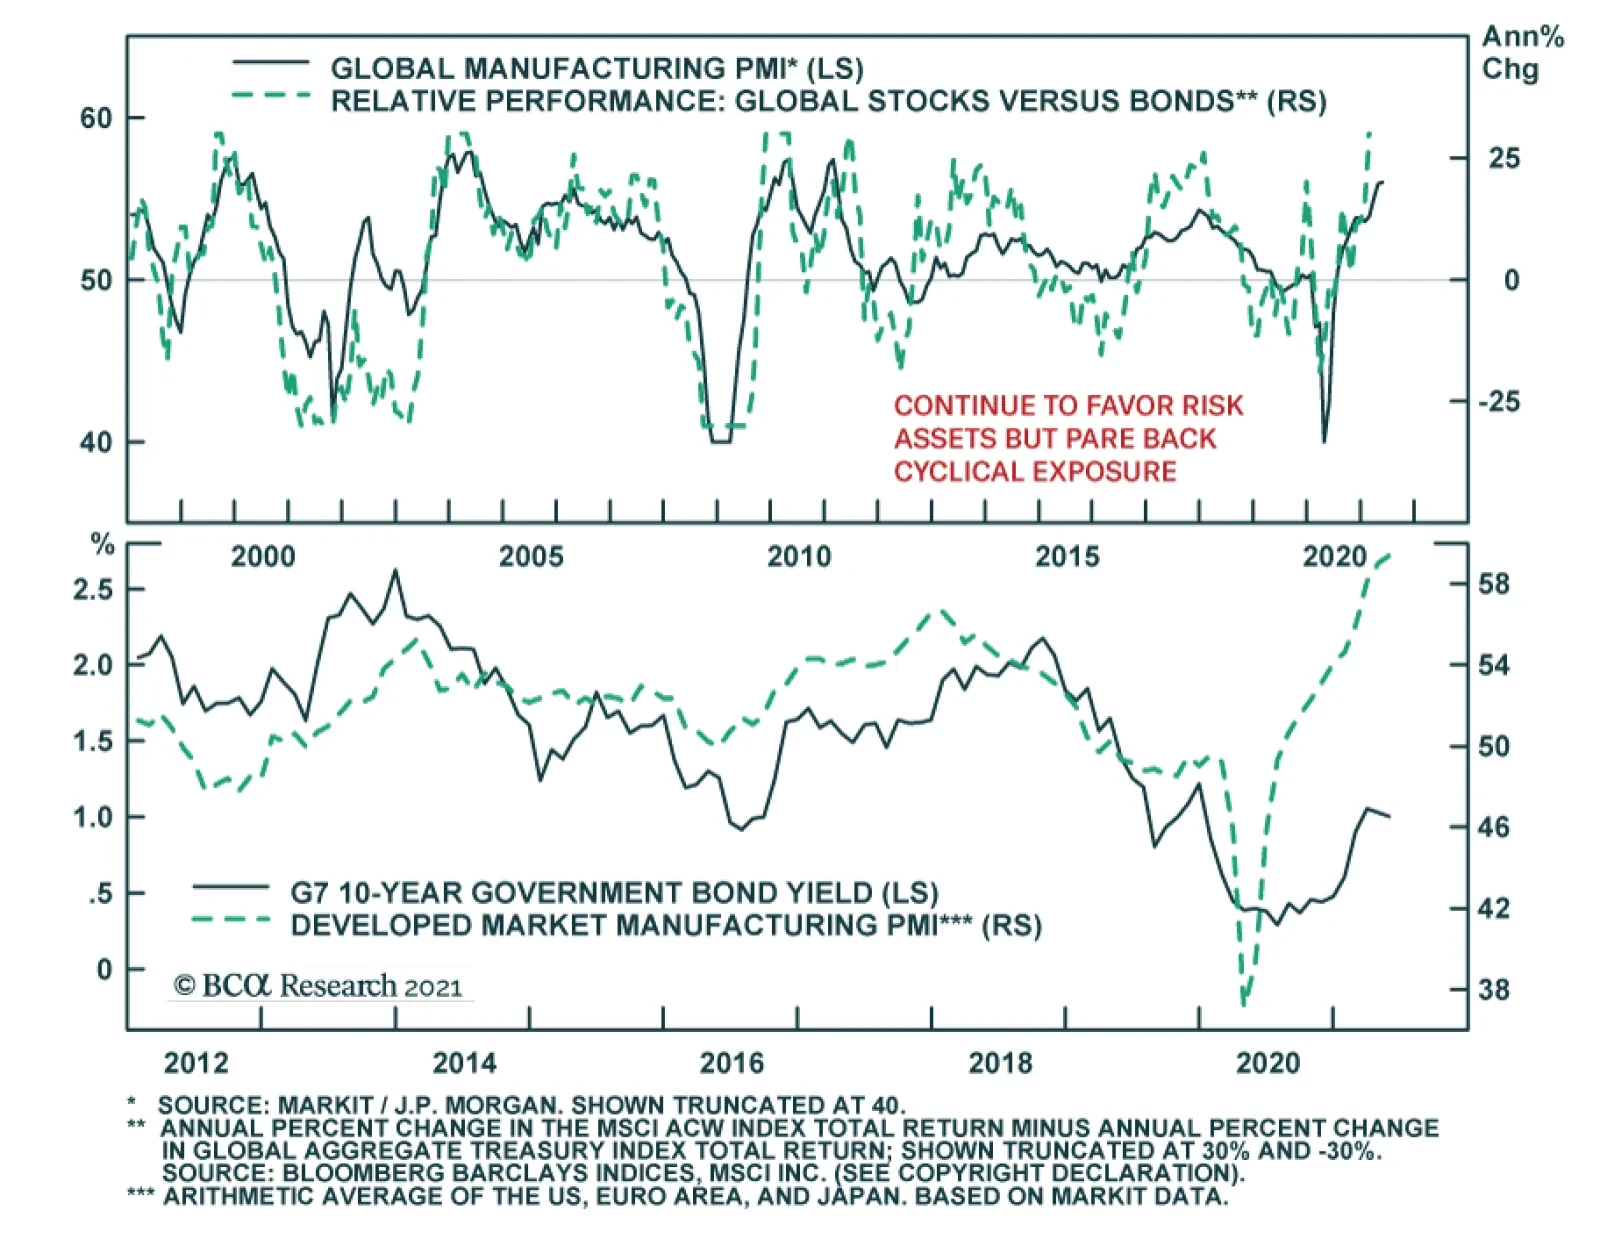
Putting all of the above together, we see substantial support for two key market-relevant geopolitical risks: Chinese domestic politics (including policy tightening) and persistent US-China tensions (including but not limited to the Taiwan Strait). We remain tactically defensive, a stance supported by several recent turns in global markets: The global stock-to-bond ratio has rolled over. China is a negative factor for global risk appetite (Chart 12). Global cyclical equities are no longer outperforming defensives. There is a stark divergence between Chinese cyclicals and global cyclicals stemming from the painful transition in China’s bloated industrial economy (Chart 13). Global large caps are catching a bid relative to small caps (Chart 14). Chart 12Global Stock-To-Bond Ratio Rolled Over
Global Stock-To-Bond Ratio Rolled Over
Global Stock-To-Bond Ratio Rolled Over
Chart 13Global Cyclicals-To-Defensives Pause
Biden Confirmed As A China Hawk (GeoRisk Update)
Biden Confirmed As A China Hawk (GeoRisk Update)
Chart 14Global Large Caps Catch A Bid Versus Small Caps
Global Large Caps Catch A Bid Versus Small Caps
Global Large Caps Catch A Bid Versus Small Caps
Cyclically the global economic recovery should continue as the pandemic wanes. China will eventually relax policy to prevent too abrupt of a slowdown. Therefore our strategic portfolio reflects our high-conviction view that the current global economic expansion will continue even as it faces hurdles from the secular rise in geopolitical risk, especially US-China cold war. Measurable geopolitical risk and policy uncertainty are likely to rebound sooner rather than later, with a negative impact on high-beta risk assets. Matt Gertken Vice President Geopolitical Strategy mattg@bcaresearch.com Coda: Global Minimum Tax Symbolizes Return Of Big Government On Thursday, the US Treasury Department released a proposal to set the global minimum corporate tax rate at 15%. The plan is to stop what Treasury Secretary Janet Yellen has referred to as a global “race to the bottom” and create the basis for a rehabilitation of government budgets damaged by pandemic-era stimulus. Although the newly proposed 15% rate is significantly below President Biden’s bid to raise the US Global Intangible Low-Taxed Income (GILTI) rate to 21% from 10.5%, it is the same rate as his proposed minimum tax on corporate book income. Biden is also raising the headline corporate tax rate from 21% to around 25% (or at highest 28%). Negotiators at the OECD were initially discussing a 12.5% global minimum rate. The finance ministers of both France and Germany – where the corporate income tax rates are 32.0% and 29.9%, respectively – both responded positively to the announcement. However, Ireland, which uses low corporate taxes as an economic development strategy, is obviously more comfortable with a minimum closer to its own 12.5% rate. Discussions are likely to occur when G7 finance ministers meet on June 4-5. Countries are hoping to establish a broad outline for the proposal by the G20 meeting in early July. It is highly likely that the OECD will come to an agreement. However, it is not a truly “global” minimum as there will still be tax havens. Compliance and enforcement will vary across countries. A close look at the domestic political capital of the relevant countries shows that while many countries have the raw parliamentary majorities necessary to raise taxes, most countries have substantial conservative contingents capable of preventing stiff corporate tax hikes (Table 1, in the Appendix). Our Geopolitical strategists highlight that the Biden administration’s compromise on the minimum rate reflects its pragmatism as well as emphasis on multilateralism. Any global deal will be non-binding but the two most important low-tax players are already committed to raising corporate rates well above this level: Biden’s plan is noted above, while the UK’s budget for March includes a jump in the business rate to 25% in April 2023 from the current 19%. Ireland and Hungary are the only outliers but they may eventually be forced to yield to such a large coalition of bigger economies (Chart 15). Chart 15Global Minimum Corporate Tax Impact Is Symbolic Rather Than Concrete
Biden Confirmed As A China Hawk (GeoRisk Update)
Biden Confirmed As A China Hawk (GeoRisk Update)
Thus a nominal minimum corporate tax rate is likely to be forged but it will not be truly global and it will not change the corporate rate for most countries. The reality of what companies pay will also depend on loopholes, tax havens, and the effective tax rate. Bottom Line: On a structural horizon, the global minimum corporate tax is significant for showing a paradigm shift in global macro policy: western governments are starting to raise taxes and revenue after decades of cutting taxes. The experiment with limited government has ended and Big Government is making a comeback. On a cyclical horizon, the US concession on global minimum tax is that the Biden administration aims to be pragmatic and “get things done.” Biden is also working with Republicans to pass bills covering some bipartisan aspects of his domestic agenda, such as trade, manufacturing, and China. The takeaway from a global point of view is that Biden may prove to be a compromiser rather than an ideologue, unlike his predecessors. Matt Gertken Vice President Geopolitical Strategy mattg@bcaresearch.com Roukaya Ibrahim Vice President Daily Insights RoukayaI@bcaresearch.com Footnotes 1 Kurt M. Campbell and Jake Sullivan, "Competition Without Catastrophe," Foreign Affairs, September/October 2019, foreignaffairs.com. Section II: Appendix Table 1OECD: Which Countries Are Willing And Able To Raise Corporate Tax Rates?
Biden Confirmed As A China Hawk (GeoRisk Update)
Biden Confirmed As A China Hawk (GeoRisk Update)
GeoRisk Indicator China
China: GeoRisk Indicator
China: GeoRisk Indicator
Russia
Russia: GeoRisk Indicator
Russia: GeoRisk Indicator
UK
UK: GeoRisk Indicator
UK: GeoRisk Indicator
Germany
Germany: GeoRisk Indicator
Germany: GeoRisk Indicator
France
France: GeoRisk Indicator
France: GeoRisk Indicator
Italy
Italy: GeoRisk Indicator
Italy: GeoRisk Indicator
Canada
Canada: GeoRisk Indicator
Canada: GeoRisk Indicator
Spain
Spain: GeoRisk Indicator
Spain: GeoRisk Indicator
Taiwan – Province Of China
Taiwan-Province of China: GeoRisk Indicator
Taiwan-Province of China: GeoRisk Indicator
Korea
Korea: GeoRisk Indicator
Korea: GeoRisk Indicator
Turkey
Turkey: GeoRisk Indicator
Turkey: GeoRisk Indicator
Brazil
Brazil: GeoRisk Indicator
Brazil: GeoRisk Indicator
Australia
Australia: GeoRisk Indicator
Australia: GeoRisk Indicator
Section III: Geopolitical Calendar
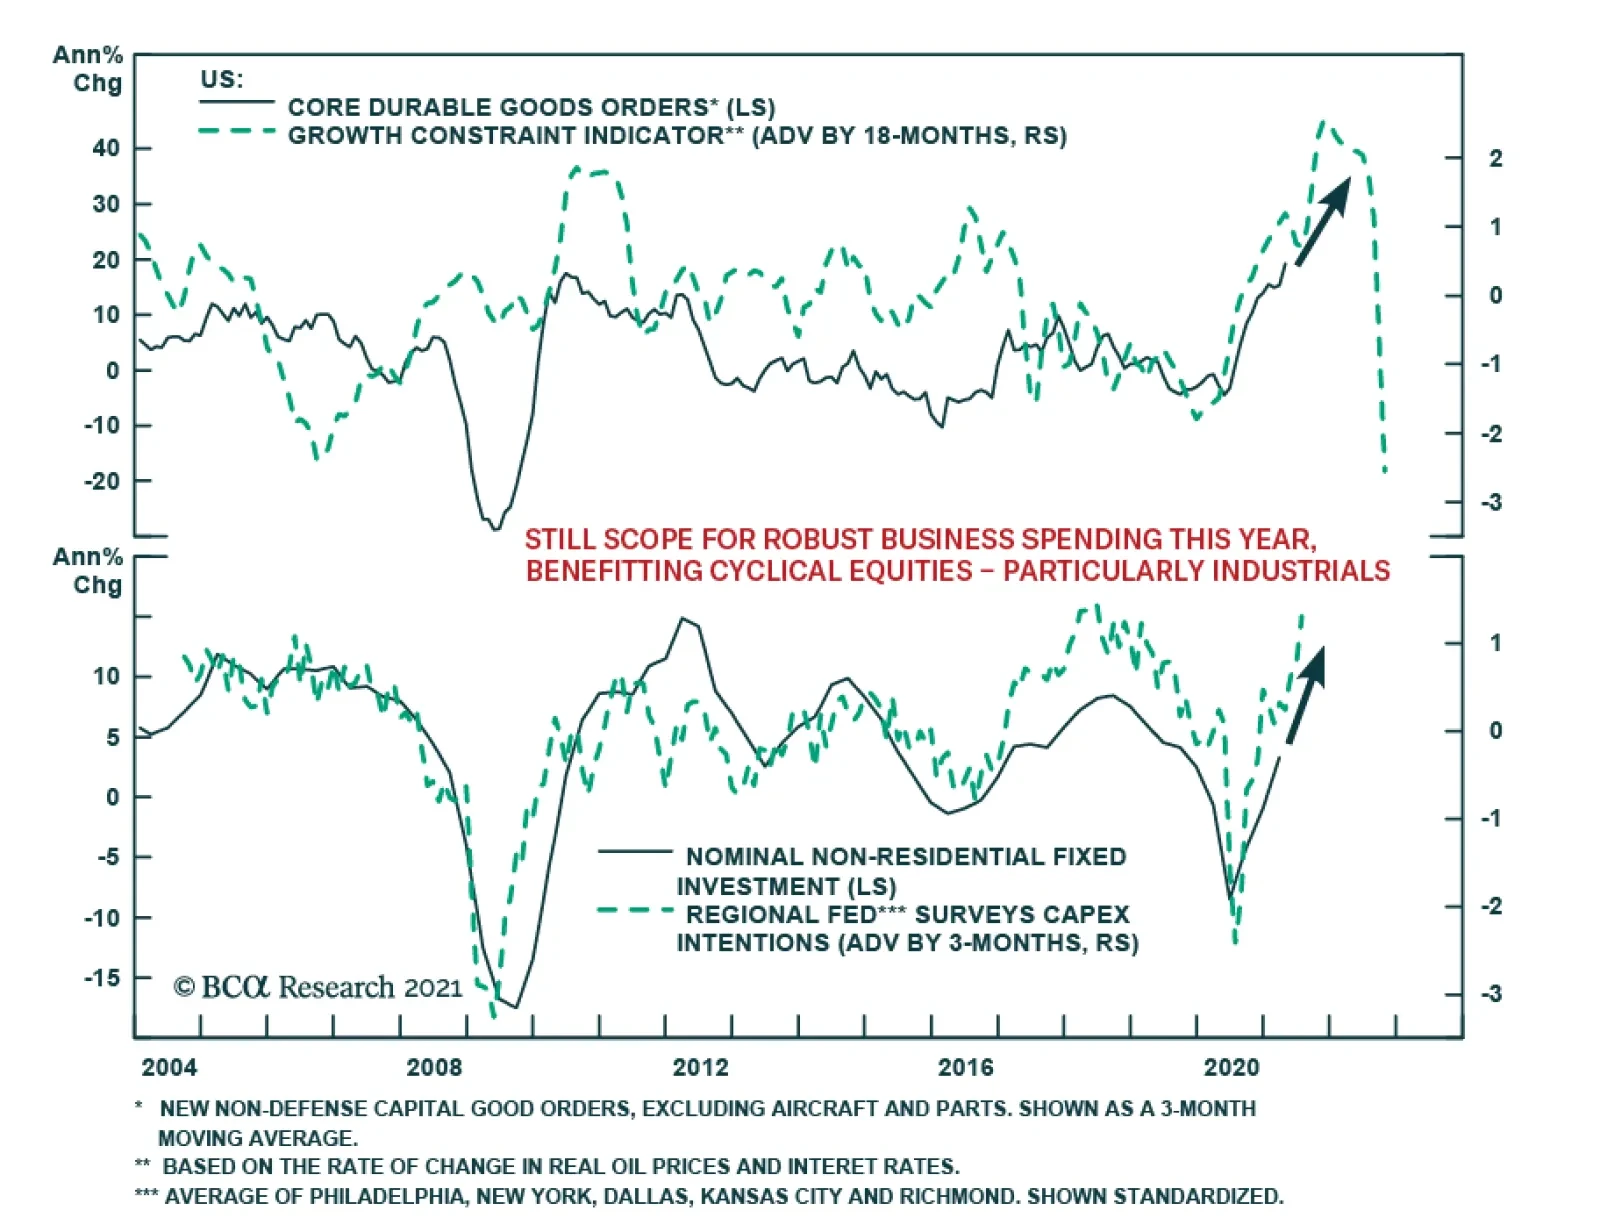
On the surface, the April US Durable Goods Report is a disappointment. The headline number declined by 1.3% m/m following a revised 1.3% m/m rise in durable goods orders in March, missing expectations of 0.8% m/m rise. April’s decline is the first monthly…
Highlights A first Fed funds rate hike by early 2023 is cloud cuckoo land – because it will take years to meet the Fed’s pre-condition of full employment. More likely, the first rate hike will happen after mid-2024, and even this is a coin toss which assumes no further shock(s). Buy the March 2024 US interest rate future contract. An alternative expression is to buy the 5-year T-bond, or to go long the 5-year T-bond versus the 5-year German bund. For equity investors, the current overestimation of Fed rate hikes structurally favours growth sectors versus value sectors. Thereby, it also structurally favours the S&P500 versus the Eurostoxx50. Bitcoin has support at $32500, and then at $22750. The latest correction in cryptocurrencies is a good entry point into a diversified basket that includes ‘proof of stake’ coins, such as ethereum. Fragile iron ore prices confirm the onset of a commodity correction. Feature Chart of the WeekAfter A Recession, It Takes Many Years To Reabsorb The Unemployed
After A Recession, It Takes Many Years To Reabsorb The Unemployed
After A Recession, It Takes Many Years To Reabsorb The Unemployed
After a recession, an economy takes years to reabsorb the unemployed. Here’s how long it took in the US after each of the last five recessions.1 1974-75 recession: 4 years Early-1980s recession: 6 years Early-1990s recession: 5 years Dot com bust: 3 years Global financial crisis: 8 years After the pandemic recession, reabsorbing the unemployed (that are not just on ‘temporary layoff’) will also take many years (Chart I-1). Full Employment Is Many Years Away There is a remarkable consistency in employment recoveries. The last five recessions were different in their severities and durations, and therefore in their peak unemployment rates. Yet in the recoveries that followed each of the last five recessions, the unemployment rate declined at a consistent pace of 0.4-0.5 percent per year. After the mild recessions of the early-1990s and the dot com bust, the pace of recovery in the unemployment rate was at the lower end of 0.4 percent per year. Whereas after the global financial crisis and its surge in permanent unemployment, the pace of recovery was at the upper end of 0.5 percent per year. But the difference in the pace of the five employment recovery was marginal (Table I-1). Table 1After Every Recession, The Pace Of Recovery In The Jobs Market Is Near-Identical
A Fed Rate Hike By Early 2023 Is Pie In The Sky
A Fed Rate Hike By Early 2023 Is Pie In The Sky
Another near-constant through the past fifty years is the definition of ‘full employment’. It is achieved when the (permanent) unemployment rate reaches 1.5 percent. Combining the latest (permanent) unemployment rate of 2.7 percent, the unemployment rate at full employment, and the remarkably consistent recovery paces, we can deduce that: The US economy will reach full employment between September 2023 and June 2024. The Federal Reserve has promised that it will not raise the Fed funds rate until the economy has reached full employment. Based on the remarkably consistent pace of the past five employment recoveries, it means September 2023 at the earliest, but more likely closer to June 2024. Yet US interest rate futures are pricing the first Fed funds rate hike through December 2022-March 2023 (Chart I-2). Chart I-2Cloud Cuckoo Land: A First Rate Hike In Dec 22-Mar 23
Cloud Cuckoo Land: A First Rate Hike In Dec 22-Mar 23
Cloud Cuckoo Land: A First Rate Hike In Dec 22-Mar 23
This makes US interest rate future contracts from December 2022 to June 2024 a compelling buy (Chart I-3). Chart I-3Cloud Cuckoo Land: 4 Rate Hikes By June 24
Cloud Cuckoo Land: 4 Rate Hikes By June 24
Cloud Cuckoo Land: 4 Rate Hikes By June 24
Buy The March 2024 US Interest Rate Future The post-pandemic jobs market recovery will likely be at the lower end of its 0.4-0.5 percent a year pace, for two reasons. First, reducing the unemployment rate doesn’t only mean creating jobs for the currently unemployed. It also means creating jobs for those that have left the labour force but plan on re-joining. When these so-called ‘inactive’ people re-join the labour force they add to the number that are counted as unemployed. As the millions of inactives re-join the labour market, it will weigh on the pace of the recovery in the unemployment rate. During the pandemic, the number of inactive people surged by an unprecedented 8 million. Even now, the excess inactive stands at 5 million (Chart I-4). As these millions gradually re-join the labour market, it will weigh on the pace of the recovery in the unemployment rate. Chart I-4Massive Slack In The US Labour Market
Massive Slack In The US Labour Market
Massive Slack In The US Labour Market
Second, after every recession, there is a surge in productivity (Chart I-5). This is because the period immediately after a recession is when the economy experiences the most intensive clearing out of dead wood, restructuring of capital and labour, and absorption of new technologies and ways of working. Chart I-5The Post-Pandemic Productivity Boom Will Be A Super-Boom
The Post-Pandemic Productivity Boom Will Be A Super-Boom
The Post-Pandemic Productivity Boom Will Be A Super-Boom
If anything, the post-pandemic productivity boom will be even larger than normal. Whereas most recessions upend one or two sectors of the economy, the pandemic has forced all of us to adopt new technologies and ways of working and living. The unfortunate corollary of this post-pandemic productivity super-boom is that the pace of absorption of the excess unemployed and inactive will be slower. Moreover, even achieving full employment by June 2024 assumes blue skies through the next few years, which is to say no further shocks. Yet as we explained in The Shock Theory Of Bond Yields, deflationary shocks tend to come once every three years, meaning there is an evens chance that dark clouds ruin the blue skies. One complication is that the Fed will start tapering its asset purchases much sooner, and that this will be interpreted as the precursor of a rate hike. However, in the last cycle the taper of asset purchases in early 2014 preceded the first rate hike by two years (Chart I-6). On a similar timeframe, a taper at the end of 2021 would imply the first rate hike at the end of 2023, and not the start of 2023 as is implied by the interest rate futures. Chart I-6The First Rate Hike Came Two Years After The Taper
The First Rate Hike Came Two Years After The Taper
The First Rate Hike Came Two Years After The Taper
Pulling all of this together, a first Fed funds rate hike by early 2023 is cloud cuckoo land. More likely it will happen after mid-2024, and even this is a coin toss which assumes no further shock(s) in the interim. The investment conclusion is to buy any of the US interest rate futures that expire from December 2022 out to June 2024. The earlier contracts have the higher probabilities of expiring in profit while the later contracts have the greater upside if the Fed stays pat. Our choice is the March 2024 contract. An alternative expression is to buy the 5-year T-bond, or to go long the 5-year T-bond versus the 5-year German bund. For equity investors, the current overestimation of Fed rate hikes structurally favours growth sectors versus value sectors. Thereby, it also structurally favours the S&P500 versus the Eurostoxx50. The 419th Time That Cryptos Have ‘Died’ Rumours of crypto’s death have been greatly exaggerated. Apparently, last week was the 419th time that cryptocurrencies have died. Get used to it. As we pointed out in Why Cryptocurrencies Are Here To Stay… cryptocurrencies can suffer deep corrections from which they fully resurrect. Since 2013, the bitcoin price has suffered 17 drawdowns of more than 50 percent and an additional 11 drawdowns of 25-50 percent.2 Rumours of crypto’s death have been greatly exaggerated. We will not repeat the arguments why cryptos are here to stay, which were detailed in our Special Report, but we will discuss the recent price action. Why did cryptos correct? The simple answer is that their fractal structure had become extremely fragile, making the price extremely vulnerable to the slightest negative catalyst (Chart I-7). Chart I-7The Fractal Structure Of Cryptos Had Become Very Fragile
The Fractal Structure Of Cryptos Had Become Very Fragile
The Fractal Structure Of Cryptos Had Become Very Fragile
A fragile fractal structure signifies that longer-term investors have disappeared from the price setting process. This means that price evolution is the result of more and more short-term traders joining the trend. Eventually though, there are no more short-term traders left to buy at the current price. So, when somebody wants to sell – perhaps on some negative news – a longer-term investor must step in as the buyer. But the longer-term investor will only buy at a much lower price, meaning that the price suffers a deep correction. Empirically and theoretically, the price correction meets support at successive Fibonacci retracements of the preceding momentum-fuelled rally, because a new cohort of buyers enters at each retracement level. Hence, the key support levels in the current correction are the 23.6 percent and 38.2 percent retracements of the preceding rally. In the case of bitcoin, this equates to support at $32500 and $22750. Which of these support level will prevail? Our bias is the higher level, because successive crypto corrections are becoming less and less extreme – possibly because more and more institutional investors are now involved in the asset class (Chart I-8). Chart I-8Crypto Corrections Are Becoming Less Extreme
Crypto Corrections Are Becoming Less Extreme
Crypto Corrections Are Becoming Less Extreme
Hence, the latest correction in cryptos offers a good entry point. Albeit it is important to own a diversified basket that includes ‘proof of stake’ coins, such as ethereum. The Onset Of A Commodity Correction Finally this week, we highlight that iron ore prices are at the same level of fractal fragility that has marked previous major turning points in 2015 and 2019 (Chart I-9). Chart I-9Iron Ore Is Very Fragile
Iron Ore Is Very Fragile
Iron Ore Is Very Fragile
Combined with the fragility we have recently highlighted in lumber, agricultural commodities, industrial metals, and DRAM prices, it confirms the onset of a commodity correction. We have already discussed this theme in Don’t Panic About US Inflation and are exposed to it through short positions in PKB, CAD, and inflation expectations. Hence, there are no new trades this week. Dhaval Joshi Chief Strategist dhaval@bcaresearch.com Footnotes 1 Throughout this analysis, the unemployment rate is based on the unemployed that are ‘not on temporary layoff’. Full employment is defined as this unemployment rate reaching 1.5 percent, or the cycle low, whichever is the higher. 2 The drawdown is calculated versus the highest price in the preceding 6 months. Fractal Trading System Fractal Trades 6-Month Recommendations Structural Recommendations Closed Fractal Trades Closed Trades Asset Performance Equity Market Performance Indicators To Watch - Bond Yields Indicators To Watch - Bond Yields - Euro Area
Indicators To Watch - Bond Yields - Euro Area
Indicators To Watch - Bond Yields - Euro Area
Indicators To Watch - Bond Yields - Europe Ex Euro Area
Indicators To Watch - Bond Yields - Europe Ex Euro Area
Indicators To Watch - Bond Yields - Europe Ex Euro Area
Indicators To Watch - Bond Yields - Asia
Indicators To Watch - Bond Yields - Asia
Indicators To Watch - Bond Yields - Asia
Indicators To Watch - Bond Yields - Other Developed
Indicators To Watch - Bond Yields - Other Developed
Indicators To Watch - Bond Yields - Other Developed
Indicators To Watch - Interest Rate Expectations Indicators To Watch - Interest Rate Expectations
Indicators To Watch - Interest Rate Expectations
Indicators To Watch - Interest Rate Expectations
Indicators To Watch - Interest Rate Expectations
Indicators To Watch - Interest Rate Expectations
Indicators To Watch - Interest Rate Expectations
Indicators To Watch - Interest Rate Expectations
Indicators To Watch - Interest Rate Expectations
Indicators To Watch - Interest Rate Expectations
Indicators To Watch - Interest Rate Expectations
Indicators To Watch - Interest Rate Expectations
Indicators To Watch - Interest Rate Expectations