Equities
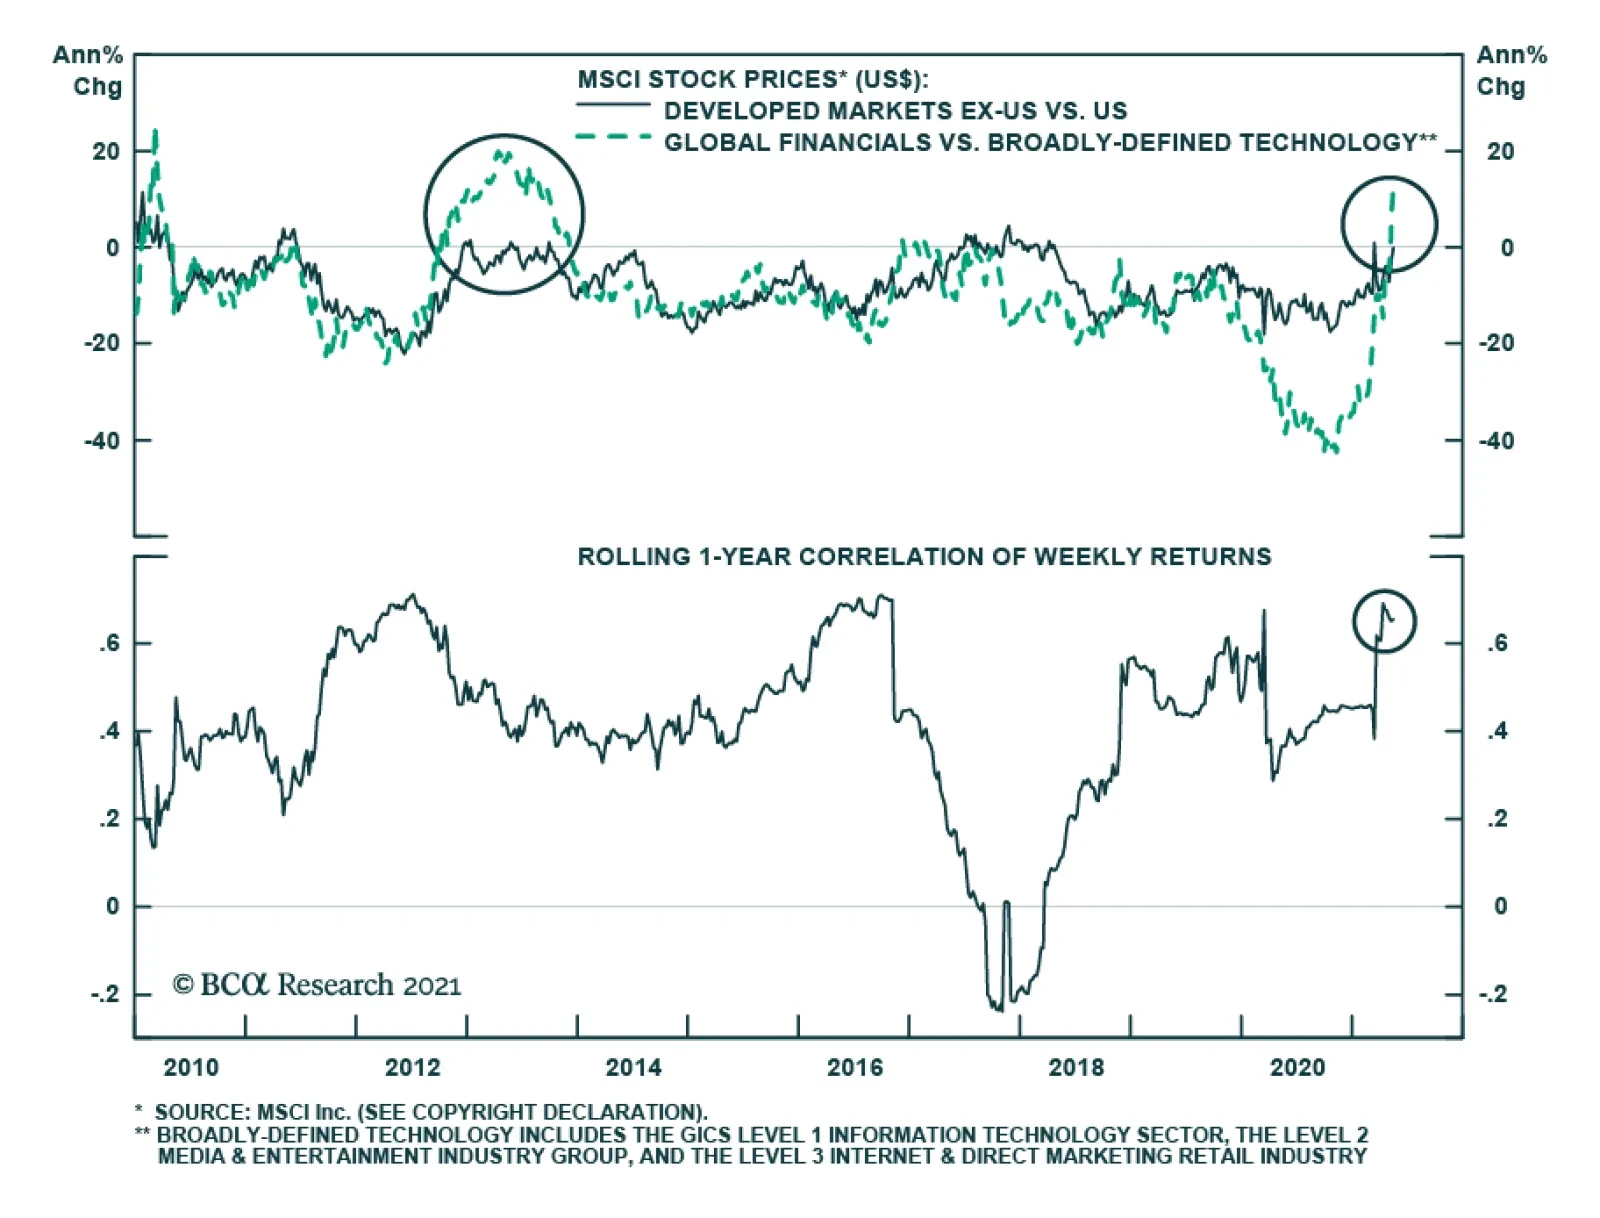
We noted in a previous Insight that regional equity allocation cannot always be derived from style and sector exposure. For example, we showed that global growth has underperformed value on a year-to-date basis, but that the tech-heavy US index had modestly…
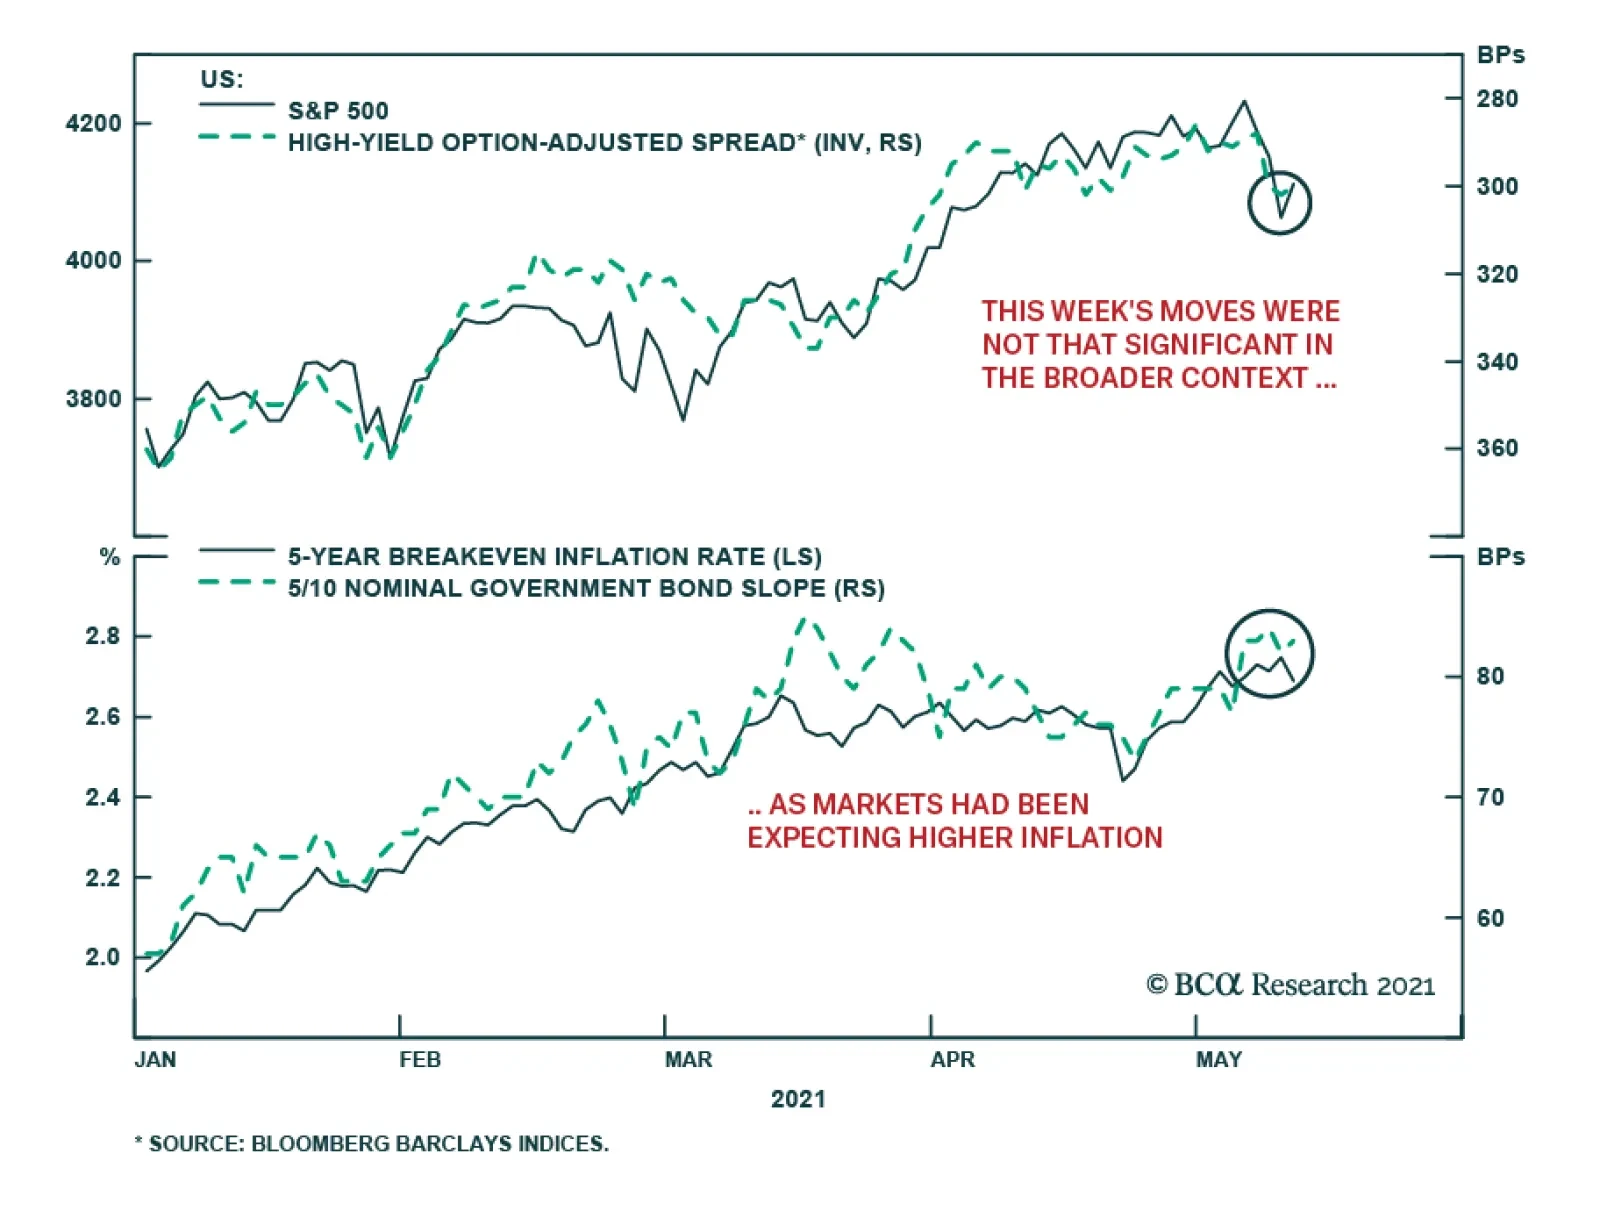
A chill went through US financial markets after the shockingly strong April US CPI report this past Wednesday. The S&P 500 plunged -2.1%, the NASDAQ fell -2.7% and the VIX index surged 6 points. Despite the risk-off tone in equities, US…

Chart 1
Chart 1
Chart 1
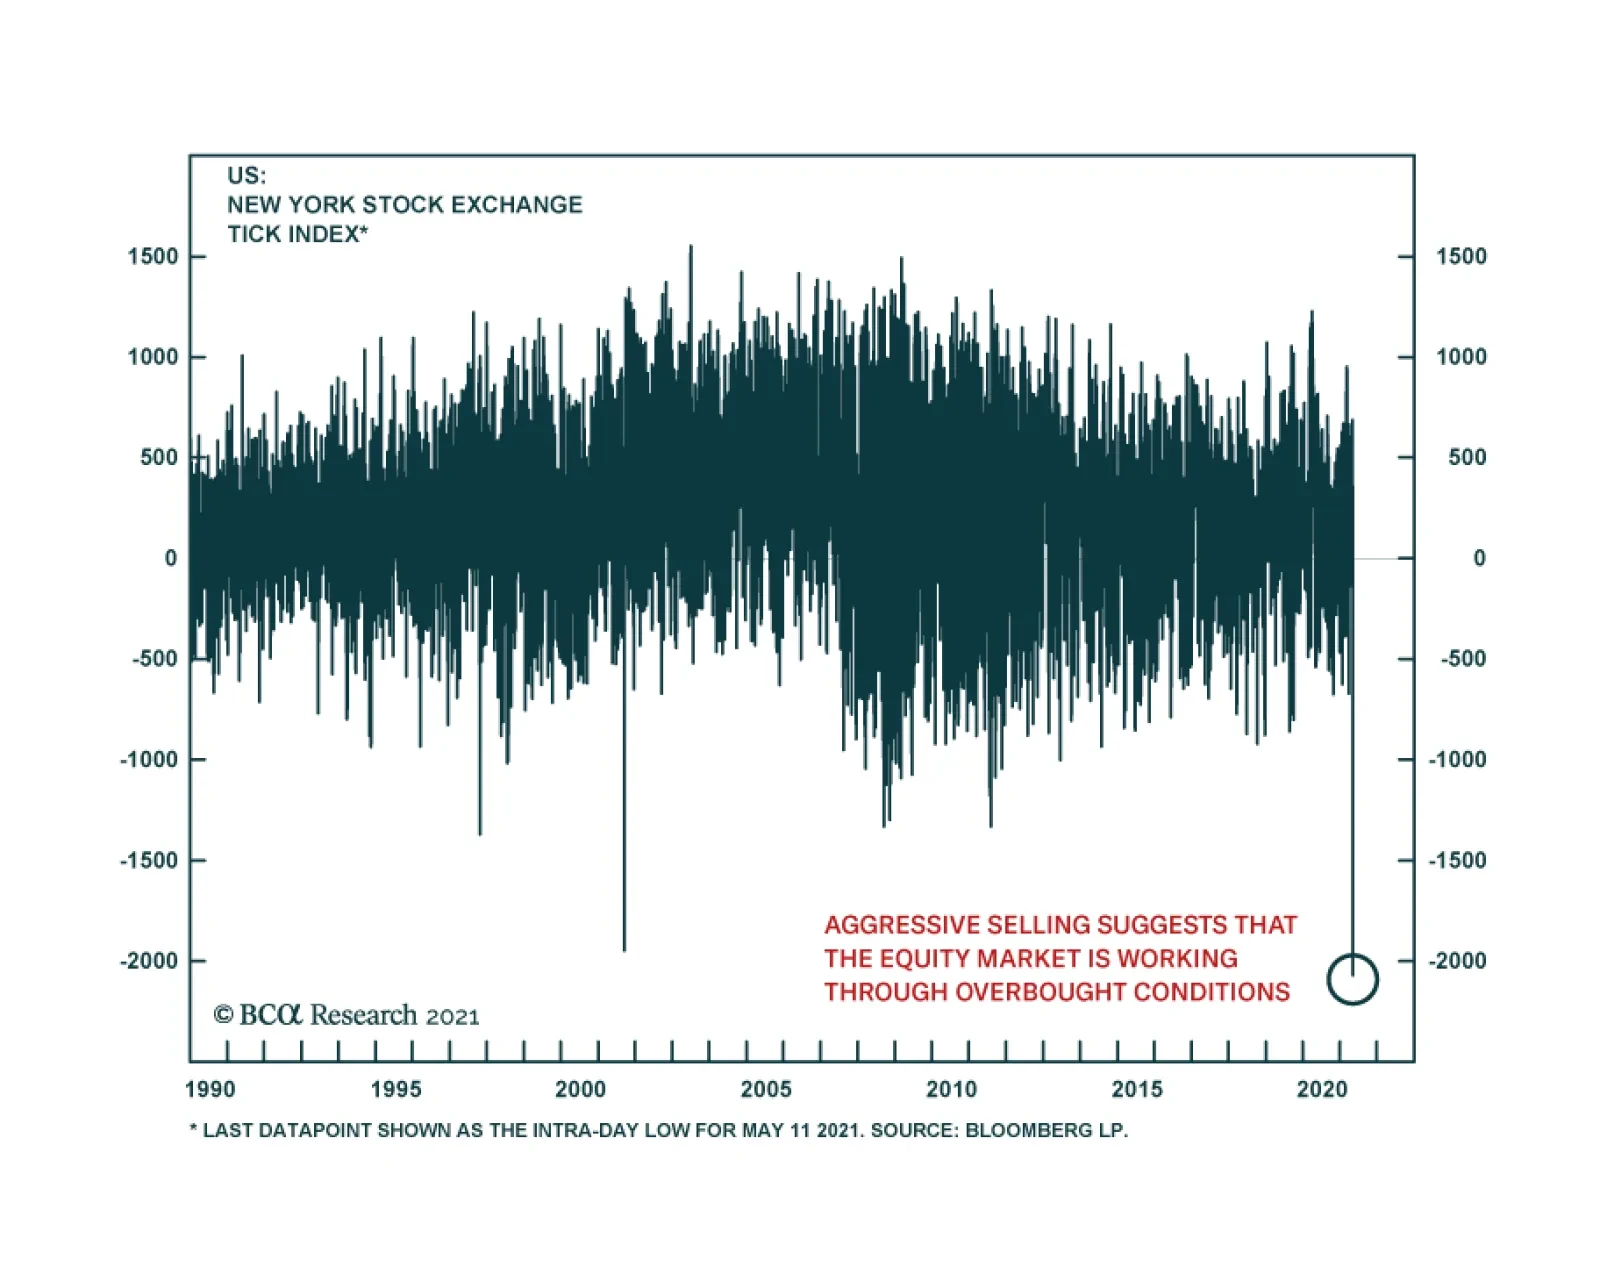
Fourteen months ago we penned a report titled “20 Reasons To Buy Equities” and now that the SPX is up 2,000 points since that trough, the risk/reward tradeoff is to the downside and we are compelled to book gains and raise some cash. On May 3 we upgraded health care to overweight and added some defensive exposure to our portfolio and last week we highlighted five technical reasons not to chase equities higher in the near term. What follows are 10 reasons to lighten up on stocks and therefore await a better entry point to deploy fresh capital later this summer: 1. The Fed and other developed global central banks’ easing has reached a peak. In fact, taper has started at the BoC and the BoE announced a quasi-taper, the ECB is rumored to commence decreasing asset purchases this summer and the Fed will likely taper by yearend (Chart 1). 2. US fiscal easing has also hit an apex and a large fiscal cliff looms in 2022 a mid-term election year (Chart 2). 3. The bulls have taken full control of the equity market and our Risk Appetite Indicator recently touched the four standard deviations line (Chart 2). 4. The ISM manufacturing survey peaked near 65 and the non-manufacturing hit an all-time high (Chart 2). 5. China’s is in a slowdown mode and BCA’s total social financing projections indicate a further deceleration in the back half of the year (Chart 1). Chart 2
Chart 2
Chart 2
Chart 3
Chart 3
Chart 3
6. Equity market internals have been signaling trouble since February, warning that this bifurcated market is in desperate need of a breather (Chart 3). 7. The VIX in mid-April had a 15 handle for the first time since early last year, warning that investors are complacent (Chart 3). 8. Similarly, the junk bond option adjusted spread is at cyclical lows, and financial conditions are as good as they get probing all-time lows (Chart 2). 9. SPX profit growth is slated to jump 34% in calendar 2021, according to the latest I/B/E/S estimates with EPS on track to hit an all-time high level of $188 (Chart 3). 10. Finally, valuations remain lofty with the forward P/E ratio hovering near 22 an historically high level (Chart 3). Bottom Line: The easy money has been made since the March 23, 2020 trough when the SPX was 2,000 points lower. Our sense is that the next 10% move in the SPX is lower (close to 3,800) rather than higher and a healthy and much needed reset looms. Thus, we recommend investors book some gains, raise some dry powder and be prepared to deploy fresh capital later this summer.
Feature Chinese stocks remain in limbo despite robust economic data in April and early May (Chart 1). Onshore equities are pricing in policy tightening risks and a peak in the domestic economic cycle. Meanwhile, a regulatory clampdown on the tech sector continues to curb global investors’ enthusiasm towards Chinese investable stocks. The PBoC has not changed its course of policy normalization. The falling 3-month SHIBOR since March likely reflects softening demand for interbank liquidity rather than monetary easing (Chart 2). Chart 1Stay Underweight Chinese Stocks
Stay Underweight Chinese Stocks
Stay Underweight Chinese Stocks
Chart 2No Easing In Monetary Policy
No Easing In Monetary Policy
No Easing In Monetary Policy
Fiscal policy has also been consolidating with a renewed focus on reducing local government debt load and financial risks. A delay in local government bond issuance in Q1 could potentially boost bond sales in the second half of the year. However, as we noted late last month, without a synchronized policy push for more bank loans and loosened regulations on provincial government spending, an increase in special-purpose bond issuance alone will not make a significant difference in infrastructure investment nor economic growth. We still expect China's economy, which lags the credit cycle by six to nine months, to start weakening by mid-2021 (Chart 3A & 3B). Chart 3ADomestic Economic Growth Set To Slow
Domestic Economic Growth Set To Slow
Domestic Economic Growth Set To Slow
Chart 3BPolicy Tightening Will Weigh On Earnings Growth In 2H21
Policy Tightening Will Weigh On Earnings Growth In 2H21
Policy Tightening Will Weigh On Earnings Growth In 2H21
Qingyun Xu, CFA Associate Editor qingyunx@bcaresearch.com Our BCA Li Keqiang Leading Indicator continues to fall despite a marginal improvement in the Monetary Conditions Index (MCI) component. The deceleration in both money supply and credit growth has more than offset a small uptick in the MCI (Chart 4). Furthermore, a rising RMB in trade-weighted and real terms will not help the profit outlook for China’s exporters (Chart 5). Overall, monetary conditions remain unfavorable for risk assets. This is consistent with the poor performance of Chinese stocks Chart 4Falling Credit And Money Growth More Than Offset A Minor Improvement In The MCI
Falling Credit And Money Growth More Than Offset A Minor Improvement In The MCI
Falling Credit And Money Growth More Than Offset A Minor Improvement In The MCI
Chart 5Strengthening RMB Will Not Help The Profit Outlook For Chinese Exporters
Strengthening RMB Will Not Help The Profit Outlook For Chinese Exporters
Strengthening RMB Will Not Help The Profit Outlook For Chinese Exporters
A sharp jump in state-owned enterprise (SOE) defaults since late last year is due to deteriorating corporate balance sheets. The defaults have exposed the weakened fiscal positions of local governments (Chart 6 & 7). SOE bond defaults have surpassed the number of private bond defaults this year. The more restrictive policy on local government financing, together with an acceleration in SOE defaults, will weigh on spending by local governments, local government financing vehicles (LGFVs) and SOEs. Chart 6Returns On SOE Assets Remain In Deep Contraction
Returns On SOE Assets Remain In Deep Contraction
Returns On SOE Assets Remain In Deep Contraction
Chart 7SOE Bond Defaults Have Surpassed Private Bond Defaults
China Macro And Market Review
China Macro And Market Review
The Politburo meeting on April 30 established new guidelines to reduce local government leverage, both on- and off-balance sheet debt. According to the new rules, local governments are strictly prohibited from obtaining “hidden debts” for new investment projects directly or through their affiliated SOEs, which include LGFVs. The directives also state that the assets of LGFVs with defaulted loans should be restructured or liquidated if companies are unable to repay their debts. In addition, financial institutions should not accept government guarantees when making decisions on lending to LGFVs or government related entities. Moreover, stricter measures in the property market have further dampened local governments’ fiscal situations since land sales account for 53% of local government fiscal revenues. Growth in government expenditures decelerated in recent months along with slowing land auctions (Chart 8). Scaled down fiscal supports will lead to subdued infrastructure investment growth this year (Chart 9). Chart 8Fiscal Stance Has Tightened
Fiscal Stance Has Tightened
Fiscal Stance Has Tightened
Chart 9Subdued Growth In Infrastructure Investments
Subdued Growth In Infrastructure Investments
Subdued Growth In Infrastructure Investments
In addition to policy tightening in the domestic economy, Chinese offshore stocks continue to face regulatory headwinds to root out monopolies in technology, media, and telecom (TMT) companies. The antitrust investigations and fines extending from Alibaba and Tencent to Meituan highlight China’s aim to curb platform oligopolies and monopolies. Meanwhile, Chinese tech firms listed on US exchanges are facing another regulatory threat on their accounting reporting standards, which could potentially result in their delisting from the US bourses. Moreover, elevated valuations and a weakening in the earnings outlook will generate more downside risks for TMT stocks (Chart 10). Given that TMT stocks account for around 50% of the MSCI China Index’s market capitalization, Chinese investable stocks are disproportionally vulnerable to a selloff in TMT stocks (Chart 11). Chart 10ATMT Stocks: From Tailwind To Headwind
TMT Stocks: From Tailwind To Headwind
TMT Stocks: From Tailwind To Headwind
Chart 10BTMT Stocks: From Tailwind To Headwind
TMT Stocks: From Tailwind To Headwind
TMT Stocks: From Tailwind To Headwind
Chart 11MSCI China Is Highly Concentrated In TMT Stocks
MSCI China Is Highly Concentrated In TMT Stocks
MSCI China Is Highly Concentrated In TMT Stocks
China’s official PMI and the Caixin China PMI moved in opposite directions in April due to the nature of the two surveys. The Caixin PMI covers smaller, more export-oriented businesses while the NBS Manufacturing PMI includes larger, more domestically exposed companies. The divergence highlights that the domestic economy is losing speed while external demand remains robust (Chart 12). Given the dominance of domestic demand in China’s economy (investment expenditures, household spending and government spending), strong external demand will not fully offset the deceleration in domestic growth. New orders and production subcomponents in the official PMI moderated in April from March, which indicates a slowing momentum in economic activity (Chart 13). Moreover, construction PMI fell to 57.4 from 62.3 in March, corresponding with weaker infrastructure spending and more policy tightening in the real estate sector (Chart 13, bottom panel). Chart 12Conflicting Messages From The NBS And Caixin PMIs
Conflicting Messages From The NBS And Caixin PMIs
Conflicting Messages From The NBS And Caixin PMIs
Chart 13Slowing Momentum In China's Economic Activity
Slowing Momentum In China's Economic Activity
Slowing Momentum In China's Economic Activity
The moderating momentum in China’s economy is also reflected in April’s trade data, which showed a strengthening external sector and a slowing domestic demand. A few observations support our view: First, strong imports since early this year were partly due to robust re-exports. Solid external demand boosted processing imports, which in turn contributed to China’s overall import growth (Chart 14). Secondly, Chinese imports of commodities in volume, such as copper and steel products, have plunged recently. Chinese domestic demand for commodities will likely peak in the coming months, therefore, inventory destocking pressures and weakness in underlying consumption will threaten commodities prices (Chart 15). Finally, the strengthening of coal imports in volume terms may be related to China’s increasingly stringent environmental policies. A temporary cutback in domestic coal supply boosted the demand for imports. However, in the long run, China’s push for green energy will be bearish for Chinese coal imports (Chart 16). Chart 14Solid External Demand Boosted Processing Imports
Solid External Demand Boosted Processing Imports
Solid External Demand Boosted Processing Imports
Chart 15Demand Of Commodities May Be Approaching A Cyclical Peak
Demand Of Commodities May Be Approaching A Cyclical Peak
Demand Of Commodities May Be Approaching A Cyclical Peak
Chart 16China's Coal Imports Likely To Decline In The Long Run
China's Coal Imports Likely To Decline In The Long Run
China's Coal Imports Likely To Decline In The Long Run
Housing prices in tier-one cities continue to post major gains despite a slew of tightening regulations in the property sector introduced since the second half of last year (Chart 17). The Politburo meeting last month reiterated authorities’ concerns over a bubble in housing. We expect authorities to impose additional regulations to constrain both financing supply and demand in the property sector. In the meantime, the existing policies have successfully started to cool the real estate market. Chart 17Skyrocketing Housing Prices In First-Tier Cities
Skyrocketing Housing Prices In First-Tier Cities
Skyrocketing Housing Prices In First-Tier Cities
Chart 18Real Estate And Mortgage Loans Tumbled Under More Restrictive Borrowing Regulations
Real Estate And Mortgage Loans Tumbled Under More Restrictive Borrowing Regulations
Real Estate And Mortgage Loans Tumbled Under More Restrictive Borrowing Regulations
Both mortgage loans and loans to real estate developers tumbled under more restrictive borrowing policies (Chart 18). Growth in home sales has also started to roll over (Chart 19). Housing completed has dropped significantly, which confirms that construction activity is decelerating. Looking forward, the reduced expansion rate of new projects due to shrinking land transfers and stricter borrowing regulations will further dampen construction activities in the second half of this year (Chart 20). Chart 19Home Sales Growth Started To Ease
Home Sales Growth Started To Ease
Home Sales Growth Started To Ease
Chart 20Real Estate Investments Are Set To Slow Further
Real Estate Investments Are Set To Slow Further
Real Estate Investments Are Set To Slow Further
Table 1China Macro Data Summary
China Macro And Market Review
China Macro And Market Review
Table 2China Financial Market Performance Summary
China Macro And Market Review
China Macro And Market Review
Footnotes Cyclical Investment Stance Equity Sector Recommendations
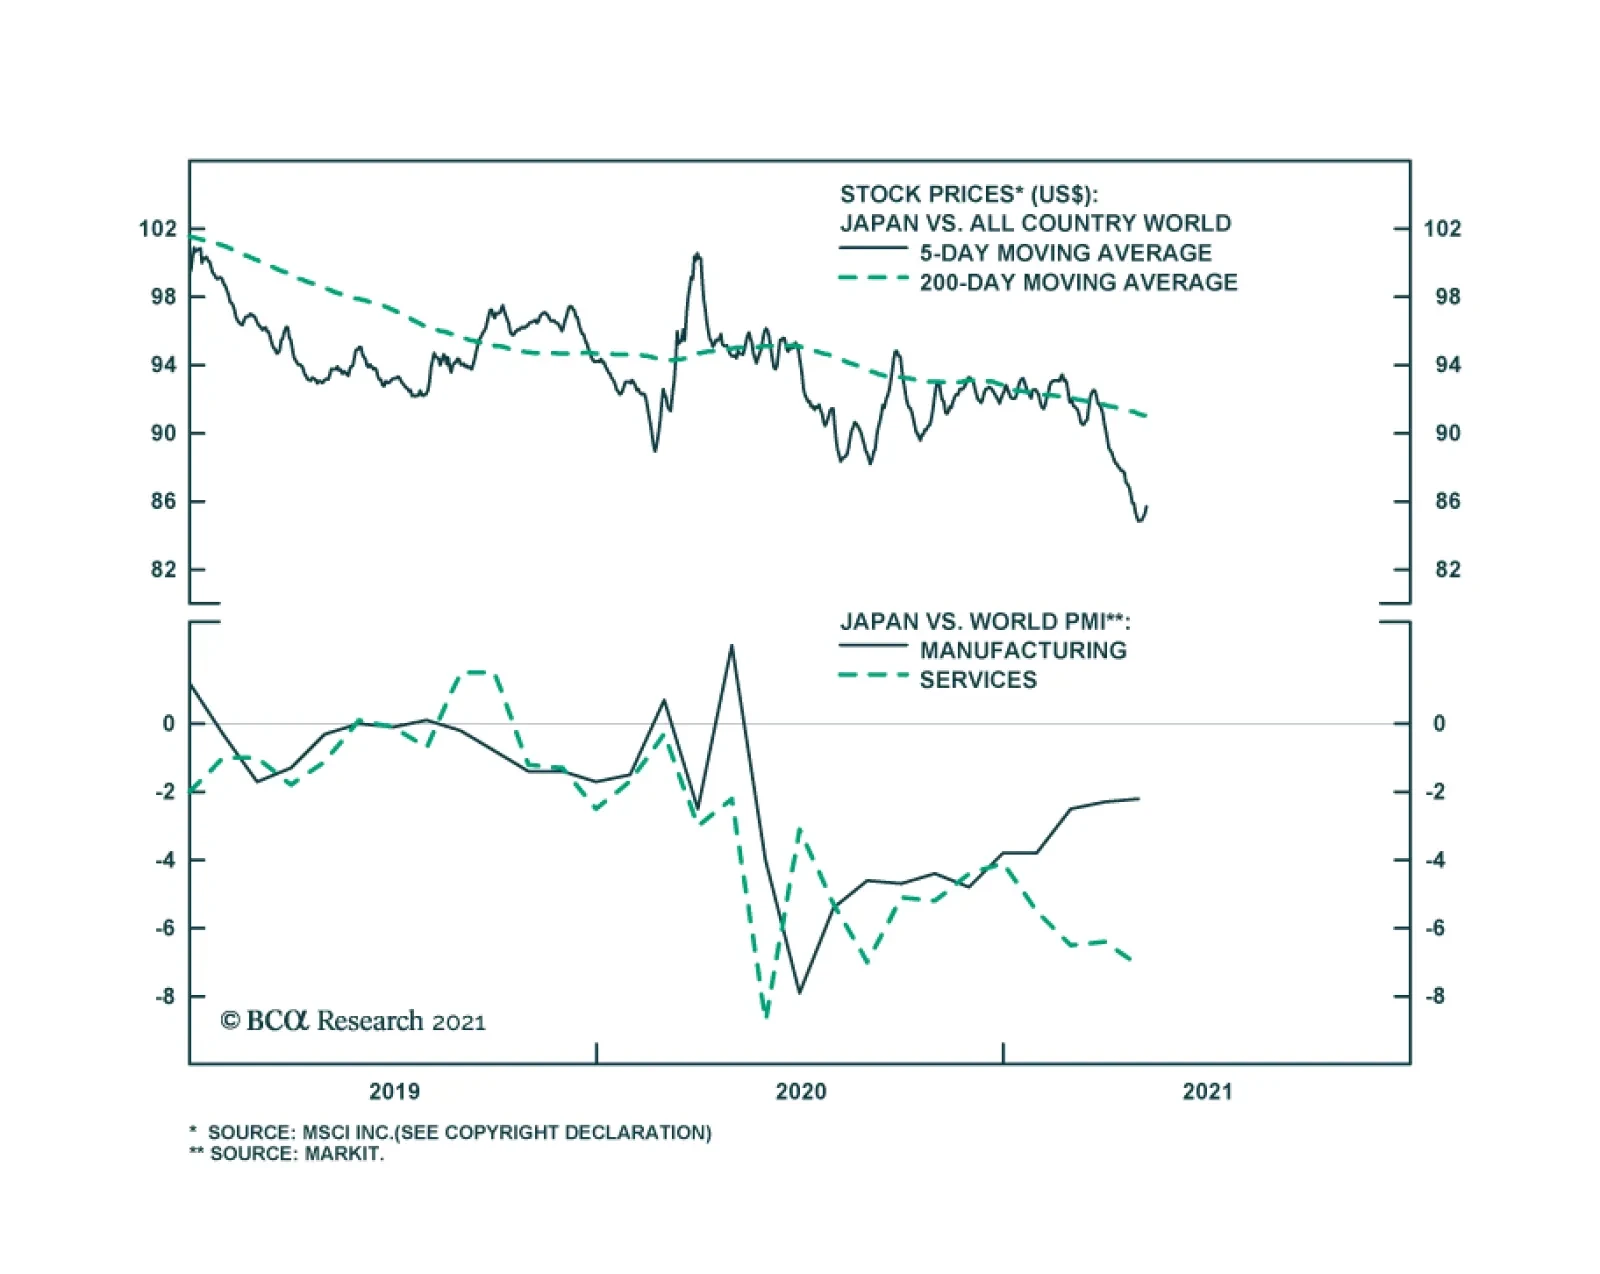
Since the beginning of the calendar year, global stock prices have risen roughly 10% in US$ terms. The Japanese equity market, by contrast, has barely risen, resulting in a whopping 8.5% underperformance. Most of this underperformance has occurred since…
The five-year breakeven rate hit the highest level since 2006 on Monday as bond investors adjusted to price in higher inflation expectations. The repricing triggered a broad-based selloff in equities that spilled into Tuesday. Long-duration, interest-rate…
Dear client, Next Monday May 17, instead of sending you a Strategy Report we will be hosting our quarterly webcast “From Alpha To Omega With Anastasios” at 10am EST with two special guests, addressing the recent market moves and discussing the US equity market outlook. Kind Regards, Anastasios In this Monday’s Special Report, we attempted to quantify the border between deflation and inflation. We relied on empirical data and examined the relationship between core CPI inflation and equites. We found that the S&P 500 P/E multiple typically peaks when core CPI inflation reaches 2.3% and begins to decline once inflation climbs above 2.5% (see chart). The only adjustment we made to the 2.5% number was instead of looking at a specific inflection level, we turned it into a range of 2.3-2.7%. To confirm our 2.3-2.7% estimate, we also examined the relationship between core CPI inflation and fixed income, which can be found on page 3 of our most recent Special Report along with a discussion on select GICS1 level sector positioning during periods of “true” inflation, as opposed to reflation.
Quantifying The Border Between Inflation And Deflation
Quantifying The Border Between Inflation And Deflation
BCA Research’s European Investment Strategy service downgraded UK small-cap stocks to neutral on a tactical basis. Despite the positive UK economic outlook, investors should adopt a more cautious tactical stance toward UK markets. The problem for British…
Highlights Important leading indicators of Eurozone activity point to record growth in the coming quarters. Progress on the vaccination front, global pent-up demand, and easing fiscal policy will fuel the Euro Area recovery. Consensus growth expectations for the Eurozone do not reflect this upbeat outlook; hence, European economic surprises will remain firm. Robust economic surprises will help European stocks, especially small-cap ones. They will also allow for a stronger EUR/USD and rising German 10-year yields. The UK economy is strong, and the BoE will be among the first central banks to tighten policy meaningfully. However, investors understand the UK’s strength well. While the cyclical outlook for the pound is bright against both the USD and the EUR, the GBP is vulnerable to some near-term profit taking. Downgrade UK small-cap stocks to neutral on a tactical basis. Feature The case for the Eurozone’s recovery is only growing stronger. However, consensus growth forecasts for the Euro Area remain modest. Faced with this dichotomy, the European economy has ample room to generate positive surprises in the coming months. This process will support European financial assets, small-cap stocks in particular. This contrasts with UK assets, where investors have already embedded generous growth assumptions in response to the country’s rapid pace of vaccination. A tactical downgrade of UK small-cap equities is appropriate. Surprise! Two indicators from outside the Eurozone point to an elevated likelihood that the European economy will generate some exceptionally strong growth numbers over the coming 12 months. First, the Swiss KOF Economic Barometer hit an all-time high in April. The KOF series is an excellent leading indicator of Switzerland’s economic activity, and it currently forecasts record GDP growth and PMIs for that country (Chart 1). This message of strength for Switzerland bodes well for the Eurozone. While the Swiss market is defensive, owing to its heavy exposure to healthcare and consumer staple stocks, the Swiss economy is pro-cyclical. Exports represent 60% of GDP, and exports to the Eurozone account for 40% of this total. Moreover, the growth-sensitive machinery, consumer goods, and chemicals categories account for almost 50% of shipments. Based on these observations, the KOF Economic Barometer forecasting ability unsurprisingly extends beyond Swiss economic variables; it also anticipates positive growth for the Global Manufacturing PMI, the Euro Area Manufacturing PMI, and the Eurozone’s forward earnings (Chart 2). Chart 1Climbing Swiss Peaks
Climbing Swiss Peaks
Climbing Swiss Peaks
Chart 2A Good Sign For The Eurozone
A Good Sign For The Eurozone
A Good Sign For The Eurozone
Second, an aggregation of Swedish economic data confirms the KOF indicator’s message and also calls for record economic activity in Europe. Our Swedish Economic Diffusion Index, which incorporates 14 data series from the Nordic country, points toward a further acceleration in the Euro Area PMIs relative to the US (Chart 3). It is also consistent with a pick-up in the performance of European equities relative to the US. These important indicators of the European economy reflect a variety of forces at play that increasingly point toward stronger growth. Among them, the improvement in the pace of vaccination is crucial to lifting the mood across the continent. As the top panel of Chart 4 illustrates, the number of daily vaccine doses administered across major Euro Area economies is accelerating sharply. While it took three months to inoculate 20% of the population, it only took one month to raise the vaccinated population to nearly 40% (Chart 4, bottom panel). Chart 3Sweden Leads The Eurozone
Sweden Leads The Eurozone
Sweden Leads The Eurozone
Chart 4Accelerating Vaccinations
Accelerating Vaccinations
Accelerating Vaccinations
Euro Area fiscal policy is also moving in a more growth-friendly direction. The Italian Budget announced on April 26 will add EUR248 billion in spending over the next six years. For the moment, Germany has abandoned its debt brake, and, as we wrote three weeks ago, the September election is likely to reify this outcome and further ease fiscal policy in Europe’s biggest economy. Spain is the second largest recipient of the NGEU funds, and it is expected to increase fiscal spending by EUR167 billion over the coming six years. In addition, France has yet to give clear hints about its plan, but next year’s elections are likely to result in further stimulus measures as well. Thus, fiscal easing in Europe will only increase from this point on (Chart 5). Chart 5The Expanding European Stimulus
A Surprising Dance
A Surprising Dance
Accumulated pent-up demand remains another potent fuel for growth in the Euro Area. Unlike in the US, spending on durable goods in the Eurozone has not overtaken its pre-pandemic levels (Chart 6). Furthermore, global inventory-to-sales ratio are low, which hints at a coming inventory restocking cycle. These two trends will benefit Euro Area economic activity. The service sector recovery has more to go. Despite some recent improvements, the Eurozone’s Service PMI remains depressed compared to that of the US (Chart 7, top panel). However, the acceleration in the European vaccination campaign and the continued injection of fiscal support at the same time as the lockdowns ebb should result in a significant catch up in service activity in the Euro Area. Thus, the double-dip recession is on the verge of ending and giving way to a robust GDP expansion (Chart 7, bottom panel). Chart 6Ample European Pent-up Demand
Ample European Pent-up Demand
Ample European Pent-up Demand
Chart 7The Service Sector Recovery Is Paramount
The Service Sector Recovery Is Paramount
The Service Sector Recovery Is Paramount
Even though the recovery in GDP growth will lead to strong positive economic surprises for the Euro Area, consensus growth expectations for the region remain conservative. According to Bloomberg, Eurozone annual GDP growth is expected to reach 12.6% in Q2 because of an extremely strong base effect. However, growth will decelerate suddenly and hit 2.3% in Q3 and 4.3% in Q4. Growth is anticipated to be 4.1% in 2022. These are low thresholds to beat, and thus, economic surprises will remain positive. Chart 8Decomposing The Surprises
Decomposing The Surprises
Decomposing The Surprises
The source of positive economic surprises is likely to be broad-based. If the service sector recaptures some of its previous shine, the Surveys and Business Cycle component and the Labor Market component of the Bloomberg surprises index will improve and remain positive for many months (Chart 8). Moreover, the absorption of pent-up demand will allow the Retail and Wholesale as well the Personal/Household components to remain robust or firm up further. Finally, the strength of the global manufacturing sector and the elevated potential for a global inventory restocking will allow the Industrial component to firm up anew. Bottom Line: The European economy is in a good place to validate the upbeat message from the KOF Economic Barometer or the Swedish Economic Diffusion Index. Since expectations for European economic activity are still limited for the second half of 2021, this strong growth performance will result in positive economic surprises. Investment Implications The heightened odds that Europe will generate significant positive economic surprises for the coming quarters means that investors’ perspective of the Euro Area will gradually improve. While this process will ultimately curtail the ability of Europe to beat expectations, it will also lift Eurozone assets. If our forecast is correct that European economic surprises will largely be positive over the coming 6 to 12 months, then European equities are more likely to generate generous returns than otherwise. Table 1 highlights that positive changes in the Economic Surprise Index (ESI) on a 3-month, 6-month, and 12-month horizon coincide with returns of the Euro Area MSCI equity benchmarks that have positive batting averages of 72%, 70%, and 73%, respectively. Moreover, the average and median returns are significantly higher than when the ESI deteriorates. Table 1Forecasting Strong Surprises Means Forecasting Strong Equity Returns
A Surprising Dance
A Surprising Dance
The signal from the ESI is weaker if we do not make forecasts about its direction. The batting averages of subsequent 3-month and 6-month equity returns following an improving ESI are 63% and 69%, respectively, and the median subsequent returns are higher than if today’s ESI is deteriorating, but not to the same extent as when we make a forecast of the ESI. 12-month returns for the Eurozone MSCI index have a 58% chance of being positive, if the ESI increases over a 12-month window, which is lower than the 63% batting average if the ESI worsens. Moreover, average and median 12-month expected returns are somewhat higher if the ESI has been deteriorating rather than improving over the past 12-month period. European small cap equities will be prime beneficiaries of the coming growth outperformance. From an economic perspective, this makes sense because small-cap stocks are geared more toward domestic growth than large-cap equities, which are dominated by multinationals. Table 2 shows that 3-month, 6-month, and 12-month periods of improvement in the surprise index precede an outperformance of small-cap relative to large-cap stocks over similar windows of time. Thus, the current positive level of the European ESI and its ability to rise further should favor small-cap European equities. Table 2Favor Small-Cap Stocks
A Surprising Dance
A Surprising Dance
Table 3A Bullish Backdrop For EUR/USD
A Surprising Dance
A Surprising Dance
The same exercise shows that the outlook also favors the euro. European economic surprises should continue to outpace the US, because Eurozone growth will catch up to the US, but investors already have much loftier expectations for US activity than for the Euro Area. Table 3 illustrates that periods when the Eurozone’s ESI is greater than that of the US, EUR/USD generates a positive 3-month return 65% of the time, with a median gain of 1.3%. When the US ESI is higher, the EUR/USD depreciates 55% of the time, with a median loss of -0.5%. Chart 9Rising German Yields?
Rising German Yields?
Rising German Yields?
Finally, the potential for stronger European ESI is negative for Bunds. Speeches by various members of the European Central Bank Governing Council indicate that the ECB will tolerate higher yields, if they reflect stronger economic activity. As the European vaccination campaign advances and the fiscal stimulus increases, the need to maintain depressed Bunds yields recedes. Hence, a continuation of positive ESI readings is now more likely to boost these yields. Additionally, the gap between the European ESI and the US one will remain positive, thus, a period of rising German yields relative to the US is more likely (Chart 9). Bottom Line: The ability of the European economy to continue to surprise positively should generate attractive equity returns on the continent. Moreover, this economic backdrop is consistent with an outperformance of small-cap equities, as well as an appreciating EUR/USD. Under these circumstances, Bunds yields should experience more upside. Country Focus: The UK’s Outlook Is Brightening, Unsurprisingly Last week, the Bank of England left the total size of its asset purchase program in place at GBP875 billion, even if the weekly pace of purchases was slowed to GBP3.4 billion from GBP4.4 billion. The BoE also raised its 2021 growth forecast to 7.5%, from 5% in February. The BoE is joining the Bank of Canada as one of the first central banks to taper its asset purchase program. It will also be one of the first central banks to increase interest rates, after the Norges Bank, but ahead of the Fed. In a way, the UK shares many similarities with our recent positive depiction of the Swedish economy. Chart 10Support For Household Net Worth
Support For Household Net Worth
Support For Household Net Worth
The rapid pace of vaccination in the UK allows for a vigorous economic recovery. In all likelihood, the UK economy will have contracted in Q1 2021 because of the severe lockdowns that prevailed then; however, these lockdowns are being eased and economic fundamentals point up. Our Global Fixed Income and Foreign Exchange strategists recently demonstrated that house prices are increasing on the back of rising mortgage approvals and falling household debt-servicing obligations (Chart 10). The robust readings of the RICS House Prices survey only confirm the positive outlook for housing prices. Expanding house prices will elevate consumption. An appreciating housing stock boosts the wealth of households and leads to higher UK consumer confidence. Moreover, business confidence is improving; the rise in capex intentions not only indicates that investments will increase, but is also a precursor to climbing job vacancies (Chart 11). Brighter labor market prospects often result in rising consumption, especially if wages firm up, as we argued seven weeks ago. The current bout of economic strength points to some upside in UK inflation as well. The elevated PMI readings and the rapid increase in construction activity are reliable forecasters of higher CPI prints (Chart 12). However, this not a uniquely British phenomenon, and it remains to be seen how durable this rising inflation will be. Chart 11UK Consumption Will Rise More
UK Consumption Will Rise More
UK Consumption Will Rise More
Chart 12Accelerating UK Inflation
Accelerating UK Inflation
Accelerating UK Inflation
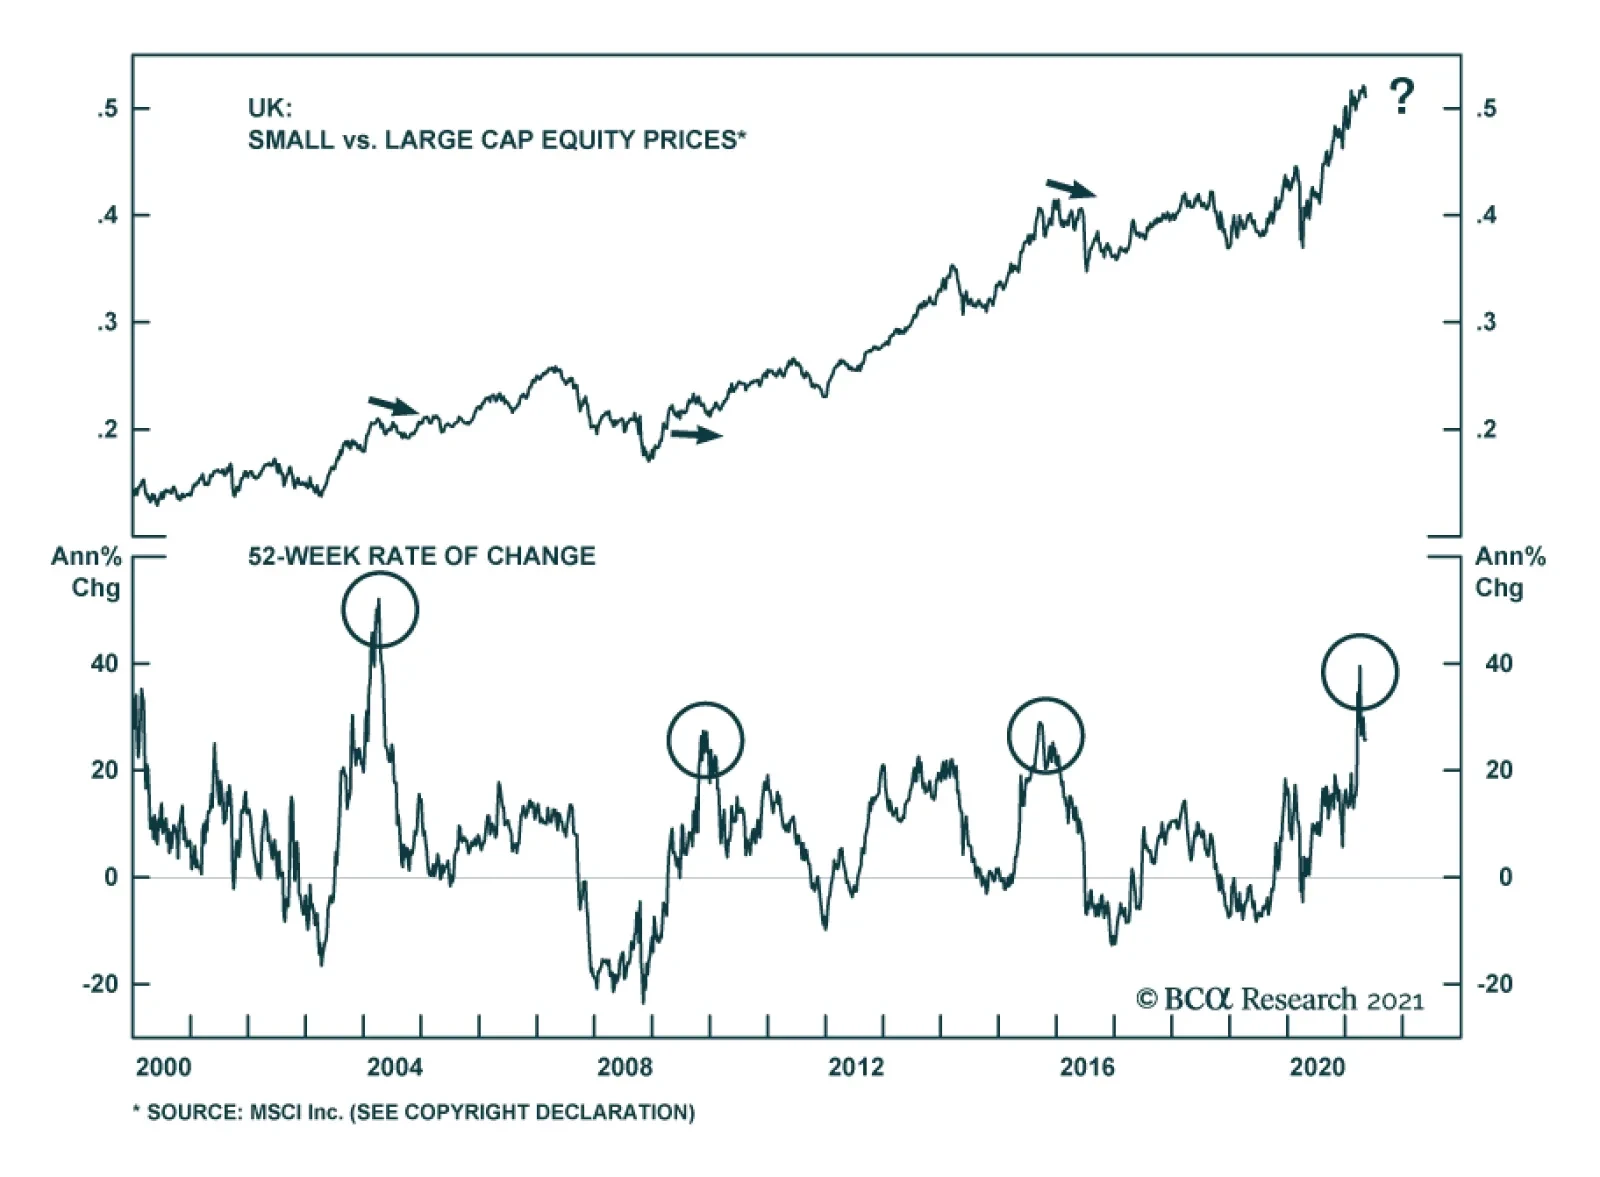
Despite this positive economic outlook, investors should adopt a more cautious tactical stance toward UK markets. The problem for British assets is that investors have understood UK’s vaccination strength so well that they embed much optimism in the price of financial instruments levered to domestic economic activity. In contrast to the Eurozone, Bloomberg consensus forecast anticipate Q2 year-on-year GDP growth of 20.7%, 6.1% for Q3 and 6.5% for Q4. Cable is particularly ripe for some near-term profit taking. Our Intermediate-Term Technical Indicator and the 52-week rate of change of GBP/USD, as well as net speculative positions and sentiment, all point to a correction in that pair (Chart 13). Moreover, the 13-week momentum measure for EUR/GBP shows that the rapid decline in this cross is also overdone. As a result, BCA’s Foreign Exchange strategists closed their short EUR/GBP position to book some gains. It is also time to downgrade British mid- and small-cap stocks from our current overweight stance, at least on a tactical basis. Compared to large-cap UK stocks, small-cap names have moved in a parabolic fashion, and the ratio’s elevated 52-week rate-of-change measure warns of a pullback, especially in light of the deterioration in near-term momentum (Chart 14). The message from technical indicators is particularly concerning, because the forward earnings of small-cap stocks are plunging relative to large cap ones (Chart 15). Additionally, valuation multiples on UK small-cap stocks have vastly outpaced those of their larger counterparts, despite a rapid decline in relative RoE (Chart 16). Chart 13Cable Is Ripe For Some Near-Term Profit Taking
Cable Is Ripe For Some Near-Term Profit Taking
Cable Is Ripe For Some Near-Term Profit Taking
Chart 14UK Small-Cap Stocks Are Technically Vulnerable
UK Small-Cap Stocks Are Technically Vulnerable
UK Small-Cap Stocks Are Technically Vulnerable
Chart 15Deteriorating Profit Performance
Deteriorating Profit Performance
Deteriorating Profit Performance
Chart 16Quite The Valuation Premium
Quite The Valuation Premium
Quite The Valuation Premium
Ultimately, these cautious views are of a short-term nature. BCA’s Foreign Exchange strategists remain upbeat on the pound on a 12- to 24-month basis. Cable continues to trade at a deep discount to our purchasing-power parity estimate, which adjusts for the composition of price indexes in the UK and the US (Chart 17). Moreover, real short rate differentials still favor GBP/USD. The pound also trades at a discount to the euro based on long-term valuation metrics. Most importantly, real interest rates differentials at both the short- and long-end of the curve, as well as the outlook for the evolution of monetary policy in the UK relative to the Euro Area, indicate a significantly lower EUR/GBP (Chart 18). Chart 17Despite Nera-term risks, Cable's Cyclical Underpinning Is Strong
Despite Nera-term risks, Cable's Cyclical Underpinning Is Strong
Despite Nera-term risks, Cable's Cyclical Underpinning Is Strong
Chart 18Lower EUR/GBP Ahead
Lower EUR/GBP Ahead
Lower EUR/GBP Ahead
For small-cap equities, the cyclical picture is more complex. On the one hand, their domestic exposure and a higher pound over the coming 12 to 24 months should help them, unlike the large-cap UK stocks, which derive most of their income from abroad and are negatively affected by a higher GBP. On the other hand, UK small-cap stocks have become so expensive that we need to see how an appreciating pound will boost their earnings relative to large-cap stocks before adjusting our neutral stance. Bottom Line: The strong UK economy will allow the BoE to be one of the first major DM central banks to tighten policy. This will support a further appreciation of the pound against both the dollar and the euro over the coming 12 to 24 months. Nonetheless, the GBP has been overbought on a tactical basis and is vulnerable to a near-term pullback. Similarly, compared to large-cap equities, we are downgrading small-cap UK stocks from overweight to neutral on a tactical basis. Mathieu Savary, Chief European Investment Strategist Mathieu@bcaresearch.com Jeremie Peloso, Associate Editor JeremieP@bcaresearch.com Cyclical Recommendations Structural Recommendations Trades Currency Performance
A Surprising Dance
A Surprising Dance
Fixed Income Performance Government Bonds
A Surprising Dance
A Surprising Dance
Corporate Bonds
A Surprising Dance
A Surprising Dance
Equity Performance Major Stock Indices
A Surprising Dance
A Surprising Dance
Geographic Performance
A Surprising Dance
A Surprising Dance
Sector Performance
A Surprising Dance
A Surprising Dance
Closed Trades
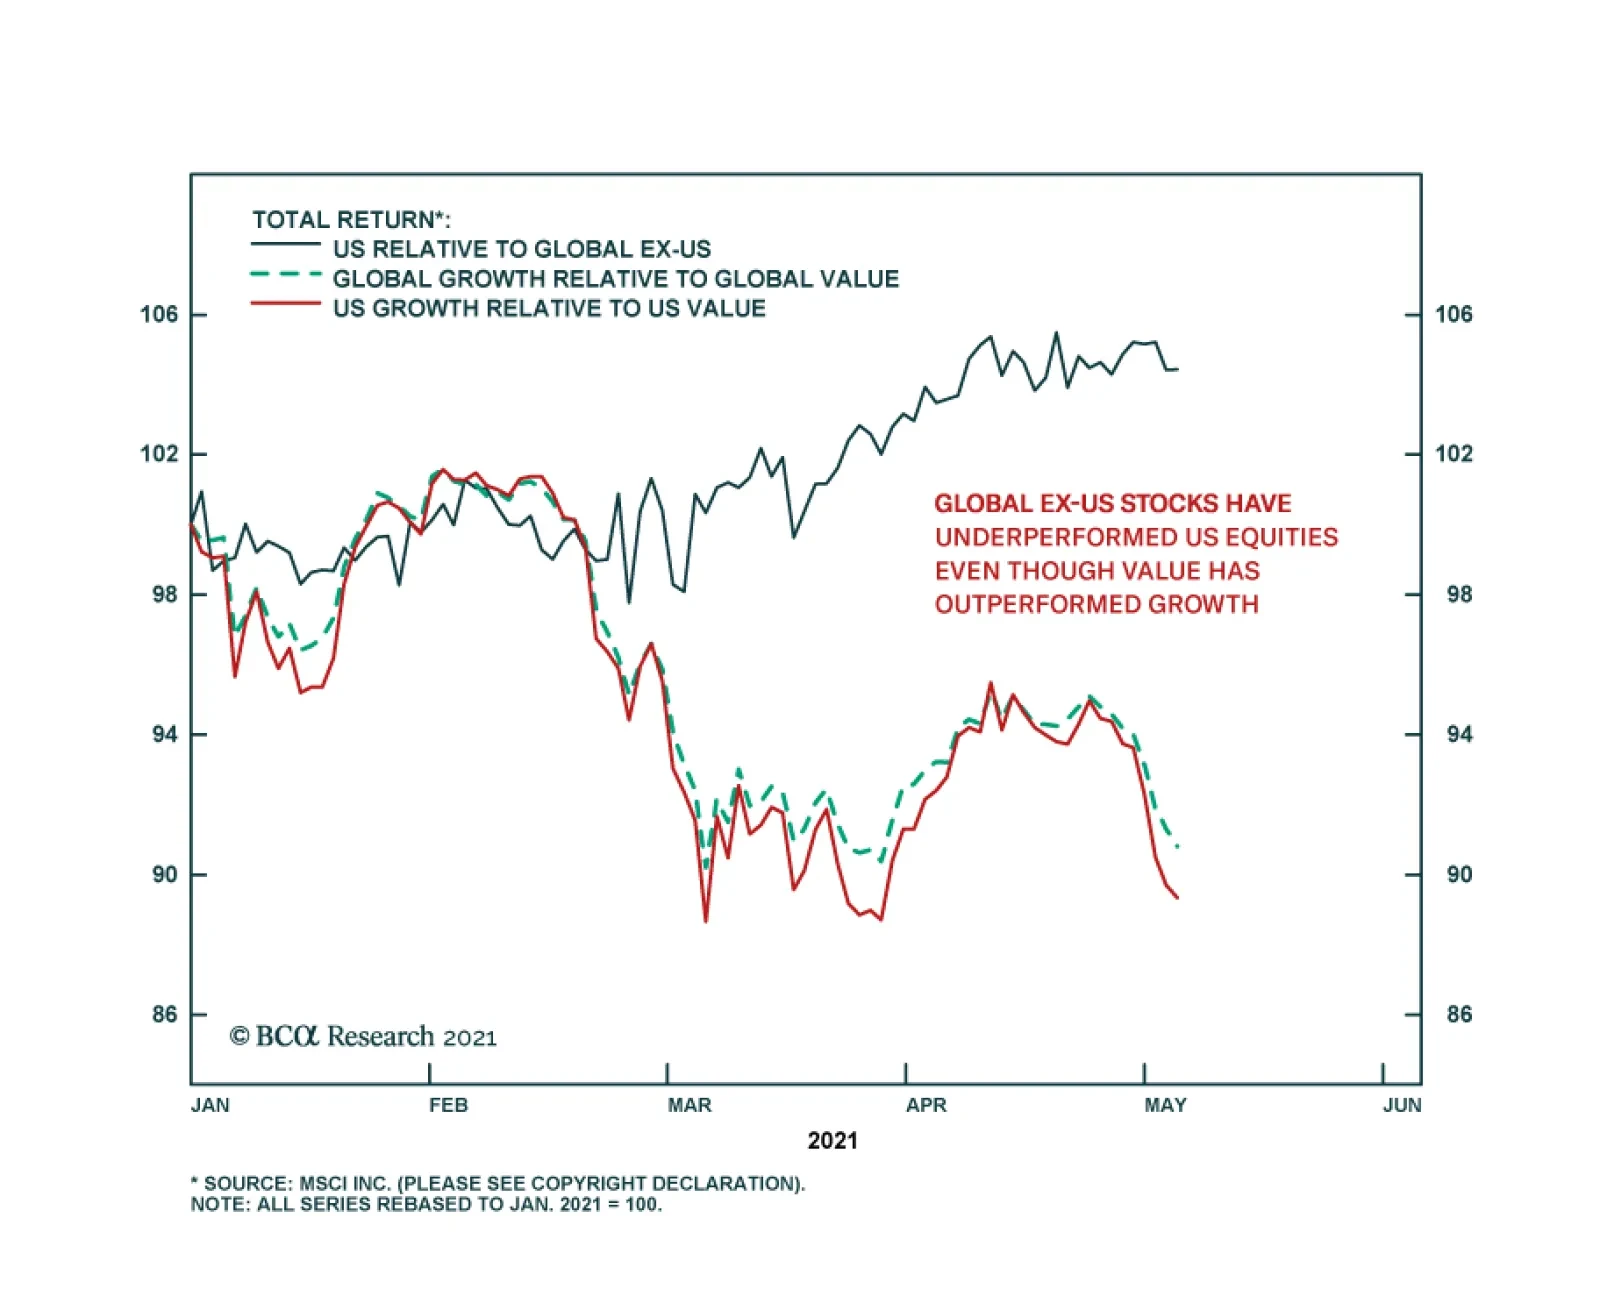
Conventional wisdom suggests that country allocation can be derived from style and sector exposure. For example, if you think that value is going to outperform growth then you should underweight the US versus the rest of the world given that the US has a…