Equities

Highlights Non-US stocks have greatly underperformed US equities over the last decade, but a leadership change might be underway. As such, equity flows could be an important factor in dictating currency trends over a cyclical horizon. The narrative in favor of non-US stocks includes a recovery in profits, cheap valuations, and a secular theme that will favor capital spending in traditionally “heavy” industries. Non-US growth should also overtake the US beyond 2021, when most of the global population is vaccinated. Cyclical currencies have historically tracked the relative performance of their respective bourses. This implies a lower dollar. Higher bond yields also present a formidable headwind for the outperformance of US stocks, relative to other markets. An outperformance of non-US bourses will be particularly favorable for the AUD, NOK, SEK, and GBP. The yen will likely play catchup towards the middle of the cycle. Feature Currencies respond to broad inflows, including into bonds, equities or foreign direct investment. For most of 2020, the dominant currency flows were from fixed income investors. As most short rates are now anchored near zero, the story is morphing towards the potential winners from a recovery, especially in the equity market sphere. Non-US stocks tend to outperform the US when the dollar is falling. That said, the causality-effect link is not so clear-cut, as we penned in our Special Report last year.1 Admittedly, a lower dollar boosts the common-currency returns for US-based investors, leading to more capital deployment in offshore markets. Meanwhile, commodities tend to do well when the dollar declines, benefiting emerging market and commodity-producing countries. Financing costs for non-US corporations borrowing in dollars are also eased. Historically, profit growth has been the ultimate driver of stock prices and profitability is more contingent on productivity gains than translation effects. This suggests the starting point for gauging relative equity flows, and the potential impact on currencies, is to evaluate which countries/economies could be primed for outperformance. Relative Growth As A Starting Point One of the key drivers of relative earnings growth between two countries is relative economic performance. Chart I-1 shows that earnings-per-share in the G10 relative to the US tended to improve when growth was shifting in favor of the rest of the world. This, in turn, has been a key driver of relative equity performance. Chart I-1Relative Profits And Relative Growth
Relative Profits And Relative Growth
Relative Profits And Relative Growth
What is remarkable is that this relationship has been pretty consistent across countries, including those that have huge exposures to the global economy such as Sweden, Norway, or even the United Kingdom. In general, relative economic performance has driven relative EPS growth (Chart I-2A & 2B). The reason is that these bourses still have a sizeable dependence on the domestic economy. Chart I-3 shows that for even the most export-driven economies, exposure to domestic sales is still at least 20%. Australia, a commodity country has almost 60% of sales from domestic sources. Our bias is that non-US growth will start to outperform towards the backend of this year. This will pressure the dollar lower (Chart I-4). This conviction rests on three critical pillars: Chart I-2AA Cross Country Look At Relative Profits Growth
A Cross Country Look At Relative Profits Growth
A Cross Country Look At Relative Profits Growth
Chart I-2BA Cross Country Look At Relative Profits Growth
A Cross Country Look At Relative Profits Growth
A Cross Country Look At Relative Profits Growth
Chart I-3Domestic Sales Matter A Lot For Global Equity Bourses
Trading Currencies Using Equity Signals
Trading Currencies Using Equity Signals
Chart I-4The Dollar Trends With ##br##Relative Growth
The Dollar Trends With Relative Growth
The Dollar Trends With Relative Growth
The rest of the world will catch up in vaccination campaigns relative to the US. This is almost a fait accompli. Canada is well behind in terms of vaccination progress compared to the US or the UK (Chart I-5). But in Quebec, where BCA is headquartered, Premier François Legault has suggested that everyone who wants a vaccine will be able to get their first dose by June 24. Relative employment growth in Canada is already picking up, and the central bank has already begun tapering asset purchases ahead of the Fed. The broader message is that the service sector has been held hostage by relatively closed economies outside the US. This will change as economies open up. Producer prices (PPI) are picking up globally and the US is leading the pack. This will also rotate in favor of other economies. Producer prices first took off in the US as the sectors that benefited from the pandemic were those related to technology and healthcare. Norway also gained from the rebound in oil prices. Other countries should begin to catch up, as demand for goods and services broadens beyond the pandemic-related scope (Chart I-6). From a longer-term perspective, PPI usually peaks and troughs in the US ahead of other economies. Again, as we exit a recession, consumption tends to broaden from defensive goods towards more discretionary spending. Given that other economies are bigger producers of these discretionary items, this should start to shift relative pricing power towards these countries (Chart I-7). Non-US growth has been held hostage to cascading crises since the US housing market bust. In 2010, we had the euro area debt crisis. In 2011, the Fukushima disaster knocked down Japanese growth. In 2015, tight monetary policy in China led to a global manufacturing recession. In short, rest-of-world growth has not been able to catch breath for a decade. Chart I-5Many Countries Will Replicate The US and UK Vaccination Success
Many Countries Will Replicate The US and UK Vaccination Success
Many Countries Will Replicate The US and UK Vaccination Success
Chart I-6Global PPIs Are ##br##Picking Up
Global PPIs Are Picking Up
Global PPIs Are Picking Up
Chart I-7US PPI Usually Leads Other Countries
US PPI Usually Leads Other Countries
US PPI Usually Leads Other Countries
The silver lining is that the COVID-19 crisis has ushered in coordinated global monetary and fiscal stimulus. For the first time in a long while, non-US growth can start to outperform, according to IMF estimates (Chart I-8). Chart I-8The IMF Expects Non-US Growth To Outperform
The IMF Expects Non-US Growth To Outperform
The IMF Expects Non-US Growth To Outperform
Flows tend to gravitate to capital markets with the highest expected returns, and this is certainly the case when US versus non-US stocks are concerned. If we accept the premise that relative growth matters for equity allocations, then it also makes sense that relative equity performance will coincide with currency performance, due to portfolio flows. Across the G10 economies, getting the equity call right has usually been synonymous with having the appropriate currency strategy (Chart I-9). This is especially the case since equity flows have been supportive of the dollar (Chart I-10). Chart I-9ACurrencies And Equities Move Together
Currencies And Equities Move Together
Currencies And Equities Move Together
Chart I-9BCurrencies And Equities Move Together
Currencies And Equities Move Together
Currencies And Equities Move Together
Chart I-10Equity Flows Have Been Supportive Of The Dollar
Equity Flows Have Been Supportive Of The Dollar
Equity Flows Have Been Supportive Of The Dollar
A More Quantitative Approach While relative growth is important, it is not the sole factor in determining which countries or sectors will outperform. Most investors have at least two other powerful tools that have stood the test of time in making equity allocations. These include the valuation starting point, and the historical return on capital. Valuation is the easiest place to start. Over time, non-US bourses have tended to outperform the US when the relative valuation starting point was attractive. This has been especially true around recessions, when leadership changes tend to occur. Chart I-11A, 11B, 11C, and 11D show that countries such as Japan, Mexico, and Germany should sport more attractive returns over the next decade compared to the US. The list is not comprehensive, but our previous work suggests this valuation tool works across many countries and various geographies. Chart I-11AValuation Matters For Long-Term Returns
Valuation Matters For Long-Term Returns
Valuation Matters For Long-Term Returns
Chart I-11BValuation Matters For Long-Term Returns
Valuation Matters For Long-Term Returns
Valuation Matters For Long-Term Returns
Chart I-11CValuation Matters For Long-Term Returns
Valuation Matters For Long-Term Returns
Valuation Matters For Long-Term Returns
Chart I-11DValuation Matters For Long-Term Returns
Valuation Matters For Long-Term Returns
Valuation Matters For Long-Term Returns
Trading Currencies Using Equity Signals
Trading Currencies Using Equity Signals
Not surprisingly, the currencies that are the most undervalued in our models also have cheap equity markets. These include the Scandinavian currencies, commodity plays, the Japanese yen, and the pound. A rerating of these markets will be synonymous with a rerating in their currencies (Chart I-12). The rise in global bond yields will also prove to be a formidable headwind for US stocks. Technology constitutes 28% of the US equity market, the largest allocation within the G10. Together with defensive sectors such as health care and consumer staples, this ratio rises to 60%. As a result, the relative performance of the US equity market has been inversely correlated to bond yields (Chart I-13). Should bond yields continue to gravitate higher over the next few years, this will lead to a powerful rotation towards more cyclical bourses. The rise in yields will be particularly favorable for deep value sectors like banks (due to rising net interest margins) and commodities (due to inflation protection). Chart I-12The Dollar Remains ##br##Expensive
Trading Currencies Using Equity Signals
Trading Currencies Using Equity Signals
Chart I-13US Outperformance Has Dovetailed With Lower Bond Yields
US Outperformance Has Dovetailed With Lower Bond Yields
US Outperformance Has Dovetailed With Lower Bond Yields
Going forward, expected return on capital will be more difficult to gauge, but countries that have a history of providing superior shareholder returns are a good place to start. For example, we know that the winners of the last decade have had the largest returns on equity, as was the case for the winners during the prior decade. Given the mammoth task of performing this exercise on a cross-country basis, and across factors, we enlisted the help of our colleagues who run BCA’s Equity Analyzer platform. The EA platform provides a BCA score of 0 to 100 for all developed market stocks, according to their ranking on 30 carefully selected and curated factors. Crunching the numbers revealed a few interesting results: A long strategy based on selecting the top decile stocks according to their EA score outperformed both domestic and global indices (Chart I-14). The quality factor has been one of the better determinants of future stock market returns. The EA quality score is based on return on equity, asset growth, accruals, and margins. On this basis, the bourses with a higher concentration of quality stocks in their indices are found outside the US (Chart I-15). Using an overall blended score, which includes not only the quality factor, but also others such as value, size, and momentum, suggests investors will be rewarded by tilting away from the US. For example, 20%-30% of stocks in Scandinavian bourses make it into the top decile EA portfolio (Chart I-16). Even if one focuses solely on growth sectors such as technology and health care, non-US companies are still more attractive (Chart I-17). Chart I-14The BCA EA Platform Allows Investors To Pick Winners
Trading Currencies Using Equity Signals
Trading Currencies Using Equity Signals
Chart I-15Quality Stocks Are Heavily Weighted Outside The US
Trading Currencies Using Equity Signals
Trading Currencies Using Equity Signals
Chart I-16A Composite Score Ranks US Stocks Poorly
Trading Currencies Using Equity Signals
Trading Currencies Using Equity Signals
Chart I-17Lots Of Attractive Growth Stocks Outside The US
Trading Currencies Using Equity Signals
Trading Currencies Using Equity Signals
In a nutshell, non-US markets are attractive from a valuation standpoint and across a swathe of other metrics that have been useful in benchmarking future returns. An outperformance of non-US stocks will favor cyclical currencies, as portfolio flows gravitate to these markets. We are already selectively long a basket of Scandinavian currencies; we will be gradually accumulating other currencies such as the GBP, the CAD, and the JPY on weakness. Specifically, the yen is becoming interesting not only as portfolio insurance, but also as a play on the cyclical Japanese market. We will be covering these currencies in depth in upcoming reports. Housekeeping Three important central banks met this week. The general tone was dovish. The Bank of England kept policy roughly unchanged, but there were three important takeaways. First, the BoE suggested any pickup in UK inflation will be transitory. Second, the BoE will slow its bond purchases, as they approach the central bank’s target. And finally, growth estimates were revised upward. Our take is that the meeting was a non-event for cable in the near term and bullish longer term. The message from the Reserve Bank of Australia was bit more dovish. They kept open the possibility of additional measures on the July 6 meeting. Our bias is that the RBA is trying to fend off deflationary pressures from a strong currency. This only delays the bullish backdrop for the AUD. Next Tuesday’s budget will provide some information about additional support to the Aussie economy. The Norges bank remains on the path to hike interest rates later this year. This supports our bullish NOK thesis. We have been reluctant to establish fresh long positions as we enter a seasonally strong month for the dollar. However, our buy list is growing as we highlighted above. For now our open positions are highlighted on page 14. Chester Ntonifor Foreign Exchange Strategist chestern@bcaresearch.com Footnotes 1 Please see Foreign Exchange Strategy Special Report, "Currencies And The Value-Versus-Growth Debate," dated July 10, 2020. Currencies U.S. Dollar Chart II-1USD Technicals 1
USD Technicals 1
USD Technicals 1
Chart II-2USD Technicals 2
USD Technicals 2
USD Technicals 2
The recent data out of the US were mildly positive. The ISM Manufacturing PMI came in at 60.7 in April, well below an estimate of 65. The ISM Manufacturing New Orders Index came in at 64.3 in April, slightly below an expectation of 66.6. The trade deficit for March was -74.4B USD, in line with expectations. Personal Spending for March was 4.2% month-on-month, as expected. The dollar DXY index rose by 0.8% this week. While the PMI data for April came in on the mild side, inflationary pressures continue to build up as reflected in the robust New Orders, Backlog of Orders as well as the Prices Paid indices. That said, the Fed’s current stance is that price surges will likely be transitory. This is near-term negative for the greenback since it implies policy will not be tightened anytime soon. Report Links: Arbitrating Between Dollar Bulls And Bears - March 19, 2021 The Dollar Bull Case Will Soon Fade - March 5, 2021 Are Rising Bond Yields Bullish For The Dollar? - February 19, 2021 The Euro Chart II-3EUR Technicals 1
EUR Technicals 1
EUR Technicals 1
Chart II-4EUR Technicals 2
EUR Technicals 2
EUR Technicals 2
The recent Euro data have been mildly positive. Unemployment rate for March was 8.1%, slightly better than the predicted 8.3%. GDP fell 1.8% year-on-year, compared to an expected 2% decrease. CPI came in at 1.6% for April year-on-year, in line with expectation. German Retail Sales for March came in at 7.7% month-on-month comfortably beating a 3% expectation. Overall euro area retail sales surged 12% year-on-year in March, comfortably outpacing consensus of a 9.4% rise. The euro was down 0.9% against USD this week. However, as the weekly vaccination increase in both the US and the UK are slowing down, it continues to rise in the euro area. Infections are stabilizing in Germany and the Netherlands, and are on a downtrend in France and Italy. This puts a floor under the euro. Report Links: Relative Growth, The Euro, And The Loonie - April 16, 2021 Portfolio And Model Review - February 5, 2021 On Japanese Inflation And The Yen - January 29, 2021 The Japanese Yen Chart II-5JPY Technicals 1
JPY Technicals 1
JPY Technicals 1
Chart II-6JPY Technicals 2
JPY Technicals 2
JPY Technicals 2
The recent data out of Japan have been strong. The unemployment rate for March came in at 2.6%. Industrial Production for March came in at 2.2% month-on-month, versus the estimate of -2%. Tokyo Core CPI came in at -0.2%, below market consensus. Vehicles sales surged by 22.2% year-on-year in April. The Japanese yen was flat against USD this week. A lagging vaccine campaign, rising COVID-19 case count, and the state of emergency continue to drag down sentiment towards Japan. However, the yen’s real effective exchange rate is trading at one standard deviation below fair value and our intermediate-term indicator is hinting at a rebound. Report Links: The Dollar Bull Case Will Soon Fade - March 5, 2021 On Japanese Inflation And The Yen - January 29, 2021 The Dollar Conundrum And Protection - November 6, 2020 British Pound Chart II-7GBP Technicals 1
GBP Technicals 1
GBP Technicals 1
Chart II-8GBP Technicals 2
GBP Technicals 2
GBP Technicals 2
The recent data out of UK have been positive. The Nationwide HPI for April was 7.1% higher than a year ago, beating an expectation of 5%. The BoE kept interest rates at 0.1% and its asset purchase target at £895bn. The pound was flat against the USD this week. The Bank of England kept policy on hold this week, but there were three important takeaways. First, the BoE sees any near-term pickup in inflation as temporary. This should keep a near-term lid on rate hike expectations and the pound. Second, the BoE will slow its bond purchases, as they approach the central bank’s target. And finally, growth estimates were revised upward, especially for 2022. This is bullish cable longer term. On the political front, a potential surprise of another Scottish independence may put some downward pressure on the currency. Report Links: Portfolio And Model Review - February 5, 2021 The Dollar Conundrum And Protection - November 6, 2020 Revisiting Our High-Conviction Trades - September 11, 2020 Australian Dollar Chart II-9AUD Technicals 1
AUD Technicals 1
AUD Technicals 1
Chart II-10AUD Technicals 2
AUD Technicals 2
AUD Technicals 2
The recent data out of Australia have been strong. The AIG Manufacturing Index for April came in at 61.7, higher than the prior 59.9 reading. The AIG Construction Index for April came in at 59.1, below the 61.8 print in March. The trade balance for March came in at AUD 5.6bn, below an expectation of AUD 8bn. The RBA cash rate remained at 0.1%. The Australian dollar was flat this week against the USD. The RBA provided a dovish tone at its meeting this week, extending QE until February, and kept open the possibility of additional measures on the July 6 meeting. In the near term, upbeat economic data continue to provide support for the AUD. However, the tourism industry (6% of employment) is needed to get Australia back to full employment. Our bias is that the RBA will continue to fight against an appreciating currency, until the economy reaches escape velocity. Report Links: The Dollar Bull Case Will Soon Fade - March 5, 2021 Portfolio And Model Review - February 5, 2021 Australia: Regime Change For Bond Yields & The Currency? - January 20, 2021 New Zealand Dollar Chart II-11NZD Technicals 1
NZD Technicals 1
NZD Technicals 1
Chart II-12NZD Technicals 2
NZD Technicals 2
NZD Technicals 2
The recent data out of New Zealand have been strong. Employment grew by 0.6% quarter-on-quarter in Q1. The Labor Cost Index for Q1 came in at 0.4% over prior quarter, and 1.6% year-on-year. The unemployment rate for Q1 declined to 4.7%, from 4.9%. Building consents increased 17.9% month-on-month in March. The New Zealand dollar was down 0.5% against USD this week. As we indicated in our report last week, the NZD is overpriced by several measures and the elevated equity market is of particular concern. The weakening GlobalDairyTrade Price Index could potentially be a harbinger of peaking agricultural prices in the coming months. This will lead the NZD to underperform other commodity currencies. Report Links: Portfolio And Model Review - February 5, 2021 Currencies And The Value-Versus-Growth Debate - July 10, 2020 Updating Our Balance Of Payments Monitor - November 29, 2019 Canadian Dollar Chart II-13CAD Technicals 1
CAD Technicals 1
CAD Technicals 1
Chart II-14CAD Technicals 2
CAD Technicals 2
CAD Technicals 2
The recent data out of Canada have been soft. The trade balance for March came in at -1.14bn CAD versus CAD 1.42bn the previous month. Building permits rose 5.7% month-on-month in March. The CAD was flat against USD this week. Despite concerns over elevated commodity prices and a vaccination campaign that is lagging other advanced economies, recent strong employment growth and the tapering of asset purchases by the BoC should continue to boost the currency, the top performing among G10 so far this year. In the near term, Canadian exports will benefit from US fiscal stimulus, which will also provide support for the loonie. Report Links: Relative Growth, The Euro, And The Loonie - April 16, 2021 Will The Canadian Recovery Lead Or Lag The Global Cycle? - February 12, 2021 Currencies And The Value-Versus-Growth Debate - July 10, 2020 Swiss Franc Chart II-15CHF Technicals 1
CHF Technicals 1
CHF Technicals 1
Chart II-16CHF Technicals 2
CHF Technicals 2
CHF Technicals 2
The recent Swiss data have been strong. The KOF Leading Indicator for April came in at 134, beating the 119.5 estimate. CPI for April came in at 0.3%. SECO Consumer Climate for Q2 came in at -18, higher than the -30 back in Q1. The Swiss franc was down 0.5% against the USD this week. The Swiss economy continues to surprise to the upside. With our intermediate-term indicator on a downward path, we remain optimistic on our long EUR/CHF position for now, despite potential upside risks to the franc given the Indian COVID-19 outbreak. Report Links: Portfolio And Model Review - February 5, 2021 The Dollar Conundrum And Protection - November 6, 2020 On The DXY Breakout, Euro, And Swiss Franc - February 21, 2020 Norwegian Krone Chart II-17NOK Technicals 1
NOK Technicals 1
NOK Technicals 1
Chart II-18NOK Technicals 2
NOK Technicals 2
NOK Technicals 2
The recent data out of Norway have been strong. The unemployment rate for April came in at 4%, from 4.2% the prior month. The house price index for April came in at 12.2% year-on-year, similar to the 12.5% reading of March. Interest rate were held at 0% by the Norges Bank. The NOK was down 1.8% against the USD this week. The krone is the winning currency since the pandemic hit, suggesting some consolidation was much due. With Norwegian inflation rising sharply above the central bank’s 2% target earlier this year, the Norges Bank reiterated during its meeting on Thursday that a rate hike later this year is well in sight. Against the backdrop of the impending European recovery this summer and Norway’s own commendable vaccination progress, we continue to be long the NOK against the USD and EUR. Report Links: Portfolio And Model Review - February 5, 2021 Revisiting Our High-Conviction Trades - September 11, 2020 A New Paradigm For Petrocurrencies - April 10, 2020 Swedish Krona Chart II-19SEK Technicals 1
SEK Technicals 1
SEK Technicals 1
Chart II-20SEK Technicals 2
SEK Technicals 2
SEK Technicals 2
The recent Swedish data have been strong. Industrial Production for March came in at 1.1% month-on-month. Year-on-year, IP is rising by 5.7%. Industrial New Orders for March came in at 10% year-on-year. GDP in Q1 was 1.1% higher than the prior quarter, beating the estimate of 0.5%. The Swedish krona was down 1.4% against the USD this week. BCA Research’s European Investment Strategy service indicated that there is significantly more upside to Swedish stocks against both Eurozone and US equities over the remainder of the cycle. Sweden is levered to the global industrial cycle with exports representing 45% of GDP. The recovery in both Europe and across the globe should continue to benefit the krona. The tapering of asset purchases by the Riksbank later this year will also provide support to the currency in the meantime. We continue to be long SEK/USD and SEK/EUR. Report Links: Revisiting Our High-Conviction Trades - September 11, 2020 Updating Our Balance Of Payments Monitor - November 29, 2019 Where To Next For The US Dollar? - June 7, 2019 Trades & Forecasts Forecast Summary Core Portfolio Tactical Trades Limit Orders Closed Trades
Highlights The Scottish parliamentary election does not present a near-term risk of a second referendum on Scottish independence. Independence is possible down the road but very unlikely due to a host of economic and geopolitical challenges still relevant in the twenty-first century. Book gains on long CHF-GBP. Go long FTSE 100 versus developed markets excluding the United States. Feature British equities have underperformed developed markets over the past decade – even if we exclude the market-leading United States (Chart 1). The British equity market is heavily concentrated in cyclical sectors like financials and materials and has a low concentration in information technology and communications services. As such the bourse has sprung to life since the advent of the COVID-19 vaccine and the prospect of a government-stimulated global growth recovery. In keeping with our strategic preference for value over growth we also look constructively at British equities. A potential source of geopolitical and political risk is Britain’s ongoing constitutional crisis, which flared up with the failed Scottish independence referendum in 2014 and the successful referendum to leave the EU in 2016. Tensions within the UK and between the UK and EU are part of the same problem – a loss of popular confidence and trust in the current nation-state and governing institutions in the aftermath of hyper-globalization.1 This constitutional crisis added insult to injury for UK stocks by jacking up policy uncertainty and undermining the attractiveness of domestic-oriented UK companies that suffered from trade disruptions with the European Union. Chart 1UK Referendums Added Insult To Injury
UK Referendums Added Insult To Injury
UK Referendums Added Insult To Injury
Chart 2Post-Brexit Trading Range For GBP-EUR
Post-Brexit Trading Range For GBP-EUR
Post-Brexit Trading Range For GBP-EUR
Now the COVID-19 pandemic and its aftermath have changed the global scene entirely and Brexit is no longer Britain’s chief concern. But there is still a lingering question over Scotland’s status. The Scottish question has recently weighed on the British pound and reinforced the new trading range for the GBP-EUR exchange rate in the aftermath of a “hard” exit from the European Union (Chart 2). Scotland voted for a new parliament on May 6 and the preliminary results are coming in as we go to press. The pro-independence Scottish National Party is still the most popular party and even if it falls short of a majority, as online betting markets expect, it has pro-independence allies with which it could form a coalition (Chart 3). Its leader, Scottish First Minister Nicola Sturgeon, has promised to pursue a second popular referendum on seceding from the United Kingdom by 2023. Chart 3Betting Markets Doubt Single-Party Majority For SNP
United Kingdom Stays United
United Kingdom Stays United
British Prime Minister Boris Johnson, backed by a strong Conservative Party parliamentary majority, has vowed not to allow a second referendum, arguing that the 2014 plebiscite was supposed to lay the question to rest for a while. Scottish opinion in favor of secession stands at 43.6% today, right near the 44.7% that nationalists achieved in 2014 (Chart 4). Chart 4Support For Independence Ticks Down, Still Shy Of Majority
United Kingdom Stays United
United Kingdom Stays United
Our takeaway is to fade the Scottish risk. Book gains on our long CHF-GBP tactical trade. Go long British equities relative to DM-ex-US on the expectation of global economic normalization, which is beneficially for the outwardly oriented British multinationals that dominate the British bourse. Does Scotland Have Grand Strategy? The history of Scotland is marked by internal differences that prevent it from achieving unity and independence. Even in the twenty-first century, when many factors have coalesced to make Scottish independence more likely than at any time since the eighteenth century, the 2014 referendum produced a 10% gap in favor of remaining in the United Kingdom. This majority is all the more compelling when viewed from the perspective of geography because cross-regional support for the union is clear (Map 1). Map 1Scottish Independence Referendum Result, 2014
United Kingdom Stays United
United Kingdom Stays United
Why is Scotland always divided? Because it is trapped by the sea and adjacent to a greater power, England. England is usually strong enough to keep Scotland from consolidating power and asserting control over its maritime and land borders. Specifically, Scotland contains a small population (at 5.5 million today) and small economic base (GBP 155 billion in economic output at the end of 2022) dispersed over an inconvenient geography. The low-lying plains around the Firth of Forth that form the historic core of Scotland share a porous border with England. The highlands provide a retreat for Scottish forces during times of conflict, which makes it extremely difficult for southern forces, whether Roman or Anglo-Saxon, to conquer Scotland. But the highlands are equally hard for any standalone Scottish state to rule. Meanwhile the western isles are even more remote from the seat of Scottish power and vulnerable to foreign maritime powers. Since England could never conquer Scotland, its solution was to coopt the Scottish elite, who reciprocated, culminating in a merger of the two monarchies and then the two states in the seventeenth and eighteenth centuries. The British empire provided Scotland with peace, prosperity, and access to the rest of the world. History and geopolitics do not imply that Scottish independence is impossible, i.e. that union with the rest of Britain is inevitable and permanent. The Anglo-Scots union is only 314 or 418 years old, whereas Scotland existed as a recognizable kingdom for roughly six centuries prior to the joining of the crowns in 1603. It is entirely possible for Scotland to secede and break up the union known as Great Britain. The principle of rule by consent and modern democratic ideology make it difficult for London and Westminster to force Scotland into subjection like in the old days. In particular, American hegemony over Europe since WWII and the rise of the European Union have created a pathway for Scottish independence. England is no longer the indispensable gateway to peace and prosperity. Scotland can exist independently under the EU’s economic umbrella and the American security umbrella. Europe has always played a major role in Scotland’s political fate and has always held the key to independence. Independence usually failed because European powers failed to devote large and steady resources to supporting Scotland militarily and economically. France was Scotland’s greatest patron and would lend its support for Scottish rebellion. But France also consistently failed Scotland (and Ireland) at critical junctures when independence might have been obtained. This is because France’s interests lay in distracting England rather than adopting Scotland. Chart 5Scottish Energy Production In Decline
United Kingdom Stays United
United Kingdom Stays United
Today’s unified European continent could be a much greater patron than France ever was alone. The EU could assure Scotland of investment and access to markets even in the face of British resistance. However, the EU is still not politically unified: some members fear separatism in their own borders and therefore tend to oppose Scottish accession. It is possible that the EU could overcome this difficulty but only after a series of major events (on which more below). It took an American empire to clear the way for Irish independence. But Ireland has the moat of the Irish Sea – and the United Kingdom still retained Northern Ireland. Today the United States can be expected to keep its distance from quarrels within the UK or between the UK and EU. However, it does not have an interest in Scottish secession or any other disintegration of the UK, whether from a global security point of view (the West’s conflict with Russia) or even from the point of view of US grand strategy relative to Europe (prevention of a European empire that could challenge the US). An independent Scotland would struggle economically. Its declining base of fossil fuel reserves illustrates the problem of generating sufficient revenue to maintain the Scandinavian-style social welfare state that Scotland’s nationalists imagine (Chart 5). Scottish nationalists are keen to embrace renewable energy – and the Scottish Greens are pro-independence – yet Scotland is not a manufacturing powerhouse that will produce its own solar panels and windmills. In the face of economic difficulties, Scotland would become politically divided like it was for most of its history prior to union with England. England would revert to an obstructive or sabotaging role. It is telling that the Scottish voter turnout in the 2014 independence referendum was very strong – much stronger than in other recent elections and plebiscites, including the Brexit referendum in Scotland (Table 1). The implication is that it is much harder for Scotland to strike out on its own than it appears. Opinion polling cited above suggests that neither Brexit nor the COVID-19 pandemic has moved the needle decisively in the direction of independence. If anything it is the opposite. The Scottish National Party has lost momentum since 2014 and is losing momentum in advance of today’s local election, which has been pitched as the opportunity to make a second go at independence (Chart 6). Table 1Scotland: High Turnout In 2014 Independence Referendum Implies Firm Conclusion To Stay In UK
United Kingdom Stays United
United Kingdom Stays United
Chart 6Scottish National Party Losing Momentum Just Ahead Of Holyrood Election
Scottish National Party Losing Momentum Just Ahead Of Holyrood Election
Scottish National Party Losing Momentum Just Ahead Of Holyrood Election
Bottom Line: History suggests that the geopolitical and macroeconomic barriers to a unified and independent Scottish state are higher and stronger than they may appear at any given time, including the inevitable periods of tensions with England like today. The UK’s Saving Graces A fair question is whether the UK’s decision to leave the EU since 2016 has changed Scotland’s calculus. Brexit may also have affected the international context, reducing the EU’s willingness to intervene on the UK’s behalf and discourage Scottish ambitions. However, a handful of factors supports the continuation of the union despite Scotland’s grievances. The UK proved a boon amid COVID-19: While 62% of Scots voted against Brexit, the COVID-19 pandemic and recession have supplanted Brexit as the nation’s chief cause of concern. The UK and Scotland saw a higher rate of deaths during the biggest waves of the pandemic but now the pandemic is effectively over in the UK and Scotland, in stark contrast with the European Union (Chart 7). The UK has provided a net benefit to Scotland by inventing the vaccine and distributing it effectively (Chart 8). Scottish voters would have been worse off had they left the UK in 2014. Of course, Scottish nationalism is apparent in the fact that voters give the credit to Edinburgh while blaming London over its handling of the pandemic (Chart 9). But the underlying material reality – that being part of the UK provided a net benefit – will discourage independence sentiment. The Scottish Conservative Party and Labour Party are both in favor of sustaining the union and have benefited in opinion polling since the pandemic peaked. Chart 7COVID Deaths Collapse In ##br##United Kingdom
United Kingdom Stays United
United Kingdom Stays United
Chart 8Scotland Benefited From UK Vaccine And Rollout
United Kingdom Stays United
United Kingdom Stays United
Chart 9Scots Praise Edinburgh, Blame London On COVID Handling
United Kingdom Stays United
United Kingdom Stays United
Brexit is a cautionary economic tale: If Brexit is relevant to Scottish voters, it is not the source of grievance that it could have been. Prime Minister Boris Johnson achieved an exit and trade deal at the end of 2019-20 that largely preserves economic ties with the EU. True, the deal has problems that undermine the UK economy and enhance Scottish grievances. But these also serve as a warning to Scots who would attempt to exit the UK, highlighting the economic pitfalls of raising borders and barriers against one’s chief market. The UK’s trade is far more critical to Scotland’s economy than that of the EU (Chart 10). Chart 10Major Constraint On Scottish Independence
United Kingdom Stays United
United Kingdom Stays United
Unlike in the case of the UK and EU, Scotland shares the same currency and central bank with the UK. Scotland’s large banking sector stands to suffer drastically if the Bank of England ceases to be a lender of last resort. This would become a major problem at least until Scotland could be assured of admission into the EU and Euro Area. Otherwise redenomination into a national currency would deal an even greater financial and economic blow. Scots would face a far more painful economic divorce from the UK than the UK faced with the EU. The UK’s fiscal blowout helped Scotland: Since the bank run at Northern Rock in 2007, the UK and Scotland have suffered a series of crises. This instability should discourage risk appetite today when contrasted with the possibility of stimulus-fueled economic recovery. In particular, the UK government is no longer pursuing fiscal austerity – an economic policy that fanned the flames of Scottish secession back in 2012. Indeed, the UK tops the ranks of global fiscal stimulus, according to the change in government net lending and borrowing as reported by the IMF. The UK’s outlier status ensures that Scotland receives more fiscal support than it otherwise would have (Chart 11). A brief comparison with comparable countries – Ireland, Belgium, France, Norway, Portugal – reinforces the point. Chart 11Scotland Benefited From UK Fiscal Blowout
United Kingdom Stays United
United Kingdom Stays United
The UK’s aggressive policy of monetary and fiscal reflation is not a coincidence. It stems from the past two decades’ constitutional and political struggles – it is an outgrowth of domestic instability and populism. It includes an industrial policy, a green energy policy, and other rebuilding measures to combat the erosion of the state in the wake of hyper-globalization. Essentially the UK, even under a Tory government, is now about debt monetization and nation-building. While Scotland would have trouble bargaining for its share of EU resources, it benefits from the UK’s shift to government largesse and can use the threat of independence to receive greater funds from the United Kingdom. Geopolitics discourages a fledgling Scottish nation. Scotland hosts naval and air bases of considerable value to the UK, US, and broader NATO alliance. Former US President Trump’s punitive measures against the European allies and open doubts about the US’s commitment to NATO’s collective security illustrated the dangers of western divisions in the face of autocratic regimes like Russia and China. The US and EU are now recommitting to their economic and security bonds under the Biden administration. Scottish independence would undermine this recommitment and as such the small country would pit itself against the US, EU, and NATO. While the US and NATO would ultimately admit Scotland into collective security, for fear of cultivating a neutral Scotland that could eventually be exploited by Russia, they would likely discourage independence ahead of time to prevent a historic division within the UK and NATO. Chart 12No Urgency For A Second Referendum
United Kingdom Stays United
United Kingdom Stays United
As for the EU, the Spanish government has indicated that it would be willing to make an exception for Scottish independence if it were negotiated amicably with the United Kingdom.2 Such statements are doubtful, however, as any successful secession would lend ideological credibility to Spanish secessionism – not only in Catalonia but also in the Basque country and elsewhere. And Spain is not the only country that harbors deep hesitations over Scottish accession to the European Union. Belgium, Slovakia, and Cyprus could also oppose it. It only takes a single veto to halt the whole accession process. Ultimately the EU could accept Scotland, just as would NATO, to avoid the dangers of having a neutral state in a strategic location. But the point is that Scottish voters cannot be certain. For example, Scotland cannot secure EU accession prior to leaving the UK and yet to leave the UK and fail to achieve EU accession would render it a fledgling. This explains why Scottish voters are not eager to hold a new independence referendum (Chart 12). Bottom Line: The UK offers medical, economic, fiscal, and geopolitical advantages to Scotland that independence would revoke. The context of Great Power struggle with Russia and China means that an independent Scotland would probably ultimately be admitted into NATO and the EU – but Scottish voters cannot be certain, a factor that discourages independence at least in the short and medium run. Scottish Hurdles Table 2 highlights the historic results of Scottish elections according to political party, popular vote share, and share of seats in parliament. Early, tentative signs suggest that the Scottish National Party maxed out in 2011. The party has suffered from a leadership schism, offshoot parties, and a distraction of its key message since 2014. The implication is not only that Scottish independence is on ice for now but also that the tumultuous constitutional disagreements are subsiding and voters want to focus on economic recovery. Table 2Scottish National Party Hit High-Water Mark In 2011?
United Kingdom Stays United
United Kingdom Stays United
If the Scottish National Party manages to form a majority coalition capable of pushing forward a second referendum, it will face several hurdles. It will need a UK Supreme Court ruling on the legality of a referendum. If a referendum is declared legal (as it very likely will be), Scotland will need to forge an agreement with Prime Minister Boris Johnson to hold a referendum. If a referendum eventually is held and passes, an exit will need to be negotiated. In a post-Brexit world, investors cannot assume that any referendum will fail or that a referendum is a domestic political ploy that the ruling party has no serious intention of following through. Nevertheless it is true that the Scottish National Party could use the threat of a referendum to agree to negotiate a greater devolution of power from Westminster. The party could hold up England’s concessions as a victory while retaining the independence threat as leverage for a later date. Devolution in the past has strengthened the independence cause, as in the creation of the Scottish parliament in 1999. After all, a referendum loss would be devastating for the nationalists, whereas the threat of a referendum could yield victories without depriving the nationalists of their reason for being. It is notable that First Minister Nicola Sturgeon promised not to hold a “wildcat” referendum, in which Scotland holds a referendum regardless of what Westminster or the UK Supreme Court say. The implication is that Scottish nationalism is looking for a stable way to exit. But if stability is the hope then there is dubious support for independence in the first place. A wildcat referendum is theoretically still an option but a formal process with popular support is much more likely to result in a successful referendum than an informal process with dubious popular support. Chart 13Scotland’s Chronic Deficits
Scotland's Chronic Deficits
Scotland's Chronic Deficits
If Scottish independence succeeded in any wildcat referendum, an extreme controversy would follow as Edinburgh tried to translate this result to the formal political and constitutional sphere. If the referendum were not recognized by the UK then Scotland would be forced to secede unilaterally at greater economic cost. Otherwise a third referendum (second formal referendum) would need to be held to confirm the results. Any third referendum would be irrevocable. As with Brexit, the secessionists would have to carry one or more subsequent elections to execute the political will in the event of secession. The point for investors is that volatility would be prolonged as was the case with Brexit. A major complication in Scottish independence remains the problem of public finances. Scotland’s fiscal standing is weak. Scotland ran a 9.4% of GDP budget deficit prior to COVID-19, excluding transfers from the UK, which compensates for a gap of about 6% of GDP (Chart 13).3 The country maintains generous social spending alongside a low-tax regime. There is no sign of correction as all Scottish parties are proposing more expansive social spending in the parliamentary election. The Scottish National Party is even proposing universal basic income. Scotland’s emergency COVID deficits are larger than the UK’s as well and projections over the coming years suggest that they will stay elevated. Historically economic growth keeps closely in line with the rest of the UK and there is no reason to believe independence would boost growth. The implication is that Scotland would have to curtail spending or raise taxes to come into line with UK-sized deficits, which are not small (Chart 14).4 Of course Scotland would not embrace austerity unless financial market pressure forced it to do so. Chart 14Scottish Deficit Projected Larger Than UK
United Kingdom Stays United
United Kingdom Stays United
Scotland would become a high-debt economy. Its public debt-to-GDP ratio would be about 97%, on a back-of-the-envelope calculation. Back in 2013 estimates ranged around 80% of GDP.5 The Scottish National Party’s Sustainable Growth Commission projected in 2018 – before the pandemic blew an even wider hole in the budget deficit – that deficits would nearly have to be cut in half (i.e. capped at 5% of GDP and falling) to achieve a 50% debt-to-GDP ratio over 10 years.6 This is not going to happen. Scotland would also have to take on a portion of the UK’s national debt if it were to have an amicable divorce from the UK and retain the pound sterling. But then much of its newfound independence would be compromised from the beginning by legacy debt and monetary policy shackles. Similar restrictions would come with EU and euro membership. Any accession process after the pandemic would require conformity to the EU’s growth and stability pact, which limits deficits and debt. Redenomination into a national currency, as noted, would dilute domestic wealth, zap the financial industry, and self-impose austerity. Bottom Line: Even if the Scottish nationalists manage to put together a pro-independence majority in Edinburgh, they face a complex process in setting up a referendum. Its passage is doubtful based on the current evidence. But obviously in the wake of Brexit investors should not assume that a referendum attempt will fail or that a successful referendum will be thwarted by parliament after a “leave” vote. The timeline for a second referendum is not imminent – and Scottish independence is highly unlikely, albeit possible at some future date given that middle-aged Scots lean in favor of independence. Investment Takeaways We will conclude with two market takeaways: Chart 15UK Stocks Recovering From Referendum Fever
UK Stocks Recovering From Referendum Fever
UK Stocks Recovering From Referendum Fever
Chart 16Hindsight On How To Play A Constitutional Struggle
Hindsight On How To Play A Constitutional Struggle
Hindsight On How To Play A Constitutional Struggle
The UK’s referendum fever has compounded political uncertainty and contributed to negative factors for the UK equity market over the past decade. A segmentation of the FTSE 100 according to country shows that Scottish-based companies’ share prices rolled over in the aftermath of the 2014 referendum, while the non-Scottish segment performed better (Chart 15). The implication is not that the referendum caused stocks to fall but that the 2014 independence push was the result of national exuberance supercharged by high commodity prices. Enthusiasm for independence has been flat since that time. What is clear is that financial markets look even less favorably upon Scottish equities than other British equities – another sign of the economic problems that will ultimately discourage Scottish voters from going it alone. In advance of the Scottish election, we went tactically long the Swiss franc relative to the British pound to capitalize on jitters that we expected to hit the currency. This trade was in keeping with the long fall of GBP-CHF over the past decade (Chart 16). But the stronger forces of global stimulus, vaccination, economic normalization, and recovery will soon provide a tailwind for sterling yet again. Therefore we are booking 1% gains and shifting to a more optimistic outlook on the pound. With the Brexit saga and the COVID crisis in the rear view mirror, and the tail risk of Scottish independence unlikely, the pound can resume its upward trajectory – at least relative to the Swiss franc. International equities and cyclicals are also poised to continue rising as the world recovers. We recommend investors go long the FTSE 100 relative to developed markets excluding the United States. Matt Gertken Vice President Geopolitical Strategy mattg@bcaresearch.com Footnotes 1 Jeremy Black, “The Legacy of the Scottish Referendum,” Foreign Policy Research Institute E-Notes, September 22, 2014, fpri.org. 2 See Akash Paun et al, "Scottish Independence: EU Membership And The Anglo-Scottish Border," Institute For Government, March 2021, instituteforgovernment.org.uk. 3 See Eve Hepburn, Michael Keating, and Nicola McEwen, "Scotland’s New Choice: Independence After Brexit," Centre on Constitutional Change, 2021, centreonconstitutionalchange.ac.uk. 4 See David Phillips, "Updated projections of Scotland’s fiscal position – and their implications," Institute for Fiscal Studies, April 29, 2021, ifs.org.uk. 5 Granting that the UK’s general government gross debt stood at GBP 1.88 trillion at the end of 2020, and assuming that Scotland takes on a share of this debt equivalent to Scotland’s share of the UK’s total population and output (roughly 8%), the Scottish debt would stand at GBP 150 billion out of a Scottish GDP at current market prices of GBP 156 billion, or 97% of GDP. For the 2013 estimate of at least 80% of GDP, see David Bell, "Scottish Independence: Debt And Assets," Centre on Constitutional Change, December 3, 2013, centreonconstitutionalchange.ac.uk. 6 Scottish National Party, "Part B: The Framework & Strategy for the Sustainable Public Finances of an Independent Scotland," Sustainable Growth Commission, May 2018, sustainablegrowthcommission.scot. The commission’s debt curbs will have to be revised in the wake of COVID-19. For discussion see Chris Giles and Murie Dickie, "Independent Scotland would face a large hole in its public finances," Financial Times, April 2, 2021, ft.com.

Weekly Performance Update For the week ending Thu May 06, 2021 The Market Monitor displays the trailing 1-quarter performance of strategies based around the BCA Score. For each region, we construct an equal-weighted, monthly rebalanced portfolio consisting of the top 3 stocks per sector and compare it with the regional benchmark. For each portfolio, we show the weekly performance of individual holdings in the Top Contributors/Detractors table. In addition, the Top Prospects table shows the holdings that currently have the highest BCA Score within the portfolio. For more details, click the region headers below to be redirected to the full historical backtest for the strategy. BCA US Portfolio
Market Monitor (May 6, 2021)
Market Monitor (May 6, 2021)
Total Weekly Return BCA US Portfolio S&P500 TRI 1.87% -0.21% Top Contributors NUE:US MO:US UPS:US MPLX:US WHR:US Weekly Return 49 bps 19 bps 16 bps 16 bps 15 bps Top Detractors UTHR:US AMKR:US GOOG.L:US NWSA:US PSA:US Weekly Return -18 bps -16 bps -7 bps -6 bps -5 bps Top Prospects TX:US ORI:US ESGR:US AN:US SCCO:US BCA Score 99.58% 96.22% 95.90% 95.03% 94.70% BCA Canada Portfolio
Market Monitor (May 6, 2021)
Market Monitor (May 6, 2021)
Total Weekly Return BCA Canada Portfolio S&P/TSX TRI 2.08% 0.21% Top Contributors NXE:CA ARX:CA RUS:CA IFP:CA CFP:CA Weekly Return 71 bps 42 bps 37 bps 30 bps 29 bps Top Detractors WEED:CA CRON:CA NPI:CA PBL:CA DCBO:CA Weekly Return -36 bps -28 bps -22 bps -19 bps -13 bps Top Prospects CS:CA CFP:CA RUS:CA IFP:CA LNF:CA BCA Score 99.83% 99.02% 98.96% 97.92% 97.44% BCA UK Portfolio
Market Monitor (May 6, 2021)
Market Monitor (May 6, 2021)
Total Weekly Return BCA UK Portfolio FTSE 100 TRI 1.76% 1.75% Top Contributors CVSG:GB VCP:GB TYMN:GB FXPO:GB AAF:GB Weekly Return 48 bps 36 bps 22 bps 22 bps 19 bps Top Detractors FDEV:GB NFC:GB EMIS:GB IPO:GB SVST:GB Weekly Return -22 bps -9 bps -8 bps -7 bps -7 bps Top Prospects SVST:GB NLMK:GB TUNE:GB GLTR:GB BPCR:GB BCA Score 99.86% 99.49% 97.60% 97.26% 97.08% BCA Eurozone Portfolio
Market Monitor (May 6, 2021)
Market Monitor (May 6, 2021)
Total Weekly Return BCA EMU Portfolio MSCI EMU TRI 0.38% 0.50% Top Contributors STR:AT CNV:FR POST:AT TFI:FR SES:IT Weekly Return 37 bps 27 bps 17 bps 15 bps 13 bps Top Detractors ALESK:FR FTK:DE VGP:BE AOF:DE FSKRS:FI Weekly Return -34 bps -21 bps -13 bps -10 bps -8 bps Top Prospects FSKRS:FI SOLV:BE CNV:FR PHH2:DE SOL:IT BCA Score 99.42% 98.69% 98.67% 98.32% 98.04% BCA Japan Portfolio
Market Monitor (May 6, 2021)
Market Monitor (May 6, 2021)
Total Weekly Return BCA Japan Portfolio TOPIX TRI 1.57% 0.98% Top Contributors 9543:JP 7545:JP 2791:JP 3132:JP 9532:JP Weekly Return 15 bps 14 bps 13 bps 10 bps 10 bps Top Detractors 8131:JP 6960:JP 4781:JP 8739:JP 1949:JP Weekly Return -2 bps -1 bps -0 bps 0 bps 0 bps Top Prospects 1766:JP 4966:JP 3291:JP 8133:JP 9436:JP BCA Score 98.81% 98.77% 98.64% 98.01% 97.91% BCA Hong Kong Portfolio
Image
Total Weekly Return BCA Hong Kong Portfolio Hang Seng TRI 0.42% -2.18% Top Contributors 323:HK 1898:HK 1606:HK 316:HK 2768:HK Weekly Return 41 bps 23 bps 21 bps 21 bps 14 bps Top Detractors 2232:HK 6100:HK 116:HK 3798:HK 856:HK Weekly Return -27 bps -23 bps -16 bps -12 bps -12 bps Top Prospects 990:HK 116:HK 468:HK 323:HK 2232:HK BCA Score 99.89% 99.54% 99.07% 98.58% 98.53% BCA Australia Portfolio
Market Monitor (May 6, 2021)
Market Monitor (May 6, 2021)
Total Weekly Return BCA Australia Portfolio S&P/ASX All Ord. TRI -0.66% -0.54% Top Contributors PDN:AU NEC:AU MVF:AU CVW:AU JLG:AU Weekly Return 91 bps 13 bps 9 bps 6 bps 6 bps Top Detractors GRR:AU RBL:AU ADH:AU STX:AU CDA:AU Weekly Return -30 bps -22 bps -20 bps -20 bps -19 bps Top Prospects BSE:AU GRR:AU PSQ:AU BFG:AU MGX:AU BCA Score 99.79% 99.72% 98.11% 97.49% 97.07%
Closing Our Millennials Basket For A 69% Gain
Closing Our Millennials Basket For A 69% Gain
Not so long ago, we added an 18% trailing stop to our Millennials Basket cyclical overweight that has a heavy tech exposure, and recent price action pushed this share price ratio close to our stop. We decided not to fight the tape and close this cyclical overweight that has generated 69% <i>alpha</i> for our portfolio, since inception. Importantly, given that the 10-year US Treasury yield tends to lead our Millennials Basket by approximately half a year, the current message is that the latter will likely continue to come off the boil. Once yields stabilize at a new equilibrium level likely higher than the recent 1.75% peak, we will look to reopen this trade. Bottom Line: Close the USES Millennial Basket cyclical overweight for a relative gain of 69%, since inception. We continue to recommend an above benchmark allocation from a secular stance.
Biden’s first 100 days can be summed up as the return of Big Government, i.e. “the Leviathan.” But markets are not afraid of one-off corporate tax hikes that only partially reverse the previous administration’s tax cuts amid a brand new stimulus-charged economic cycle. Biden’s approval rating after his first 100 days is comparable to that of Presidents Bill Clinton and George W. Bush, suggesting that he can accomplish a major legislative achievement. The $2.3 trillion American Jobs Plan will be watered down in Congress but not to a great extent. Green energy investments and funding for research and development will survive. Thus Biden’s plan will sow the seeds of a productivity mini-boom, if not a structural boom, in the 2020s. Republicans are favored to win the midterm elections in 2022 but investors should not make any decisions based on that expectation. The risk of Democrats keeping the House of Representatives – and therefore having a new chance to surprise with taxes in the second half of Biden’s term – is much greater than the historical pattern suggests. Stick with our long materials versus tech trade. Stick with short health care trades. Go long renewable energy stocks. Feature President Biden passed the 100 day mark at the end of April. The most striking characteristic of his administration is the giant deficit spending. Biden marks the symbolic return of the “leviathan,” i.e. the state, to American political economy. Normally the budget deficit tracks closely with the unemployment rate because rising unemployment causes tax revenue to fall and government spending to rise. The divergence between the deficit and unemployment became pronounced in 2016 and revealed the structural forces – e.g. slow growth, disinflation, high debt, inequality, populism – driving US policymakers to abandon fiscal discipline. But the 2016-20 political cycle combined with the pandemic broke the dam and the divergence is now gigantic (Chart 1). Chart 1Biden's First 100 Days: An Historic Divergence
Biden's First 100 Days: An Historic Divergence
Biden's First 100 Days: An Historic Divergence
All else equal, the implication is inflationary, though inflation will respond to a range of factors on different time frames. Signs of inflation today may well be under control, as Federal Reserve Chairman Jay Powell and Secretary of Treasury Janet Yellen believe, but over the long run we take the inflation risk seriously as the policy elite has fundamentally shifted to be vigilant about deflation, not inflation. Biden’s Approval Is “Just Enough” Biden’s popularity is “fair to middling” as his honeymoon comes to an end. His approval rating clocks in right between that of Presidents Barack Obama and Donald Trump (Chart 2A). He is not as popular and charismatic as Obama and not as unpopular and controversial as Trump. His approval among Democratic voters is higher than that of Obama, similar to Trump among Republicans, due to the fact that the US has hit historic levels of political polarization (Chart 2A, second panel). His embrace of left-wing policy is keeping him in good standing among Democratic voters but may become a liability during the 2022 midterm election (more on that below). Chart 2ABiden’s Approval Rating: Fair-To-Middling
Leviathan: Biden's First 100 Days
Leviathan: Biden's First 100 Days
Chart 2BBiden Close To Clinton, Bush At 100 Days
Leviathan: Biden's First 100 Days
Leviathan: Biden's First 100 Days
American presidential approval ratings have fallen continuously for decades and they typically fall after inauguration. This is true of Biden but he looks more like Presidents Bill Clinton or George W. Bush than Trump. His approval is likely to stay over 50% for the foreseeable future due to a supercharged economic recovery (Chart 2B). Trump stands out conspicuously in this chart for his negative net approval, which implies that on a relative basis Biden will be more capable in conducting policy. And yet Trump got his signature piece of legislation – the Tax Cut and Jobs Act – through Congress, which has some bearing on Biden’s proposals. Our political capital index (Appendix) shows that Biden will benefit from consumer confidence and wage growth shooting up, business sentiment strengthening, and polarization slightly abating due to a slight rise in Republican approval. While Biden’s Democratic Party has only the narrowest of majorities in the Senate, Biden’s signature legislative proposal – the American Jobs Plan – still has an 80% chance of passing in some form. Senate minority leader Mitch McConnell of Kentucky declared this week that Biden will not get any Republican votes for this package of infrastructure and corporate tax hikes but budget reconciliation is a ready way for the bill to pass on a partisan basis. Biden’s fiscal blowout should be seen as the culmination of a popular shift against fiscal discipline (or “austerity”) that took root in the middle of the last decade and was also expressed by Republican support for the big-spending President Trump. But it is more extravagant than what the Republicans proposed or would have been able to get had Trump been elected. Chart 3 highlights the difference between the Democratic and Republican spending proposals for the early 2021 COVID-19 relief bill and infrastructure plan. Chart 4 highlights the corporate tax increases Biden has proposed in excess of the Trump rate. Chart 3Biden’s Spending In Excess Of Republican Plans
Leviathan: Biden's First 100 Days
Leviathan: Biden's First 100 Days
Chart 4Biden’s Taxes In Excess Of Republican Plans
Leviathan: Biden's First 100 Days
Leviathan: Biden's First 100 Days
From an investment point of view, now is the perfect time to raise corporate taxes as the early cyclical surge in economic activity will prevent the one-off hit to earnings, which should be around 5%-8% according to our Global Investment Strategy, from hindering the stock market for long. The output gap, apparent from still relatively low industrial capacity utilization, will rapidly be plugged regardless of the tax hikes, as is evident from the surge in retail sales and core capital goods new orders and the decline in fuel inventories (Chart 5). The hyper-stimulated economy has been a key reason for our argument that Biden will mostly get what he wants, in terms of corporate taxes, since growth will be fine. The public is positively crying out for taxing corporations, as we showed in our April 7 missive and other reports. Chart 5The Output Gap Will Close Quickly
The Output Gap Will Close Quickly
The Output Gap Will Close Quickly
Given that Biden’s political capital is only “just enough,” and that it is falling over time, many investors believe that Biden’s major legislative proposals will be watered down beyond recognition. They will be watered down but the reconciliation process ensures that Democrats will pass at least one bill and that it will largely gratify the party’s preferences. And any watering down will affect tax hikes more so than spending, since tax hikes are the most controversial parts of the bill for moderate Senate Democrats. As Table 1 reveals, an infrastructure package with half the revenue increase is a $1.3 trillion addition to the budget deficit over the eight-to-15 year life-cycle of the bill, as opposed to a fictitious $341 billion in the event that all tax hikes pass Congress. Hence the paring back of Biden’s ambitions does not imply fiscal restraint and is not bullish for US Treasuries. Table 1Watering Down Biden’s Proposals Not Good For Deficit
Leviathan: Biden's First 100 Days
Leviathan: Biden's First 100 Days
A Productivity Boomlet How can we benchmark the magnitude of the structural transformation taking place in the US as a result of Biden’s Leviathanic spending proposals? From the perspective of government spending as a contributor to economic output, the Leviathan shrank in the decades after President Lyndon B. Johnson’s “Great Society” and Vietnam debacle. But from the perspective of government accounts, Big Government never actually went away (Chart 6), as Reagan used spending to win the Cold War and Clinton only enjoyed the briefest hiatus from deficits in the 1990s. From these charts we can conclude that Biden’s administration will create unprecedented spending and deficits that, taken with an extremely accommodative Fed, will increase the risk of substantially higher inflation over the 2020s. Chart 6Johnson’s ‘Great Society’ Versus Biden’s ‘Green Society’
Leviathan: Biden's First 100 Days
Leviathan: Biden's First 100 Days
Chart 7US Adds To Expansive Social Safety Net
Leviathan: Biden's First 100 Days
Leviathan: Biden's First 100 Days
Biden is not fighting an economic depression and world war, like Franklin D. Roosevelt, although the US has experienced a Great Recession and is entering a new cold war with China. So the shift should be seen as a generational change in the role of government and not as an ephemeral, four-year trend. This is true notwithstanding the fact that the US already spends a lot on health and education (Chart 7) and not as an ephemeral, four-year trend. The element of international competition is critical to the unique components of Biden’s spending package. Biden jettisoned the health care debates of the Obama era – to our surprise – and instead inaugurated the American foray into the global green energy race. Looking at the OECD’s measure of the “greenness” of global fiscal stimulus – and supplementing it with Biden’s proposed jobs plan – the US compares favorably with the EU and China (Chart 8). Chart 8US Enters The Green Energy Race
Leviathan: Biden's First 100 Days
Leviathan: Biden's First 100 Days
True, climate policy is more controversial in the US, which means it may well be frozen after Biden’s major bill. The EU and China will spend more on renewable energy and environmental protection because they are net energy importers and manufacturing powers. But the US is highly unlikely to exit the green race in the future, as younger generations care about it more than their elders and it is connected to the US strategic imperative of technological leadership. Biden will have opened up a new field of national policy, regardless of where on the field the players will fight over the ball at any given time. Biden is also pumping federal money into research and development, another area of geopolitical competition (Chart 9). The takeaway is that Biden’s first year in office – which may be his most consequential year in terms of legislation, particularly if he is a one-term president – is sowing the seeds for a productivity boom, or at least a mini-boom, in the coming years (Chart 10). The pace of productivity growth in the coming years is a matter of speculation and the long term trend is down. But the expected cyclical increase should be supplemented with the knowledge that the US is now aggressively monetizing debt, aggressively pursuing industrial policy and technological advancement, and aggressively competing with geopolitical rivals like China (and even allies like the EU). The likelihood of productivity breakthroughs may go up in such an extraordinary context. We cannot know but we cannot discount the possibility. Chart 9US Doubles Down On Tech Race
Leviathan: Biden's First 100 Days
Leviathan: Biden's First 100 Days
Chart 10Productivity Will Rise Cyclically But What About Structurally?
Productivity Will Rise Cyclically But What About Structurally?
Productivity Will Rise Cyclically But What About Structurally?
Vaccines And Immigration Elsewhere Biden’s first 100 days are less specific to his administration. The US is performing very well on the pandemic, both in innovating vaccines and distributing them, but an objective analysis will force Biden to share the credit with the Trump administration (Chart 11). On immigration, by comprehensively weakening enforcement and raising refugee allowances, all in the midst of a surging American economy, Biden will be vulnerable to Republican accusations of encouraging a humanitarian crisis on the border, vitiating rule of law, and making a cynical ploy to expand the Democratic voter base. The number of southwest border encounters by the Customs and Border Protection agency began to skyrocket over the past year – and as such it reflects structural factors that would have troubled a second Trump administration as well. But the election seems to have had an impact based on the inflection point in the data at the end of 2020 (Chart 12). Chart 11COVID-19 Vaccination Campaign On Track
COVID-19 Vaccination Campaign On Track
COVID-19 Vaccination Campaign On Track
Chart 12Immigration: Biden's Fatal Flaw?
Immigration: Biden's Fatal Flaw?
Immigration: Biden's Fatal Flaw?
Regardless, Biden has made the decision to cater to the pro-immigration side of his party and will now own this trend. It will be a unifying force for Republicans, although they remain deeply split over a range of issues and are not any closer to healing their wounds. The market impact is limited in the short run. In the medium run, if unchecked immigration feeds the nativist and populist elements of the Republican Party, then Biden’s decision could have a substantial impact on future US policy by generating a backlash. Our best guess at the moment is that Biden’s actions will reinforce the Republican Party’s embrace of Trump’s policy platform. Since Biden is not making major bipartisan legislative efforts to reform immigration comprehensively, the great immigration debate will return in 2024 or thereafter. Public opinion suggests Republican nativism is out of fashion but a large influx of immigrants could opinion over time as today’s issues fade. Thus Biden’s successes on economic recovery today are sowing the seeds of his party’s biggest vulnerability in domestic policy in future. But admittedly it is too soon to say whether this weakness will be effectively exploited by the opposition. In the meantime investors and corporations will cheer the prospect of cheap and abundant labor. An Overlooked Market Risk From The Midterm Elections This overview of Biden’s honeymoon period naturally refers to the 2022 midterm elections in several places. The Republicans will not be able to repeal Biden’s laws if they take the House of Representatives – or less likely the Senate – in the 2022 vote. But they will be able to grind proposals to a halt. The fate of Biden’s third major legislative proposal, the $1.8 trillion American Families Plan, will hang in the balance, as will green energy subsidies, the child tax credit, and various social initiatives. Much has been made about the 2020 US census and the reapportionment of seats in the House of Representatives according to the population. States that have a single party in control of the governor’s mansion and the legislature can gerrymander or redraw congressional districts as they please to favor their party. Table 2 shows that this partisan process could easily yield two Republican seats on a net basis. This is less than expected but Republicans only need a net of five seats to reclaim the House. Table 2US Census And Reapportionment Favors Republicans Slightly
Leviathan: Biden's First 100 Days
Leviathan: Biden's First 100 Days
Redistricting is an important theme because it perpetuates political polarization. But it is not important in determining who will win the House in 2022. The House has changed hands numerous times despite gerrymandered districts. Midterms almost always work against the president’s party. Only in 1934, during the Great Depression, and 2002, immediately after the Twin Towers were attacked, did voters strengthen a first-term president’s hold on Congress. Judging by Biden’s approval rating, Democrats would be lined up for a loss of far more than five seats on a net basis in 2022. They could lose 20 or more (Chart 13). As noted in the previous section, Republicans may find a rallying point on immigration. Chart 13Midterm Elections Dominated By Opposition Party – And Need For Checks And Balances
Leviathan: Biden's First 100 Days
Leviathan: Biden's First 100 Days
Having said that, investors should not make any decisions based on the midterm election. While Republicans have a 95% chance of winning the House according to the modern historical pattern, they have a lower 73% chance according to the online political betting hub Predictit.org, and we would side with the latter or even lower, at this early stage in the political cycle. The pandemic and social unrest of 2020, combined with the slow-growth 2010s and trade war, create a context of upheaval that is not entirely dissimilar to the exceptional midterm elections of 1932 and 2002. Biden’s rescue packages and the economic recovery will be a huge boon for the Democratic Party in 2024 and it is possible that they will reap some benefits even in 2022. This is especially the case because Trump and his allies will challenge establishment and elitist Republicans in the primary elections, which could result in Republicans losing five-to-nine seats. If they put up Trumpists in competitive, purple, or suburban districts, voters will swing toward moderate Democrats over populist Republicans in order to preserve the “bread and butter” gains of Biden’s agenda. The bottom line is that Republicans are favored to take the House in 2022 but the 75% odds are much more realistic than the 95% historical probability and possibly even too high. Gridlock would freeze Biden’s spend-and-tax agenda in place but the absence of gridlock would come as a surprise to investors who counted on a Republican victory. Tax hikes on wealthy individuals and capital gains – as projected in the American Families Plan – could still be on the table after the midterm. These tax hikes would still be unlikely to overturn the equity bull market but they could cause investors to reassess the overall policy setting for the worse. The implication would be that the 2020 political change marked a more lasting leftward shift in US policy. For example, taxes could go up beyond what Biden currently projects. Midterm risks should not trouble investors in the near term but they should be on the radar, particularly as the Republican primaries get underway next year and as investors get a better read on inflation in the wake of Biden’s mammoth spending. Investment Takeaways We would draw a few main investment takeaways from Biden’s first 100 days. In the short run, we would call attention to the “buy the rumor, sell the news” behavior exhibited by financial markets during President Trump’s first year in office with full party control of Congress. US equities stood to benefit from tax cuts, especially relative to the rest of the world, which would not receive tax cuts but could face trade tariffs. This expectation played out after Trump’s election but the market sold upon the news of his inauguration. It played out again after Republicans failed to repeal Obamacare, suggesting they might fail to cut taxes. The market correctly bid up US equities on the rumor that the GOP would then turn its full attention to cutting taxes. US equities outperformed until the end of the year when the tax cuts became a fait accompli, at which point the news was sold (Chart 14, top panel). The implication today is that US stocks, especially cyclical stocks and infrastructure-related plays, will continue generally to rally ahead of Biden signing the American Jobs Plan into law, likely around November. Obviously a correction could occur at any time but upon the signing of the law one should not be surprised to see some serious profit-taking. An analogy can also be drawn to renewable energy plays after the Democrats’ “Blue Sweep” in 2020. Markets have largely discounted the surge in renewable energy plays that occurred upon the recession in 2020 and the rising likelihood that Trump would lose reelection (Chart 14, bottom panel). This creates a buying opportunity for a long-term theme. Republicans will not be able to repeal Biden’s green projects and there is some risk that Democrats retain legislative control. And younger generations, even Republicans, are favorable toward the greening of society. Therefore we recommend going long US renewable energy stocks. It also follows that cyclical and value stocks have not yet exhausted their run against defensives and growth stocks. We will therefore hang onto our long materials / short Big Tech trade until we see more substantial signs that near-term disinflationary risks will derail this trade (Chart 15). We will also stick with our short managed health care trade – and our preference for health care equipment and facilities within the health care sector – despite the Democrats’ tentative decision to sideline the health care policies that would have hit the health insurers and Big Pharma. Chart 14Investment Takeaways: Buy The Green Hype (For Now)
Investment Takeaways: Buy The Green Hype (For Now)
Investment Takeaways: Buy The Green Hype (For Now)
Chart 15Housekeeping: Stick With Materials Over Tech
Housekeeping: Stick With Materials Over Tech
Housekeeping: Stick With Materials Over Tech
In the long run, we would point out that the shift away from Reaganism toward Johnsonianism – the return of Leviathan – is a lasting trend that will bring significant change to the US policy setting. These are mostly but not all inflationary. Larger immigration and a productivity boost are not inflationary. But large deficits, tax hikes, and wage pressures are inflationary. Therefore the risk of inflation has gone up in a historic way even though the magnitude of the risk can be overstated in the short term – when there is still slack in the economy – and there are still disinflationary factors that could work against the risk as events unfold. We remain cyclically bullish. Matt Gertken Vice President Geopolitical Strategy mattg@bcaresearch.com Appendix Table A1USPS Trade Table
Leviathan: Biden's First 100 Days
Leviathan: Biden's First 100 Days
Table A2Political Risk Matrix
Leviathan: Biden's First 100 Days
Leviathan: Biden's First 100 Days
Table A3Political Capital Index
Leviathan: Biden's First 100 Days
Leviathan: Biden's First 100 Days
Table A4APolitical Capital: White House And Congress
Leviathan: Biden's First 100 Days
Leviathan: Biden's First 100 Days
Chart A4BPolitical Capital: Household And Business Sentiment
Leviathan: Biden's First 100 Days
Leviathan: Biden's First 100 Days
Table A4CPolitical Capital: The Economy And Markets
Leviathan: Biden's First 100 Days
Leviathan: Biden's First 100 Days
Last September, we showed five reasons, from our pool of short-term indicators we track, not to chase equities higher and warned investors that a pullback was in the cards. Subsequently, the SPX fell 10% from peak-to-trough and suffered its first correction since the March 23, 2020 bottom. Fast-forward to today, and a number of our short-term indicators are flashing red again. While overbought conditions are a notch below the extremes printed last September, we still take this opportunity to revisit and update five of our near-term technical indicators in no particular order. Reason #1: The 200-day Moving Average Moving averages are a reliable tool to put the speed of any rally in perspective and to gauge investor sentiment. Chart 1 shows the SPX and NASDAQ 100 (NDX) price ratios with respect to their 200-day moving averages as Z-scores. Whenever both the SPX and NDX crossed above the one standard deviation (STDEV) line, a sizable pullback was quick to follow. While the NDX retraced below the one STDEV line recently, this week’s price action pushed the ratio back above the one STDEV line sounding the alarm. The implication is that the probability of a pullback is rising rapidly. Chart 1
Reason 1
Reason 1
Reason #2: Bollinger Bands For the second reason, we look at price deviations from the moving average through a different lens – Bollinger bands (BBs). A traditional (20,2) BB includes a 20-period moving price average, as well as 20-period two STDEV lines. Chart 2 shows the S&P 500 together with its (20,2) BBs, on a monthly time frame. Whenever the market spikes above the two STDEV line, a sizable correction ensues. Currently, the market is squarely above the two STDEV line, which has historically been a precursor to a 5-10% drawdown. Chart 2
Déjà Vu: Five Reasons Not To Chase Equities In the Near-Term
Déjà Vu: Five Reasons Not To Chase Equities In the Near-Term
Reason #3: Market Breadth In addition to looking at popular market breadth indicators such as a percent of stocks above a moving average and new highs/new lows series, we also take a look at the Hindenburg Omen indicator that is a breadth indicator partially based on the new highs/new lows calculation. A more in-depth explanation can be found here. Similarly to the aforementioned Reason #1, the best signal is given when the indicator flashes red for both NYSE and NASDAQ exchanges. Chart 3 shows that when implementing this approach, there has only been one false/positive – the Trump’s tax cut rally. Currently, the indicator represents another warning sign: it produced a sell signal in March. While this can prove another false/positive, given the plethora of other warnings, we doubt this will be the case. Chart 3
Reason 3
Reason 3
Reason #4: Options/Volatility Markets Next, options related volatility reveals more broad equity market vulnerabilities. Specifically, the VIX and the VXN which by construction are inversely correlated with the S&P 500 and NASDAQ 100, respectively, serve as an excellent timing tool. We look at the 20-day moving correlation of those respective variables, and a reliable sell signal is given once both (VIX, SPX) and (VXN, NDX) 20-day moving correlations shoot into positive territory (Chart 4). True, this signal has not been triggered just yet with the (VXN, NDX) pair lagging behind. But the positive print that happened this Monday in the (VIX, SPX) pair was enough to rattle the market yesterday, which could be a precursor to a larger correction. Chart 4
Reason 4
Reason 4
Reason #5: Lack Of Leadership The last reason for near-term cautiousness is the lack of leadership from a key cyclical sub-sector. Weakness in anticipatory semiconductors is far too pronounced to be written off as an industry-only event. Chart 5 depicts how the current divergence between relative semi prices and the SPX is eeriely similar to the one in late-2018. Finally, Chart A1 in the Appendix on the next page examines the relationship between semis and the SPX on a longer timeframe. Bottom Line: There are rising odds of a sizable SPX pullback. Investors who cannot stomach a likely volatility bout can buy some protection in the form of VIX futures (we are long the June expiry contract) in order to withstand a possible 10% SPX correction. Short-term caution on the prospects of the broad equity market that remains fully valued is still warranted. Chart 5
Reason 5
Reason 5
Appendix Chart A1
Appendix
Appendix
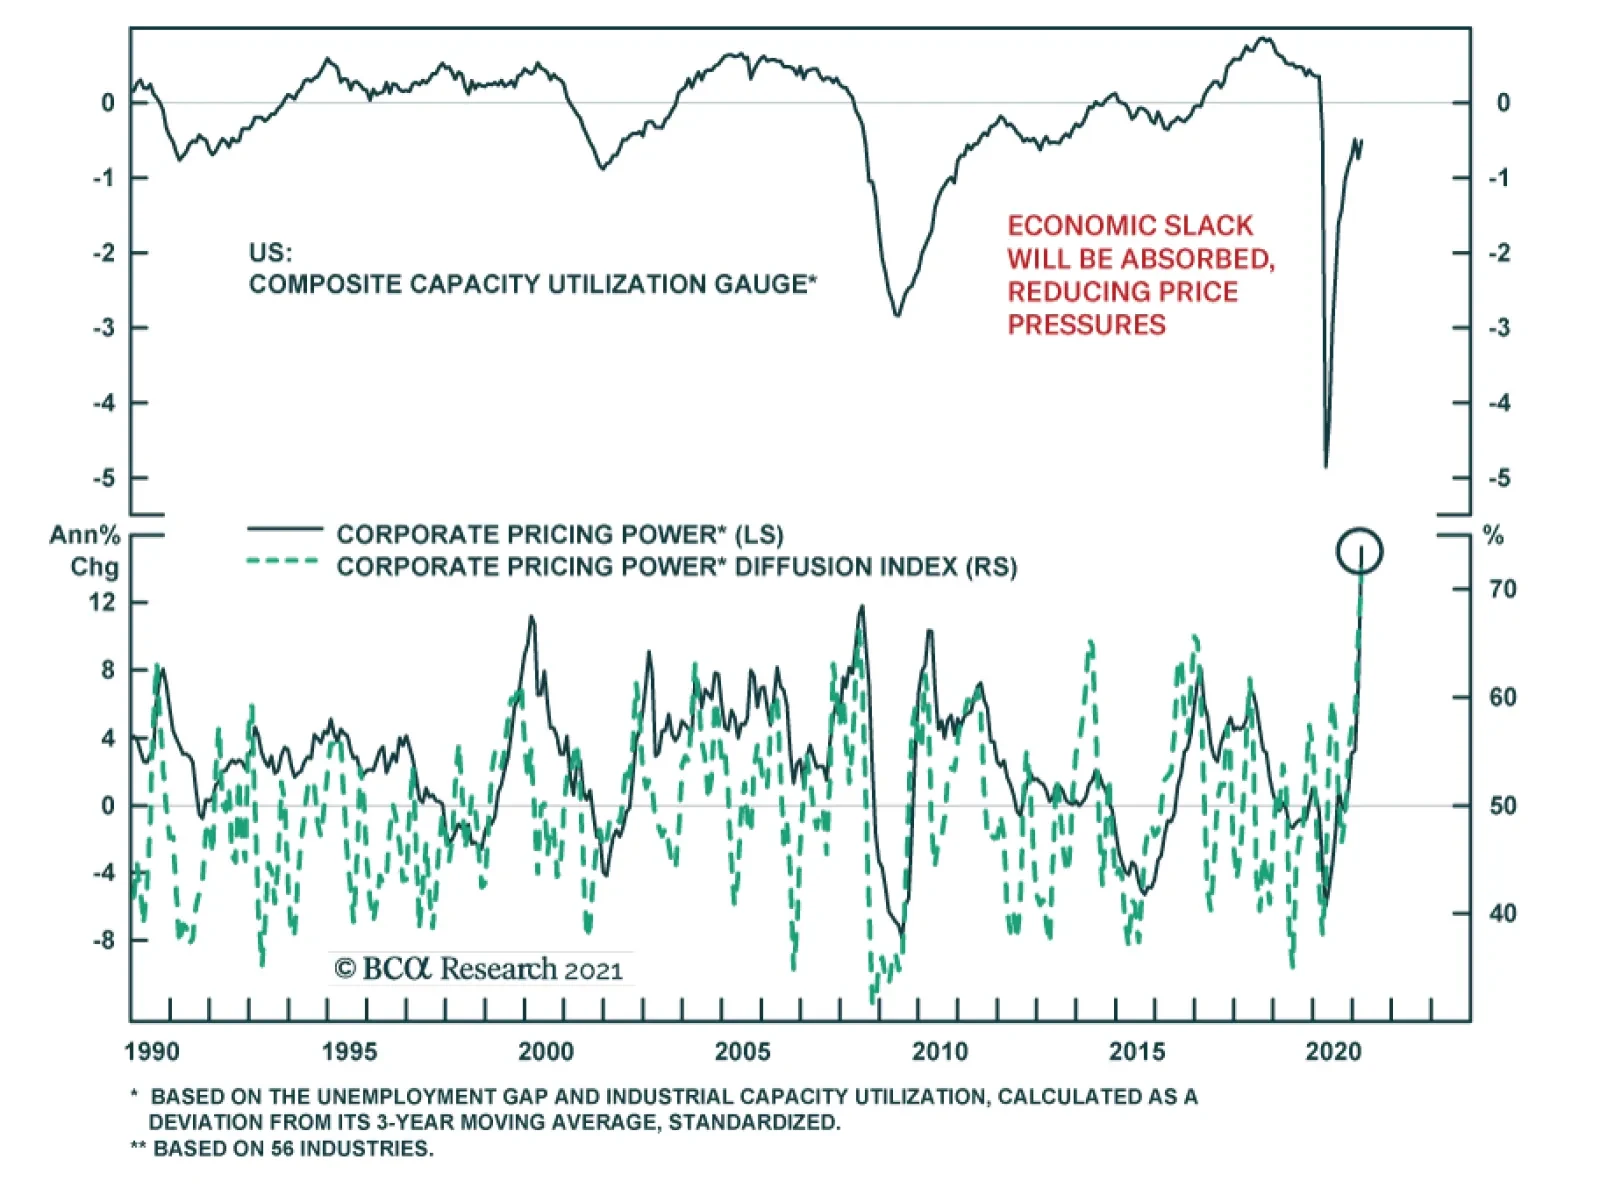
Market commentary is rife with references to evidence of rising inflationary risk in the US economy. This is not unfounded. Monday’s ISM report highlighted supply chain bottlenecks, raw material shortages, and labor market challenges as dominant forces…
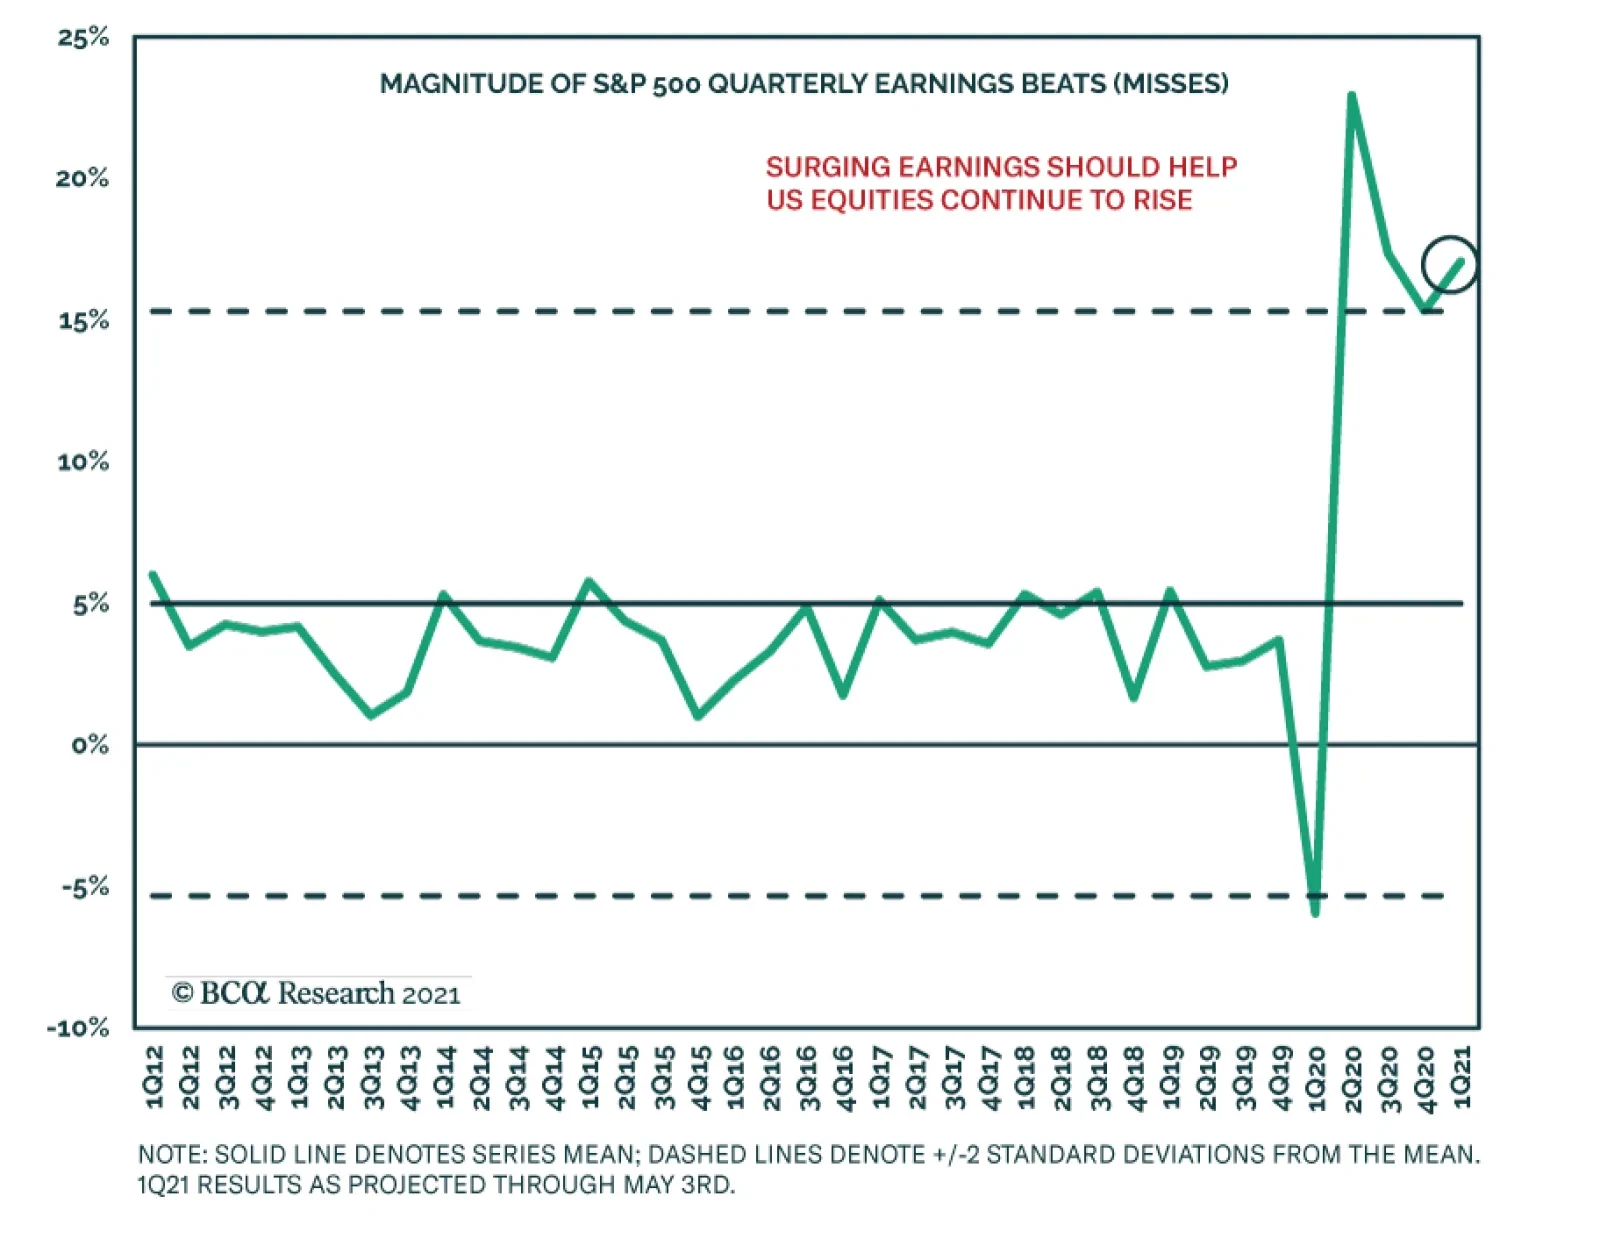
Yet Another Blockbuster Quarter for S&P 500 Earnings
…
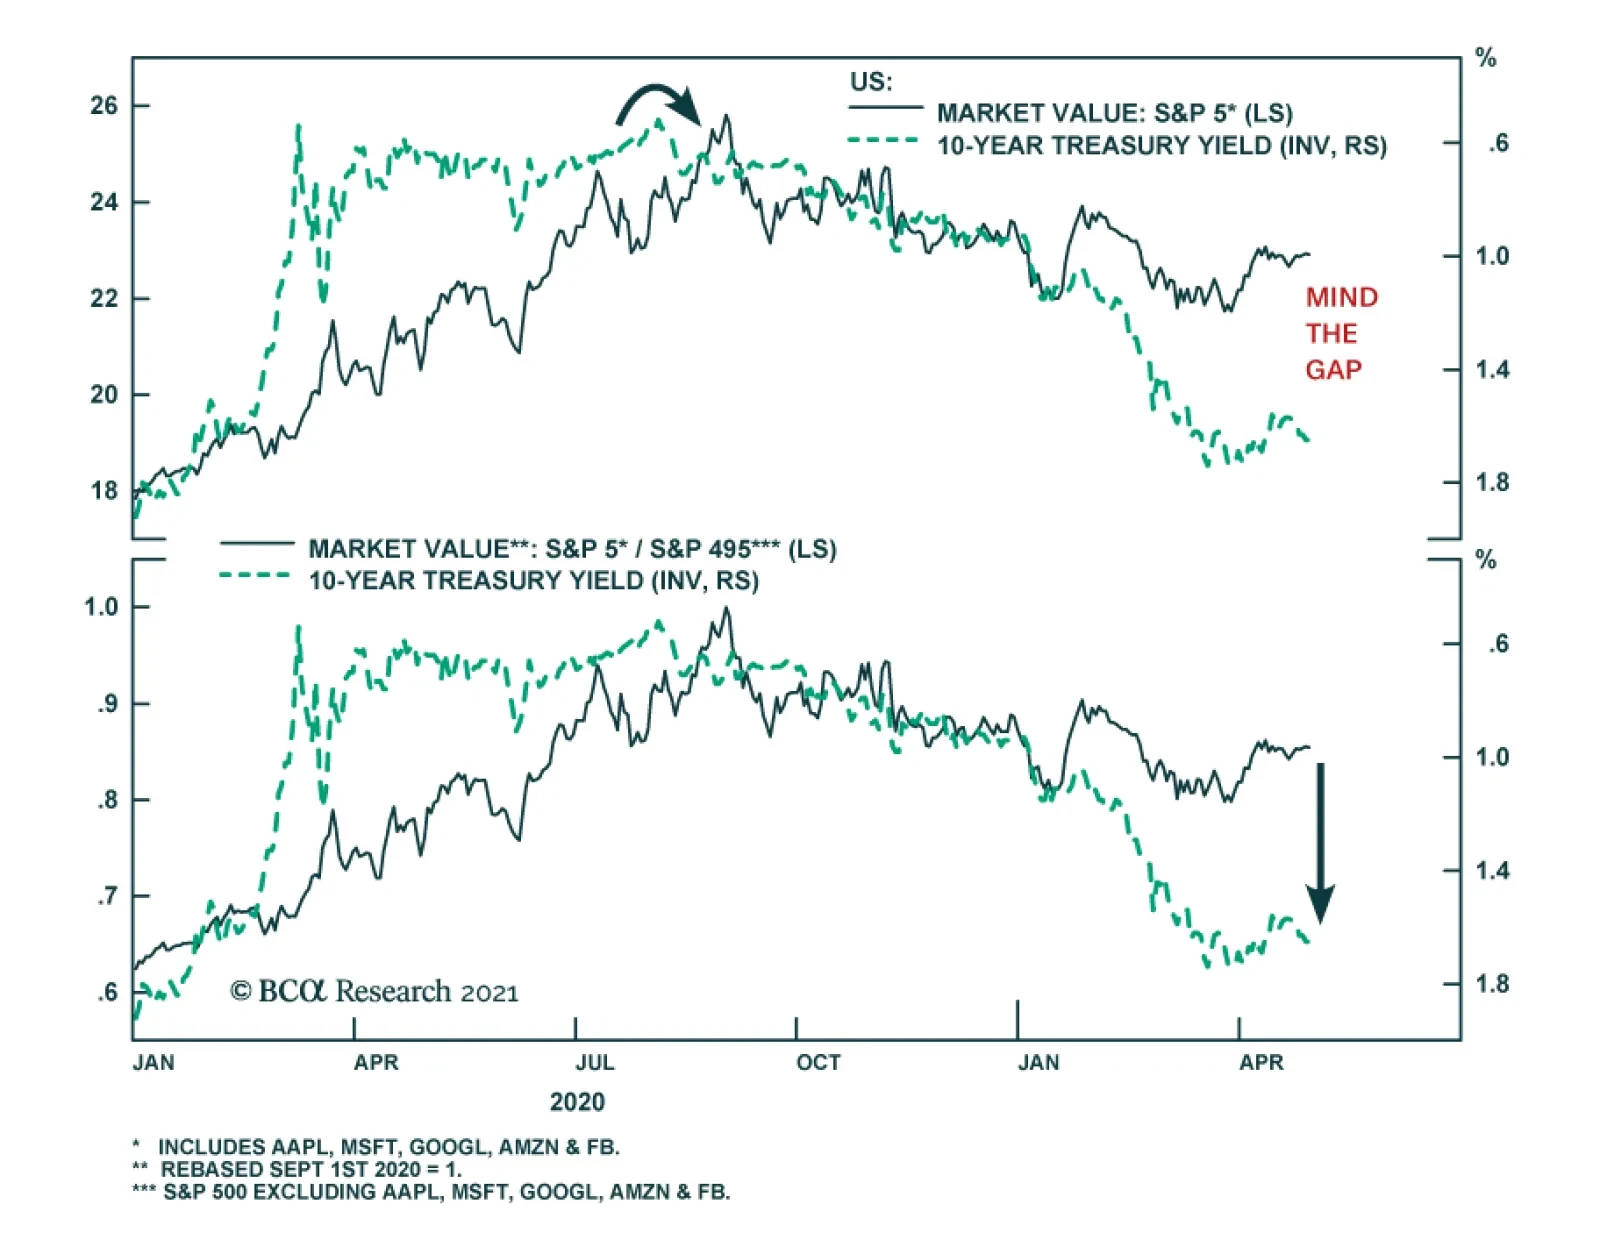
Tech titans (AAPL, MSFT, AMZN, GOOGL & FB) peaked last September at roughly 26% market cap weight in the SPX, and have since fallen 300bps despite four of the five stocks recently hitting new all-time highs (AAPL is the last man standing). This…
Highlights Portfolio Strategy Firming operating metrics, a capex upcycle, rock bottom valuations and deeply oversold conditions all suggest that it no longer pays to be bearish Big Pharma. Upgrade to neutral, today. A looming M&A boom, excess liquidity leaking into biotech stocks, extremely pessimistic Wall Street analysts’ forecasts and severe undervaluation, all suggest that now is the time to go against the grain and overweight biotech equities. Recent Changes Lift the S&P pharmaceuticals index to neutral and remove it from the high-conviction underweight list cementing gains of 12.6% and 10.3% respectively. Boost the S&P biotech index to overweight today. Both of these moves also lift the S&P health care sector to an above benchmark allocation. Table 1
Sell In May And Go Away Or Hold And Pray?
Sell In May And Go Away Or Hold And Pray?
Feature The bulls have taken full control of the equity market and propelled almost every index to fresh all-time highs despite a muted earnings season. Not only are the SPX, the DOW industrials and transports, the NASDAQ composite and the NASDAQ 100 all flirting with uncharted territory, but also more obscure indexes like the Value Line Arithmetic (gauging the average US stock) and Geometric (gauging the median US stock) indexes have also cleared the all-time high bar (Chart 1). On a stock level, bellwether AAPL – the largest stock in the world – has yet to make the leap to new highs despite a blowout profit report and gargantuan buyback announcement, which is cause for near-term concern. Given that the Fed orchestrated this once in a lifetime bonanza, it is also the Fed that can spoil this party, at least temporarily, by removing the proverbial punchbowl. Peering toward the back half of the year, our view remains that the Fed will have to relent and taper asset purchases as inflation will be rearing its ugly head not in a transitory, but more on a semi-permanent fashion. Importantly, the USD can further fan this inflationary impulse. Chart 2 shows that US real GDP expectations are trouncing the rest of the world (ROW) as we first showed in early March. Similarly the ISM manufacturing dichotomy compared with the ROW PMIs is as good as it gets. While this would typically call for a surge in the greenback, counterintuitively we think the path of least resistance is lower for the US dollar as the US economy reaches an inflection point versus the ROW mid-year. Crudely put, if the USD merely ticked up on such a wide economic differential, once Europe and Japan play catch up as the vaccine rollouts and economic reopening smoothen up, then investors will likely flee the US dollar. Chart 1All Time Highs Everywhere
All Time Highs Everywhere
All Time Highs Everywhere
Chart 2Relative Growth Expectations At A Zenith
Relative Growth Expectations At A Zenith
Relative Growth Expectations At A Zenith
With regard to stock market dynamics, this is welcome news for revenue growth, especially for internationally sourced SPX sales that garner a 40% share of total revenues. Since the US dollar floated in the early 1970s, the inverse correlation has increased between top line S&P 500 growth and the greenback (Chart 3). The implication is that a US dollar debasing from current levels will further boost the allure of companies that can raise selling prices. On that front our Corporate Pricing Power Indicator (CPPI) that we recently updated has been on a tear, underscoring that sales growth will soon follow suit (Chart 4). Chart 3Depreciating USD A Boon For SPX Sales
Depreciating USD A Boon For SPX Sales
Depreciating USD A Boon For SPX Sales
Chart 4Rising Inflation Will Boost Revenues
Rising Inflation Will Boost Revenues
Rising Inflation Will Boost Revenues
Tack on optimistic Chief Executives, and the picture brightens further for SPX revenue prospects. Inflation breakevens also corroborate the messages from our soaring CPPI and surging business confidence (Chart 4). One level down to the SPX GICS1 sector level, Charts 5, 6 & 7 highlight sales growth expectations, with deep cyclicals reigning supreme –especially the energy complex– and defensives the clear laggards (all sectors are compared with the broad market). On the early cyclical front, consumer discretionary equities are forecast to grow sales by 500bps more than the SPX, while financials are slated to trail the overall market by 500bps. Chart 5Consumer Discretionary…
Consumer Discretionary…
Consumer Discretionary…
Chart 6…And Deep Cyclicals…
…And Deep Cyclicals…
…And Deep Cyclicals…
Chart 7…Have The Upper Hand
…Have The Upper Hand
…Have The Upper Hand
With regard to the contribution to SPX sales growth for calendar 2021, Table 2 details sector sales growth, sector sales weight, all ranked by sector contribution to SPX sales growth. Chart 8 highlights that consumer discretionary, energy and health care comprise roughly half of the increase in overall revenue growth for 2021. Adding industrials and tech to the mix and these five sectors explain 80% of this year’s projected top line growth contribution to the SPX. Table 2SPX GICS1 Sector Sales Analysis
Sell In May And Go Away Or Hold And Pray?
Sell In May And Go Away Or Hold And Pray?
Chart 8Sector Contribution To 2021 SPX Sales Growth
Sell In May And Go Away Or Hold And Pray?
Sell In May And Go Away Or Hold And Pray?
Drilling further into industry sub-groups and for inclusion purposes, Table 3 shows our universe of coverage, ranking GICS1 sectors by 12-month forward sales growth and then re-ranking by sub-groups always from highest-to-lowest. Table 3Identifying S&P 500 Sector Sales Growth Leaders And Laggards
Sell In May And Go Away Or Hold And Pray?
Sell In May And Go Away Or Hold And Pray?
Circling back to investment implications and gelling everything together, what should investors do given this backdrop? If portfolio managers can stomach volatility and sail through the seasonally weak month of May, then holding the line and sitting tight is the appropriate strategy. However, if investors cannot stomach the bout of volatility that is likely looming, then playing some defense would make sense. We stand closer to the latter camp, and this week we take profits on a defensive group and lift exposure to neutral and boost another beaten down health care sub-group to overweight. These two moves also lift the S&P health care sector to an above benchmark allocation. Exiting The ER The bearish undertones haunting the S&P pharmaceuticals index are well ingrained in investors’ minds and our portfolio has also handsomely benefited from avoiding this key health care industry group. However, it no longer pays to be negative Big Pharma and today we book gains of 12.6% and lift exposure to neutral, and also take this index out of our high-conviction underweight list locking in gains of 10.3% since the early December inception. Chart 9 shows that likely all the adverse news is priced in rock bottom valuations and extremely oversold technical conditions. In fact, the pharma forward P/E ratio is trading at a 40% discount to the SPX and all time low since the GICS reclassification of sectors took place in the early 1990s! While such drubbing is warranted, as this defensive index has to contend an economy exiting recession and also a near unanimous outcry against industry pricing power gains, the easy money has been made on the short/underweight side. This de-rating has coincided with a collapse in relative forward profit growth, on a 12-month and five-year basis, both of which are probing all-time lows (Chart 10). The implication is that the EPS bar is so low it is nearly guaranteed that Big Pharma will surpass it. Such extreme pessimism is contrarily positive and if there is even a whiff of positive profit news, an explosive rally will take root. Chart 9Unloved And Under-owned
Unloved And Under-owned
Unloved And Under-owned
Chart 10Analysts Have Given Up On Pharma
Analysts Have Given Up On Pharma
Analysts Have Given Up On Pharma
Encouragingly, our macro EPS growth models signal that pharma profits have a strong pulse and will outshine the overall market in the coming year (Chart 11). We recently highlighted the near perfect inverse correlation of the relative share price ratio with the US leading economic indicator and the US ZEW. Similarly, we have shown in the recent past that a number of subcomponents of the ISM manufacturing survey also move inversely with pharma relative profitability. Now that the ISM is at a zenith, staying bearish pharmaceutical stocks will likely prove offside. Meanwhile, Chart 12 shows that the fed funds rate impulse is neither contracting nor weighing on relative share prices. Similarly, the bond market has already priced in two hikes in two years, warning that the relative share price ratio risk/reward tradeoff is slowly shifting to the overweight column. Chart 11Out Of The Ward
Out Of The Ward
Out Of The Ward
On the operating front, Big Pharma is investing anew with capex gone parabolic (bottom panel, Chart 13). The last time pharma capital outlays rose over 20%/annum was in the early 1990s! Chart 12There Is A Pulse
There Is A Pulse
There Is A Pulse
Chart 13Capex To The Rescue?
Capex To The Rescue?
Capex To The Rescue?
Industry shipments are climbing roughly at a double digit clip and pharma output is also expanding smartly, underscoring that soon industry productivity will also ascend, which is a boon for profits (Chart 14). Tack on the export relief valve pharma manufacturers are enjoying of late, and factors are falling into place for an earnings led rebound in pharma equities (second panel, Chart 14). Finally, the top panel of Chart 15 highlights that demand for pharmaceuticals in as upbeat as ever and has been significantly diverging from relative share prices. The implication is that this steep gulf will narrow via a catch up phase in the latter. Chart 14Glimmers Of Hope
Glimmers Of Hope
Glimmers Of Hope
Chart 15Upbeat Demand, But Deflation Is A Tough Pill To Swallow
Upbeat Demand, But Deflation Is A Tough Pill To Swallow
Upbeat Demand, But Deflation Is A Tough Pill To Swallow
Nevertheless, before getting outright bullish this heavyweight health care sub-group, there are two significant (and related) offsets. Industry pricing power is under attack and will remain in duress until it reaches a new equilibrium (middle panel, Chart 15). As a result, pharmaceutical profit margins have been in an almost uninterrupted multi year squeeze, warranting only a neutral allocation to Big Pharma manufacturers, until these dark profit clouds clear (bottom panel, Chart 15). Netting it all out, firming operating metrics, a capex upcycle, rock bottom valuations and deeply oversold conditions all signal that it no longer pays to be bearish Big Pharma. Upgrade to neutral, today. Bottom Line: Crystalize gains in the S&P pharma index of 12.6% since inception and lift exposure to neutral. We are also removing it from the high-conviction underweight list locking in gains of 10.3% since inception. The ticker symbols for the stocks in this index are: BLBG: S5PHARX– JNJ, PFE, MRK, LLY, BMY, ZTS, CTLT, VTRS, PRGO. Buy Biotech Stocks Against The Grain We recommend investors buy the budding recovery in biotech stocks, and today we are boosting the S&P biotech index to an above benchmark allocation. Rising interest rates have dampened demand for biotech stocks as these high growth stocks should command a lower multiple on the back of a rising discount rate (top panel, Chart 16). Add on waning US dollar liquidity and the relative underperformance phase gets explained away (bottom panel, Chart 16). However, there still remains a sizable gap between relative profits and relative share prices. If our four-pronged bullish thesis that we detail below pans out, then a catch up phase looms in crushed biotech stocks (Chart 17). Chart 16Bearish Story Well Documented
Bearish Story Well Documented
Bearish Story Well Documented
Chart 17Peculiarly Wide Gap
Peculiarly Wide Gap
Peculiarly Wide Gap
First, we posit that this highly fragmented industry is prime for consolidation. Even in the large cap S&P 500 biotech index there is scope for M&A activity. Not only intra-industry mergers, but also cash rich and drug pipeline extension thirsty Big Pharma is lurking in the shadows ready to deploy their cash hoard. Already, there is an ongoing mini M&A boom and given the recent biotech firms’ success stories in the race to discover the COVID-19 vaccine, they command a high profile in investment banking board rooms (Chart 18). Second, as long as the Fed remains committed to ZIRP and margin debt balances continue to balloon, some of this excess liquidity will flow toward biotech stocks that are more speculative than their safe-haven health care brethren. Historically, relative margin debt balances and relative share prices have been joined at the hip, and the message from spiking margin debt uptake is to expect a similar rebound in biotech equities (Chart 19). Chart 18M&A Boom Is Bullish
M&A Boom Is Bullish
M&A Boom Is Bullish
Chart 19Speculative Excesses Go Hand-In-Hand With Biotech Stocks
Speculative Excesses Go Hand-In-Hand With Biotech Stocks
Speculative Excesses Go Hand-In-Hand With Biotech Stocks
Third, the sell side has thrown in the towel on the prospects of the S&P biotech index. Relative sales growth expectations are negative, relative 12-month and five-year forward growth numbers are sinking like a stone and probing all-time lows (Chart 20). All this analyst pessimism is gaining steam at a time when the S&P biotech dividend yield is 2.5%, roughly 100bps higher than the 10-year US Treasury yield and 125bps higher than the SPX dividend yield (bottom panel, Chart 20). Finally, not only the relatively large dividend yield gap signals that biotech stocks are cheap, but on a forward P/E basis the S&P biotech index trades at a whopping 50% discount to the SPX (fourth panel, Chart 20). Our Valuation Indicator has collapsed to levels that have marked prior bull phases going back 25 years and similarly technicals are as downbeat as ever (Chart 21). Chart 20Low Threshold To Overcome
Low Threshold To Overcome
Low Threshold To Overcome
Chart 21Cheap And Oversold
Cheap And Oversold
Cheap And Oversold
In sum, a looming M&A boom, excess liquidity leaking into biotech stocks, extremely pessimistic Wall Street analysts’ forecasts and severe undervaluation, all signal that now is the time to go against the grain and overweight biotech equities. Bottom Line: Lift the S&P biotech index to overweight, today. This upgrade along with the S&P pharma upshift to neutral also lift the S&P health care sector to overweight. The ticker symbols for the stocks in this index are: BLBG: S5BIOTX– AMGN, ABBV, GILD, VRTX, REGN, ALXN, BIIB, INCY. Anastasios Avgeriou US Equity Strategist anastasios@bcaresearch.com Current Recommendations Current Trades Strategic (10-Year) Trade Recommendations
Overdose?
Overdose?
Size And Style Views February 24, 2021 Stay neutral cyclicals over defensives January 12, 2021 Stay neutral small over large caps June 11, 2018 Long the BCA Millennial basket The ticker symbols are: (AAPL, AMZN, UBER, HD, LEN, MSFT, NFLX, SPOT, ABNB, V). January 22, 2018 Favor value over growth