Equities
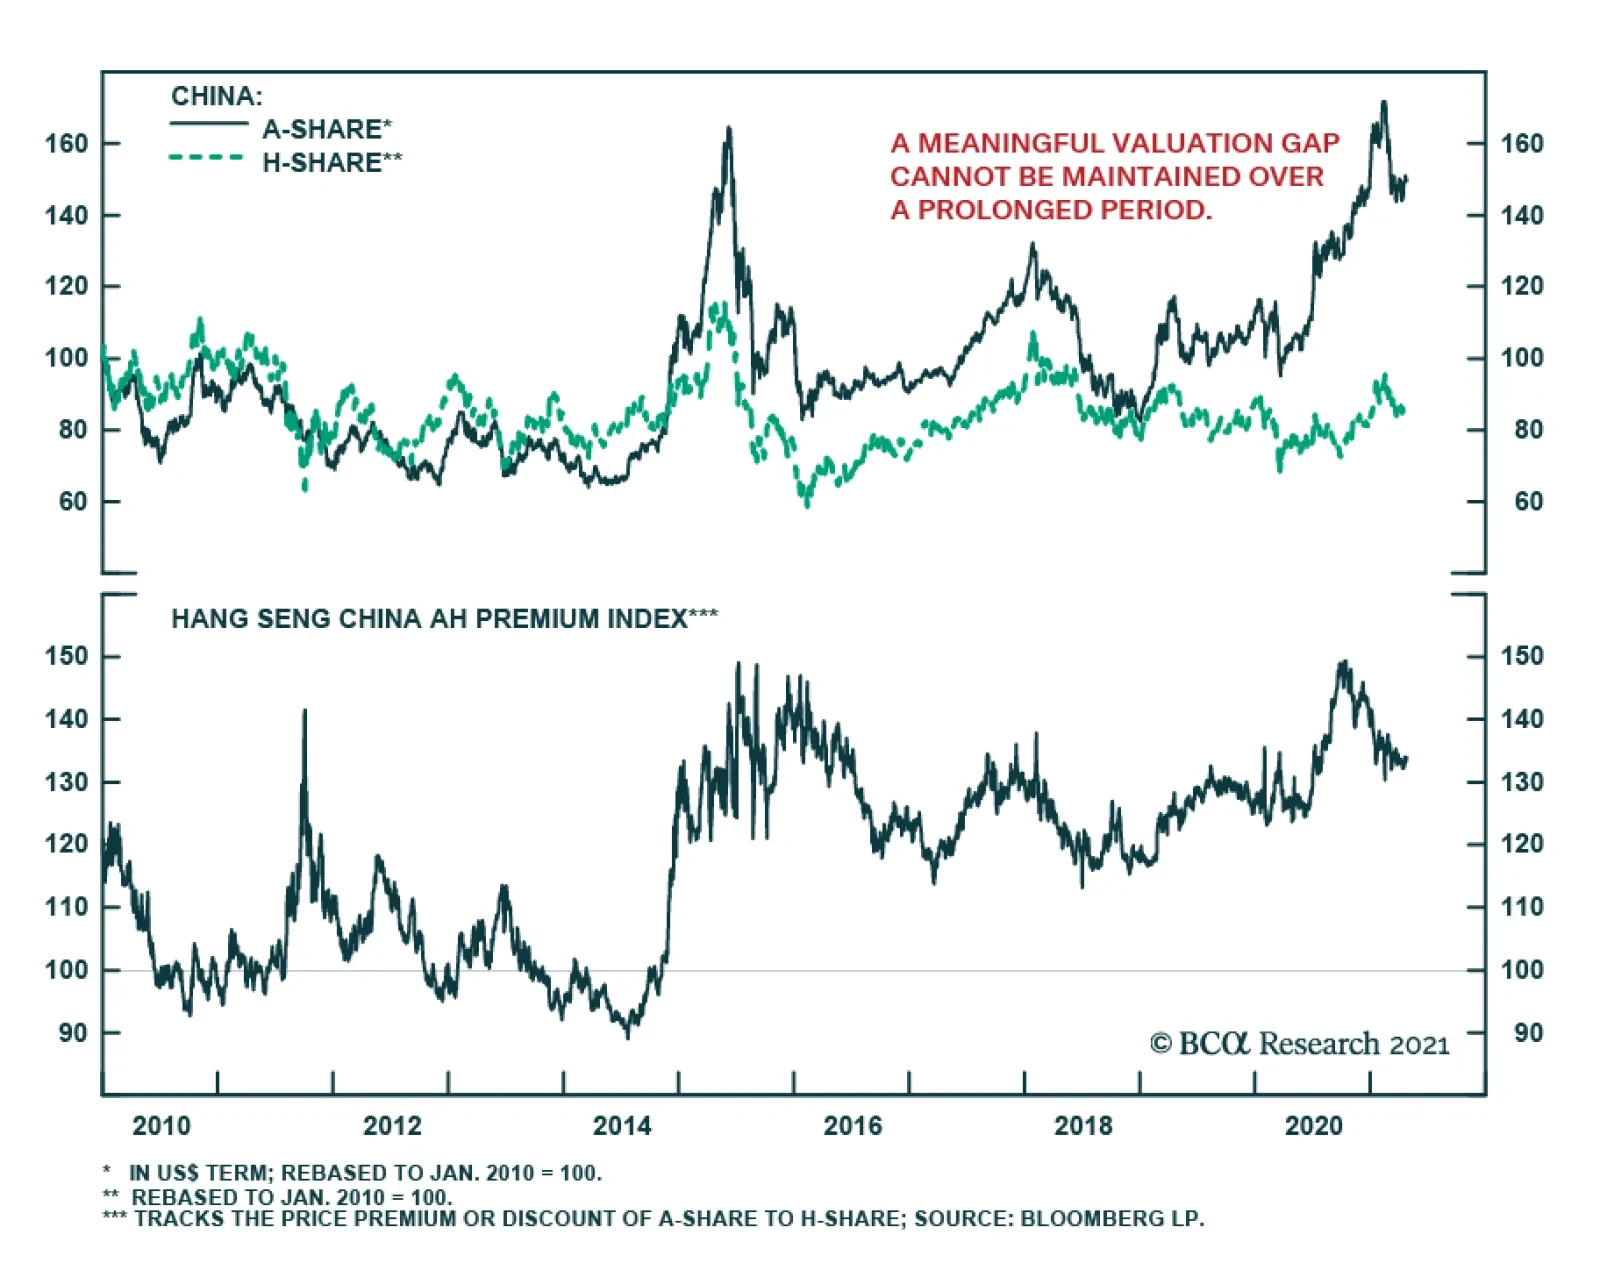
China's H-share market lagged its A-share counterpart in most of 2019 and 2020. While A shares benefited more directly from China’s domestic liquidity and monetary easing in the past two years, H-shares were hammered by political turmoil in Hong Kong (SAR)…

Highlights Clients countered our opinion that China’s economy has reached its cyclical peak. However, we have already incorporated the supporting facts into our analysis so they will not alter our cyclical outlook for the economy. The favorable external backdrop is a potential downside risk to China’s domestic economy, because the country’s pain threshold for reform is often positively correlated with global growth. We agree that an acceleration in local governments’ special-purpose bond issuance could boost infrastructure investment in the next six months, but we are skeptical about the magnitude of such support. China’s onshore and offshore stock markets remain firmly in a risk-off mode. For now, we recommend investors stay on the sidelines until some of the early indicators turn more bullish. Feature We spent the past week hosting virtual meetings with BCA’s clients in Europe and Asia. We presented our view that China’s economic recovery has likely peaked and escalating risks of a policy overtightening warrant an underweight position on Chinese stocks for the next six months. Most clients shared our concern that policymakers may keep financial and industry regulations more restrictive than the market is currently pricing in, leading to more downside surprises to risk asset prices. Clients also brought up a few opposing views which challenged our analytical framework. In this and next week’s reports we will highlight some of the counterpoints we discussed in these meetings. Interestingly, most of our clients - even ones who are more sanguine about China’s economic outlook - prefer to wait on the sidelines before jumping back into China’s equity market. They foresee sustained volatility in the coming months as the market continues to struggle between digesting high valuations and adjusting expectations for future earnings growth. Has China’s Economic Recovery Reached An Apex? The primary discussion centered around whether the strength in China’s economy has reached a cyclical peak. Q1 GDP points to slower sequential economic momentum from Q4 last year (Chart 1). Some of the high-frequency economic data also indicate that economic activity peaked in Q4 last year (Chart 2). Chart 1Q1 Sequential Growth Was The Slowest In A Decade
Q1 Sequential Growth Was The Slowest In A Decade
Q1 Sequential Growth Was The Slowest In A Decade
Chart 2Has Economic Activity Peaked?
Has Economic Activity Peaked?
Has Economic Activity Peaked?
Chart 3Our Framework Suggests A Slower Growth Momentum Ahead
Our Framework Suggests A Slower Growth Momentum Ahead
Our Framework Suggests A Slower Growth Momentum Ahead
The view fits perfectly into our analytical framework, which has worked well in the past decade. Historically, China’s credit formation has consistently led economic activity by about six to nine months. A turning point in the credit impulse occurred last October, which suggests that economic activity should start to slow in Q2 this year (Chart 3). However, our clients countered with the following arguments, which support a notion that sequential economic growth rate can still trend higher in the next six months: Aggregate demand in Europe and the US continues to improve, while the COVID-19 resurgence in major emerging economies, such as India and Brazil, has forced their production recoveries to pause. Thus, China’s exports will remain robust and should continue to make substantial contributions to the economy (Chart 4). Infrastructure spending could get a meaningful boost when local governments speed up issuing special-purpose bonds (SPB) in Q2 and Q3. Infrastructure investment growth was relatively weak in Q1, probably the result of a slower pace in credit growth and government expenditures (Chart 5). However, a delay in local government SPB issuance in Q1 this year means more support for infrastructure investment in the rest of the year (Chart 6). Chart 4Counterpoint #1: Chinese Exports Will Stay Strong
Counterpoint #1: Chinese Exports Will Stay Strong
Counterpoint #1: Chinese Exports Will Stay Strong
Chart 5Slower Credit Growth Led To A Subdued Q1 Infrastructure Investment Growth
Slower Credit Growth Led To A Subdued Q1 Infrastructure Investment Growth
Slower Credit Growth Led To A Subdued Q1 Infrastructure Investment Growth
Travel restrictions imposed during the Chinese New Year weighed heavily on the service sector in Q1 (Chart 7). If China’s domestic COVID-19 cases remain well controlled, then the trend could reverse and the pent-up demand for service consumption may usher in a significant improvement in Q2 when three major public holidays occur. The service sector accounts for more than half of China’s GDP, therefore, an improvement in this sector should significantly bolster future GDP growth. Chart 6Counterpoint #2: More LG SPBs, More Spending On Infrastructure
Opposing Views From Client Meetings (Part 1)
Opposing Views From Client Meetings (Part 1)
Chart 7Counterpoint #3: Service Sector Activities Will Pick Up
Counterpoint #3: Service Sector Activities Will Pick Up
Counterpoint #3: Service Sector Activities Will Pick Up
Our Analytical Framework The viewpoints expressed by clients have not changed our cyclical view of China’s economy, since our broad analysis of Chinese business cycle already incorporates the main points that clients raised. Additionally, data such as GDP growth figures are coincident and lagging indicators, and do not explain the direction of forward-looking financial markets. The authorities will shift their policy trajectories only if the data significantly deviate from expectations. We view Q1 GDP and underlying data broadly in line with Chinese leadership’s short- and medium-term economic growth targets and, therefore, will not lead to any policy adjustment. Chart 8If Demand For Chinese Exports Stays Strong, Reform Efforts Will Intensify
Opposing Views From Client Meetings (Part 1)
Opposing Views From Client Meetings (Part 1)
To our clients’ point that strong exports ahead will support China’s overall GDP growth, we regard a favorable external backdrop as a potential downside risk to the domestic economy. The willingness of Chinese authorities to pursue painful reforms is often positively correlated with global growth (Chart 8). BCA has written extensively about how China has taken advantage of a stronger export sector by increasing the pace of domestic reforms and in the past has embarked on a multi-year reform plan that weighed on growth. At the beginning of this year, Chinese policymakers were set out to “keep credit growth in line with nominal GDP growth in 2021.” Nonetheless, policymakers’ targets for credit and nominal GDP growth rates could change during the year, contingent on their perception of the broad growth outlook and unemployment. Chart 9Both Credit And Economic Growth Rates Are Moving Targets And Subject To Policy Finetuning
Both Credit And Economic Growth Rates Are Moving Targets And Subject To Policy Finetuning
Both Credit And Economic Growth Rates Are Moving Targets And Subject To Policy Finetuning
Even if policymakers keep the country’s leverage ratio steady in 2021, which is our base case view and assuming China’s nominal GDP grows by 11%, then the credit impulse (measured by the 12-month difference in total social financing as a percentage of GDP) will likely fall to about 28% of GDP, down from 32% of GDP in 2020 (Chart 9). The rate of credit formation increased by 13.6% in the first three months from Q1 last year, above government’s target. We expect a further pullback in credit growth in the rest of the year, to bring the annual pace at or below 12%. Construction capex, which is sensitive to both credit creation and tightening regulations in the housing sector, will likely experience a slowdown. At more than 90% of GDP, China’s economy is mainly driven by domestic demand and a weakening in the domestic economy can more than offset positive contributions from a robust export sector. Infrastructure And Services We expect infrastructure investment will grow by 4-5% this year, which is in line with its rate of expansion in 2020. However, the sequential growth in the sector in Q2 – Q4 this year will be slower than during the same period in 2020 (Chart 10). We agree that a more concentrated issuance of local government SPBs in Q2 and Q3 could help to buttress infrastructure investment. However, SPBs made up only about 15% of overall infrastructure spending in the past three years, so we are dubious that SPBs can provide the crucial support. The rest of the gap for local governments to finance their spending on infrastructure projects will need to be filled through public-private partnerships (PPP) financing, government-managed funds’ (GMFs) revenues, government budgets and bank loans. Note that only non-household medium- and long-term (MLT) bank lending showed a positive impulse so far (Chart 11). While not all of MLT loans are used for infrastructure, they have a positive correlation with investments in infrastructure projects which are generally long term in nature. Chart 10Sequential Growth In Infrastructure Investment Will Be Slower Than In Q2 – Q4 Last Year
Opposing Views From Client Meetings (Part 1)
Opposing Views From Client Meetings (Part 1)
Chart 11MLT Bank Loans Have Been Supportive To Infrastructure Spending...
MLT Bank Loans Have Been Supportive To Infrastructure Spending...
MLT Bank Loans Have Been Supportive To Infrastructure Spending...
On the other hand, the contribution of PPPs to total infrastructure spending has been plunging in recent years due to tighter regulations aimed at controlling increased risks related to local government debt (Chart 12). Depressed revenues from land sales and extended corporate tax cuts this year will also curb the ability of local governments to finance infrastructure projects (Chart 13). Chart 12...But Public-Private Partnerships Have Become Too Small To Fill The Financing Gap
...But Public-Private Partnerships Have Become Too Small To Fill The Financing Gap
...But Public-Private Partnerships Have Become Too Small To Fill The Financing Gap
Chart 13Government-Managed Funds Also Face Headwinds From Falling Land Sales
Government-Managed Funds Also Face Headwinds From Falling Land Sales
Government-Managed Funds Also Face Headwinds From Falling Land Sales
Finally, although the service sector accounts for 54% of China’s GDP (2019 statistic), transport, retail and accommodation, which were hardest hit by COVID-19, accounted for less than 30% of China’s tertiary GDP. This compares with a slightly larger share of tertiary GDP from finance- and housing-related sectors (financial intermediation, leasing & business services, and real estate) –the sectors that have been thriving since the second half of last year when both the equity and housing markets boomed (Chart 14). Nonetheless, it is unreasonable to expect these areas to strengthen even more in an environment where the policy has shifted to contain risks in the financial and housing arenas. The net result to tertiary GDP growth is that the deterioration in finance- and real estate-related segments will likely offset an improvement in transport, retail and accommodation. Chart 14More Than 70% Of China’s Services Sector Is Finance And Real Estate Related
Opposing Views From Client Meetings (Part 1)
Opposing Views From Client Meetings (Part 1)
Investment Conclusions The ultimate question we got from almost every client meeting was: What would make us turn bullish on Chinese stocks in the next 6 to 12 months? Chart 15Changes In Domestic Policy Dominate Chinese Stock Performance
Changes In Domestic Policy Dominate Chinese Stock Performance
Changes In Domestic Policy Dominate Chinese Stock Performance
Since most monthly and quarterly economic data do not provide enough market-moving catalysts, we rely on our assessment of the changes in policy direction, such as interbank liquidity conditions and excess reserves, in addition to overall credit growth (Chart 15). We will also continue to watch for the following signs before upgrading our tactical and cyclical calls from underweight to overweight: Chart 16 shows that cyclical stocks remain depressed relative to defensives in both onshore and offshore markets, underscoring investors’ concerns about China’s economy. A breakout in cyclicals versus defensives would signify a major improvement in investor sentiment towards policy support and economic growth. A technical breakdown in the performance of healthcare and utility stocks relative to investable stocks would be another bullish indicator (Chart 17). These equities have historically led China’s economic activity, core inflation and stock prices by one to three months. A technical breakdown in the relative performance of these sectors would signify that market participants anticipate a meaningful economic upturn in China. Chart 16Waiting For A Telltale Sign...
Waiting For A Telltale Sign...
Waiting For A Telltale Sign...
Chart 17...Before Upgrading Chinese Stocks
...Before Upgrading Chinese Stocks
...Before Upgrading Chinese Stocks
Given that the above mentioned indicators remain firmly in a risk-off mode, we maintain our view that China’s economy has reached its peak, and policy has tightened meaningfully. Our cyclical underweight position on Chinese stocks, in both absolute terms and within a global portfolio, is warranted. Jing Sima China Strategist jings@bcaresearch.com Cyclical Investment Stance Equity Sector Recommendations
Stock market margin debt charts have been making the rounds on the sell-side’s research and popping in the blogosphere and social media platforms. Some pundits showed margin debt as a nine-month rate of change and others as a year-over-year percentage change. Correcting for this FINRA margin debt balance, we (and others) have shown it as a percentage of GDP, and all these iterations highlight that margin debt has gone parabolic. Our long held view remains that margin debt uptake is a coincident stock market indicator and has little to no leading properties, neither at tops nor at bottoms. However, correcting margin debt balances versus the stock market capitalization makes the most sense to us. Our data set goes back to the 1930s and the latest tick up in relative margin debt balances is just that a tick up. The chart shows that it hovers near the historical mean, and while it is picking up momentum it is nowhere near previous excesses especially the two most recent ones during the dotcom bubble and the GFC. Crudely put, in momentum terms, the rate of relative growth will have to more than double from the current print, and in level terms margin debt as a percentage of market capitalization will have to jump to near 2.5% (from 2% currently) before it is in clear overshoot territory (top panel). Bottom Line: While some near-term caution is warranted on the prospects of the broad equity market that remains fully valued, margin debt is not yet at levels that have marked previous danger zones. China’s looming slowdown, and the Fed’s taper are the two key macro risks we continue to closely monitor.
Setting The Record Straight On Margin Debt
Setting The Record Straight On Margin Debt
BCA Research’s US Equity Strategy & US Political Strategy service reiterate their recommendations in favor of the BCA Infrastructure Basket and the Biden Fiscal Advantage Equity Basket. President Joe Biden’s $2.3 trillion American Jobs Plan is shifting…
Chinese stocks were the worst performing among major global equity benchmarks on Monday. The CSI 300 dipped 1.13%, while the S&P 500 and Eurostoxx 50 gained 0.18% and 0.22%, respectively. An investigation into Meituan’s monopolistic practices triggered…
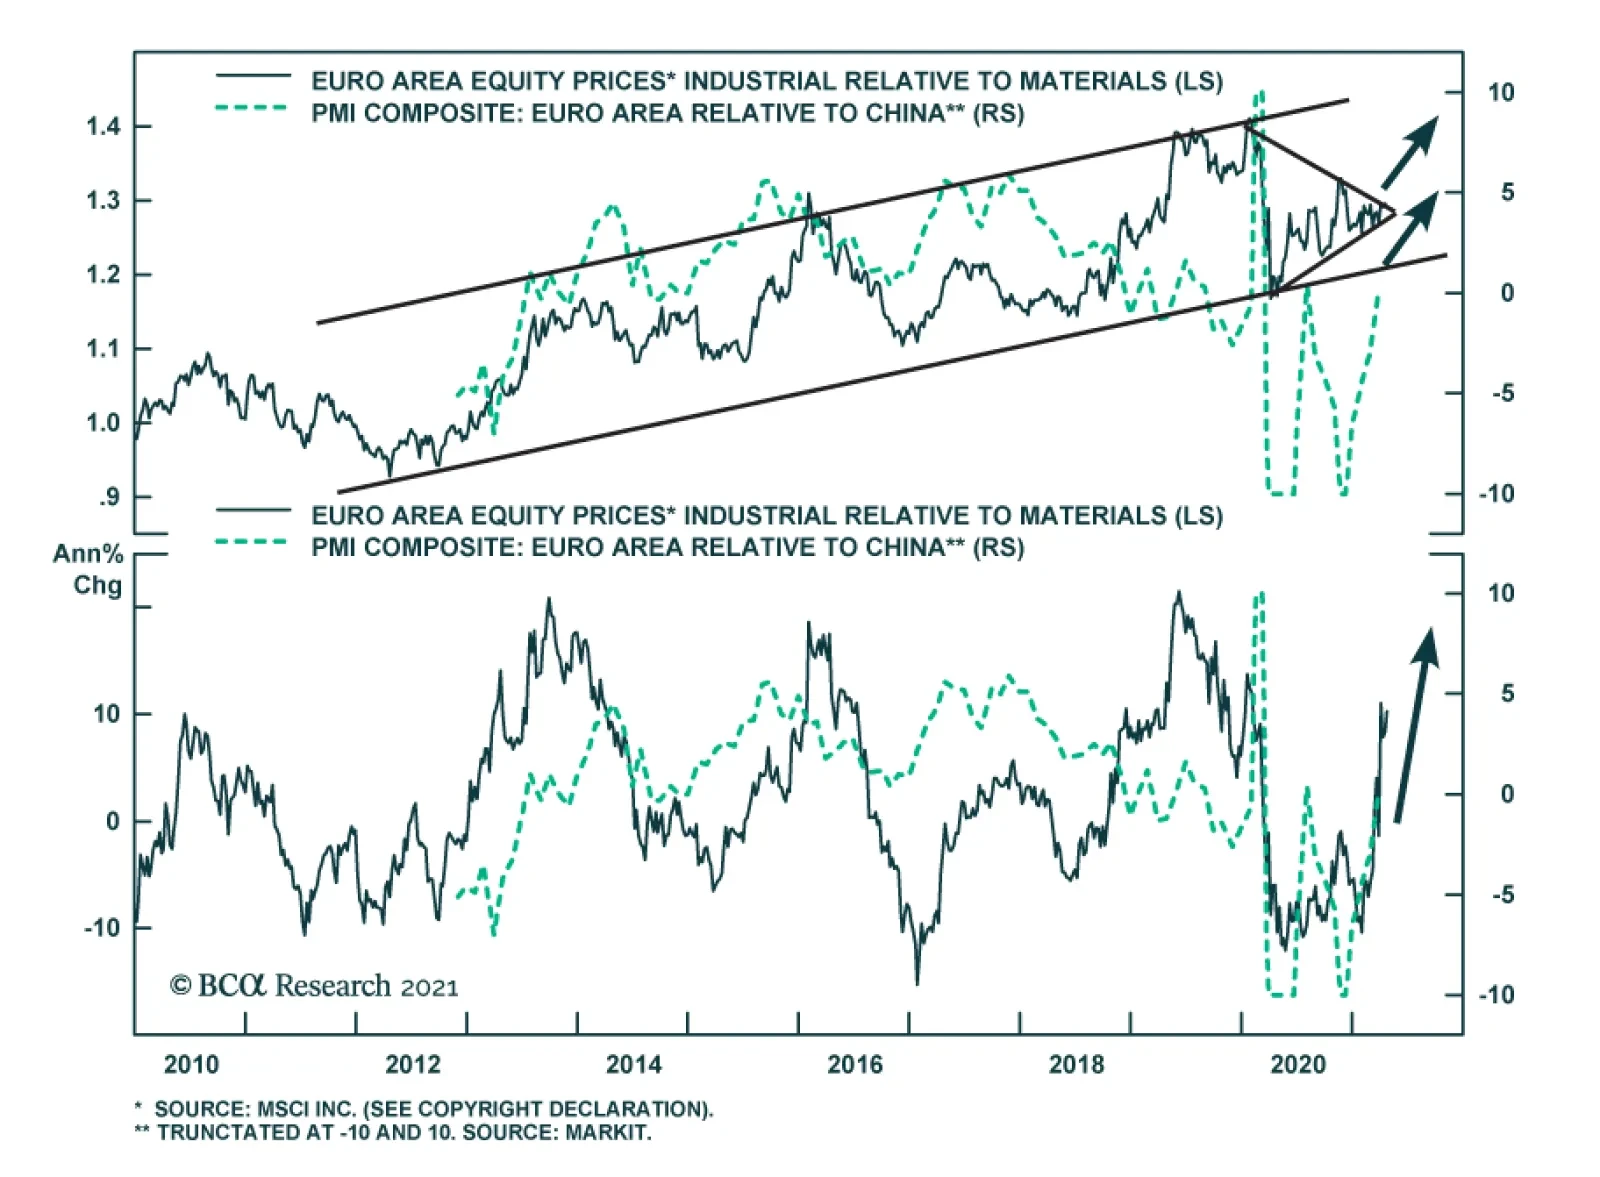
European industrial equities have further scope to outperform materials over the remainder of 2021. Despite an 11% outperformance since the second quarter of 2020, the ratio of industrials-to-materials equities still stands almost 8% below its pre-COVID-19…
Highlights President Biden’s proposal to raise the capital gains tax rate from 20% to 43.4% is part of the American Families Plan, which at best has a 50% chance of passing before the 2022 midterm election. Biden will soon present the full outline of this $1 trillion bill. The legislative priority is the American Jobs Plan with infrastructure spending and corporate tax hikes. This bill has an 80% chance of passing by Christmas. If it passes by end of July, then the odds of passing the American Families Plan prior to the midterm will shoot up. But we expect it to take to November, which could render the families plan (and capital gains tax) a campaign issue for 2022. Republicans are much more likely to vote for infrastructure spending than tax hikes. Traditional infrastructure can be separated into a bipartisan bill with Republicans and passed along with a renewed highway authorization by September. This creates an alternate avenue for infrastructure. Democrats would still pass the rest of Biden’s American Jobs Plan via reconciliation, including corporate tax hikes, which will only be watered down a bit. We reiterate our recommendations in favor of the BCA Infrastructure Basket and the Biden Fiscal Advantage Equity Basket. Given the eight-year span of the US infrastructure proposals, we recommend a cyclical and structural overweight for these baskets. Feature President Joe Biden’s $2.3 trillion American Jobs Plan is shifting from the initial phase – “coordinated policy rollout” and media cheerleading – to the drawn-out process of congressional negotiation and voting. None of our core views on the bill have changed: we expect the bill to pass before the end of the year and to be similar to what Biden has proposed on both corporate tax hikes and spending. Some spending proposals can be offloaded, some tax hikes can be watered down, but the gist of the bill is known to investors. Scares over Biden’s proposed capital gains tax hike are premature as this bill must pass before Congress can turn to Biden’s second plan and individual tax hikes. In this special report with BCA’s US Equity Strategy, we update the status of the bill and then take a closer look at our BCA Infrastructure Basket. We recommend investors stick to this trade over a structural time horizon of 12 months-plus. Biden’s Bill Will Pass – Bipartisanship Is Possible But Separate Biden’s infrastructure plan will pass on a party-line vote through budget reconciliation. Republicans will reject tax increases; Democrats will muster all 50 of their caucus votes plus Vice President Kamala Harris. Procedurally, reconciliation has been cleared. The fiscal 2021 budget resolution will be revised and this will enable Democratic leaders to cram the infrastructure package into a new reconciliation bill, ostensibly to raise the debt ceiling, which is due to expire on July 31. Technical public debt default will loom in early fall to help the Democrats motivate stragglers to vote for the bill.1 Spending Compromises: The reconciliation process will keep the price tag of the bill from rising higher than the proposed $2.3 trillion, since it will mostly exclude “earmarks.” States will have to apply in a competitive bidding for funding for projects beginning sometime in 2022 rather than receive guarantees of special projects in exchange for their senator’s vote for the overall package. The headline price tag could be whittled down by about $1 trillion if a bipartisan deal is done. Biden’s proposal consists of $784 billion in traditional infrastructure, $647 billion in social welfare, $370 billion in green energy initiatives, $280 billion in tech initiatives, and $219 billion in business support (Chart 1). The Republicans might be willing to agree to most of the traditional infrastructure as well as some of the tech initiatives and business support (Chart 2). This means these measures could be removed from the bill and passed separately. This would leave the Democrats to pass the rest on their own, including corporate tax hikes, which they could do at earliest by the end of July and at latest by the end of December (Diagram 1). Or Democrats could pass the whole package alone. Chart 1American Jobs Plan Has $784Bn In Traditional Infrastructure
A Closer Look At Our Infrastructure Basket
A Closer Look At Our Infrastructure Basket
Chart 2Republicans Support Roads And Bridges
A Closer Look At Our Infrastructure Basket
A Closer Look At Our Infrastructure Basket
Diagram 1Timeline For Congress To Pass American Jobs Plan By End Of 2021
A Closer Look At Our Infrastructure Basket
A Closer Look At Our Infrastructure Basket
Tax Compromises: Much has been made of West Virginia Senator Joe Manchin’s claim that the corporate tax rate should not exceed 25%, as opposed to Biden’s preferred 28%. Manchin is not alone, however. Table 1 highlights other Senate Democrats who oppose a 28% rate. These decisive swing voters may get a reduction in the rate but we tend to doubt it will be modified much from the proposal. Corporate tax hikes are popular – including when presented as a responsible way to pay for infrastructure (Chart 3). A minimum corporate tax will play very well politically while the headline corporate rate can be toggled one or two percentage points to ensure the bill gets enough votes (Chart 4). Chart 3Independents Support Corporate Taxes For Infrastructure
A Closer Look At Our Infrastructure Basket
A Closer Look At Our Infrastructure Basket
Chart 4Voters Favor Corporate Tax Hike And Minimum Tax
A Closer Look At Our Infrastructure Basket
A Closer Look At Our Infrastructure Basket
Table 1Centrist Senators: Democrats Who Oppose A 28% Corporate Rate, Republicans Who Voted To Convict Trump Of Insurrection, And Others
A Closer Look At Our Infrastructure Basket
A Closer Look At Our Infrastructure Basket
Bipartisan infrastructure spending is possible but separate. Republicans are at risk of getting steamrolled by Democrats in the coming years. Democrats have stolen back the lead on infrastructure, manufacturing, trade, and China, yet they are free of the taint of mishandling the pandemic. Most importantly they have gotten hold of the magic money tree (Modern Monetary Theory), which enables them to expand the social safety net in a historic way that could boost the fortunes of their own party and its underlying principle of Big Government for a decade or more. Thus the pressure will be high on Republicans to show that they can govern and compromise – and infrastructure is the policy on which it is least painful for the GOP to join them. Republicans could hive off traditional “roads and bridges” – as well as tech competition with China – into a separate bill that could go forward on a bipartisan basis. There is a separate opportunity to pass infrastructure spending because the federal highway funding authorization, the 2015 FAST Act, expires on September 30 (Chart 5). The need to reauthorize this law will force lawmakers to act, thus presenting an opportunity to top up funding for traditional infrastructure projects.2 But this merely highlights that infrastructure spending has multiple avenues. If partisanship prevails as usual then Democrats will drive through their bill anyway. Chart 5US Infrastructure Spending In Recent Decades
A Closer Look At Our Infrastructure Basket
A Closer Look At Our Infrastructure Basket
The regular budget process will be gridlocked. The regular appropriations process for FY2022 will not be an avenue for increased spending. Limits on discretionary spending expire at the end of FY2021 so there are no limits on budget appropriations. But 60 votes are needed for appropriations. Republicans will be loath to assist Democrats on the normal budget while the latter achieve all their other priorities via reconciliation. The economy will not need extra spending. A continuing resolution – a stopgap measure that keeps appropriations at the same level as the previous year – is the likeliest outcome. Or a government shutdown, which might be useful for Republicans to rally their base after a demoralizing year, though it would hurt their standing among the general public. Biden’s $1 trillion American Families Plan will be presented on April 28. This bill could pass in H1 2022, if the American Jobs Plan passes by July, but it is just as likely to become the Democrats’ campaign platform for the 2022 midterms. This bill will require the House and Senate to draft a FY2022 concurrent resolution, which cannot be finalized prior to passing the FY2021 reconciliation bill for both parliamentary and budgetary reasons. The economy will be red hot and fiscal fatigue will be setting in. We stick with our subjective 50/50 odds of passage for this bill. This means that the market’s concern over the capital gains rate hike is premature. First, Democrats have been back-loading tax hikes to prioritize economic recovery – and minimize negative impacts prior to the midterm election – so there is no reason to expect the capital gains tax hike to be retroactive whenever the American Families Plan passes Congress. If Congress passes it in mid-2022 then it will most likely go into effect on January 1, 2023. Second, the capital gains rate itself will likely be watered down from Biden’s proposed 43.4% to something around 32%. The good news for investors is that Biden is proposing to keep the distinction between individual income and capital gains (thus preserving the “carried interest loophole”). The bad news is that he is also keeping the Obamacare surtax of 3.8% on capital gains for those making over $250,000 or more. The American Families Plan is not urgent for investors because it is less likely to pass than the American Jobs Plan – and Republicans could win the House in 2022. But if the latter passes by July then the odds of the former passing before the midterm will shoot up. The family plan also shows that there is an upside risk to the budget deficit outlook and inflation expectations (Chart 6). Chart 6Revised US Budget Deficit Projection Post-ARPA
A Closer Look At Our Infrastructure Basket
A Closer Look At Our Infrastructure Basket
Investment Implications Of Biden’s Sweeping Infrastructure Package While both the CBO and IMF currently project that the fiscal impulse will turn negative in 2022 (a mid-term election year) following a modest decrease this year, government largesse has staying power (Chart 7). Chart 7Fiscal Easing…
Fiscal Easing…
Fiscal Easing…
The populist shift in US politics will push government expenditures as a share of output to nose-bleed levels. Given the lack of adequate tax offsets, it will buttress government debt-to-GDP to levels last seen during WWII (Chart 8). True, debt sustainability largely depends on nominal GDP growth, but spendthrift politicians are unconcerned about paying back debt as interest rates are held low courtesy of an extremely accommodative Federal Reserve and (temporarily) well-behaved bond vigilantes. This is all welcome news for equities exposed to fiscal spending in general and for infrastructure-reliant shares in particular. Two weeks ago we matched different segments of Biden’s infrastructure proposal (Tables A1 and A2 in the Appendix) to eight ETFs and one stock that now comprise our Biden Fiscal Advantage equity basket (Chart 9).3 Today we reiterate our sanguine view on this basket – especially versus the NASDAQ 100, given the high concentration of tech stocks in these ETFs. Chart 8...And Debt Uptake Bode Well For Infrastructure Stocks
...And Debt Uptake Bode Well For Infrastructure Stocks
...And Debt Uptake Bode Well For Infrastructure Stocks
Chart 9Stick With The Biden Fiscal Advantage Basket
Stick With The Biden Fiscal Advantage Basket
Stick With The Biden Fiscal Advantage Basket
Importantly, Charts 7 & 8 highlight that a rising fiscal deficit and ballooning government debt are a boon for the BCA’s infrastructure stock basket both from a cyclical and structural perspective.4 Tack on the Fed’s 6.5% real GDP growth projections for calendar 2021 that are more or less in line with the Street’s economic expectations and even the shorter-term outlook brightens for these infrastructure-laden equities (real GDP forecast shown advanced, Chart 10). Chart 10Enticing Domestic Growth
Enticing Domestic Growth
Enticing Domestic Growth
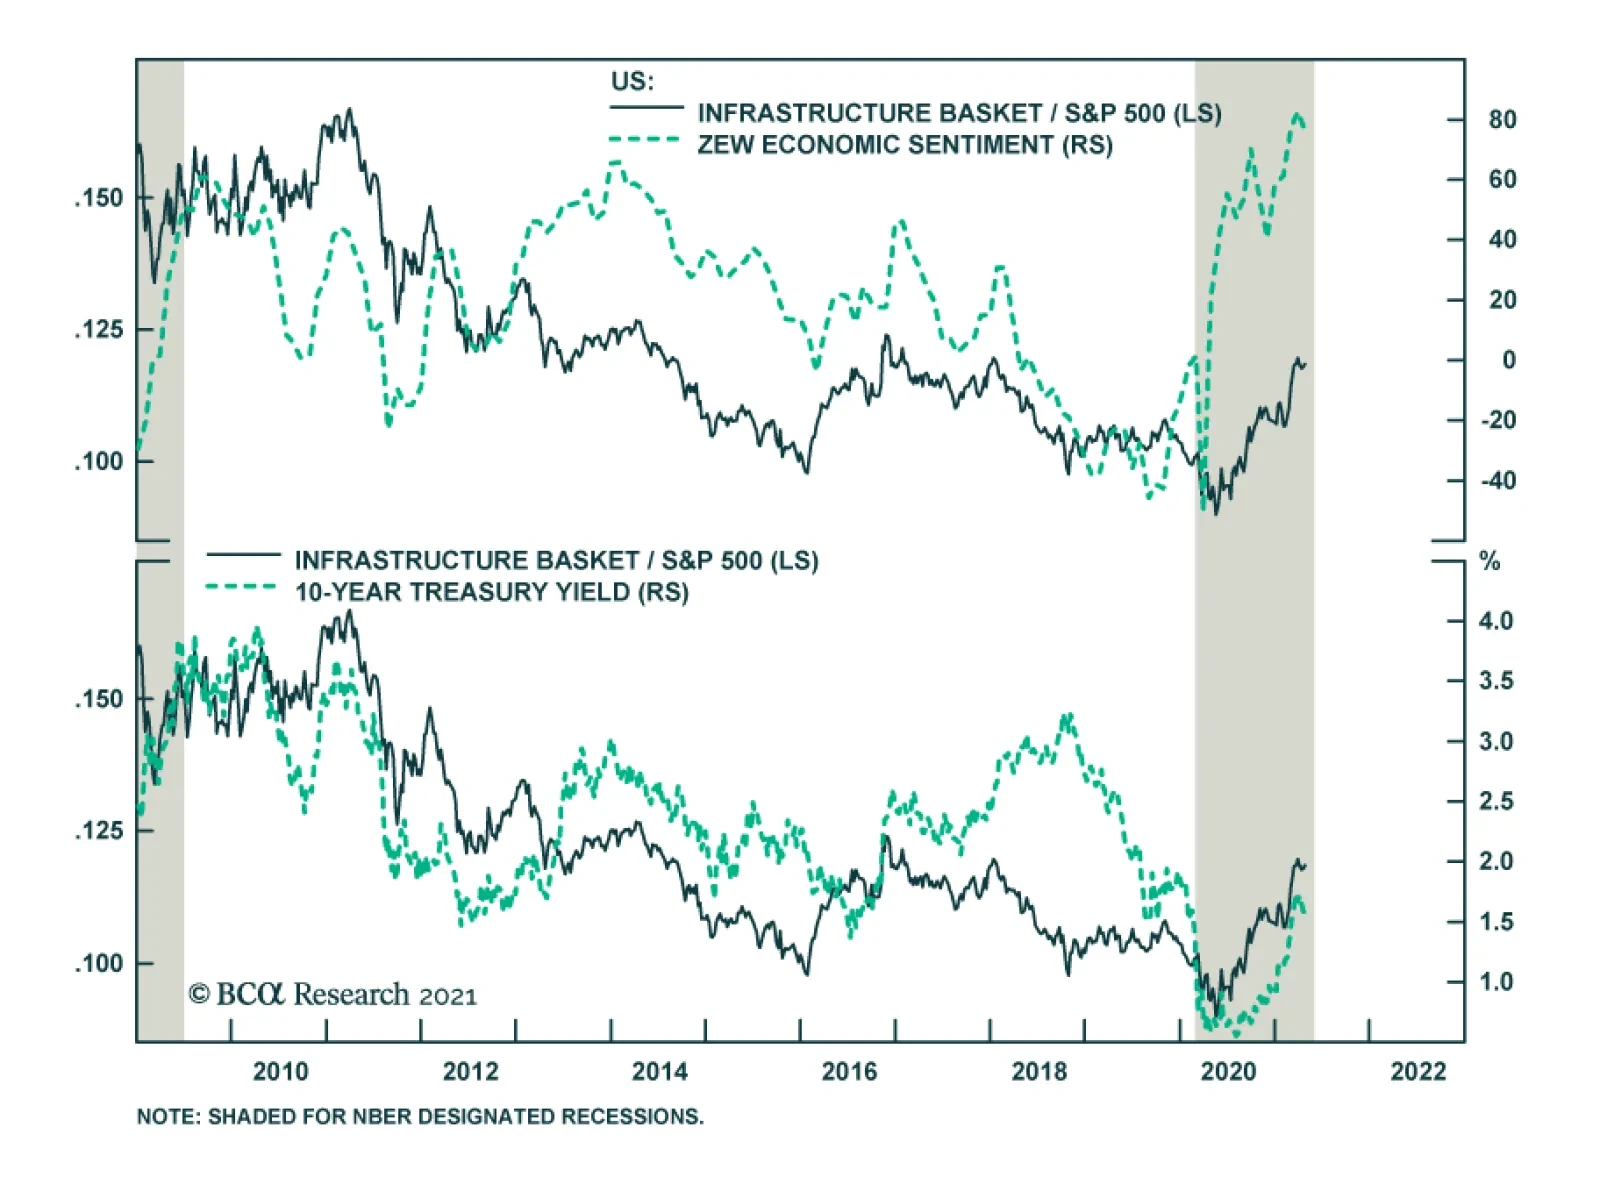
Already, the US ZEW Indicator of Economic Sentiment is soaring following up the path of the ISM manufacturing survey, corroborating that the US economy is firing on all cylinders (top panel, Chart 11). While the recent bond market selloff has gone on hiatus, it will likely prove short-lived. The US population is on track to reach herd immunity sometime this fall and by then inflation will be rearing its ugly head (bottom panel, Chart 11). As a result, the 10-year US Treasury yield should resume its ascent (middle panel, Chart 11). Chart 11Plenty Of Upside Left
Plenty Of Upside Left
Plenty Of Upside Left
Historically, all these key macro indicators have been positively correlated with the relative share price ratio of BCA’s infrastructure equity basket and the current message is positive (Chart 11). Beyond the conducive domestic backdrop, likely in the back half of the year the rest of the world will also be on the cusp of getting back to normal – with China’s pace of deceleration being the sole question mark – heralding a synchronized global growth setting. Not only will the US twin deficits weigh on the greenback, but a looming commodity up-cycle is also a boon for hypersensitive commodity-exposed currencies. This dual boost coupled with the budding rebound in EMs is music to the ears of US infrastructure-reliant US conglomerates (Chart 12). Gelling everything together, our US and global capex indicators do an excellent job in encapsulating all of these moving parts. Chart 13 shows that both of our capital expenditure indicators are in V-shaped recoveries, with our global capex one probing multi-decade highs. Chart 12Alluring EM Growth
Alluring EM Growth
Alluring EM Growth
Chart 13Heed The Bullish Message From Our Capex Indicators
Heed The Bullish Message From Our Capex Indicators
Heed The Bullish Message From Our Capex Indicators
Bottom Line: The sweeping American Jobs Plan will bolster both the BCA infrastructure and BCA Biden Fiscal Advantage equity baskets. Given the multi-year span of this looming bill, we recommend a cyclical and structural overweight in both baskets. Matt Gertken Vice President Geopolitical Strategy mattg@bcaresearch.com Anastasios Avgeriou US Equity Strategist anastasios@bcaresearch.com Appendix Table A1
A Closer Look At Our Infrastructure Basket
A Closer Look At Our Infrastructure Basket
Table A2
A Closer Look At Our Infrastructure Basket
A Closer Look At Our Infrastructure Basket
Footnotes 1 Paul M. Krawzak, “More questions than answers in parliamentarian’s budget opinion,” Roll Call, April 8, 2021, www.rollcall.com. 2 Jinjoo Lee, “Road Is Smoother Than Expected For Infrastructure, Biden Plan Or Not,” Wall Street Journal, March 24, 2021, wsj.com. 3 As a reminder, the ticker symbols we included in this Equity Basket are: PAVE, PHO, QCLN, TAN, WOOD, SOXX, HAIL, GRID and SU. We choose SU as there is no pure play Canadian oil sands ETF trading in USD. 4 We first created this basket in late-2018 comprising a range of industrials and materials indexes that should see a positive reaction to a spur in infrastructure demand; Table A2 in the Appendix at the end of this report updates all the constituents in our basket.
Highlights The sheer magnitude of US fiscal stimulus makes forecasting especially challenging, … : It is very hard to say how unprecedented stimulus will impact the economy. … and it may already have scrambled established equity market patterns: Give a bored millennial a smartphone, a brokerage account app, commission-free trades and regular infusions of cash and you just might get a bear market bounce unlike any that’s ever been seen before. We are devoted to the idea that the simplest answers are the best and we think simplicity is particularly suited to navigating through elevated uncertainty: If growth is going to be solidly above trend and the Fed is going to maintain extremely accommodative monetary policy settings despite the risk of overheating, risk assets should outperform Treasuries and cash and investors ought to overweight them. Feature We spent much of last week speaking with investors outside of the US in a series of Zoom meetings. The themes that were most persistent in our discussions were inflation (Is it going to materialize and how bad could it be if it does?), the post-pandemic landscape (How will it be different and how should an investor position for it?), the duration of the equity bull market and the interest rate outlook. We had begun preparing a report that examined each of those themes in turn through the lens of our typical analytical process. As we progressed through that report, however, we found ourselves increasingly preoccupied with other topics we touched on in the calls and observations and questions that kept us thinking after the calls had ended. We will delve thoroughly into the themes that were raised on the calls as time goes by and evidence emerges that supports or challenges our current views. Those themes are important and will impact asset-allocation and security-selection decisions into at least the intermediate term. But this week we instead turn the spotlight on some of our impressions of the current economic landscape and how investors might navigate it. At the very least, it will serve as a change of pace, but we hope it will also be a jumping-off point for ongoing discussions about asset allocation and portfolio management. Uncharted Territory, Part One The word “unprecedented” got a lot of use and loomed over our analysis and recommendations. We believe in our analytical framework and we expect that financial markets and the US economy will most likely thrive over the next twelve months, supported by a “just-right” Goldilocks backdrop of outsized growth and extremely accommodative monetary policy. We think the probability of a “too-cold” outcome, in which growth disappoints despite the Fed’s best efforts, is steadily shrinking as vaccinations continue to outpace the rate required to confer herd immunity on the US by the end of September. While we think inflation will ultimately spell the end of the bull phases in financial markets and may even lead the Fed to induce a recession, we think it will be a couple of years before it can take root and bring about the market- and business-cycle denouements. The key word in those conclusions is think; we do not know that there will be a consumption surge that extends across several quarters, powering the US economy to grow at an inflation-adjusted rate of 4 to 5% across 2021 and 2022. We expect that the immunization campaign will squelch COVID-19 in the US at some point this summer, opening the way for the release of pent-up demand as households regain the full menu of consumption options and can once again return to restaurants, bars, airplanes, hotels, stadiums, concert venues, cinemas and theaters. Households have $2 trillion of excess savings to slake that demand, but we cannot know how much of them will be directed to consumption or the rate at which they will be released. It’s not that we don’t want to do the work; it’s that there is no empirical antecedent for this magnitude of fiscal transfers to households. The US has never before injected 25% of a year’s output into the economy across just two years (Chart 1). There is no way, then, to use past history to build a model regressing consumption growth against fiscal stimulus or a sudden surge in household savings driven by sweeping temporary constraints on activity. No way, at least, to build such a model with a reasonable degree of confidence in the predictive quality of its outputs. Chart 1We've Never Seen Anything Like This Before
We've Never Seen Anything Like This Before
We've Never Seen Anything Like This Before
The bottom line, then, is that no investor or researcher should attach a great deal of confidence to his/her current expectations. Everyone in investment management is paid to have an opinion, but all of us should have a healthy degree of humility about our current opinions. All of our views right now are necessarily low-conviction. We eagerly await the ongoing flow of data that will shed some light on whether the consumption surge is materializing and if so, the segments in which it will be concentrated. We are also closely monitoring vaccination progress and the ongoing efficacy of the extant vaccines because victory over COVID-19 by the summer is not assured, even if we do hold our base-case virus view with more conviction than our consumption views. Uncharted Territory, Part Two Shutting down activity to limit interactions fostering the spread of COVID-19 was an eminently logical public health measure. It also made sense to bolster the activity restrictions with direct cash transfers to households to cushion the economic blow of abiding by them. The distributions presumably encouraged compliance with the restrictions, helping to slow the spread of the virus, while also relieving economic distress. But the combination may have borne the unintended consequence of upending established stock market dynamics, a matter of little import for the overall economy but a critical issue for professional investors. Technical analysis is often derided by fundamentally-oriented investors as something akin to astrology or voodoo. We are not dogmatic and are happy to use any tool that might be of value; although we are neither skilled technical analysts nor traders, we accept that technical analysis is the most useful framework for assessing very short-term moves. Even fundamental investors with longer-term time frames may find price charts useful for selecting entry and exit points. Pattern recognition, after all, is an essential investment skill and it’s largely what forward-thinking investors are paying for when they invest in buzzy artificial intelligence applications. Something that upends typical market patterns is therefore important and the economic impact payments and federal unemployment insurance (UI) benefit supplements provided for by the CARES Act and the two rounds of follow-up legislation may have stood the relationship of retail and institutional investors to market movements on its head. The bottom four income quintiles of US households received considerably more aid from the federal government than they needed, strictly speaking. Two-thirds of all taxpayers received the full amount of all three economic impact payments and four-fifths received at least a phased-out portion of them while only 25 million people were out of work at the employment trough in April, less than 10 million were out of work when the second round of checks went out in January and just over 8 million were idled during the current round. Those who were unemployed are estimated to have received CARES Act UI benefits that exceeded their previous compensation by more than a third.1 The net effect is that many idled workers found themselves stranded for several months in 2020 with more money than they could spend. Homer Simpson would have blissfully napped his way through his furlough, with a mountain of empty Duff cans filling the space between the couch and the television, but it’s not a stretch to think that millennials in the same position turned to their phones to relieve their tedium and discovered the joys of commission-free trading in the palm of their hands. Retail investors have traditionally been viewed as being the last to arrive at the party, flooding in at market tops only to seep out at market bottoms, while the smart institutional money drove the trends that retail flows belatedly followed. Over time, institutions following the same cues and adhering to the same heuristics established recognizable bull- and bear-market patterns, like extended bottoming processes and regular backing-and-filling that aligned with Fibonacci retracement levels. The GameStop tempest earlier this year may have been a manifestation of the larger issue that the market had been swamped by newbies who didn’t know the rules and therefore wound up trampling them. A seasoned trader-turned-quantitative-investment-performance-analyst commented to us last summer that these were “not the markets we grew up in.” From his perch at a top hedge fund, he viewed retail flows as having been the catalyst for the market recovery that wiped out the entire pandemic decline with barely a pause for breath (Chart 2). Seasoned analysts and portfolio managers waiting for a consolidation of the initial bounce wound up turbo-charging it as they chased the retail flows that got there ahead of them. “They just couldn’t stand the underperformance any longer,” he said. Chart 2A Whole New Ballgame
A Whole New Ballgame
A Whole New Ballgame
See The Ball, Hit The Ball We follow careful analytical processes at BCA and our clients do as well, but we try not to overthink our investment conclusions once we reach them. We have found that the less a Little Leaguer is thinking about when s/he steps into the batter’s box, the better off s/he will be, and we think the approach applies to investors as well. Be as still as you can, watch the baseball out of the pitcher’s hand, step towards the pitcher and throw your hands at where you judge the ball will be just before it reaches home plate. Your weight will naturally follow your front leg and your hands and everything else will take care of itself if you correctly anticipated where the ball was headed. Our colleague Peter Berezin, BCA’s Chief Global Strategist, abides by a personal Investment Golden Rule: Stay bullish unless you think a recession is just around the corner. His rule aligns perfectly with our observation that bear markets and recessions tend to coincide (Chart 3). Although we cannot know how much of households’ aggregate excess savings will be spent or when, and we therefore cannot predict quarterly GDP growth to the nearest tenth of a percent, we are confident that the economy will grow at a rate well above its real annual long-run potential of 2%, provided that the pandemic doesn’t spring a nasty surprise on the US. If the economy does grow well above its trend rate in 2021 and 2022 (Chart 4), and the Fed lives up to its pledge to remove monetary accommodation only in response to lagged measures of consumer price inflation and labor market strength, stocks should comfortably generate returns in excess of those on cash and Treasuries and multi-asset investors should overweight them (Tables 1 and 2). Chart 3Recessions And Bear Markets Tend To Travel Together
Recessions And Bear Markets Tend To Travel Together
Recessions And Bear Markets Tend To Travel Together
Chart 4Earnings Grow When The Economy Grows, And Stocks Move With Earnings
Earnings Grow When The Economy Grows, And Stocks Move With Earnings
Earnings Grow When The Economy Grows, And Stocks Move With Earnings
Table 1Stocks Thrive When Policy Is Easy, ...
Late-Pandemic Impressions
Late-Pandemic Impressions
Table 2… Especially In Real Terms
Late-Pandemic Impressions
Late-Pandemic Impressions
Steering Portfolios Through Uncertainty Acknowledging the uncertainty inherent in predictions made in the current environment, with its unprecedented fiscal stimulus, is all well and good, but professional investors have a mandate to invest regardless of their conviction levels. How should they navigate through the next twelve months aside from overweighting equities in multi-asset portfolios? The basic rule guiding our answer in this case is to stay within sight of the shore if there’s a possibility that the weather might change suddenly. Given that no one knows how the big swing factors impacting output and the balance between capacity and aggregate demand – consumer caprice, anti-vaccination sentiment, reopening timetables and labor force participation – will turn out, we think that investors’ first order of business should be to prepare to shorten holding periods. Conviction levels will evolve over time as incoming data validate or contradict investment theses but it is important to be prepared mentally to manage portfolios more dynamically in line with unprecedented conditions. Individual managers and investment committees who prepare to adjust their procedures, perhaps by setting stop levels and/or rebalancing thresholds in advance, will find it much easier to do so in real time should it turn out to be appropriate. Investors may also consider reducing deviations from their benchmarks. Increasing the frequency of portfolio rebalancing, shifting from time to level thresholds, or tightening level thresholds are ways that investors with rebalancing guidelines could narrow deviations. Investors who don't rebalance can reduce their initial position deviations and/or their portfolio concentrations. Shortening holding periods and increasing rebalancing frequencies implies harvesting gains more often and is therefore tax-inefficient, but we think it may be worth sacrificing some tax efficiency to protect overall portfolio value at a time of elevated uncertainty. Doug Peta, CFA Chief US Investment Strategist dougp@bcaresearch.com Footnotes 1 Ganong, Peter and Noel, Pascal and Vavra, Joseph, US Unemployment Insurance Replacement Rates During the Pandemic (August 24, 2020). University of Chicago, Becker Friedman Institute for Economics Working Paper No. 2020-62.
Highlights After staging a tentative rebound in the first three months of the year, the US dollar has resumed its weakening trend. We expect the greenback to drift lower over the next 12 months, as global growth momentum rotates from the US to the rest of the world, the Fed maintains its ultra-accommodative monetary stance, and the US struggles to finance its burgeoning trade deficit. China will provide adequate fiscal and monetary support for its economy, which will buoy commodity prices, the yuan, and other EM currencies. The Canadian dollar should strengthen as the Bank of Canada continues to shrink its balance sheet with the goal of lifting rates by the end of 2022. EUR/USD is on track to rise to 1.25 by year-end. The pound will strengthen against the euro. While the yen’s defensive nature will limit any gains in the currency, a cheap valuation and relatively high Japanese real rates will keep downside risks in check. Global Growth Momentum To Rotate From The US To The Rest Of The World Sizable upward revisions to US growth projections gave the US dollar a modest boost in the first quarter of 2021 (Chart 1). According to Bloomberg consensus estimates, US real GDP grew by 5.4% in the first quarter, spurred on by massive fiscal stimulus and a speedy vaccination rollout. In contrast, real GDP in the euro area, the UK, and Japan contracted (Table 1). Chart 1A Dovish Fed Kept The Dollar From Strengthening Much This Year Despite Strong US Growth Vis-À-Vis The Rest Of The World
A Dovish Fed Kept The Dollar From Strengthening Much This Year Despite Strong US Growth Vis-À-Vis The Rest Of The World
A Dovish Fed Kept The Dollar From Strengthening Much This Year Despite Strong US Growth Vis-À-Vis The Rest Of The World
Table 1Growth In Major Advanced Countries Is Expected To Start Catching Up To The US Later This Year
What’s Next For The Greenback?
What’s Next For The Greenback?
While economic momentum still favors the US in the second quarter, the gap with other countries will narrow dramatically. The US economy is on track to expand by 8.1% in the current quarter. Bloomberg consensus expects the euro area to grow by 7.4%, the UK by 17.4%, and Japan by 4.7%. Looking out to the third quarter, both the euro area and the UK are poised to grow faster than the US. Continental Europe, in particular, should see much stronger growth in the second half of 2021 following a sluggish start to the vaccine rollout. Enough Vaccines For All? The vaccination campaign has gotten off to a slow start in most emerging markets. The spread of more contagious Covid-19 variants has led to a surge in infections in some regions. Notably, India is reporting over 300,000 new cases a day. Matters should improve on the pandemic front for many developing economies later this year. Assuming that vaccine makers are able to achieve their production targets, the Duke University Global Health Innovation Center estimates that 12 billion vaccine doses will be produced in 2021. This would be enough to vaccinate 75% of the world’s population, close to most measures of “herd immunity.” China Will Maintain Ample Policy Support Chart 2Real Rate Differentials Moved In Favor Of The Dollar At The Long End Of The Curve In Q1, But Not At The Short End
Real Rate Differentials Moved In Favor Of The Dollar At The Long End Of The Curve In Q1, But Not At The Short End
Real Rate Differentials Moved In Favor Of The Dollar At The Long End Of The Curve In Q1, But Not At The Short End
Investor concerns that the Chinese authorities are about to reverse stimulus measures are overblown. Jing Sima, BCA’s chief China strategist, expects the general government budget deficit to average 8% of GDP in 2021, largely unchanged from 2020 levels. She sees credit growth falling from 15% in 2020 to 12% this year (in line with her estimate of nominal GDP growth). Given that China’s debt-to-GDP ratio stands at 270%, credit growth of 12% would leave the outstanding stock of credit roughly 33 trillion yuan (32% of GDP) higher at the end of 2021 compared to end-2020. That is a lot of new credit formation, all of which should buoy commodity prices, the yuan, and other EM currencies. Rate Differentials Remain Dollar Bearish Despite strong US growth, US 2-year real rates have continued to decline in relation to rates abroad. Long-term yield differentials did rise in favor of the US in the first three months of the year, giving the dollar a lift. However, long-term differentials have since reversed course, which helps account for the dollar’s renewed weakness (Chart 2). The Fed’s dovish stance explains why stronger growth has given so little support to the dollar. The 10-year Treasury yield generally tracks the expected Fed funds rate two-to-three years out (Chart 3). At present, the markets are as hawkish relative to the median Fed dot as they have ever been (Chart 4). Chart 3Bond Yields Are Unlikely To Rise Much Unless The Market Lifts Its Estimate Of Where The Fed Funds Rate Will Be 2-To-3 Years Out
Bond Yields Are Unlikely To Rise Much Unless The Market Lifts Its Estimate Of Where The Fed Funds Rate Will Be 2-To-3 Years Out
Bond Yields Are Unlikely To Rise Much Unless The Market Lifts Its Estimate Of Where The Fed Funds Rate Will Be 2-To-3 Years Out
Chart 4The Market Is Very Hawkish Relative To The Fed Dots
The Market Is Very Hawkish Relative To The Fed Dots
The Market Is Very Hawkish Relative To The Fed Dots
This doesn’t mean that market expectations cannot get more hawkish from here. However, for this to happen, the Fed would need to start aggressively talking up the prospect of tapering asset purchases and accelerating the timeline to hiking rates. This does not seem probable to us. Chart 5Prime-Age Employment Remains Well Below Pre-Pandemic Levels
Prime-Age Employment Remains Well Below Pre-Pandemic Levels
Prime-Age Employment Remains Well Below Pre-Pandemic Levels
The prime-age employment-to-population ratio is still 3.7 percentage points below pre-pandemic levels (Chart 5). Overall US employment is about 5% below where it was in January 2020. Among workers earning less than $20 per hour, employment is down more than 10% (Chart 6). While some firms have complained about a shortage of workers, this likely reflects the combination of generous unemployment benefits (which expire in September) and lingering fears about catching the virus from work (which will abate as more people are vaccinated). Just as was the case following the Great Recession – when market commentary was rife with talk about a permanent increase in “structural unemployment” – concerns that the pandemic has led to lasting labor market damage will prove to be largely unfounded. Chart 6US Employment Still Down About 5% From Its Pre-Pandemic Levels
What’s Next For The Greenback?
What’s Next For The Greenback?
The Dollar Faces Balance Of Payments Pressures The dollar is not a cheap currency. It is 13% overvalued based on Purchasing Power Parity exchange rates (Chart 7). One of the consequences of the dollar’s overvaluation has been a persistent trade deficit. As Chart 8 shows, the US trade deficit in goods and services has widened sharply since early 2020. Chart 7The Dollar Is Expensive Based On Its PPP Fair Value
The Dollar Is Expensive Based On Its PPP Fair Value
The Dollar Is Expensive Based On Its PPP Fair Value
Chart 8The Widening US Trade Deficit
The Widening US Trade Deficit
The Widening US Trade Deficit
Excessively large budget deficits drain national savings, leading to a larger current account deficit. Hence, the dollar has usually weakened whenever the government has eased fiscal policy beyond what was necessary to close the output gap (Chart 9). Foreigners have been net sellers of Treasurys this year. To a large extent, equity inflows have supported the dollar (Chart 10). However, if growth rotates from the US to the rest of the world, non-US stock markets are likely to outperform. This could cause foreign equity inflows into the US to turn into outflows. The dollar would then need to weaken to make US stocks more attractive in foreign-currency terms. Chart 9The Dollar Usually Weakens Whenever The Government Eases Fiscal Policy Beyond What Is Necessary To Close The Output Gap
The Dollar Usually Weakens Whenever The Government Eases Fiscal Policy Beyond What Is Necessary To Close The Output Gap
The Dollar Usually Weakens Whenever The Government Eases Fiscal Policy Beyond What Is Necessary To Close The Output Gap
Chart 10Equity Inflows Supported The Dollar This Year
Equity Inflows Supported The Dollar This Year
Equity Inflows Supported The Dollar This Year
Technicals Point To A Weaker Dollar For many investment decisions, being a contrarian is a smart strategy. This does not apply to trading the US dollar, however. The dollar is a high momentum currency (Chart 11). When it comes to the dollar, you want to be a trend follower. Chart 11The Dollar Is A High Momentum Currency
What’s Next For The Greenback?
What’s Next For The Greenback?
Chart 12 shows that a simple trading rule that bought the dollar index when it was trading above its moving average would have made money, whereas a rule that bought the index when it was below its moving average would have lost money. While trading rules using short-term moving averages work best, even long-term moving average rules yield profitable results. Chart 12ATrading The Dollar: Follow Momentum (I)
What’s Next For The Greenback?
What’s Next For The Greenback?
Chart 12BTrading The Dollar: Follow Momentum (II)
Trading The Dollar: Follow Momentum
Trading The Dollar: Follow Momentum
Today, the dollar is trading below all of its various moving averages, which points to further downside for the currency. The dollar’s momentum status extends to sentiment. In general, the dollar is more likely to strengthen when sentiment is already bullish. On the flipside, the dollar is more likely to weaken when sentiment is bearish. At present, dollar sentiment is bearish, which increases the odds of further dollar weakness (Chart 13). Chart 13ABeing A Contrarian Doesn’t Pay When It Comes To Trading The Dollar (I)
What’s Next For The Greenback?
What’s Next For The Greenback?
Chart 13BBeing A Contrarian Doesn't Pay When It Comes To Trading The Dollar (II)
Being A Contrarian Doesn't Pay When It Comes To Trading The Dollar
Being A Contrarian Doesn't Pay When It Comes To Trading The Dollar
Chart 14Seasonality In The FX, Bond, And Equity Markets
What’s Next For The Greenback?
What’s Next For The Greenback?
Finally, the dollar has tended to exhibit seasonal fluctuations. In general, the greenback has strengthened in the first half of the year and weakened in the second half (Chart 14). It is not entirely clear what explains this phenomenon, but it is worth noting that since 1985, almost all of the cumulative decline in Treasury yields has occurred in the back half of the year. Cyclical Currencies Are Most Likely To Strengthen Against The US Dollar Cyclical (i.e., high-beta) currencies will fare best against the US dollar over the next 12 months. In the EM space, strong global growth will benefit the Mexican peso, Chilean peso, Brazilian real, South African rand, Korean won, and the Indonesian rupiah. In the developed economy sphere, the Swedish krona, Norwegian krone, and Australian and Canadian dollars are poised to appreciate the most. We are particularly bullish on the loonie. The Bank of Canada announced on Wednesday that it will reduce the weekly pace of government bond purchases from C$4 billion to C$3 billion. Even before this announcement, the BoC’s balance sheet was shrinking following the decision to scale back repo operations and discontinue several other asset purchase programs. The BoC also indicated that it expects the Canadian economy to return to full employment in the second half of 2022, which should set the stage for the first rate hike by the end of next year. We expect EUR/USD to reach 1.25 by year-end. The British pound will strengthen to 1.50 against the dollar and 1.20 against the euro. Chart 15 shows that GBP/USD has closely tracked the rise and fall of global equities. Notably, the pound is 15% undervalued against the euro based on real 2-year interest rate differentials (Chart 16). Chart 15GBP/USD Has Closely Tracked Global Equities
GBP/USD Has Closely Tracked Global Equities
GBP/USD Has Closely Tracked Global Equities
Chart 16The Pound Is Undervalued Against The Euro Based On Real Short-Term Interest Rate Differentials
The Pound Is Undervalued Against The Euro Based On Real Short-Term Interest Rate Differentials
The Pound Is Undervalued Against The Euro Based On Real Short-Term Interest Rate Differentials
The Japanese yen is a highly defensive currency. Hence, stronger global growth will pose a headwind to the yen. Nevertheless, the yen is quite cheap, trading at a 20% discount to its Purchasing Power Parity exchange rate (Chart 17). Moreover, real yields are higher in Japan than they are in the other major economies, reflecting ongoing deflationary pressures (Chart 18). On balance, we expect the yen to move sideways against the US dollar over the next 12 months. Chart 17The Yen Is Quite Cheap
The Yen Is Quite Cheap
The Yen Is Quite Cheap
Chart 18Real Yields Are Higher In Japan Than In The Other Major Economies
Real Yields Are Higher In Japan Than In The Other Major Economies
Real Yields Are Higher In Japan Than In The Other Major Economies
Equity Implications Of A Weaker Dollar Cyclical stocks tend to outperform defensives when the dollar is weakening. To the extent that cyclicals are overrepresented in stock market indices outside the US, a weaker dollar favors non-US equities (Chart 19). Chart 19Cyclical Stocks Tend To Outperform Defensives When The Dollar Is Weakening
Cyclical Stocks Tend To Outperform Defensives When The Dollar Is Weakening
Cyclical Stocks Tend To Outperform Defensives When The Dollar Is Weakening
Chart 20Value Stocks Generally Do Best In A Weak Dollar Environment
Value Stocks Generally Do Best In A Weak Dollar Environment
Value Stocks Generally Do Best In A Weak Dollar Environment
Value stocks also tend to do best in a weak dollar environment (Chart 20). As such, we recommend that investors overweight cyclicals, non-US, and value stocks over the next 12 months. Peter Berezin Chief Global Strategist pberezin@bcaresearch.com Global Investment Strategy View Matrix
What’s Next For The Greenback?
What’s Next For The Greenback?
Special Trade Recommendations
What’s Next For The Greenback?
What’s Next For The Greenback?
Current MacroQuant Model Scores
What’s Next For The Greenback?
What’s Next For The Greenback?
Weekly Performance Update For the week ending Thu Apr 22, 2021 The Market Monitor displays the trailing 1-quarter performance of strategies based around the BCA Score. For each region, we construct an equal-weighted, monthly rebalanced portfolio consisting of the top 3 stocks per sector and compare it with the regional benchmark. For each portfolio, we show the weekly performance of individual holdings in the Top Contributors/Detractors table. In addition, the Top Prospects table shows the holdings that currently have the highest BCA Score within the portfolio. For more details, click the region headers below to be redirected to the full historical backtest for the strategy. BCA US Portfolio
Market Monitor (Apr 22, 2021)
Market Monitor (Apr 22, 2021)
Total Weekly Return BCA US Portfolio S&P500 TRI -0.56% -0.84% Top Contributors QFIN:US VIPS:US UTHR:US SEM:US VICI:US Weekly Return 36 bps 20 bps 13 bps 12 bps 12 bps Top Detractors MO:US EXPI:US SCCO:US TRTN:US DCP:US Weekly Return -29 bps -27 bps -25 bps -24 bps -16 bps Top Prospects TX:US ESGR:US UHAL:US MO:US BRK.A:US BCA Score 99.89% 97.61% 96.90% 96.18% 94.68% BCA Canada Portfolio
Market Monitor (Apr 22, 2021)
Market Monitor (Apr 22, 2021)
Total Weekly Return BCA Canada Portfolio S&P/TSX TRI 0.03% -1.44% Top Contributors LIF:CA CFP:CA RUS:CA RCI.B:CA NWC:CA Weekly Return 20 bps 13 bps 8 bps 8 bps 7 bps Top Detractors PXT:CA ENGH:CA DIR.UN:CA CSU:CA WEED:CA Weekly Return -10 bps -10 bps -9 bps -9 bps -8 bps Top Prospects LNF:CA IFP:CA CFP:CA NWC:CA LNR:CA BCA Score 99.43% 98.42% 98.23% 92.71% 90.60% BCA UK Portfolio
Market Monitor (Apr 22, 2021)
Market Monitor (Apr 22, 2021)
Total Weekly Return BCA UK Portfolio FTSE 100 TRI 1.01% -0.59% Top Contributors SVST:GB NLMK:GB FXPO:GB NFC:GB EMIS:GB Weekly Return 48 bps 30 bps 30 bps 26 bps 25 bps Top Detractors AO.:GB OXIG:GB PRTC:GB CNE:GB PZC:GB Weekly Return -28 bps -25 bps -13 bps -9 bps -8 bps Top Prospects SVST:GB NLMK:GB GLTR:GB BPCR:GB GYS:GB BCA Score 99.75% 98.71% 97.45% 96.76% 96.70% BCA Eurozone Portfolio
Market Monitor (Apr 22, 2021)
Market Monitor (Apr 22, 2021)
Total Weekly Return BCA EMU Portfolio MSCI EMU TRI 0.64% 0.66% Top Contributors VIRP:FR CNV:FR VGP:BE MONT:BE GCO:ES Weekly Return 68 bps 16 bps 13 bps 11 bps 9 bps Top Detractors ROTH:FR AOF:DE SOL:IT TEN:IT PHH2:DE Weekly Return -23 bps -15 bps -10 bps -9 bps -8 bps Top Prospects PHH2:DE SOL:IT CNV:FR SOLV:BE ROTH:FR BCA Score 99.84% 99.37% 98.98% 98.92% 97.81% BCA Japan Portfolio
Market Monitor (Apr 22, 2021)
Market Monitor (Apr 22, 2021)
Total Weekly Return BCA Japan Portfolio TOPIX TRI -1.86% -1.87% Top Contributors 5451:JP 4980:JP 7994:JP 8966:JP 6960:JP Weekly Return 7 bps 4 bps 3 bps 2 bps 1 bps Top Detractors 6269:JP 7279:JP 4008:JP 8425:JP 8173:JP Weekly Return -18 bps -18 bps -15 bps -15 bps -11 bps Top Prospects 9436:JP 1766:JP 4008:JP 8595:JP 6960:JP BCA Score 99.44% 99.23% 99.06% 97.37% 97.09% BCA Hong Kong Portfolio
Image
Total Weekly Return BCA Hong Kong Portfolio Hang Seng TRI 1.58% -0.05% Top Contributors 990:HK 856:HK 2232:HK 867:HK 215:HK Weekly Return 42 bps 32 bps 22 bps 19 bps 13 bps Top Detractors 148:HK 1888:HK 41:HK 2798:HK 373:HK Weekly Return -38 bps -15 bps -7 bps -6 bps -5 bps Top Prospects 990:HK 86:HK 2232:HK 811:HK 3306:HK BCA Score 99.85% 98.90% 98.45% 97.69% 96.00% BCA Australia Portfolio
Market Monitor (Apr 22, 2021)
Market Monitor (Apr 22, 2021)
Total Weekly Return BCA Australia Portfolio S&P/ASX All Ord. TRI 0.56% -0.07% Top Contributors ADH:AU GRR:AU HT1:AU REH:AU BLX:AU Weekly Return 55 bps 45 bps 18 bps 12 bps 11 bps Top Detractors STX:AU PDN:AU AGL:AU RIC:AU AQZ:AU Weekly Return -41 bps -20 bps -16 bps -12 bps -11 bps Top Prospects BSE:AU GRR:AU PSQ:AU PIC:AU ZIM:AU BCA Score 99.88% 98.80% 97.39% 97.21% 97.00%