Equities

Gradually, Then Suddenly?
Gradually, Then Suddenly?
US equity market euphoria got a jab in the arm yesterday and started to test the resolve of late-comers to the rally. While the self-reinforcing cycle of ultra loose financial conditions along with easy fiscal and monetary policies will continue to underpin markets on a cyclical time horizon, any let up in the near-term in any of these buoyant macro forces can have far reaching effects, especially given lofty valuations and rising complacency. Thus, we remain cautious in the short-term. Not only is this market in a desperate need of a breather given that it once again sits two standard deviations above the 20-month moving average (top panel) – a technical signal that allowed us to caution clients of extreme overbought conditions right before the September 2nd correction – but also a number of other factors are waving yellow flags. First, the US smart money flow index is revealing the fragility hidden beneath the SPX surface. The divergence between this index and the S&P 500 is reminiscent of the 2018 “Volmageddon” correction (third panel). Second, the total US equity call / put ratio is significantly diverging with equity prices, likely as a result of both smart money hedging their longs (second panel) and retail call buying frenzy going on a hiatus. Finally, our US Equity Internal Dynamics Indicator also ticked down of late cementing the argument that, for now, equities are fully priced as we posited in yesterday’s Strategy Report where we updated our SPX dividend discount model (bottom panel). Bottom Line: While we remain cyclically bullish, any mishaps on China’s and/or the Fed’s front will likely serve as a catalyst for a near-term correction.
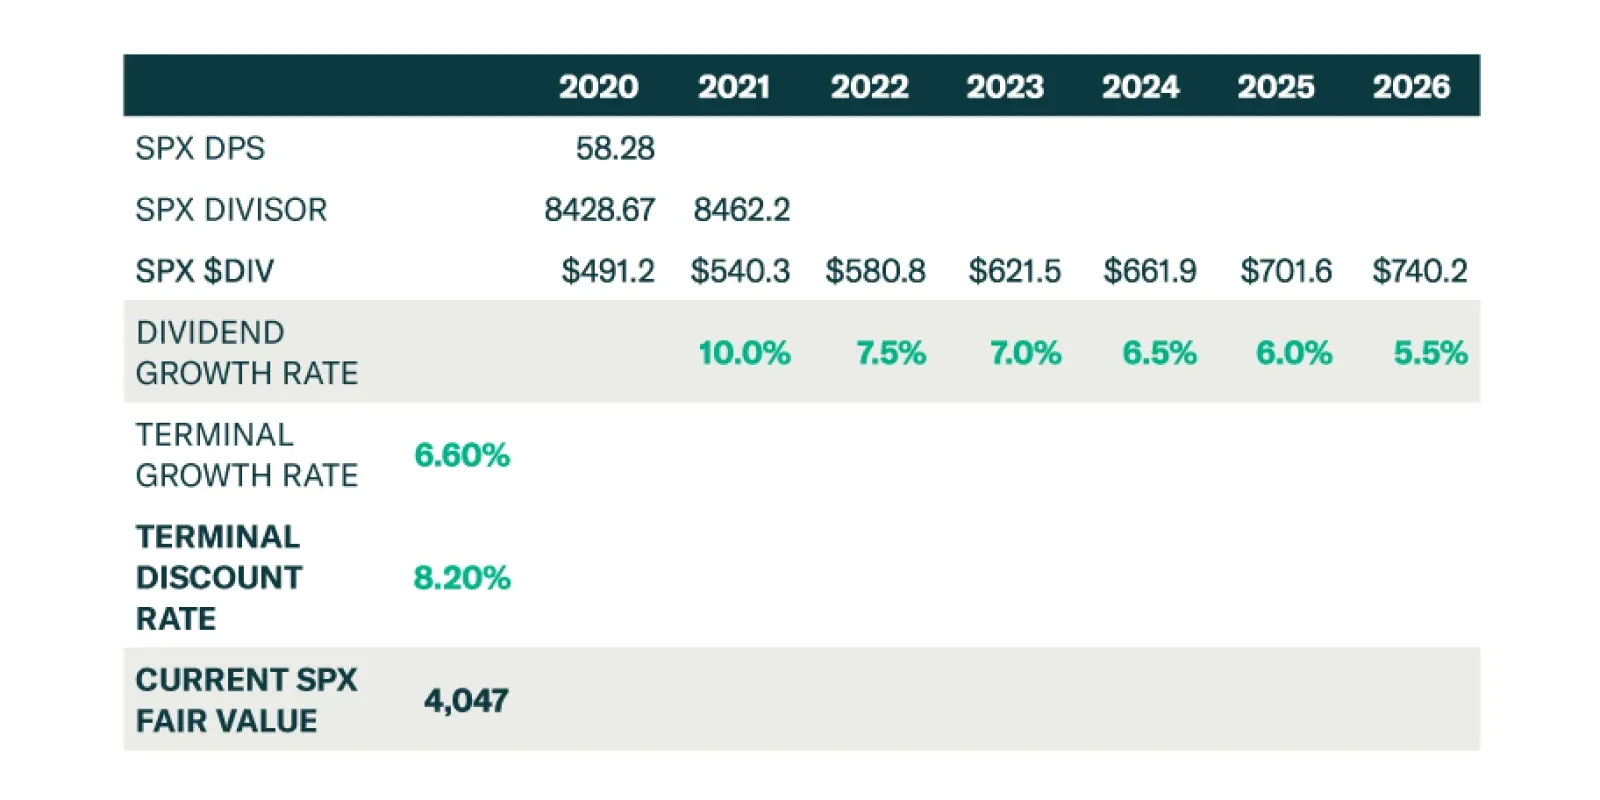
BCA Research’s US Equity Strategy service recently updated their SPX dividend discount model (DDM). The model – along with their SPX EPS/multiple sensitivity analysis and their SPX forward ERP fair value estimates – points to an SPX fair value near 4,050. …
According to BCA Research’s Global Investment Strategy service, if fully implemented, President Biden’s Made in America Tax Plan would reduce S&P 500 earnings by about 8%. However, some of the proposed tax measures are likely to be watered down, resulting…
Weekly Performance Update For the week ending Thu Apr 15, 2021 The Market Monitor displays the trailing 1-quarter performance of strategies based around the BCA Score. For each region, we construct an equal-weighted, monthly rebalanced portfolio consisting of the top 3 stocks per sector and compare it with the regional benchmark. For each portfolio, we show the weekly performance of individual holdings in the Top Contributors/Detractors table. In addition, the Top Prospects table shows the holdings that currently have the highest BCA Score within the portfolio. For more details, click the region headers below to be redirected to the full historical backtest for the strategy. BCA US Portfolio
Market Monitor (Apr 15, 2021)
Market Monitor (Apr 15, 2021)
Total Weekly Return BCA US Portfolio S&P500 TRI 0.74% 1.81% Top Contributors DELL:US LPX:US DCP:US TTEC:US TRTN:US Weekly Return 21 bps 20 bps 16 bps 13 bps 13 bps Top Detractors QFIN:US EXPI:US VIPS:US UHAL:US TX:US Weekly Return -49 bps -36 bps -12 bps -5 bps -4 bps Top Prospects TX:US ESGR:US UHAL:US BRK.A:US VIPS:US BCA Score 99.68% 98.48% 93.23% 93.20% 92.08% BCA Canada Portfolio
Market Monitor (Apr 15, 2021)
Market Monitor (Apr 15, 2021)
Total Weekly Return BCA Canada Portfolio S&P/TSX TRI -0.72% 0.49% Top Contributors TOY:CA CSU:CA QBR.A:CA GIB.A:CA WIR.UN:CA Weekly Return 16 bps 12 bps 12 bps 7 bps 6 bps Top Detractors APHA:CA CFP:CA LNF:CA WEED:CA ENGH:CA Weekly Return -45 bps -11 bps -10 bps -10 bps -9 bps Top Prospects LNF:CA IFP:CA CFP:CA LNR:CA NWC:CA BCA Score 99.32% 96.68% 96.68% 93.39% 92.80% BCA UK Portfolio
Market Monitor (Apr 15, 2021)
Market Monitor (Apr 15, 2021)
Total Weekly Return BCA UK Portfolio FTSE 100 TRI 0.76% 0.68% Top Contributors NFC:GB SVST:GB OXIG:GB XPP:GB AGRO:GB Weekly Return 28 bps 25 bps 16 bps 15 bps 14 bps Top Detractors AAF:GB TM17:GB GLO:GB AO.:GB SSE:GB Weekly Return -34 bps -12 bps -10 bps -9 bps -7 bps Top Prospects SVST:GB FXPO:GB NLMK:GB BPCR:GB GYS:GB BCA Score 98.21% 98.16% 97.25% 96.79% 96.00% BCA Eurozone Portfolio
Market Monitor (Apr 15, 2021)
Market Monitor (Apr 15, 2021)
Total Weekly Return BCA EMU Portfolio MSCI EMU TRI 0.61% 0.41% Top Contributors CNV:FR SES:IT HDG:NL AOF:DE FLUX:BE Weekly Return 38 bps 19 bps 17 bps 16 bps 8 bps Top Detractors TTALO:FI RIN:FR EDNR:IT TKA:AT VGP:BE Weekly Return -9 bps -8 bps -7 bps -7 bps -7 bps Top Prospects PHH2:DE SOLV:BE SOL:IT CNV:FR BEKB:BE BCA Score 99.62% 98.82% 98.56% 97.48% 95.70% BCA Japan Portfolio
Market Monitor (Apr 15, 2021)
Market Monitor (Apr 15, 2021)
Total Weekly Return BCA Japan Portfolio TOPIX TRI 0.05% 0.37% Top Contributors 8595:JP 8255:JP 5943:JP 6960:JP 7942:JP Weekly Return 27 bps 14 bps 8 bps 7 bps 5 bps Top Detractors 8850:JP 8795:JP 8173:JP 8198:JP 9413:JP Weekly Return -15 bps -11 bps -10 bps -10 bps -7 bps Top Prospects 9436:JP 1766:JP 8133:JP 7994:JP 4008:JP BCA Score 98.83% 98.68% 98.19% 98.10% 97.66% BCA Hong Kong Portfolio
Image
Total Weekly Return BCA Hong Kong Portfolio Hang Seng TRI -0.11% -0.74% Top Contributors 990:HK 1898:HK 1378:HK 1088:HK 373:HK Weekly Return 84 bps 15 bps 13 bps 9 bps 6 bps Top Detractors 856:HK 43:HK 579:HK 2798:HK 719:HK Weekly Return -22 bps -17 bps -17 bps -15 bps -11 bps Top Prospects 990:HK 2232:HK 1866:HK 3306:HK 811:HK BCA Score 99.79% 99.67% 98.68% 98.65% 98.32% BCA Australia Portfolio
Market Monitor (Apr 15, 2021)
Market Monitor (Apr 15, 2021)
Total Weekly Return BCA Australia Portfolio S&P/ASX All Ord. TRI 0.64% 0.93% Top Contributors PSQ:AU ADH:AU STX:AU MAQ:AU DDR:AU Weekly Return 23 bps 21 bps 18 bps 16 bps 15 bps Top Detractors ZIM:AU PDN:AU CAJ:AU SIG:AU AGL:AU Weekly Return -25 bps -24 bps -13 bps -11 bps -10 bps Top Prospects BSE:AU GRR:AU PIC:AU BLX:AU ZIM:AU BCA Score 99.77% 98.85% 98.02% 97.05% 96.86%
Highlights If fully implemented, President Biden’s Made in America Tax Plan would reduce S&P 500 earnings by about 8%. We expect some of the proposed tax measures to be watered down, resulting in a 5% decline in earnings. Investors are likely to shrug off the near-term impact of higher taxes, given strong economic growth and continued support from accommodative monetary policy. Looking further out, however, we see four reasons why US tax rates are likely to keep rising, eventually reaching levels that hurt stock prices: First, the effective US corporate tax rate is still very low; second, the failure of President Trump’s tax cuts to boost investment spending will make it easier eventually to fully reverse them; third, rising bond yields will make it more expedient to fund spending with higher taxes rather than increased borrowing; and fourth, and most importantly, the political winds are shifting in favor of higher taxes on corporations and the wealthy. The Democrats have been moving leftward on economic matters for some time. For their part, conservative Republicans are starting to ask themselves why they should support tax cuts for a growing list of “woke” companies that seemingly hate them. The US corporate sector is at risk of being left without a party to defend its interests. Thus, while the near-term outlook for stocks is still bright, the long-term outlook is growing increasingly dim. The Biden Tax Plan On March 31st, President Biden unveiled the American Jobs Plan. The plan proposes $2.25 trillion in new federal spending, spread out over eight years, on public infrastructure and other areas. As outlined in the Made In America Tax Plan, the Biden Administration will seek to raise $2 trillion in tax revenue over the next 15 years in order to fund the new spending package. The three most important provisions in the tax plan are: Raising the domestic corporate income tax rate from 21% to 28%. This would bring the tax rate halfway back to where it was prior to the Trump tax cuts (35%). Taking into account the global distribution of corporate profits and other factors, such a tax hike would reduce S&P 500 earnings by about 4%. Increasing the minimum tax on the foreign profits of US companies. The Biden administration proposes doubling the minimum tax rate on Global Intangible Low-Taxed Income (GILTI) from 10.5% to 21%. It also plans to eliminate the Foreign-Derived Intangible Income deduction (FDII). These two measures would reduce S&P 500 earnings by about another 3.5%. A 15% minimum tax on “book income” (i.e., the earnings that companies report to shareholders). The tax applies to corporations with annual profits in excess of $2 billion. The Treasury department estimates that 45 companies will be liable for this tax. It would cut S&P 500 earnings by a further 0.5%. Taken together, these provisions would reduce S&P 500 earnings by about 8%. In practice, we think the impact will be closer to 5%. The Biden plan includes a variety of tax credits, focusing on areas such as clean energy and R&D, which should offset some of the tax increases. The ultimate corporate tax rate is also likely to fall short of 28%. West Virginia Senator Joe Manchin, the critical swing voter, has already said he would prefer to cap it at 25%. What Has Been Priced In? Chart 1Companies That Stand To Lose The Most From Higher Taxes Have Fared Well
Companies That Stand To Lose The Most From Higher Taxes Have Fared Well
Companies That Stand To Lose The Most From Higher Taxes Have Fared Well
Our reading of the data suggests that very little of the impact from higher taxes has been baked into either analyst earnings estimates or market expectations. Chart 1 displays the performance of Goldman‘s “Formerly High Tax” and “Formerly Low Tax” equity baskets. The formerly high-taxed companies gained the most from Trump’s tax cuts and presumably would lose the most if the tax cuts were rolled back. Yet, they have outperformed their low-taxed peers since the Georgia runoff election, which handed the Senate to the Democrats. Likewise, earnings estimates have not reacted to the prospect of higher taxes. This is not surprising. Chart 2 shows that analysts did not adjust their earnings estimates until shortly after President Trump signed the Tax Cuts and Jobs Act into law on December 22, 2017. Similar to what happened back then, analysts appear to be waiting for the details of the ultimate tax package before changing their estimates. Chart 2Analysts Have Not Adjusted Their Earnings Estimates To Reflect The Likelihood Of Higher Taxes
Analysts Have Not Adjusted Their Earnings Estimates To Reflect The Likelihood Of Higher Taxes
Analysts Have Not Adjusted Their Earnings Estimates To Reflect The Likelihood Of Higher Taxes
For Now, Business Cycle Dynamics Are More Important Than Taxes While the failure of the investment community to price in higher taxes represents a headwind to stocks, we would characterize it as a modest headwind. IBES estimates still point to earnings growth of 15% for S&P 500 companies in 2022. It would take an unrealistically large tax hit to keep corporate profits from rising next year. The IMF’s latest economic projections, released a few weeks ago, foresee US real GDP growing by 3.5% in 2022, one full percentage point faster than the Fund expected in January (Table 1). Given the strong correlation between equity returns and economic growth, the equity bull market will likely survive a tax increase (Chart 3). Table 1Growth Remains Robust
Taxing Woke Capital
Taxing Woke Capital
Chart 3Stocks Usually Outperform Bonds When Economic Growth Is Strong
Stocks Usually Outperform Bonds When Economic Growth Is Strong
Stocks Usually Outperform Bonds When Economic Growth Is Strong
Of course, some stocks could still feel the pinch from higher taxes. The tech sector is especially vulnerable, given that it currently enjoys one of the lowest effective tax rates in the S&P 500 (Chart 4). Tech companies have also been very adept at shifting income from intangible assets such as patents to offshore tax havens, which is likely to put them in the crosshairs of the soon-to-be bulked up IRS.1 We currently favor value over growth stocks. The likelihood that higher taxes will have a disproportionately negative effect on growth sectors such as tech only reinforces this view. Chart 4Tech Is Vulnerable To Higher Taxes
Taxing Woke Capital
Taxing Woke Capital
Higher Taxes: Start Of A Long-Term Trend? While we are not too worried about the near-term impact of higher taxes on equity prices, we are more concerned about the longer-term consequences. As we discuss below, not only is Biden likely to raise personal income and capital gains taxes to fund future spending initiatives such as the forthcoming American Families Plan, but the pressure to keep raising business taxes will persist well beyond his administration. There are four reasons for this: Reason #1: The effective US corporate tax rate is still very low Chart 5Corporate Tax Revenues Are Low
Corporate Tax Revenues Are Low
Corporate Tax Revenues Are Low
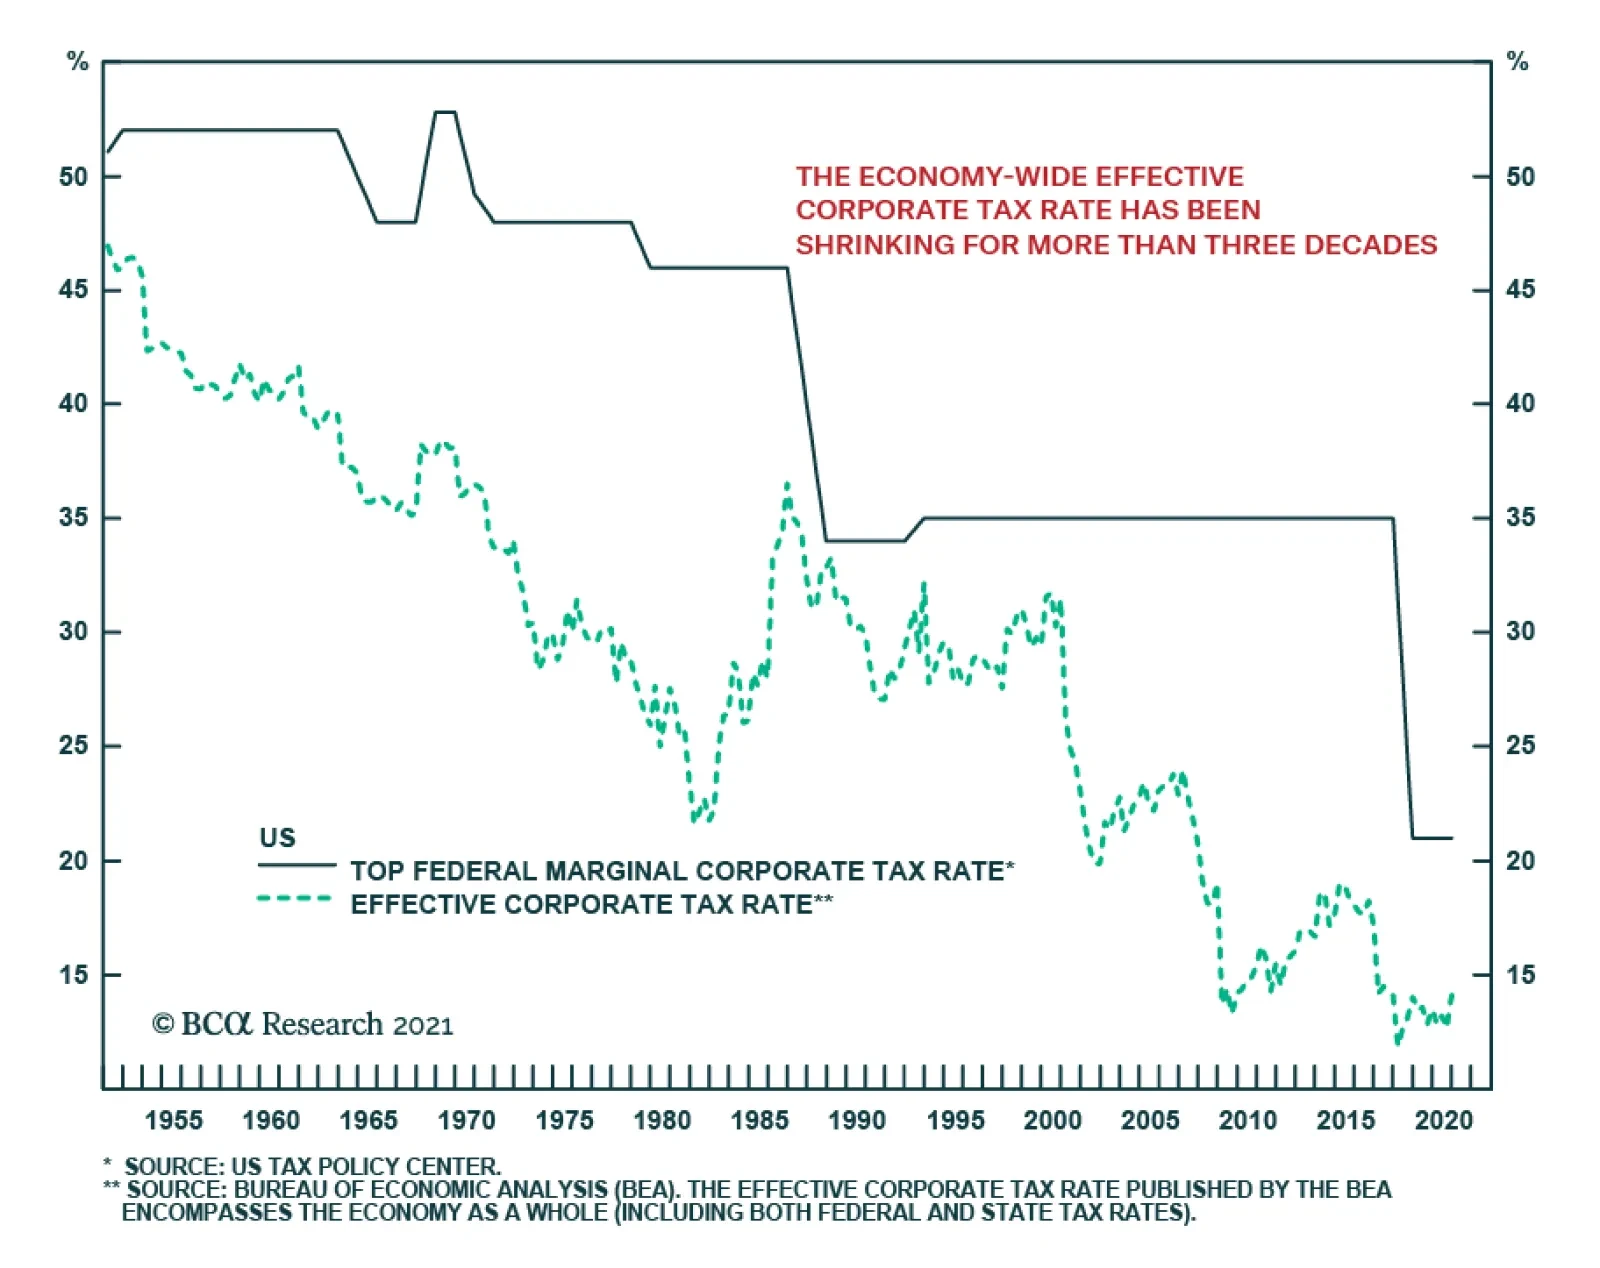
In April 2018, four months after the Tax Cuts and Jobs Act came into effect, the Congressional Budget Office projected that US corporations would pay $276 billion in corporate taxes in 2019. In the end, they paid only $230 billion.2 US corporate income tax receipts stood at only 1% of GDP in 2018-19, half of what they were in 2013-17 (Chart 5). During Ronald Reagan’s second term in office, US corporations faced an effective tax rate of around 30%. Today, it is less than 15% (Chart 6). As a share of GDP, the US government collects less corporate tax revenue than almost all other OECD economies (Chart 7). Chart 6The Economy-Wide Effective Corporate Tax Rate Has Been Shrinking For More Than Three Decades
The Economy-Wide Effective Corporate Tax Rate Has Been Shrinking For More Than Three Decades
The Economy-Wide Effective Corporate Tax Rate Has Been Shrinking For More Than Three Decades
Chart 7US Corporate Taxation Is Not High
Taxing Woke Capital
Taxing Woke Capital
Chart 8Trump Was Unlucky To Be Singled Out By The IRS
Taxing Woke Capital
Taxing Woke Capital
Moreover, the US government often does not even bother to even collect the money that is owed to it. Audits of corporations with more than $20 billion in assets are down 50% since 2011. Audits of individuals with annual income above $1 million are down 80% (Chart 8). In his testimony to the US Senate this week Chuck Rettig, IRS Commissioner, estimated that tax evasion costs the government $1 trillion per year. Reason #2: The failure of Trump’s tax cuts to boost investment spending will make it easier to eventually fully reverse them If the Trump tax cuts had raised investment spending, it would be easier to overlook the negative effect that they had on the budget deficit. The evidence, however, suggests that lower corporate taxes did very little to spur capex. Chart 9 shows that capital spending barely increased as a share of GDP in the two years following the passage of the Tax Cuts and Jobs Act. According to the International Monetary Fund, only one-fifth of the tax cuts were used to finance capital investment and R&D spending.3 Along the same lines, Hanlon, Hoopes, and Slemrod found that fewer than a quarter of S&P 500 companies discussed plans to increase capex in response to lower taxes during their conference calls.4 Chart 9Trump's Tax Cuts Did Little To Spur Investment
Trump's Tax Cuts Did Little To Spur Investment
Trump's Tax Cuts Did Little To Spur Investment
Chart 10Business Equipment And IP Do Not Last Long
Business Equipment And IP Do Not Last Long
Business Equipment And IP Do Not Last Long
Why did corporate investment fail to rise much? One answer is that a tax on profits is not the same thing as a tax on capital investment. As Appendix 1 explains, lower corporate taxes are unlikely to have much of an effect on debt-financed capital spending when interest costs are tax deductible. Unlike long-lived assets such as homes, most of the corporate capital stock is fairly short-lived (Chart 10). The demand for business equipment and software depends more on the outlook for aggregate demand than on the cost of capital. Finally, as we explained in a report entitled Inequality Led To QE, Not The Other Way Around, the majority of corporate profits these days can be attributed to monopolistic power of one form or another. Standard economic theory suggests that taxing monopoly rents will not reduce output or investment. Reason #3: Rising bond yields will make it more expedient to fund spending with higher taxes rather than increased borrowing With interest rates still at exceptionally low levels, there is no immediate need to raise taxes to finance increased government spending. This is especially true for infrastructure spending, which can reasonably be expected to boost economic growth (and hence tax receipts) over the long haul. Chart 11US Interest Payments Will Skyrocket Under The Status Quo
US Interest Payments Will Skyrocket Under The Status Quo
US Interest Payments Will Skyrocket Under The Status Quo
If interest rates were to rise, however, governments would likely find it advantageous to increase taxes rather than face spiralling debt-servicing costs. Public debt levels are very high in the US and in most other economies, so any increase in interest rates would siphon funds from social programs towards bondholders. This would not be popular with voters. The Congressional Budget Office estimates that federal government interest payments will swell rapidly over the coming decades if measures are not taken to rein in budget deficits (Chart 11). As we discuss next, these measures are likely to take the form of higher taxes rather than spending cuts. Reason #4: The political winds are shifting in favor of higher taxes on corporations and the wealthy Democrats have been moving leftward for some time. In 2001, 50% of Democrats said that “government should do more to solve our country’s problems.” Today, that number is 83% (Chart 12). Chart 12Democrats Want More Government
Taxing Woke Capital
Taxing Woke Capital
Chart 13Big Ticket Social And Health Care Spending To Keep Rising
Big Ticket Social And Health Care Spending To Keep Rising
Big Ticket Social And Health Care Spending To Keep Rising
While Republicans continue to show a preference for small government, this may not last. Medicare and Social Security consume over 40% of all federal non-interest spending. Outlays on both programs (Medicare in particular) are set to grow rapidly over the coming years (Chart 13). To the extent that the political preferences of older Americans lean Republican, this could make the GOP more inclined to support higher taxes in order to sustain benefits to the elderly. The fact that corporations and the rich increasingly favor socially liberal policies is leading conservative Republicans to ask why they should continue to support tax cuts for people and companies that seemingly hate them. Whereas Joe Biden won the richest US counties by 20 percentage points last November, Trump saw his support rise in the poorest counties (Chart 14). Reflecting this trend, the share of Republicans who expressed “hardly any confidence in Corporate America” rose from 19% in February 2018 to 30% in March 2021 (Chart 15). Chart 14Democrats Have Made Serious Inroads Among The Better-Off
Taxing Woke Capital
Taxing Woke Capital
Chart 15Republicans Growing More Skeptical Of Corporate CEOs
Taxing Woke Capital
Taxing Woke Capital
More than twice as many Republicans now favor raising corporate taxes as lowering them (Chart 16). Nationally, 73% of Americans are dissatisfied with the influence that corporations have over the nation, a 25-point jump from 2001 (Chart 17). Chart 16More Americans Want To Soak The Rich
Taxing Woke Capital
Taxing Woke Capital
Chart 17Souring Attitudes Toward Big Corporations
Taxing Woke Capital
Taxing Woke Capital
Given the shift in public opinion, it is not too surprising that the Republican response to Biden‘s tax plan was decidedly “low energy”. After a perfunctory condemnation of the plan, Republican leaders quickly pivoted to attacking “woke” corporations. Addressing the corporate reaction to Georgia’s new election law, Senate Republican Leader Mitch McConnell declared “We are witnessing a coordinated campaign by powerful and wealthy people to mislead and bully the American people.” He went on to say, “From election law to environmentalism to radical social agendas to the Second Amendment, parts of the private sector keep dabbling in behaving like a woke parallel government. Corporations will invite serious consequences if they become a vehicle for far-left mobs to hijack our country from outside the constitutional order.” If current trends continue, as we suspect they will, the US corporate sector will be left without a party to defend its interests. Thus, while the near-term outlook for stocks is still bright, the long-term outlook is growing increasingly dim. Peter Berezin Chief Global Strategist pberezin@bcaresearch.com Appendix 1: When Do Higher Taxes On Corporate Profits Reduce Investment? Suppose a company is considering whether to purchase a piece of machinery for $1000. Let us assume that the company faces an external rate of return, r, of 8%. That is to say, it can borrow and lend at 8%. The accompanying table illustrates how the firm’s profits will vary depending on its internal rate of return (the return on investment that the machine will generate). Let us start with the case where the company finances the purchase of the machine by issuing new debt. For now, assume that the internal rate of return is 10% and that the machine can be used indefinitely (i.e., it never depreciates). In this case, the machine will generate $100 in operating income per year. After subtracting the $80 in interest expense, the company will be left with $20 in pre-tax income (Example A). Suppose the company faces an income tax of 20% and interest is fully tax deductible. Then, the company will pay a tax of $20*0.2=$4, leaving it with $16 in after-tax profits (Example B). Notice that while the tax reduced the company’s after-tax profit, it did not extinguish the incentive to purchase the machine in the first place. After all, while $20 is better than $16, $16 is still better than zero. Thus, in this simple example, we see that when the purchase of capital equipment is financed through debt and interest payments are fully tax deductible, the imposition of a profit tax will not affect the ultimate decision of whether to invest or not. Things change when interest is not tax deductible. In this case, the internal rate of return must rise to r/(1-t) to make the company indifferent between buying the machine or not. In the example above, this means the internal rate of return must increase to 8%/(1-0.2)=10%. Then, the company will make an operating profit of $100, pay $20 in tax on that profit, and after paying $80 in interest, end up breaking even (Example C). The calculus in deciding whether to invest in new capital equipment is similar for equity financing as it is for debt financing when interest payments are not tax deductible. The best way to think about equity financing is to ask how much the market price of the machine will be after the company purchases it. If there is no tax and the internal rate of return is 10%, the market price will be $100/0.08=$1250 (Example D). Since the company can buy the machine for $1000, it makes sense to buy it. If the owner of the machine has to pay a profit tax of 20% on the stream of income that it generates, its market value will only be $80/0.08=$1000 (Example E). At this point, the company is indifferent about whether to purchase the machine or not. How do things change when we abandon the assumption that the machine lasts forever? The main difference is that the decision of whether to buy the machine becomes less sensitive to changes in the cost of capital. For example, suppose the machine only lasts one year. To make it worthwhile for the company to purchase that machine, the revenue that it generates in that one year must rise dramatically (Example F). This makes the decision to purchase the machine much less dependent on the interest rate and more dependent on business cycle considerations, especially the outlook for aggregate demand. Appendix Table 1
Taxing Woke Capital
Taxing Woke Capital
Footnotes 1 Jed Graham, “Biden's Tax Plan: What It Means For Amazon, Google, Facebook, Apple, Microsoft,” Investor’s Business Daily (April 8, 2021). 2 “The Accuracy of CBO’s Baseline Estimates for Fiscal Year 2019,” Congressional Budget Office (December 2019). 3 Emanuel Kopp, Daniel Leigh, Susanna Mursula, and Suchanan Tambunlertchai, “U.S. Investment Since the Tax Cuts and Jobs Act of 2017,” IMF Working Paper (May 31, 2019). 4 Michelle Hanlon, Jeffrey L. Hoopes, and Joel Slemrod, “Tax Reform Made Me Do It!” NBER Working Paper 25283 (November 2018). Global Investment Strategy View Matrix
Taxing Woke Capital
Taxing Woke Capital
Special Trade Recommendations
Taxing Woke Capital
Taxing Woke Capital
Current MacroQuant Model Scores
Taxing Woke Capital
Taxing Woke Capital
Highlights Geopolitical risk is rising once again after a big drop-off in risk during the pandemic and snapback. The Biden administration faces three critical foreign policy tests: China/Taiwan, Russia/Ukraine, and Israel/Iran. Russia could stage a military incursion into Ukraine that would cause a risk-off event. However, global markets would get over it relatively quickly since a total invasion of all Ukraine is unlikely. Iran is nearing the “breakout” threshold of uranium enrichment which will prompt more Israeli demonstrations of its red line against nuclear weaponization. Iran will retaliate. So far our view is on track that tensions will escalate prior to the resolution of a US-Iran deal by August. Taiwan is the most market relevant of all geopolitical risks – but the South China Sea is another scene of US-China saber-rattling. A crisis here is most important if connected to Taiwan. Go long CAD-RUB and CHF-GBP. Feature Chart 1Traffic In The World’s Most Dire Straits
Jaw-Jaw Or War-War?
Jaw-Jaw Or War-War?
British Prime Minister Harold Macmillan, quoting Sir Winston Churchill, once said, “Jaw-jaw is better than war-war.”1 President Joe Biden would undoubtedly prefer jaw-jaw as he faces three imminent foreign policy tests that raise tail-risks of war: Chinese military intimidation of Taiwan, a Russian military build-up on the Ukrainian border, and Iranian acceleration of its nuclear program. All of these areas are heating up simultaneously and a crisis incident could easily occur, causing a pullback in bond yields and equity markets. One way of illustrating the seriousness of these conflicts is to look at the volume of global trade that goes through the relevant geographic chokepoints: the Taiwan Strait, the Strait of Malacca, the Strait of Hormuz, and the Bosphorus Strait (Chart 1). Oil and petroleum products serve as a proxy for overall traffic. The recent, short-lived blockage of the Suez Canal provides an inkling of the magnitude of disruption that is possible if conflict erupts in one of these global bottlenecks. In this report we review recent developments in Biden’s foreign policy tests. Our views are mostly on track. Investors should prepare tactically for more geopolitical risk to be priced into global financial markets, motivating safe-haven flows and potentially a general equity pullback. Cyclically the bull market will continue, barring the worst-case scenarios. Biden’s Three Foreign Policy Tests Biden’s three foreign policy tests are all intensifying as we go to press: China/Taiwan: China is continuing a high-intensity pace of “combat drills” and live-fire drills around the island of Taiwan.2 The US is sending a diplomatic delegation to Taiwan against Beijing’s wishes and is set to deliver a relatively large arms sale to the island. Yet Washington has sent John Kerry, its “climate czar,” to Beijing to set up a bilateral summit between Presidents Biden and Xi Jinping for Earth Day, in a bid to find common ground. Biden’s overarching review of US China policy is due sometime in May. Russia/Ukraine: Russia has amassed more than 85,000 troops on its border with Ukraine and in Crimea, the largest build-up since it invaded Ukraine in 2014-15. Russia has withdrawn its ambassador to Washington and warned that it will retaliate if the US imposes any new sanctions. The US is doing just that, with new sanctions leveled in response to Russian cyberattacks and election interference, including a block on sales of Russian ruble-denominated sovereign bonds from June. Hence Russian retaliation is looming. Israel/Iran: Shortly after the March 23 election, Israel sabotaged the underground Natanz Fuel Enrichment Plant in Iran, prompting the Iranians to declare that they will retaliate on Israeli soil. They also claim they will now enrich uranium to a 60% level, which pushes them close to the 90%-plus levels needed to make a nuclear device. American and Israeli officials had previously signaled that Iran would reach “breakout” levels of weapons-grade uranium between April and August. Negotiations are underway but the process will be beset by attacks. We have written extensively on the Taiwan dynamic this year as it is the most relevant for global investors. In this report we will update the Russian and Iranian situations first and then proceed to China. Bottom Line: Geopolitical risk is back after a reprieve during the pandemic. The new US administration faces three serious foreign policy tests at once. Financial markets have mostly ignored the rise in tensions but we expect safe-haven assets to catch a bid in the near term. However, we have not yet altered our bullish cyclical view. So far we are still in the realm of “jaw-jaw” rather than “war-war,” as we explain in the rest of this report. Stay Short Russia And EM Europe The return of the Democratic Party to power in Washington has led to an immediate increase in US-Russian tensions. The Biden administration is eschewing a diplomatic reset and instead pursuing great power competition. The US is increasing its arms sales and NATO military drills with Ukraine. It is imposing sanctions over Russian cyberattacks and election interference, including taking a long-awaited step against the purchase of ruble bonds. Washington could also force Germany to cancel the Nord Stream II pipeline. However, there are also mitigating signs. President Biden has offered to hold a bilateral summit with President Vladimir Putin in a third country and the two may meet at his Earth Day summit. The US Navy also called back the USS Donald Cook and USS Roosevelt destroyers from going into the Black Sea, after Moscow warned that any American warships in that sea would be in danger, especially if they go near Crimea. Washington’s new volley of sanctions are not truly tantamount to Russian interference in American elections and they do not include new measures on Nord Stream II. An American move to insist that Germany cancel Nord Stream before construction ends would provoke Russia to retaliate. The purpose of Nord Stream is to bypass Ukraine and cement direct economic ties between Russia and Germany. Germany’s government continues to support the project despite Russia’s build-up on the border with Ukraine and suppression of political dissidents. If the US vetoes the pipeline then it is denying Russia access to legitimate trade and restricting Russia’s export options to the Ukrainian route. If the US simultaneously increases military cooperation with Ukraine then it is implicitly trying to control Russia’s energy access to Europe. Russia will likely retaliate by punishing Ukraine. Russia could take aggressive action in Ukraine or elsewhere regardless of what the US does on Nord Stream or in its Ukraine outreach. Russia is struggling with a weak domestic economy and social unrest. Moscow has a record of foreign adventurism when popular support wanes. Moreover legislative elections loom in September. Thus Russia may have an independent reason to stir up conflict in Ukraine, at least for the next half year, that cannot be deterred. Judging by capabilities, Russia has deployed enough troops to stage a military incursion into the breakaway Donbass region of Ukraine. The Russian army build-up on the border is the largest since 2014 – large enough to put most of Russian-speaking Ukraine at risk. A full-scale Russian invasion of all of Ukraine is unlikely but not impossible. It would be extremely costly both in blood and treasure – not only in occupying a hostile Ukraine but also in unifying the West against Russia, the opposite of what Moscow is trying to accomplish (Chart 2). Moscow will want to avoid this outcome unless the US shuts down Nord Stream or tries to bring Ukraine into NATO. Chart 2Russia’s Constraints Over Ukraine
Jaw-Jaw Or War-War?
Jaw-Jaw Or War-War?
From the market’s point of view, intensified fighting in Ukraine between the government and Russian-backed rebels is status quo. This is inevitable and will not have a major impact on global equities. The invasion of Crimea in 2014 led to a maximum 2% drawdown in the S&P 500. It was the shooting down of Malaysian Airline 17, not Russia’s invasion of Ukraine, that shook up financial markets in 2014. Global equities fell by 2.7%, Eurostoxx 500 by 6.2% and Russian equities by 10.7%. Note that the Russian military did ultimately participate in the fighting in 2014-15, it was not only Russian-backed separatists, so global financial markets can stomach that kind of conflict fairly well as long as it is limited to Ukraine, especially disputed regions, and as long as the US and NATO do not get involved. They are disinclined to fight for Ukraine, leaving it vulnerable. A larger flight to safety would occur if Russia pursued the total conquest of all of Ukraine. This is small probability but high impact. It would cause a major global risk-off because it would raise the risk of a larger war on the continent for the first time since World War II. Russia is obsessed with Ukraine from the point of view of grand strategy and national security and will take at least some military action if it deems it necessary. Investors should be prepared for escalation – though neither Washington nor Moscow has yet taken a fatal step. It is important to watch for any aggressive Ukrainian actions but Ukraine is not the main driver of action. The current situation is reminiscent of that in the Republic of Georgia in 2008, when Russia provoked President Mikhail Saakashvili into taking action against separatists that Russia then used as a pretext for intervening and breaking away Abkhazia and South Ossetia. While Ukrainian President Volodymyr Zelenskiy could be baited into a conflict, it is also true that fear of getting baited could result in hesitation that allows Russia to seize the initiative, as occurred in Ukraine in 2014. So for the Ukrainians it is “damned if you do, damned if you don’t.” Russia’s actions will largely depend on its own interests. So far Russian equities have lagged other emerging market equities and the commodity rally, which may partly reflect elevated political and geopolitical risk (Chart 3). The trend for Russian equities can easily get worse from here. Given Russia’s interest in conflict with the West ahead of the September elections, Russian-Ukrainian tensions could persist for most of this year. A major military campaign becomes more probable after mid-May when the weather improves. Russian currency and assets will remain under pressure. We recommend going long the Canadian dollar relative to the Russian ruble. The ruble will underperform commodity currencies as a whole, including the Mexican peso, if Russia intervenes militarily, judging by the Crimea conflict in 2014 (Chart 4). Meanwhile Canadian and Mexican currencies should benefit from the fact that the US economy is hyper-stimulated and rapidly vaccinating. Chart 3Russia Lagged Commodity Rally
Russia Lagged Commodity Rally
Russia Lagged Commodity Rally
Chart 4Favor Loonie And Peso Over Ruble
Favor Loonie And Peso Over Ruble
Favor Loonie And Peso Over Ruble
Chart 5Long DM Europe / Short EM Europe
Long DM Europe / Short EM Europe
Long DM Europe / Short EM Europe
We continue to overweight developed Europe and underweight emerging Europe (Chart 5). Poland, Hungary, the Czech Republic, Romania, and the Baltic states will see a risk premium due to current tensions. The Czech Republic faces considerable political uncertainty surrounding its legislative election in October, an opportunity for Russia to interfere or for anti-establishment (albeit pro-EU) parties to rise to power. What would it take for Biden and Putin to de-escalate? The US and NATO could diminish Ukraine relations, downgrade democracy promotion and psychological counter-warfare, and allow Nord Stream to be completed. Russia could reduce its troop presence on the border and lend a helping hand on the Iranian nuclear deal and Afghanistan withdrawal. This is a risk to our view. Bottom Line: Russia and emerging European markets are some of the few truly cheap markets in the emerging market equity universe (Table 1). Yet the current geopolitical context looks to keep them cheap. For now investors should be prepared for the West’s conflict with Russia to escalate in a major way. At minimum we need to know whether the US will halt Nord Stream II’s construction before taking a more bullish view on EM Europe. Table 1Geopolitical Risk Helps Keep Russia And EM Europe Cheap
Jaw-Jaw Or War-War?
Jaw-Jaw Or War-War?
The worst-case scenario of a full-blown Russian conquest of Ukraine has a small probability but cannot be ruled out. Iran Negotiations: First Explosions, Then A Nuclear Deal Israel has not put together a government after its March 23 election, although Prime Minister Benjamin Netanyahu has the opportunity to lead a government again which means no change in national policy so far. Moreover the Israeli public and political establishment are unified in their opposition to Iran’s regional and nuclear ambitions. Immediately after the Iranians inaugurated new centrifuges at the Natanz nuclear facility, on April 11, the Israelis allegedly sabotaged the facility underground facility in an attack that was supposedly not limited to cyber means and that deactivated a range of centrifuges. An Iranian scientist fell into a crater and hurt himself. The Iranians have vowed retaliation on Israeli soil. More fundamentally their politics are shifting in a hardline direction, to be confirmed with the election of a hawkish president in June, which will exacerbate the mutual antagonism. This power transition is a major reason we have identified the inauguration in August as a key deadline for the US to rejoin the 2015 nuclear deal (the Joint Comprehensive Plan of Action). If the Biden administration cannot get it done by that time then a much more dangerous, multi-year negotiation will get underway. The Israeli attack has not stopped negotiations in the short term, however. The second round of talks begins in Vienna as we go to press. The US has also confirmed it will withdraw from Afghanistan on September 11, which says to Iran that Biden is determined to reduce the US’s strategic footprint in the region, reinforcing the US desire for a deal. The Israelis will continue to underscore their red line against the Iranian nuclear and missile programs in the coming months through clandestine attacks. However, they were not able to stop the US from signing a nuclear deal with Iran in 2015 and they are not likely to stop the US today. They are still bound by a fundamental constraint. Israel needs to maintain its alliance with the United States, which ensures its long-term security against both Iran and the Middle East’s general instability (Chart 6). The Iranians will retaliate against Israel, making it likely that this summer will feature tit-for-tat attacks. These could include critical infrastructure. Iran may also continue its campaign against enemies in Iraq and Saudi Arabia, thus triggering unplanned oil outages and pushing up the oil price. A glance at Israeli, Saudi Arabian, and UAE stock markets suggests that global investors have largely ignored the geopolitical risks so far but may be starting to respond to the likely escalation in conflict prior to any US-Iran deal (Chart 7). Chart 6Israel’s Constraints Over Iran
Jaw-Jaw Or War-War?
Jaw-Jaw Or War-War?
The US, Germany, France, Russia, and China are all officially on board with getting the Iranians back into compliance with the deal. A return to compliance would need to be phased with US sanctions relief. The Iranians demand that the US ease sanctions first, since it was the US that unilaterally walked away from the deal and re-imposed sanctions in 2018. Chart 7Saudi, UAE, Israeli Stocks Signal Danger
Saudi, UAE, Israeli Stocks Signal Danger
Saudi, UAE, Israeli Stocks Signal Danger
Ultimately Biden is capable of making the first move since the American public shows very little concern about Iran. Biden himself is acting on behalf of a strong consensus in Washington that an Iranian deal is necessary to stabilize the region and enable the US to devote more strategic attention to Asia Pacific. Will Russia and China support the Iranian deal, given their simultaneous conflicts with the United States? As long as the US and Iran are satisfied with returning to the existing deal – which begins to expire in 2025 – there is little need for Russia or China to do anything. However, if Washington wants a better deal, then it will have to make major concessions to Moscow and Beijing. A new and better deal would require years to negotiate. Chart 8Russo-Chinese Cooperation Grows
Jaw-Jaw Or War-War?
Jaw-Jaw Or War-War?
Russia and China supported the original nuclear deal because they saw an opportunity to limit the proliferation of nuclear weapons, which dilutes their own power. A Middle Eastern nuclear arms race is not in their interest. Iran is also a useful strategic partner for Russia and China in the Middle East and they are not averse to seeing Iran’s economy grow stronger in order to perpetuate its regime. They are wagering that liberalization of the Iranian economy will not result in liberalization of its politics – it certainly did not in the case of Russia or China – and therefore they will still have an ally but it will be more economically sound and influential. The Russo-Chinese strategic partnership has grown dramatically over the past decade. Both countries share an interest in undermining US global leadership and stoking American internal divisions. Both share an interest in reducing the US military presence near their borders, particularly in strategic territories and seas that they consider essential to their security and political legitimacy. Russia increasingly depends on Chinese demand for its exports and Chinese investment for developing its resources. Neither country trusts the other’s currency for trade but both have a shared interest in diversifying away from the US dollar (Chart 8). Chart 9China Offers Helping Hand On Iran?
China Offers Helping Hand On Iran?
China Offers Helping Hand On Iran?
In cooperating with the US on Iran, Russia and China will expect the US to respect their demands on strategic areas much closer to their core interests. If the Biden administration continues to upgrade its trade and defense relations with Ukraine and Taiwan then Moscow and Beijing will push back aggressively and could at that point prevent or undermine any deal with Iran. China is at least officially enforce sanctions on Iran (Chart 9). Its strategic partnership with Iran is constantly in a state of negotiation – until the US clarifies its sanctions regime. Clearly China hopes to extract concessions from the Americans for cooperation on nuclear threats. This is also the case with North Korea, where a missile crisis would be useful for China’s purposes in creating the need for Chinese arbitration. China sees a chance to persuade Biden to remove restrictions imposed by President Trump. If the Biden administration’s hawkishness on China is confirmed in the coming months, then China’s willingness to cooperate will presumably change. Bottom Line: Israel is underscoring its red lines against Iranian nuclear weaponization and this will cause an increase in conflict this spring and summer. But it is not yet preventing the US and Iran from renegotiating the 2015 nuclear deal. We still expect Biden to agree to a deal by August. Taiwan And The South China Sea For global financial markets the most important test facing Biden lies in the US-China relationship and tensions over the Taiwan Strait. We will not rehash our recent research and arguments on this issue. Suffice it to say that we see a 60% chance of some kind of crisis over the next 12-24 months, including a 5% chance of full-scale war. The odds of total war can rise rapidly in the event of domestic Chinese instability, a game-changing US arms sale, or a Taiwanese declaration of independence. The greatest deterrent to a full Chinese attack on Taiwan – the reason for our current 5% odds – is that it would result in a devastating blowback against the Chinese economy. China’s trade with the developed world, in addition to Taiwan, makes up 63% of exports, or 11% of GDP (Chart 10). Beijing is ultimately willing to pay this price – or any price – to “unify” the country. But it will not do so frivolously. Each passing year gives China greater global economic leverage and greater military capability over Taiwan. Chart 10China’s Constraints Over Taiwan
Jaw-Jaw Or War-War?
Jaw-Jaw Or War-War?
China is increasing its purchases of US treasuries, which waned during the trade war (Chart 11). China often increases purchases when interest rates rise and markets have seen a rapid increase in treasury yields since the vaccine discovery in November. There is no indication from this point of view that China is preparing for outright war with the United States, although this is admittedly a limited measure that could be misleading. What about a crisis other than war? What do we mean when we say “some kind of crisis” over Taiwan? A major gray zone would be economic sanctions or an economic embargo. While China cut back on tourism after Taiwan’s nominally pro-independence party won the election in 2016, and all tourism ground to a halt with COVID-19, there is no evidence of a broader embargo so far (Chart 12). This could change overnight. While US law forbids an embargo on Taiwan, this is precisely an area where Beijing might wish to test the US’s commitment. Chart 11China Buys More US Treasuries
China Buys More US Treasuries
China Buys More US Treasuries
The current high pressure on Taiwan stems in large part from the confluence of new US export controls and the global semiconductor shortage. China cannot yet meet its domestic demand for semiconductors and it cannot develop advanced computer chips fast enough without the US and its allies (Chart 13). Chart 12No Embargo On Taiwan (Yet)
No Embargo On Taiwan (Yet)
No Embargo On Taiwan (Yet)
If the Biden administration pursues a full technological blockade then China may be forced to take tougher action on Taiwan. But if Biden pursues a more defensive strategy then a new equilibrium will develop that spares China the risks of war. Chart 13China's Demand For Semiconductors
China's Demand For Semiconductors
China's Demand For Semiconductors
The US and China are simultaneously escalating their naval confrontation in the South China Sea, particularly around the Philippines. US and Chinese aircraft carrier groups and other ships have been circling each other as Beijing attempts to intimidate the Philippines and shake its trust in the defense treaty with the US. China claims the South China Sea as its own – and its efforts to deny the US access will be met with US assertions of freedom of navigation, which could lead to sunken ships. The strategic importance of the South China Sea is similar to that of the Taiwan Strait: Chinese control of these bodies of water would threaten Taiwan’s, Japan’s, and South Korea’s supply security while weakening America’s strategic position in the region. We have long highlighted the elevated risks of proxy war for Vietnam and the Philippines but these are hardly issues of global concern compared with Northeast Asia’s security. While Taiwan is far more relevant to global investors, due to the semiconductor issue, there are ample opportunities for a crisis to erupt in the South China Sea. A crisis in this sea cannot be dismissed as marginal because it could involve direct US-China conflict or, worst case, it could be a prelude to action on Taiwan, as China would seek to control the approaches to the island. The final risk in this region is that North Korea has restarted ballistic missile tests. As stated above, a crisis would be well-timed from China’s point of view. For investors, however, North Korea is largely a distraction from the critical Taiwan Strait. It could feed into any risk-off sentiment. Bottom Line: US-China relations are still unsettled and a clash could emerge over the South China Sea and Korean peninsula just as it could emerge over the Taiwan Strait. The Taiwan Strait remains the most significant geography. A direct US-China clash in the South China Sea could cause a global selloff but the markets would recover quickly, unless it is linked to a conflict over Taiwan. Investment Takeaways Geopolitical risk is reviving after a reprieve during the COVID-19 pandemic. That does not mean that frictions will lead straight into war. Diplomacy is possible. If the US, China, Russia, and Iran choose “jaw-jaw” over “war-war” then the global equity rally will see another leg up. From a tactical point of view, however, our arguments above should demonstrate that at least one of Biden’s early foreign policy tests is likely to escalate into a geopolitical incident that prompts negative impacts either in regional or global equity markets. Markets are not prepared for these risks to materialize. Standard measures of global policy uncertainty have fallen sharply for most countries. It is notable that two of the few countries in the world seeing rising policy uncertainty are China and Russia. The latter is likely due to domestic instability – which is a major motivator for an aggressive foreign policy (Chart 14). Chart 14AGlobal Policy Uncertainty Will Revive
Global Policy Uncertainty Will Revive
Global Policy Uncertainty Will Revive
Chart 14BGlobal Policy Uncertainty Will Revive
Global Policy Uncertainty Will Revive
Global Policy Uncertainty Will Revive
Global fiscal stimulus remains exceedingly strong – it is likely to peak this year. Chart 15 shows the latest update in fiscal stimulus for select countries, comparing the COVID-19 crisis to the 2008 financial crisis. There are some notable changes to previous versions of this chart, mostly due to revisions in GDP after last year’s shock, revisions in tax revenues due to the rapid economic snapback, and revisions to the timing and size of stimulus packages. The Biden administration’s $2.3 trillion infrastructure plan is obviously not included. The second panel of Chart 15 shows the changes in the IMF’s estimates from October 2020 to April 2021. Essentially the fiscal stimulus in 2020 was overestimated, as many measures did not kick in and the economic snapback was better than expected, whereas the 2021 stimulus is larger than expected. Russia and China are notable for tightening policy sooner than others – leading to a reduction in IMF estimates of fiscal stimulus for both years. Chart 15Revising Our Global Fiscal Stimulus Chart
Jaw-Jaw Or War-War?
Jaw-Jaw Or War-War?
Commodities have been a major beneficiary of the global recovery (Chart 16). Chinese growth is likely to decelerate this year which will spark a pullback, even aside from geopolitical crises. However, from a cyclical perspective commodities, especially industrial metals, should benefit from limited supply and surging demand. Geopolitical crises and even wars would first be negative but then positive for metals. Chart 16Commodities To Benefit From Geopolitical Conflict
Commodities To Benefit From Geopolitical Conflict
Commodities To Benefit From Geopolitical Conflict
Notably the US is embracing industrial policy alongside China and the EU. In particular the US is joining the green energy race with Biden’s $2.3 trillion American Jobs Plan containing about $370 billion in green initiatives and likely to pass Congress later this year. Symbolically Biden will emphasize the US’s attempt to catch up with Chinese and European green initiatives via his hosting of a global summit on April 22-23 for Earth Day. A brief word on the British pound. We took a tactical pause on our cyclically bullish view of the pound in February in anticipation of the Scottish parliamentary election on May 6. A strong showing by the Scottish National Party could lead to a second independence referendum. This party is flagging in the polls but independence sentiment has ticked back up, reinforcing our point that a nationalist surprise could take place at the ballot box (Chart 17). Once we have clarity on the prospect of a second referendum we will have a clearer view on the pound over the medium term. Chart 17Pound Sees Short-Term Risk From Scots Election
Pound Sees Short-Term Risk From Scots Election
Pound Sees Short-Term Risk From Scots Election
Chart 18Long CHF-GBP For A Tactical Trade
Long CHF-GBP For A Tactical Trade
Long CHF-GBP For A Tactical Trade
In the near term, we continue to pursue tactical safe-haven trades and hedges. Our tactical long Swiss franc trade was stopped out at 5% on March 25. But our Foreign Exchange Strategist Chester Ntonifor has since highlighted that the franc is excessively cheap (Chart 18). This time we recommend a tactical long CHF-GBP, which has an attractive profile in the context of geopolitical risk, taken together with the British political risk highlighted above. Matt Gertken Vice President Geopolitical Strategy mattg@bcaresearch.com Footnotes 1 “Jaw-Jaw Is Best, Macmillan Finds,” New York Times, January 30, 1958, nytimes.com. 2 Taiwan – Province of China.
Highlights Stronger global growth in the wake of continued and expected fiscal and monetary stimulus, and progress against COVID-19 are boosting oil demand assumptions by the major data suppliers for this year. We lifted our 2021 global demand estimate by 640k b/d to 98.25mm b/d, and assume OPEC 2.0 will make the necessary adjustments to keep Brent prices closer to $60/bbl than not, so as not to disrupt a fragile recovery. We are maintaining our 2022 and 2023 Brent forecasts at $65/bbl and $75/bbl. Commodity markets are ignoring the rising odds of armed conflict involving the US, Russia and China and their clients and allies. Russia has massed troops on Ukraine’s border and warned the US not to interfere. China has massed warships off the coast of the Philippines, and continues its incursions in Taiwan’s air-defense zone, keeping US forces on alert. Intentional or accidental engagement would spike oil prices. Two-way price risk abounds. In addition to the risk of armed hostilities, faster distribution of vaccines would accelerate recovery and boost prices above our forecasts. Downside risk of a resurgence in COVID-19-induced lockdowns remains, as rising death and hospitalization rates in Brazil, India and Europe attest (Chart of the Week). Feature Oil-demand estimates – ours included – are reviving in the wake of measurable progress in combating the COVID-19 pandemic in major economies, and an abundance of fiscal and monetary stimulus, particularly out of the US.1 On the back of higher IMF GDP projections, we lifted our 2021 global demand estimate by 640k b/d to 98.25mm b/d in this month’s balances. In our modeling, we assume OPEC 2.0 will make the necessary adjustments to keep Brent prices closer to $60/bbl than not, so as not to disrupt a fragile recovery. In an unusual turn of events, the early stages of the recovery in oil demand will be led by DM markets, which we proxy using OECD oil consumption (Chart 2). Thereafter, EM economies, re-take the growth lead next year and into 2023. Chart of the WeekCOVID-19 Deaths, Hospitalizations Threaten Global Recovery
Upside Oil Price Risks Are Increasing
Upside Oil Price Risks Are Increasing
Chart 2DM Demand Surges This Year
DM Demand Surges This Year
DM Demand Surges This Year
Absorbing OPEC 2.0 Spare Capacity We continue to model OPEC 2.0, the producer coalition led by the Kingdom of Saudi Arabia (KSA) and Russia, as the dominant producer in the market. The growth we are expecting this year will absorb a significant share of OPEC 2.0’s spare capacity, most of which – ~ 6mm b/d of the ~ 8mm b/d – is to be found in KSA (Chart 3). The core producers’ spare capacity allows them to meet recovering demand faster than the US shale producers can mobilize rigs and crews and get new supply into gathering lines and on to main lines. We model the US shale producers as a price-taking cohort, who will produce whatever the market allows them to produce. After falling to 9.22mm b/d in 2020, we expect US production to recover to 9.56mm b/d this year, 10.65mm b/d in 2022, and 11.18mm in 2023 (Chart 4). Lower 48 production growth in the US will be led by the shales, which will account for ~ 80% of total US output each year. Chart 3Core OPEC 2.0 Spare Capacity Will Respond First To Higher Demand
Core OPEC 2.0 Spare Capacity Will Respond First To Higher Demand
Core OPEC 2.0 Spare Capacity Will Respond First To Higher Demand
Chart 4Shale Is The Marginal Barrel In The Price Taking Cohort
Shale Is The Marginal Barrel In The Price Taking Cohort
Shale Is The Marginal Barrel In The Price Taking Cohort
OPEC 2.0’s dominant position on the supply side allows it to capture economic rents before non-coalition producers, which will remain a disincentive to them until the spare capacity is exhausted. Thereafter, the price-taking cohort likely will fund much of its E+P activities out of retained earnings, given their limited ability to attract capital. Equity investors will continue to demand dividends that can be maintained and grown, or return of capital via share buybacks. This will restrain production growth to those firms that are profitable. We expect the OPEC 2.0 coalition’s production discipline will keep supply levels just below demand so that inventories continue to fall, just as they have done during the COVID-19 pandemic, despite the demand destruction it caused (Chart 5). These modeling assumptions lead us to continue to expect supply and demand will continue to move toward balance into 2023 (Table 1). Chart 5Supply-Demand Balances in 2021
Supply-Demand Balances in 2021
Supply-Demand Balances in 2021
Table 1BCA Global Oil Supply - Demand Balances (MMb/d, Base Case Balances)
Upside Oil Price Risks Are Increasing
Upside Oil Price Risks Are Increasing
We continue to expect this balancing to induce persistent physical deficits, which will keep inventories falling into 2023 (Chart 6). As inventories are drawn, OPEC 2.0’s dominant-producer position will allow it to will keep the Brent and WTI forward curves backwardated (Chart 7).2 We are maintaining our 2022 and 2023 Brent forecasts at $65/bbl and $75/bbl (Chart 8). Chart 6OPEC 2.0 Policy Continues To Keep Supply Below Demand...
OPEC 2.0 Policy Continues To Keep Supply Below Demand...
OPEC 2.0 Policy Continues To Keep Supply Below Demand...
Chart 7OECD Inventories Fall to 2023
OECD Inventories Fall to 2023
OECD Inventories Fall to 2023
Chart 8Brent Forecasts Rise As Global Economy Recovers
Brent Forecasts Rise As Global Economy Recovers
Brent Forecasts Rise As Global Economy Recovers
Two-Way Price Risk Abounds Risks to our views abound on the upside and the downside. To the upside, the example of the UK and the US in mobilizing its distribution of vaccines is instructive. Both states got off to a rough start, particularly the US, which did not seem to have a strategy in place as recently as January. After the US kicked its procurement and distribution into high gear its vaccination rates soared and now appear to be on track to deliver a “normal” Fourth of July holiday in the US. The UK has begun its reopening this week. Both states are expected to achieve herd immunity in 3Q21.3 The EU, which mishandled its procurement and distribution likely benefits from lessons learned in the UK and US and achieves herd immunity in 4Q21, according to McKinsey’s research. Any acceleration in this timetable likely would lead to stronger growth and higher oil prices. The next big task for the global community will be making vaccines available to EM economies, particularly those in which the pandemic is accelerating and providing the ideal setting for mutations and the spread of variants that could become difficult to contain. The risk of a resurgence in large-scale COVID-19-induced lockdowns remains, as rising death and hospitalization rates in Brazil, India and Europe attest. Cry Havoc The other big upside risk we see is armed conflict involving the US, Russia, China and their clients and allies. Commodity markets are ignoring these risks at present. Even though they do not rise to the level of war, the odds of kinetic engagement – planes being shot down or ships engaging in battle in the South China Sea – are rising on a daily basis. This is not unexpected, as our colleagues in BCA Research’s Geopolitical Strategy pointed out recently.4 Indeed, our GPS service, led by Matt Gertken, warned the Biden administration would be tested in this manner by Russia and China from the get-go. Russia has massed troops on Ukraine’s border and warned the US not to interfere. China has massed warships off the coast of the Philippines, and continues its incursions in Taiwan’s air-defense zone, keeping US forces on alert. Political dialogue between the US and Russia and the US and China is increasingly vitriolic, with no sign of any leavening in the near future. Intentional or accidental engagement could let slip the dogs of war and spike oil prices briefly. Finally, OPEC 2.0 is going to have to accommodate the “official” return of Iran as a bona fide oil exporter, if, as we expect, it is able to reinstate its nuclear deal – i.e., the Joint Comprehensive Plan of Action (JCPOA) – with Western states, which was abrogated by then-President Donald Trump in 2018. This may prove difficult, given our view that the oil-price collapse of 2014-16 was the result of the Saudis engineering a market-share war to tank prices, in an effort to deny Iran $100+ per-barrel prices that had prevailed between end-2010 and mid-2014. OPEC 2.0, particularly KSA, has not publicly involved itself in the US-Iran negotiations. However, it is worthwhile recalling that following the disastrous market-share war launched in 2014, KSA and the rest of OPEC 2.0 did accommodate Iran’s return to markets post-JCPOA. Robert P. Ryan Chief Commodity & Energy Strategist rryan@bcaresearch.com Ashwin Shyam Research Associate Commodity & Energy Strategy ashwin.shyam@bcaresearch.com Commodities Round-Up Energy: Bullish Brent and WTI prices rallied sharply following the release of the EIA’s Weekly Petroleum Status Report showing a 9.1mm-barrel decline in US crude and product stocks for the week ended 9 April 2021. This was led by a huge draw in commercial crude and distillate inventories (5.9mm barrels and 2.1mm barrels, respectively). These draws came on the back of generally bullish global demand upgrades by the major data services (EIA, IEA and OPEC) over the past week. These assessments were supported by EIA data showing refined-product demand – i.e., “product supplied” – jumped 1.1mm b/d for the week ended 9 April. With vaccine distributions picking up steam, despite setbacks on the Johnson & Johnson jab, the storage draws and improved demand appear to have catalyze the move higher. Continued weakness in the USD also provided a tailwind, as did falling real interest rates in the US. Base Metals: Bullish Nickel prices fell earlier this week, as China’s official Xinhua news agency reported that Chinese Premier, Li Keqiang stressed the need to strengthen raw materials’ market regulation, amidst rising commodities prices, which been pressuring corporate financial performance (Chart 9). This statement came after China’s top economic advisor, Liu He also called for authorities to track commodities prices last week. Nickel prices fell by around $500/ ton earlier this week on this news, and were trading at $16,114.5/MT on the London Metals exchange as of Tuesday’s close. Other base metals were not affected by this news. Precious Metals: Bullish The US dollar and 10-year treasury yields fell after March US inflation data was released earlier this week. US consumer prices rose by the most in nearly nine years. The demand for an inflation hedge, coupled with the falling US dollar and treasury yields, which reduce the opportunity cost of purchasing gold, caused gold prices to rise (Chart 10). This uncertainty, coupled with the increasing inflationary pressures due to the US fiscal stimulus will increase demand for gold. Spot COMEX gold prices were trading at $1,746.20/oz as of Tuesday’s close. Ags/Softs: Neutral The USDA reported ending stocks of corn in the US stood at 1.35 billion bushels, well below market estimates of 1.39 billion and the 1.50 billion-bushel estimate by the Department last month, according to agriculture.com’s tally. Global corn stocks ended at 283.9mm MT vs a market estimate of 284.5mm MT and a Department estimate of 287.6mm MT. Chart 9Base Metals Are Being Bullish
Base Metals Are Being Bullish
Base Metals Are Being Bullish
Chart 10Gold Prices To Rise
Gold Prices To Rise
Gold Prices To Rise
Footnotes 1 Please see US-Russia Pipeline Standoff Could Push LNG Prices Higher, which we published on 8 April 2021 re the IMF’s latest forecast for global growth. Briefly, the Fund raised its growth expectations for this year and next to 6% and 4.4%, respectively, nearly a full percentage-point increase versus its January forecast update for 2021 2 A backwardated forward curve – prompt prices trading in excess of deferred prices – is the market’s way of signaling tightness. It means refiners of crude oil value crude availability right now over availability a year from now. This is exactly the same dynamic that drives an investor to pay $1 today for a dollar bill delivered tomorrow than for that same dollar bill delivered a year from now (that might only fetch 98 cents today, e.g.). 3 Please see When will the COVID-19 pandemic end?, published 26 March 2021 by McKinsey & Co. 4 Please see The Arsenal Of Democracy, a prescient analysis published 2 April 2021 by BCA’s Geopolitical Strategy. The report notes the Biden administration “still faces early stress-tests on China/Taiwan, Russia, Iran, and even North Korea. Game theory helps explain why financial markets cannot ignore the 60% chance of a crisis in the Taiwan Strait. A full-fledged war is still low-probability, but Taiwan remains the world’s preeminent geopolitical risk.” Investment Views and Themes Recommendations Strategic Recommendations Tactical Trades Commodity Prices and Plays Reference Table Trades Closed in 2021 Summary of Closed Trades
Higher Inflation On The Way
Higher Inflation On The Way
Highlights On a timeframe of a few years, a net deflationary shock is a near-certainty even if we do not know its precise nature or its precise timing. Hence, investors must build such a deflationary shock or shocks into their long-term investment strategy. Specifically: The 10-year T-bond yield will ultimately reach zero, and the 30-year T-bond yield will ultimately reach 0.5 percent. For patient investors, this presents a mouth-watering 100 percent return on the long-duration T-bond. The structural bull market in equities will continue until T-bond yields reach their ultimate low. Patient equity investors should steer towards ‘growth’ sectors that will surge on the ultimate low in T-bond yields. Fractal trade shortlist: Taiwan versus China, Netherlands versus China, and Sweden versus Finland. Feature Chart I-1For Long-Term Investors, A Shock Is A Near-Certainty
How To Predict Shocks
How To Predict Shocks
Predicting shocks is easy. The precise nature and timing of shocks is not predictable, but the statistical distribution of shocks is highly predictable. This means that the longer our investment timeframe, the more certain we are of encountering at least one shock – even if we cannot predict its precise nature or timing. Many economists and strategists blame their forecasting errors on shocks, such as the pandemic, which they point out are ‘unforecastable.’ Absent the shocks, they argue, their predictions of the economy and the markets would have turned out right. This is a valid excuse for short-term forecasting errors, but it is not a valid excuse for long-term forecasting errors. On a long-term horizon, encountering a major shock, or several major shocks, is a near-certainty. Hence, economists and strategists who are not incorporating the well-defined statistical distribution of shocks into their long-term investment forecasts and strategies are making a mistake. Individual Shocks Are Not Predictable In the 21 years of this century so far, there have been five shocks whose economic/financial consequences have been felt worldwide: the dot com bust (2000); the global financial crisis (2007/8); the euro debt crisis (2011/12); the emerging markets recession (2014/15); and the global pandemic (2020). To these we can add two wide-reaching political shocks: the Brexit vote (2016); and Donald Trump’s shock victory in the US presidential election (2016). In total, this constitutes seven shocks, four economic/financial, two political, and one natural (Chart I-2). Chart I-2The Seven Global Shocks Of The Century (So Far)
The Seven Global Shocks Of The Century (So Far)
The Seven Global Shocks Of The Century (So Far)
Some people argue that economic/financial shocks are predictable, because they arise from vulnerabilities in the economy or financial markets, which should be easy to spot. Unfortunately, though such vulnerabilities are obvious in hindsight, the greatest economic minds cannot see them in real time. The greatest economic minds cannot see economic vulnerabilities. Infamously, on the eve of the global financial crisis, Ben Bernanke was insisting that “there’s not much indication that subprime mortgage issues have spread into the broader mortgage market.” Equally infamously, on the eve of the euro debt crisis, Mario Draghi was asking “what makes you think that the ECB must become lender of last resort to governments to keep the eurozone together?” (Chart I-3 and Chart I-4) Chart I-3Bernanke Couldn't See The GFC
Bernanke Couldn't See The GFC
Bernanke Couldn't See The GFC
Chart I-4Draghi Couldn't See The Euro Debt Crisis
Draghi Couldn't See The Euro Debt Crisis
Draghi Couldn't See The Euro Debt Crisis
Which begs the question, what is the current vulnerability that today’s great economic minds cannot see? As we have documented many times, most recently in The Rational Bubble Is Turning Irrational, the current vulnerability is the exponential relationship between rising bond yields and the risk premiums on equities and other risk-assets (Chart I-5 and Chart I-6). Meaning that $500 trillion of risk-assets are vulnerable to any substantial further rise in bond yields. Chart I-5A 1.5 Percent Decline In The Bond Yield Had A Smaller Impact On The Earnings Yield When The Bond Yield Started At 4 Percent...
A 1.5 Percent Decline In The Bond Yield Had A Smaller Impact On The Earnings Yield When The Bond Yield Started At 4 Percent...
A 1.5 Percent Decline In The Bond Yield Had A Smaller Impact On The Earnings Yield When The Bond Yield Started At 4 Percent...
Chart I-6...Than When The Bond Yield Started ##br##At 3 Percent
...Than When The Bond Yield Started At 3 Percent
...Than When The Bond Yield Started At 3 Percent
The second type of shock – political shocks – should be predictable as they mostly arise from well-defined events such as elections and referenda, which an army of political experts analyses ad nauseam. Yet the greatest political minds could not see Brexit or President Trump coming. Indeed, even ‘Team Brexit’ didn’t see Brexit coming, because it had no plan on how to implement Brexit once the vote was won. The third type of shocks – natural shocks – are clearly unpredictable as individual events. Nobody knows when the next major pandemic, earthquake, volcano eruption, tsunami, solar flare, or asteroid strike is going happen. Yet, to repeat, while the precise nature and timing of shocks is not predictable, the statistical distribution of shocks is highly predictable. The Statistical Distribution Of Shocks Is Highly Predictable The good news is that shocks follow well-defined statistical ‘power laws’ which allow us to accurately forecast how many shocks to expect in any long timeframe. The 7 shocks experienced through the past 21 years equates to a shock every three years on average, or 3.33 shocks in any 10-year period. The expected wait to the next shock is three years. The next few paragraphs delve into some necessary mathematics, but don’t worry, you don’t need to understand the maths to appreciate the key takeaways. If the past 21 years is representative, we propose that the number of shocks in any 10-year period follows a so-called Poisson distribution with parameter 3.33. From this distribution, it follows that the probability of going through a 5-year period without a shock is just 19 percent, and the probability of going through a 10-year period without a shock is a negligible 4 percent (Chart of the Week). The result is that if you are a long-term investor, then encountering a shock is a near-certainty and should be built into your investment strategy. How can we test our assumption that the number of shocks follows a Poisson distribution? The maths tells us that if the number of shocks follows a Poisson distribution with parameter 3.33, then the ‘waiting time’ between shocks follows a so-called Exponential distribution also with parameter 3.33. On this basis, 63 percent of the waits between shocks should be up to three years, 23 percent should be four to six years, and 14 percent should be over six years. Now we can compare this expected distribution with the actual distribution of waits between the 7 shocks encountered so far in this century. We find that the theory lines up closely with the practice, validating our assumption of a Poisson distribution (Chart I-7 and Chart I-8). Chart I-7The Theoretical Waiting Time Between Shocks…
How To Predict Shocks
How To Predict Shocks
Chart II-8…Is Close To The Actual Waiting Time Between Shocks
How To Predict Shocks
How To Predict Shocks
To repeat the key takeaways, on a long-term timeframe, encountering at least one shock is a near-certainty, and the expected wait to the next shock is three years. A Shock Is A Near-Certainty, And It Will End Up Deflationary Nevertheless, there remains a pressing question: Will the next shock(s) be deflationary or reflationary? It turns out that all shocks end up with both deflationary and reflationary components: either a deflationary impulse followed by a reflationary backlash or, as we highlighted in The Road To Inflation Ends At Deflation, a reflationary impulse followed by a deflationary backlash. But the crucial point is that the deflationary component will swamp the reflationary component. In the seven shocks of this century so far, six have been deflationary impulses with a weaker reflationary backlash; and one – the reflation trade of 2017-18 – was a reflationary impulse with a stronger deflationary backlash. It is our high conviction view that in the next shock(s), the deflationary component will continue to hold the upper hand (Chart I-9). Chart I-9Each Shock Has A Deflationary And Reflationary Component... But The Deflationary Component Tends To Dominate
Each Shock Has A Deflationary And Reflationary Component... But The Deflationary Component Tends To Dominate
Each Shock Has A Deflationary And Reflationary Component... But The Deflationary Component Tends To Dominate
The simple reason is that as financial asset prices, real estate prices, and debt servicing costs get addicted to ever lower bond yields, the economy and financial markets cannot tolerate bond yields reaching previous tightening highs and, just like all addicts, need a new extreme loosening to feel any stimulus. This means that when the next shock comes – as it surely will – it will require lower lows and lower highs in the bond yield cycle. Let’s sum up. On a timeframe of a few years, a shock is a near-certainty even if we do not know its precise nature – economic/financial, political, or natural – or its precise timing. Furthermore, the shock will be net deflationary. Hence, investors must build such a deflationary shock or shocks into their long-term investment strategy. Specifically: The 10-year T-bond yield will eventually reach zero, and the 30-year T-bond yield will ultimately reach 0.5 percent. For patient investors, this constitutes a mouth-watering 100 percent return on the long-duration T-bond. The 10-year T-bond yield will eventually reach zero. The structural bull market in equities will continue until T-bond yields reach their ultimate low. Patient equity investors should tilt towards ‘growth’ sectors that will surge on the ultimate low in T-bond yields. Candidates For Countertrend Reversals This week we have noticed an unusual decoupling among the tech-heavy markets of Taiwan, Netherlands, and China (Chart I-10). Chart I-10An Unusual Decoupling Between Tech-Heavy Netherlands And China
An Unusual Decoupling Between Tech-Heavy Netherlands And China
An Unusual Decoupling Between Tech-Heavy Netherlands And China
Among these three markets, the strong short-term outperformance of both Taiwan and Netherlands are due to supply bottlenecks in the semiconductor sector that have boosted Taiwan Semiconductor Manufacturing and ASML, but we expect these bottlenecks ultimately to resolve. On this basis and combined with extremely fragile 130-day fractal structures, Taiwan versus China and Netherlands versus China are vulnerable to reversals (Chart I-11 and Chart I-12). Chart I-11Underweight Taiwan Versus China
Underweight Taiwan Versus China
Underweight Taiwan Versus China
Chart I-12Underweight Netherlands Versus China
Underweight Netherlands Versus China
Underweight Netherlands Versus China
Our first recommended trade is to underweight Netherlands versus China, setting a profit target and symmetrical stop-loss at 5 percent. Another outperformance that looks fragile on its 130-day fractal structure is Sweden versus Finland, driven by industrials and financials versus energy and materials (Chart I-13). Chart I-13Underweight Sweden Versus Finland
Underweight Sweden Versus Finland
Underweight Sweden Versus Finland
Our second recommended trade is to underweight Sweden versus Finland, setting a profit target and symmetrical stop-loss at 4.7 percent. Dhaval Joshi Chief Strategist dhaval@bcaresearch.com Fractal Trading System Fractal Trades 6-Month Recommendations Structural Recommendations Closed Fractal Trades Asset Performance Equity Market Performance Indicators To Watch - Bond Yields Chart II-1Indicators To Watch - Bond Yields - ##br##Euro Area
Indicators To Watch - Bond Yields - Euro Area
Indicators To Watch - Bond Yields - Euro Area
Chart II-2Indicators To Watch - Bond Yields - ##br##Europe Ex Euro Area
Indicators To Watch - Bond Yields - Europe Ex Euro Area
Indicators To Watch - Bond Yields - Europe Ex Euro Area
Chart II-3Indicators To Watch - Bond Yields - ##br##Asia
Indicators To Watch - Bond Yields - Asia
Indicators To Watch - Bond Yields - Asia
Chart II-4Indicators To Watch - Bond Yields - ##br##Other Developed
Indicators To Watch - Bond Yields - Other Developed
Indicators To Watch - Bond Yields - Other Developed
Indicators To Watch - Interest Rate Expectations Chart II-5Indicators To Watch - Interest Rate Expectations
Indicators To Watch - Interest Rate Expectations
Indicators To Watch - Interest Rate Expectations
Chart II-6Indicators To Watch - Interest Rate Expectations
Indicators To Watch - Interest Rate Expectations
Indicators To Watch - Interest Rate Expectations
Chart II-7Indicators To Watch - Interest Rate Expectations
Indicators To Watch - Interest Rate Expectations
Indicators To Watch - Interest Rate Expectations
Chart II-8Indicators To Watch - Interest Rate Expectations
Indicators To Watch - Interest Rate Expectations
Indicators To Watch - Interest Rate Expectations
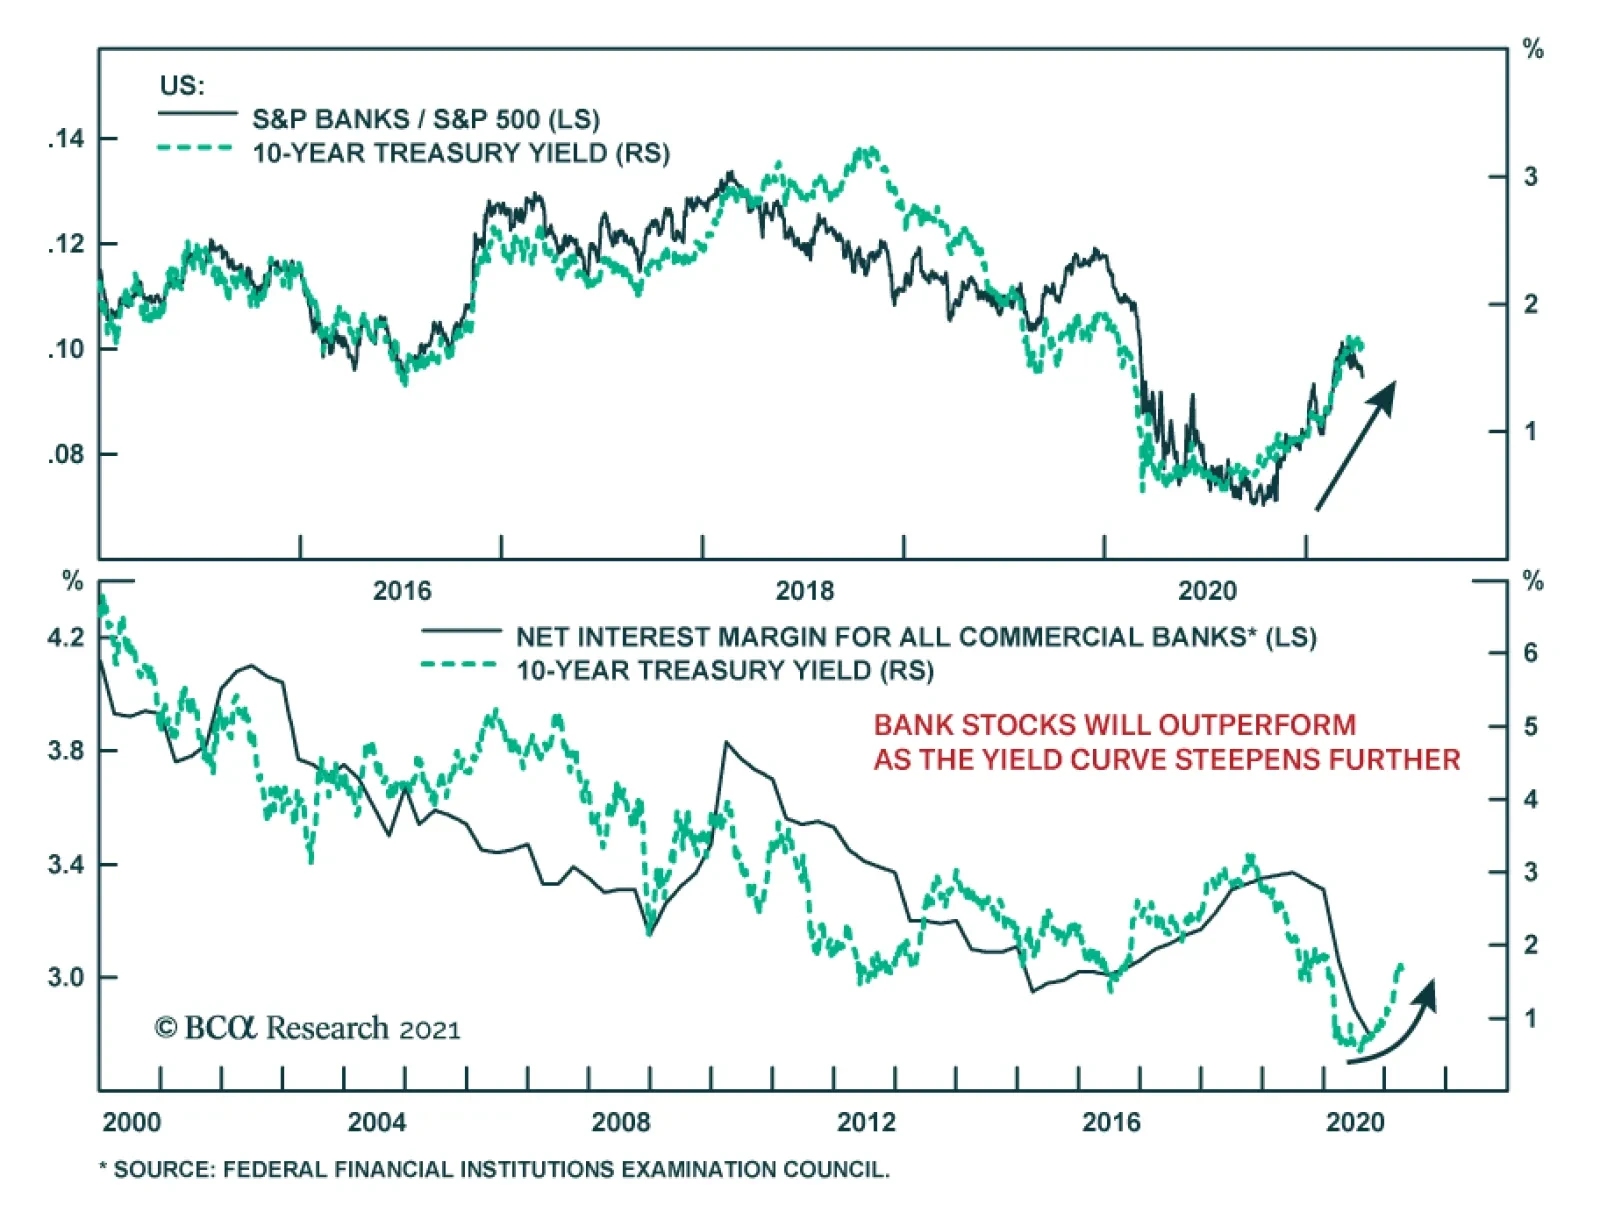
JPMorgan, Goldman Sachs and Wells Fargo kicked off the earnings season on an upbeat note on Wednesday. The first two blew past analyst expectations on the back of their trading and investment banking units. Earnings were also supported by large drawdowns in…
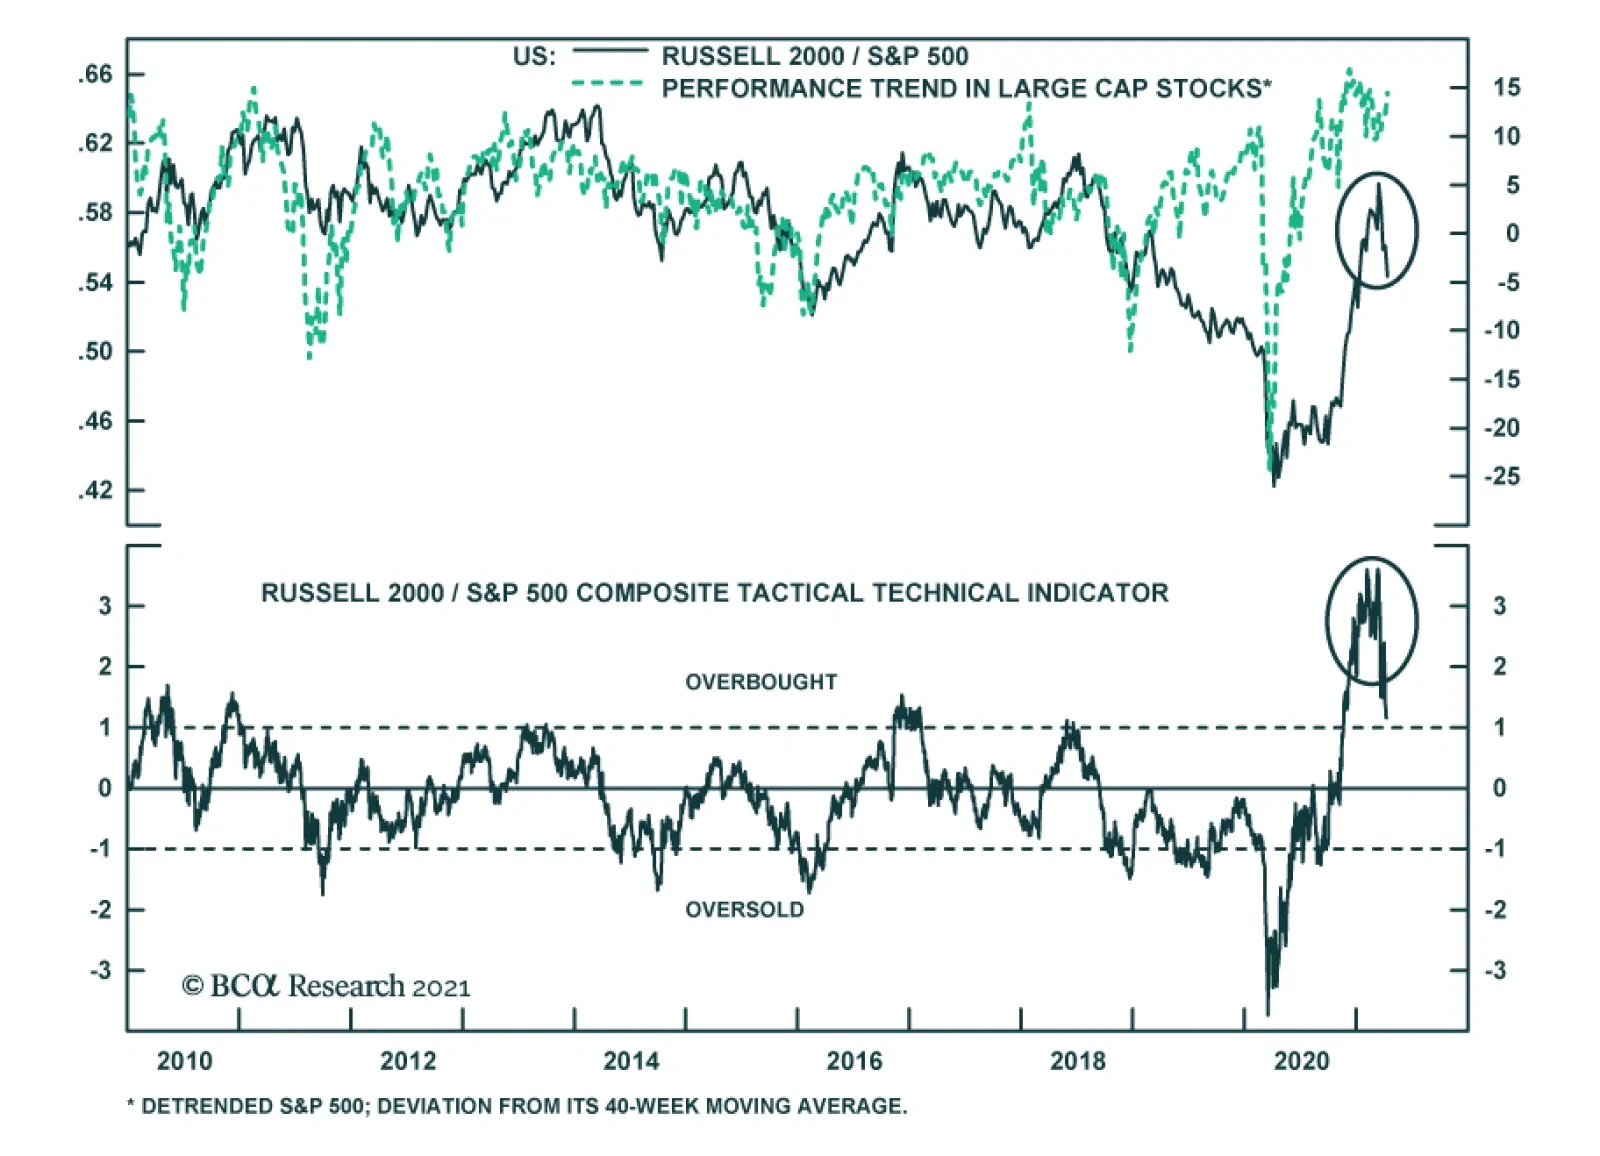
Small cap stocks have significantly outperformed large cap stocks since November, after having substantially underperformed in the early stages of the pandemic. As such, investors have looked at small cap stocks’ recently stellar relative performance as…