Equities
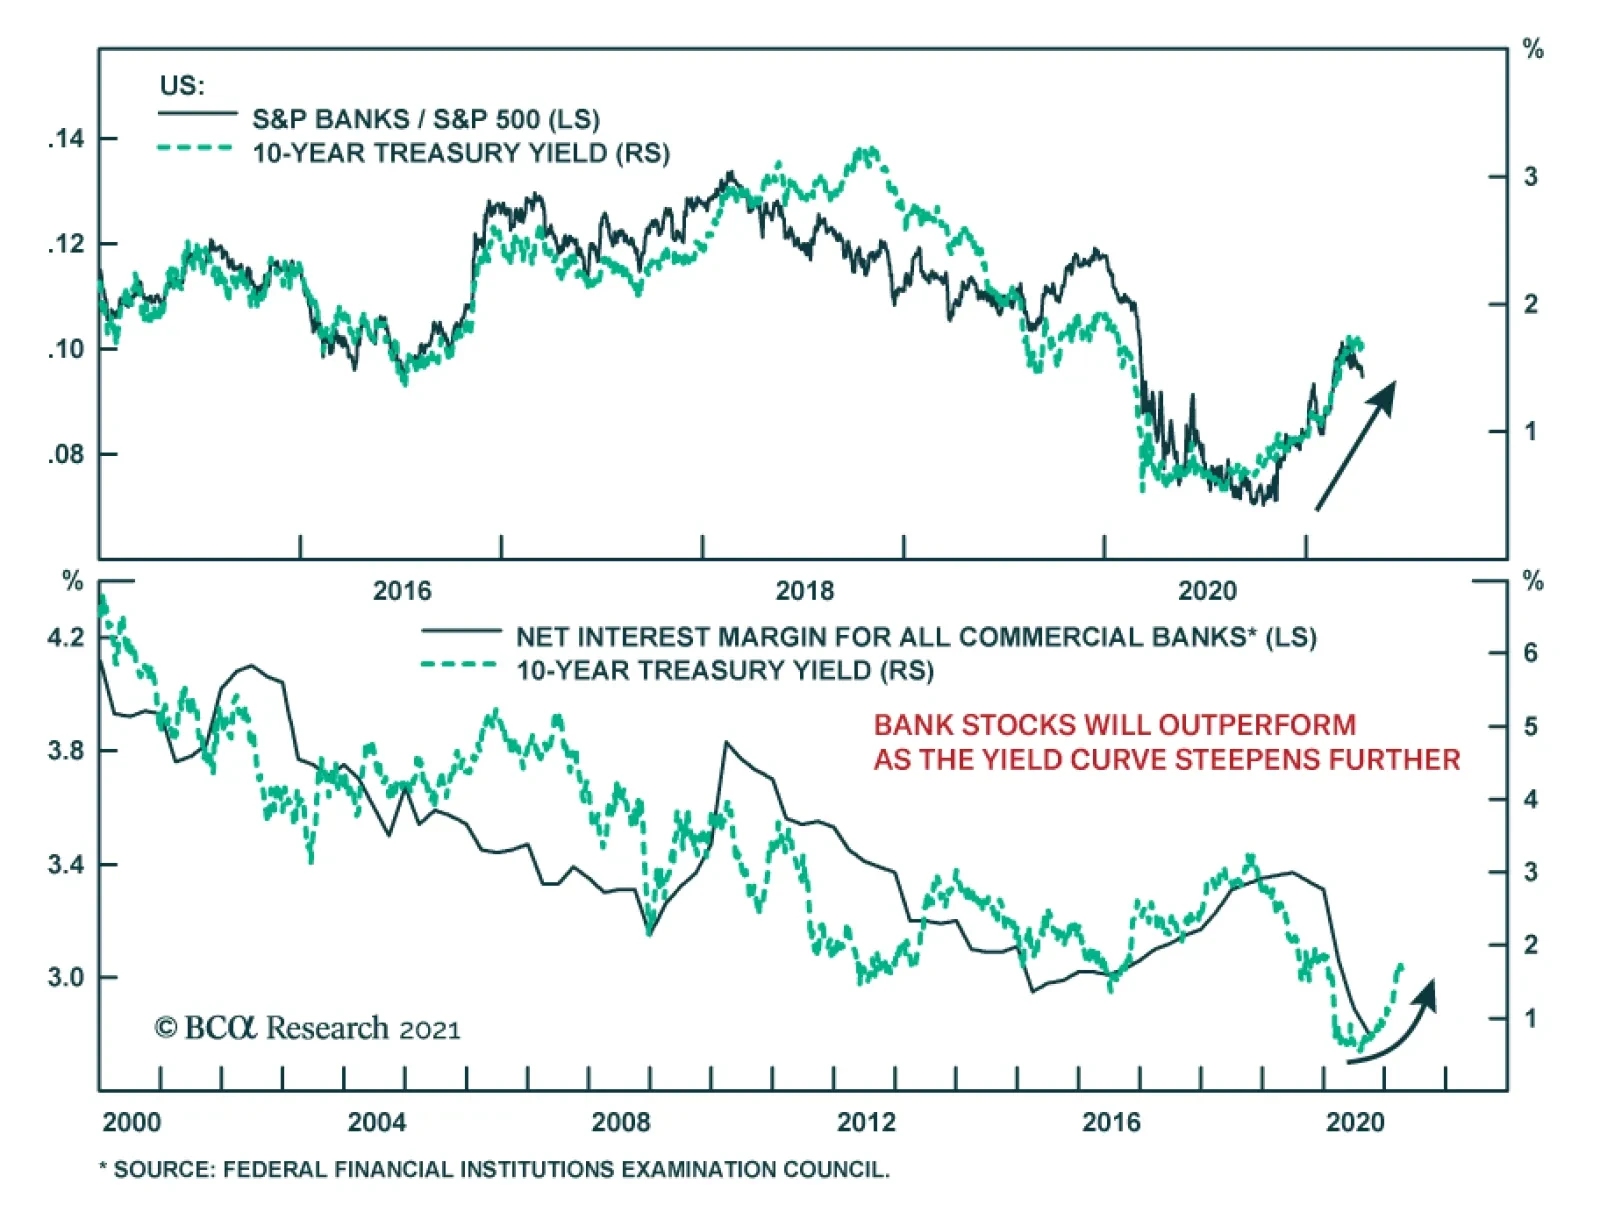
JPMorgan, Goldman Sachs and Wells Fargo kicked off the earnings season on an upbeat note on Wednesday. The first two blew past analyst expectations on the back of their trading and investment banking units. Earnings were also supported by large drawdowns in…
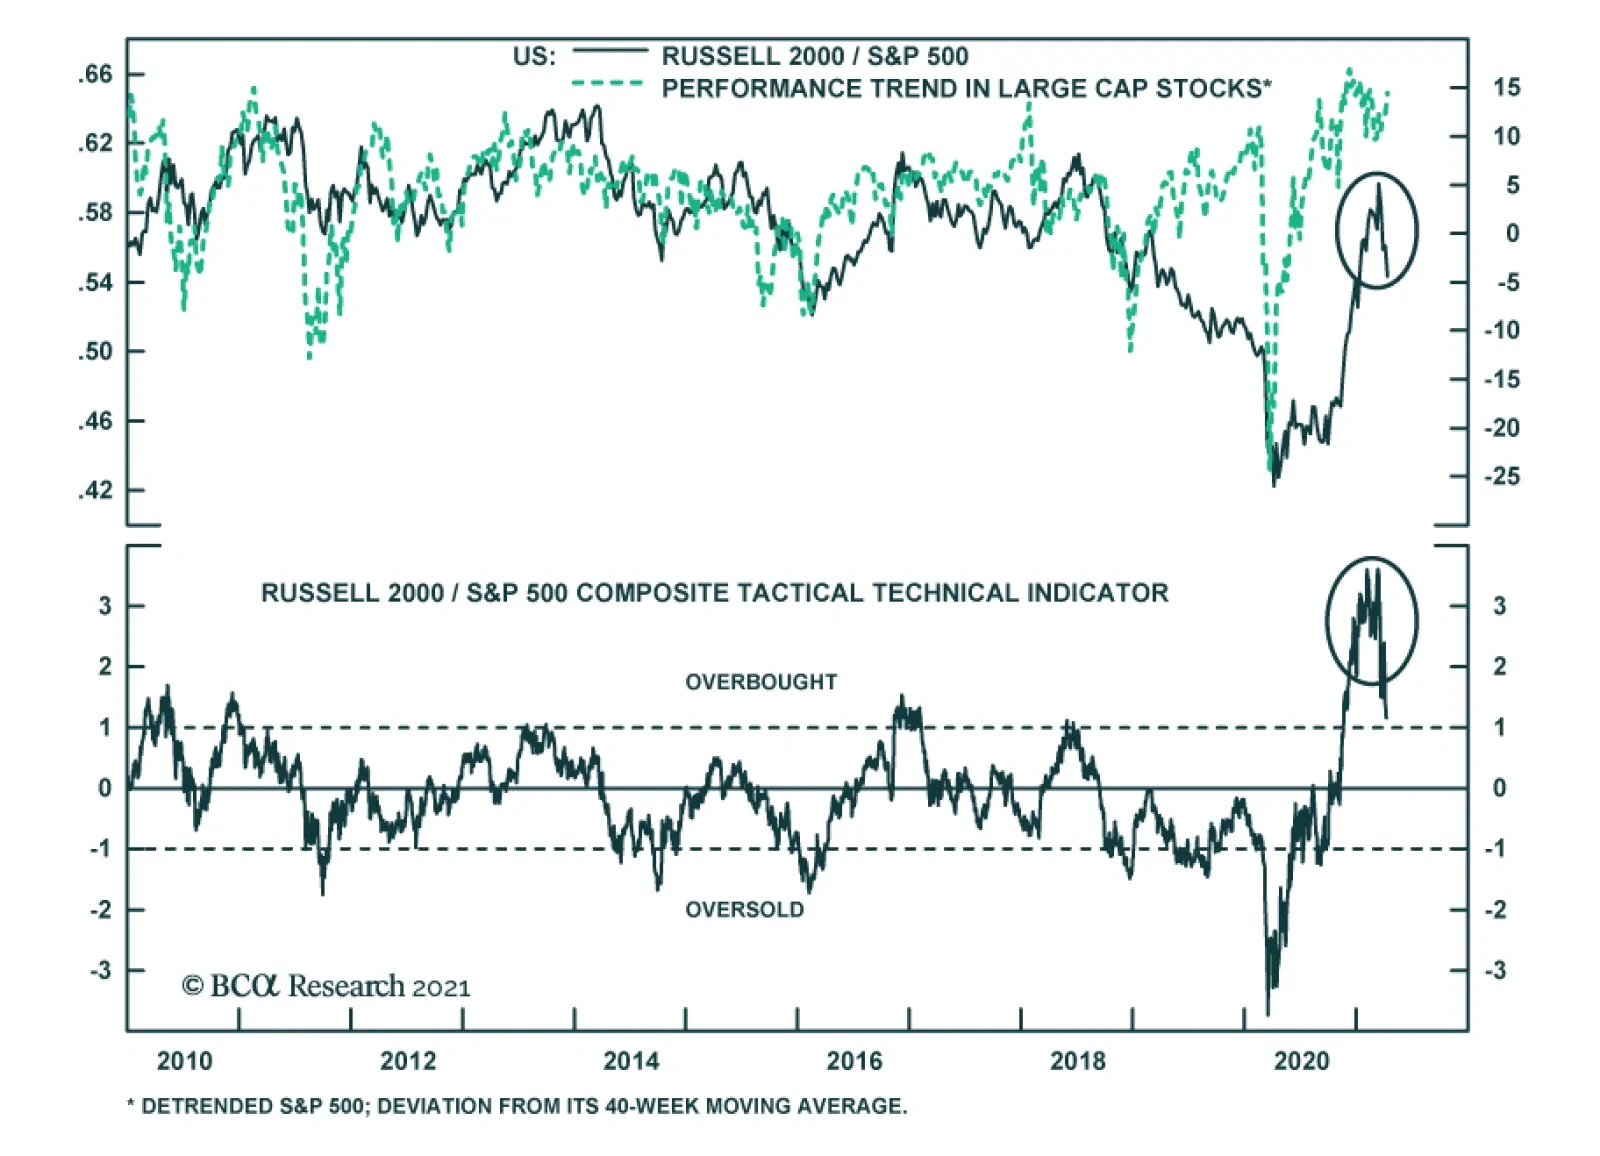
Small cap stocks have significantly outperformed large cap stocks since November, after having substantially underperformed in the early stages of the pandemic. As such, investors have looked at small cap stocks’ recently stellar relative performance as…
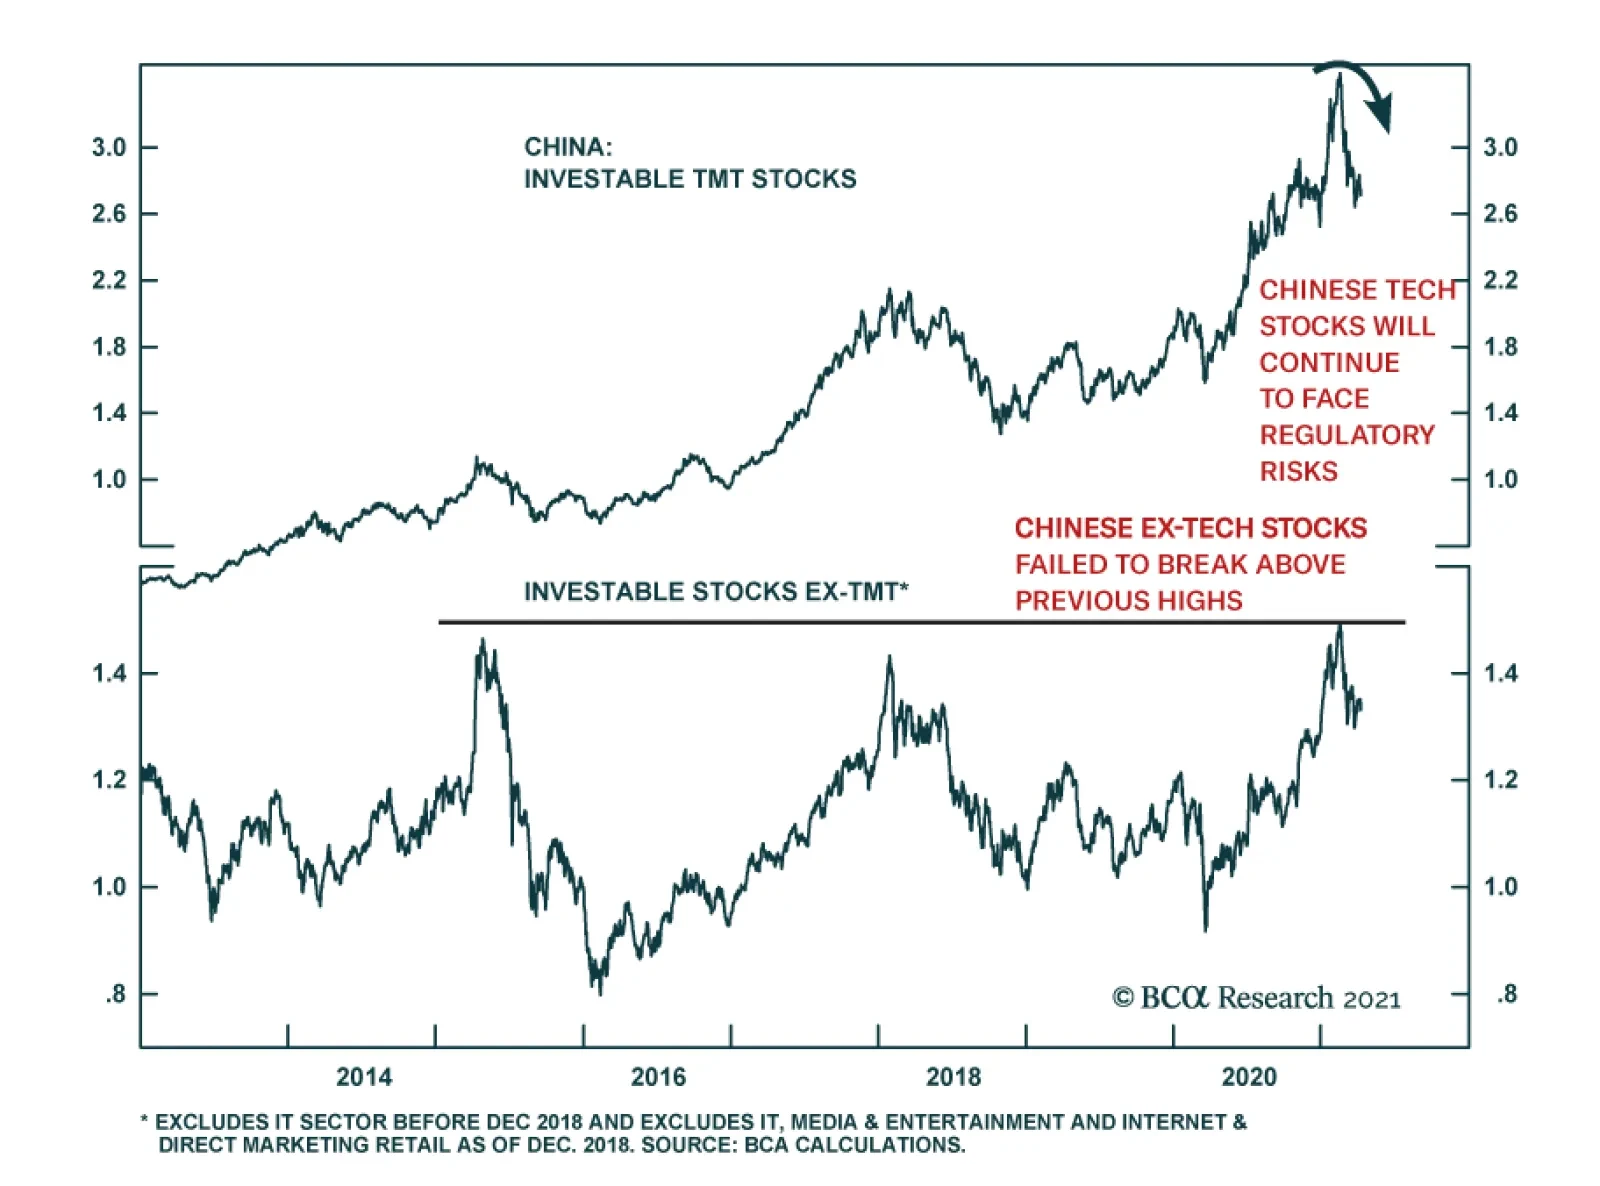
Chinese stocks are increasingly unattractive amid both policy tightening (see The Numbers) and a regulatory clampdown targeting real estate, banking, and tech. Regarding the latter, an anti-monopoly probe on e-commerce giant Alibaba concluded on Friday with a…
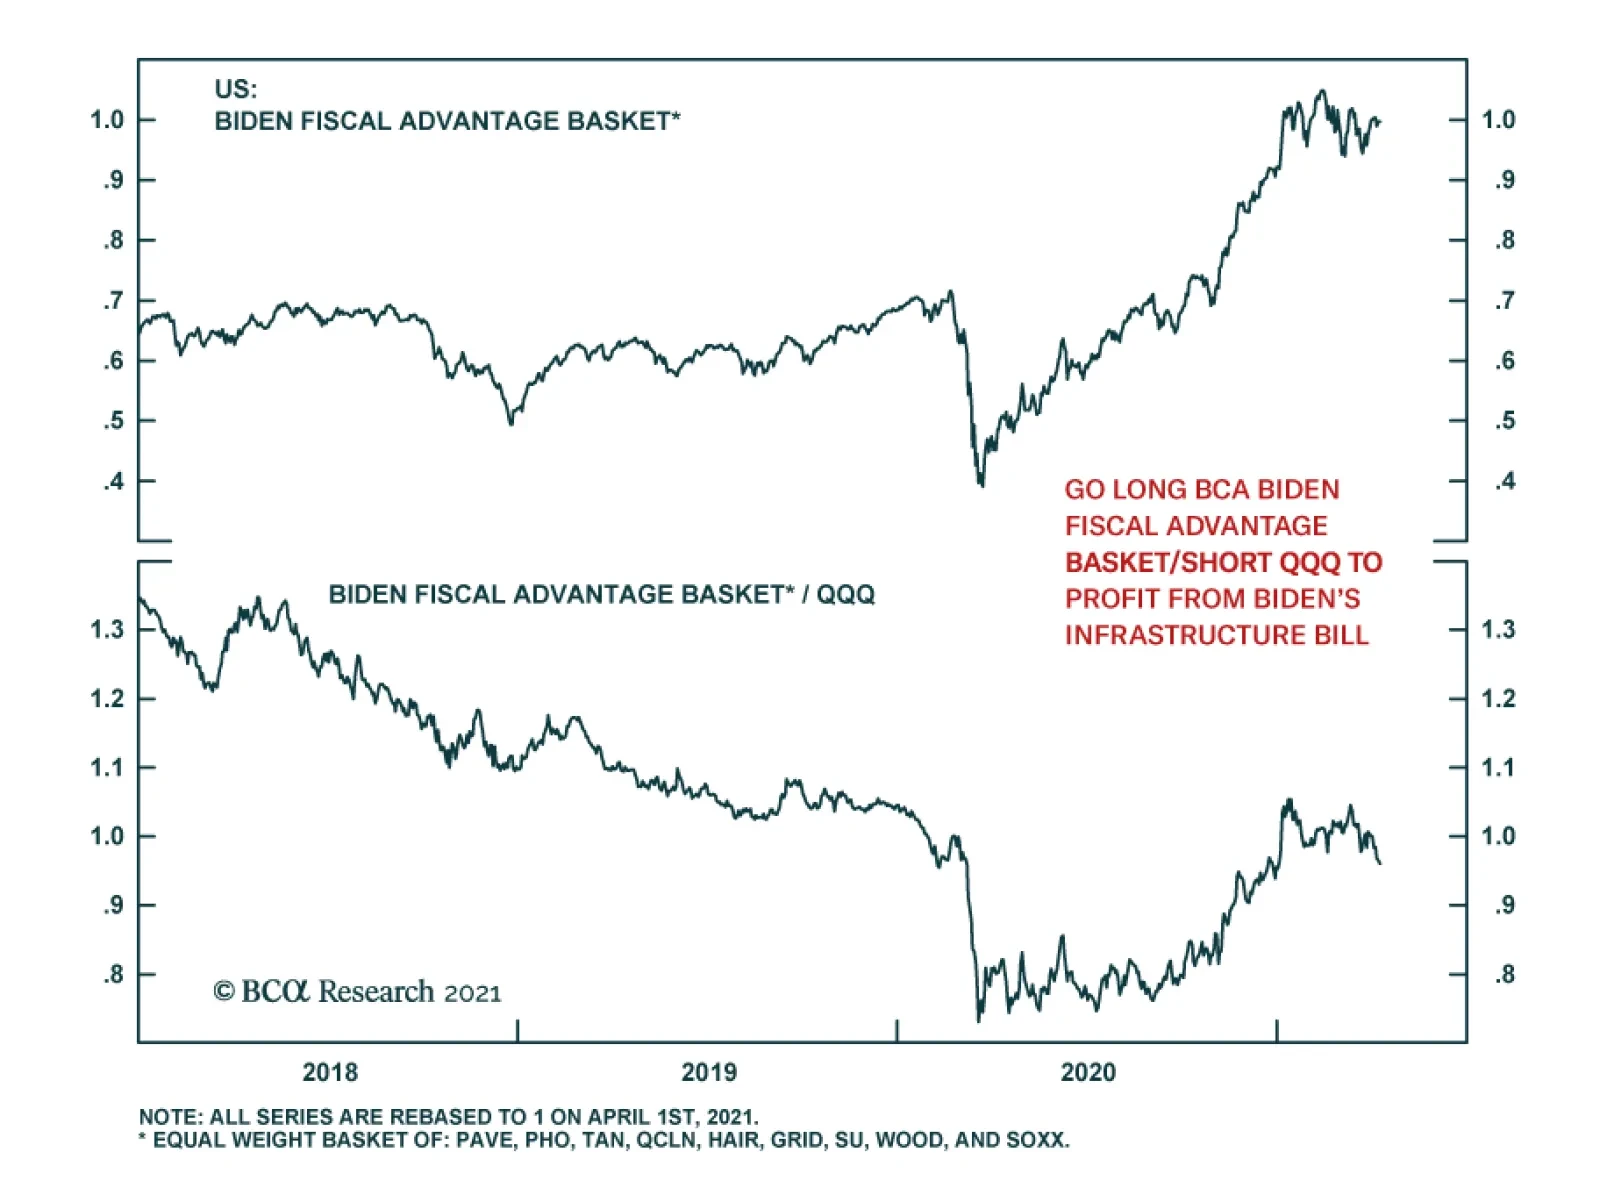
Our US Equity Strategy service has been inundated with client requests on how to best position for President Biden’s sweeping infrastructure spending package. They therefore constructed the BCA Biden Fiscal Advantage Basket, which comprises eight ETFs and one…
According to BCA Research’s European Investment Strategy service, structural headwinds are still too strong to hold a long-term bullish view on Eurozone equities relative to the US. However, the coming two years should be kind to euro area stocks. This…

How To Play Biden’s $2.4 trillion “American Jobs Plan”
How To Play Biden’s $2.4 trillion “American Jobs Plan”
We have been inundated with client requests on how to best position for President Biden’s sweeping infrastructure spending package. We therefore constructed the BCA Biden Fiscal Advantage Basket, which comprises eight ETFs and one stocks, all equal weighted (top panel). Instead of buying specific stocks we opted to go the ETF way in order to diversify away company specific risk. Our goal was to filter for ETFs that hold mostly US companies and that offered the highest possible liquidity. From a portfolio construction perspective, we tried to match the different spending segments of Biden’s preliminary bill (that our sister BCA US Political Strategy expects to pass Congress with high conviction) with an ETF. The ticker symbols of the eight ETFs and one stock we included in this Equity Basket are: PAVE, PHO, QCLN, TAN, WOOD, SOXX, HAIL, GRID and SU. We choose SU as there is no pure play Canadian oil sands ETF trading in USD. Granted there is some replication of stocks included in these ETFs, and in certain ETFs there is a sizable international stock exposure including EM and Chinese stocks. One final caveat is that these ETFs have a high concentration of technology stocks. Our sense is that this Basket should outperform the SPX on a cyclical and structural basis (middle panel). However, given the high tech exposure, our preferred way to express this trade is via a long/short pair trade versus the QQQ (bottom panel). Bottom Line: Initiate a long BCA Biden Fiscal Advantage Basket/short QQQ pair trade. On April 26, 2021 we will publish a joined SR with our sister US Political Strategy service on President Biden’s infrastructure spending bill proposal and elaborate further on this Equity Basket. The ticker symbols for the stocks in the BCA Biden Fiscal Advantage Basket are: PAVE, PHO, QCLN, TAN, WOOD, SOXX, HAIL, GRID and SU. The table in the appendix on the next page shows a number of other related ETFs that did not make our cut, but that you may find interesting to research further.
How To Play Biden’s $2.4 Trillion "American Jobs Plan"
How To Play Biden’s $2.4 Trillion "American Jobs Plan"
Highlights Structural headwinds are still too strong to hold a long-term bullish view on Eurozone equities relative to the US. However, the coming two years should be kind to euro area stocks. The relative performance of European stocks compared to that of the US is predominantly a function of yields. BCA foresees higher yields over a 24-month period. Moreover, European equities are exceptionally cheap, which accentuates their appeal as a yield play. Tactical considerations indicate that a modest overweight in European stocks, not an aggressive one, is most appropriate for cyclical investors. European investment grade bonds are appealing in a European fixed-income portfolio. Feature Chart 1Europe's Underperformance Explained
Europe's Underperformance Explained
Europe's Underperformance Explained
Over the past decade, Eurozone equities have massively underperformed US ones. The poor outcome generated by European bourses mimicked the fall in European profits against the US (Chart 1). Considering that the relative performance of euro area stocks stands at an all-time low, should investors begin to bet on Europe? The outlook for yields favors European stocks on a cyclical basis. However, the structural picture suggests that both Europe and the US must experience fundamental changes before European stocks can surpass their US counterparts on a long-term basis. Structural Challenges Remain The case for overweighting European equities on a structural investment horizon (5 to 10 years) remains weak. Only some major changes in the European and US economies can alter the long-term headwinds facing Eurozone stocks. Table 1US Possesses The Favored Sectors
Time And Attraction
Time And Attraction
Sectoral biases partly explain Europe’s inability to match the US’s profit potential. The US market over-represents high-margin and high return-on-equity businesses, such as technology and healthcare, while most Eurozone bourses have significant weightings in the structurally challenged financial, materials, and energy sectors (Table 1). This difference in sector representation also explains the larger buybacks witnessed in US markets compared to euro area ones, which further boosted the US’s relative EPS. Chart 2Japan Never Recovered
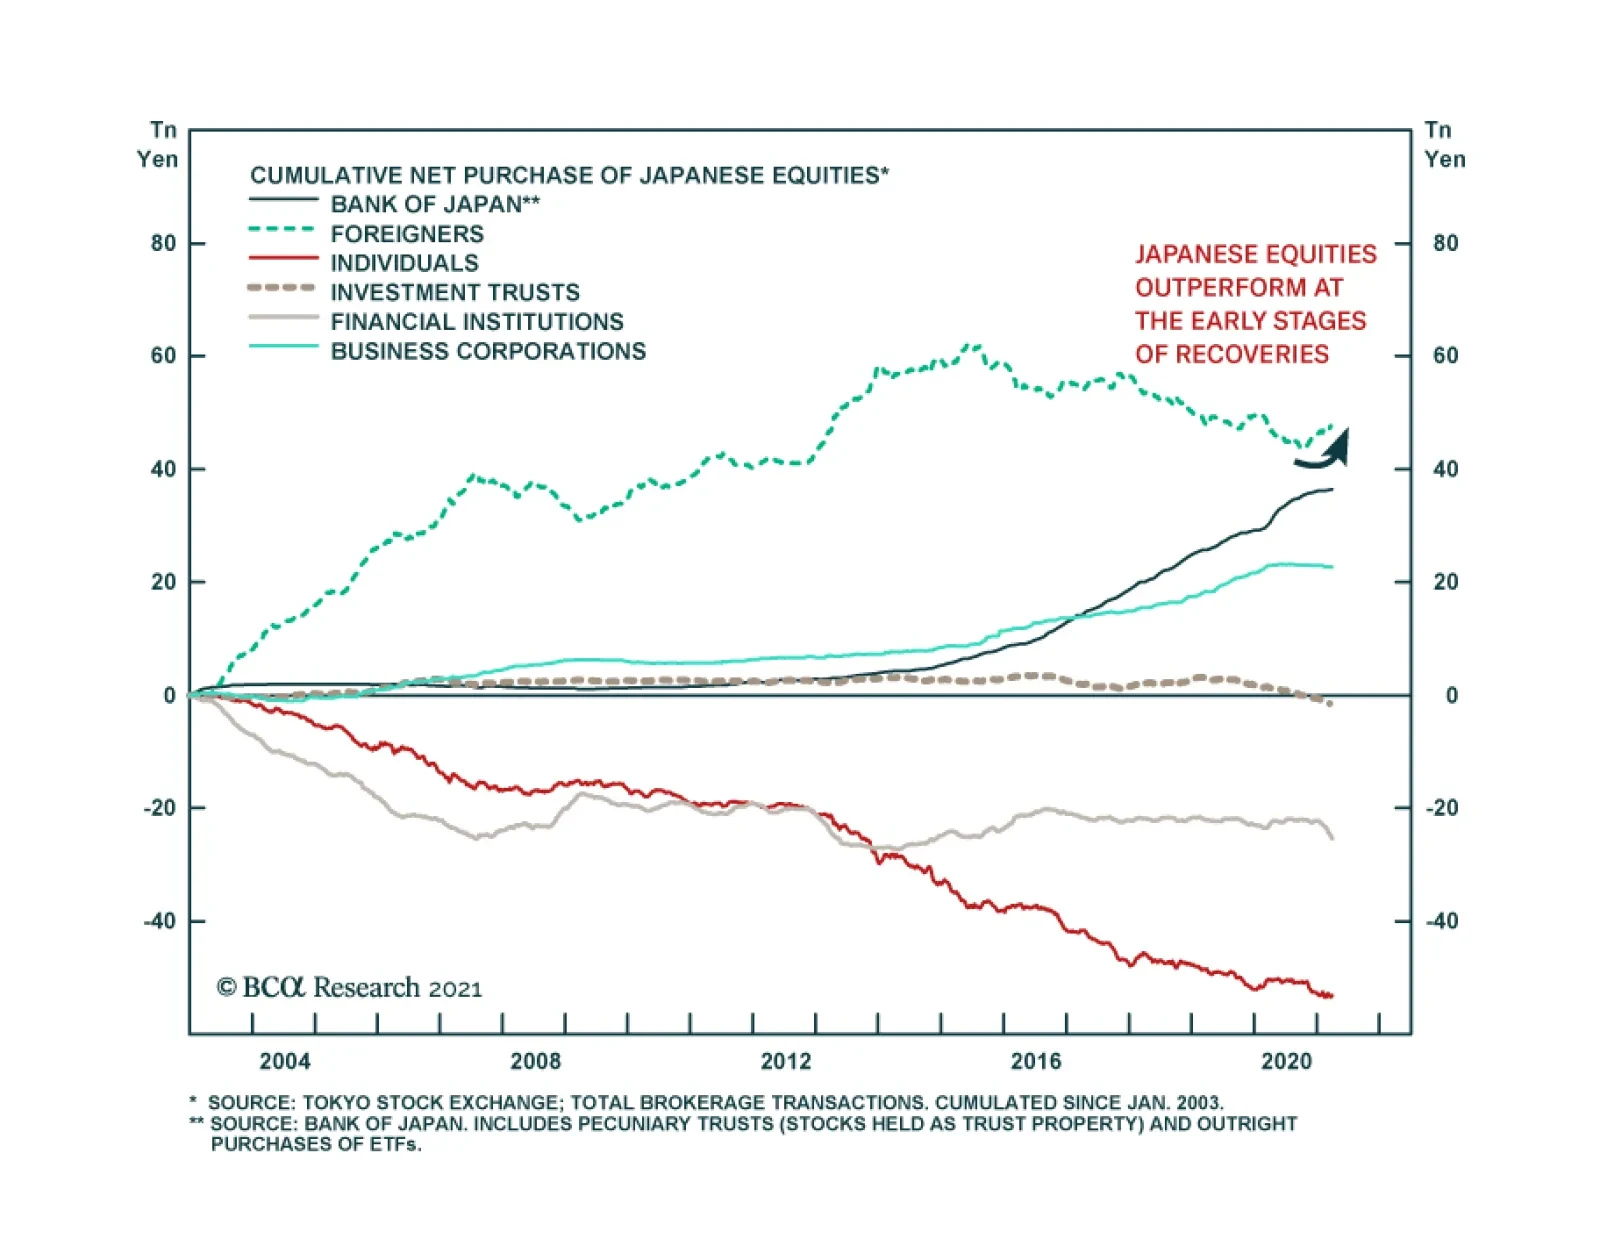
Japan Never Recovered
Japan Never Recovered
The performance of Japanese equities over the past three decades provides another cautionary tale for European stocks. Despite a substantial underperformance in the 1990s, Japanese equities never meaningfully recovered in the 2000s and ended up falling further behind the US over the past 12 years (Chart 2). A powerful liquidity trap and a 23% decline in the Japanese population compared to that of the US seriously hampered the ability of Japanese firms to generate stronger relative cash flows. This challenging profit picture meant that no matter how low JGB rates fell in comparison to the US, Japanese multiples never benefited from a significant re-rerating. The Eurozone suffers from similar ills to that of Japan, which warns that the latter constitutes a valid template for European assets. Europe’s population is expected to decline by 16% relative to that of the US over the coming three decades, which will hurt sales and capex in Europe. Moreover, despite low interest rates, private credit demand is weak, which limits the region’s economic vigor. Most concerning, Europe’s capital stock as a share of GDP is substantial, especially in the periphery (Chart 3). Such an observation indicates that there is a high probability that previously misallocated capital is burdening the euro area. This misallocation will continue to hurt economic activity, because it encumbers demand via weak capex and also harms productivity. A DuPont decomposition of RoE reveals how Europe’s economic malaise affects corporate profitability (Chart 4). The Eurozone’s excessively large capital stocks means that its asset turnover is inferior to that of the US, which corroborates the notion that capital is misallocated. Moreover, the euro area’s low profit margins reflect more than its sectoral composition. Greater economic rigidities as well as lower market power and concentration in Europe hurt profitability (even if it limits inequalities compared to the US). Finally, the corporate sector is deleveraging, which is a consequence of a liquidity trap and poor trend growth, causing the ratio of RoE to RoA to decline relative to the US. Chart 3Too Much Capital
Too Much Capital
Too Much Capital
Chart 4DuPont De No Good
DuPont De No Good
DuPont De No Good
To reverse the structural outperformance of US equities relative to the Eurozone, Europe’s secular profitability underperformance must end. We will look for the following factors to stop this decline, which we will explore in further detail over time: European reforms. Europe will remain disadvantaged until its excess capital stock is written off. This process is complex and it will require greater fiscal integration as well as greater reforms to promote competition and to decrease labor market as well as service sector rigidities. More Innovation. Despite a strong patent record in economies such as Germany, Europe lags behind the US in the creation of leading innovative companies. Europe’s industrial and consumer discretionary sectors could prove beneficiaries of the green revolution taking place around the world, but it is still too early to tell. Chart 5Market Power Helps The US
Market Power Helps The US
Market Power Helps The US
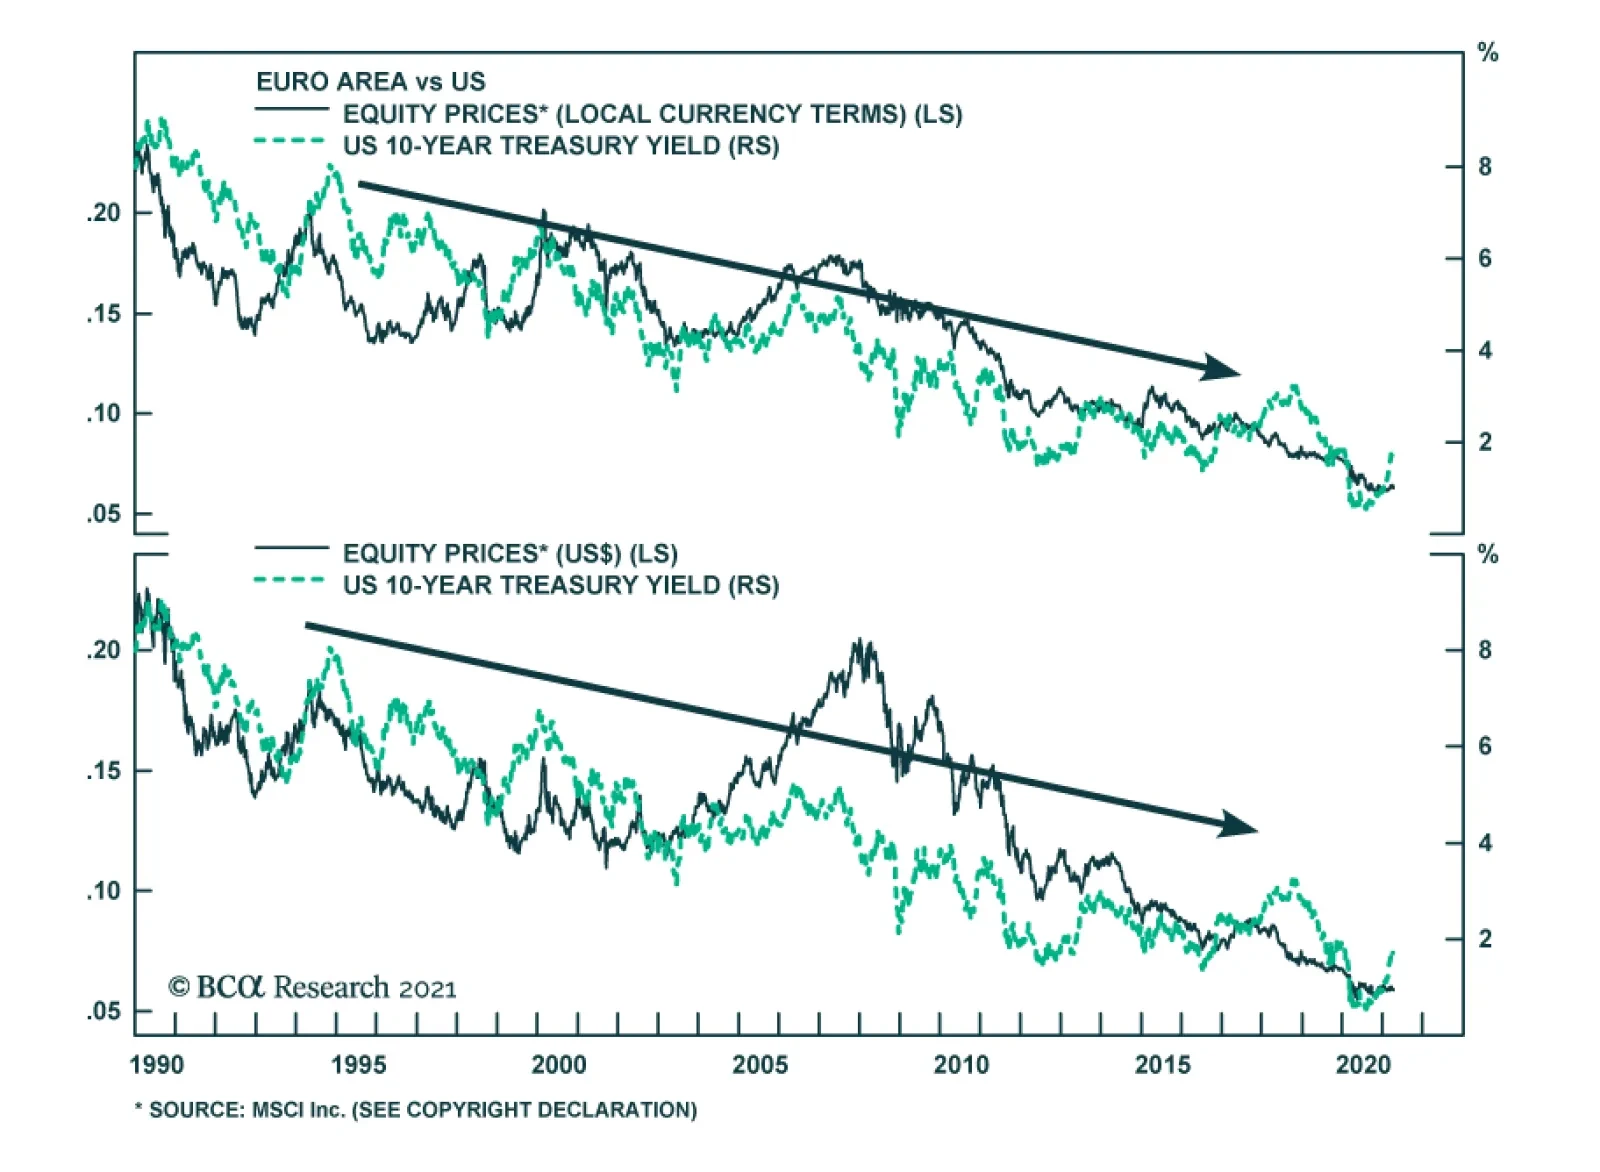
An ossification of the US economy. Europe could also begin to outperform, because the US might lose its edge. Economic populism is rife in the US, fueled by growing discontent with economic inequalities. As a result, government involvement in the economy as well as regulatory efforts could increase significantly. While a push to redistribute income toward the middle class would alleviate inequalities, it would hurt profitability and cause US RoE to decline toward European levels (Chart 5). Bottom Line: The secular underperformance of Eurozone equities reflects their inability to generate as much profits as US ones. Beyond sector biases, Europe’s demographic hurdles and its deeper problem with secular stagnation remain its key handicaps. For now, there is no solid case to bet on a major change in these trends, which only European reforms or problems in the US can undo. But A Cyclical Opportunity Exists Despite the challenging structural environment for European equities, the cyclical outlook (24 months) is attractive. Even in Japan, multi-year episodes of outperformance punctuated a decades-long underperformance relative to the US or the MSCI all-country world index. In the case of the Eurozone, this upbeat view rests on BCA Research expectations of higher global yields. The performance of Europe’s equities relative to the US correlates closely with the level of US yields (Chart 6). The sectoral footprint of both bourses is an important driver of this correlation. The US overweighs growth and defensive stocks, which account for 49% and 23% of its capitalization, respectively. Meanwhile, the euro area over-represents value stocks and deep cyclicals, which account for 55% and 26% of its market, respectively. Historically, global value stocks beat growth equities when yields are rising (Chart 7). Chart 6A Yield Story
A Yield Story
A Yield Story
Chart 7What Value Likes
What Value Likes
What Value Likes
The outperformance of value stocks when yields rise is multifaceted. Deep cyclicals, such as industrials, materials, financials and energy, constitute a larger share of value benchmark than growth ones. Consequently, when yields increase because the global business cycle experiences an upswing, the earnings of value stocks accelerate compared to those of growth stocks (Chart 7, bottom panel). The positive impact of yields on the value versus growth split is also more direct. Higher yields, especially if they accompany a steeper yield curve, boost the profitability of financials. Meanwhile, mounting yields increase the discount factor applied to the long-term deferred cash flows that contribute a large proportion of the intrinsic value of growth stocks. Higher yields also support the relative performance of Eurozone stocks via the evolution of the expected growth rates of their long-term earnings. As Chart 8 illustrates, upgrades to sell-side estimates of the long-term growth rate of European EPS relative to the US coincide with a steeper US yield curve slope and rising 5-year/5-year forward Treasury yields. These relationships exist because European economic activity and sectoral representation are more cyclical than that of the US. Eurozone equities look like a particularly cheap bet on higher yields over the coming 18 to 24 months. Sentiment toward European assets remains depressed compared to the US. Even on an equal-weighted basis, the discount of the expected long-term growth rate of euro area EPS relative to the US is exceptionally wide (Chart 9, top panel). True, the sustainable growth rate (SGR) of earnings is a function of the return on equity and the dividend payout ratio. Nonetheless, despite the fact that the euro area low RoE forces the European SGR down, Eurozone stocks embed a long-term growth rate that is 47% too low vis-à-vis the US. Other metrics underscore the cheapness of European equities relative to the US. Our Mechanical Valuation Indicator, which is sector neutral, stands at a 1-sigma discount in favor of the Eurozone (Chart 9, bottom panel). Chart 8EPS Growth and The Yield Structure
EPS Growth and The Yield Structure
EPS Growth and The Yield Structure
Chart 9Europe Is Cheap
Europe Is Cheap
Europe Is Cheap
Ultimately, Europe’s relative expected growth and valuations are particularly depressed, because domestic activity lags behind that of the US by a significant margin. As the vaccination campaign advances and the economy reopens later in the quarter, the Eurozone’s service sector will catch up and the earnings growth discount will dissipate (Chart 10). Moreover, regardless of its recent dynamism, even the European industrial sector has room to catch up to the US. Our Swedish Economic Diffusion Index captures the general strength in Swedish economic activity, which foretells a further increase in both the euro area Manufacturing PMI and equities relative to the US (Chart 11). Chart 10Stronger Services Will Help
Stronger Services Will Help
Stronger Services Will Help
Chart 11Listen To Sweden
Listen To Sweden
Listen To Sweden
Bottom Line: BCA’s expectations that global yields will rise over the coming 24 months are consistent with Eurozone equities outperforming US ones over this period, even if the long-term outlook remains challenging for Europe. European equities are much more pro-cyclical than US ones, which is reified by their sector and value biases. Moreover, euro area equities currently embed a particularly large discount to their US counterpart, which increases their attractiveness as a play on rising bond yields. The Right Entry Point? Strategy and forecasts are two different things. BCA strongly believes that yields will rise over the coming two years; however, a large overweight in Eurozone equities is a risky bet at the current juncture. Instead, we recommend investors opt for a modest overweight. Short-term traders should stay clear of this market for now. The reason for this cautiousness is that yields are very vulnerable to a temporary near-term pullback because: Chart 12A Countertrend Bond Rally?
A Countertrend Bond Rally?
A Countertrend Bond Rally?
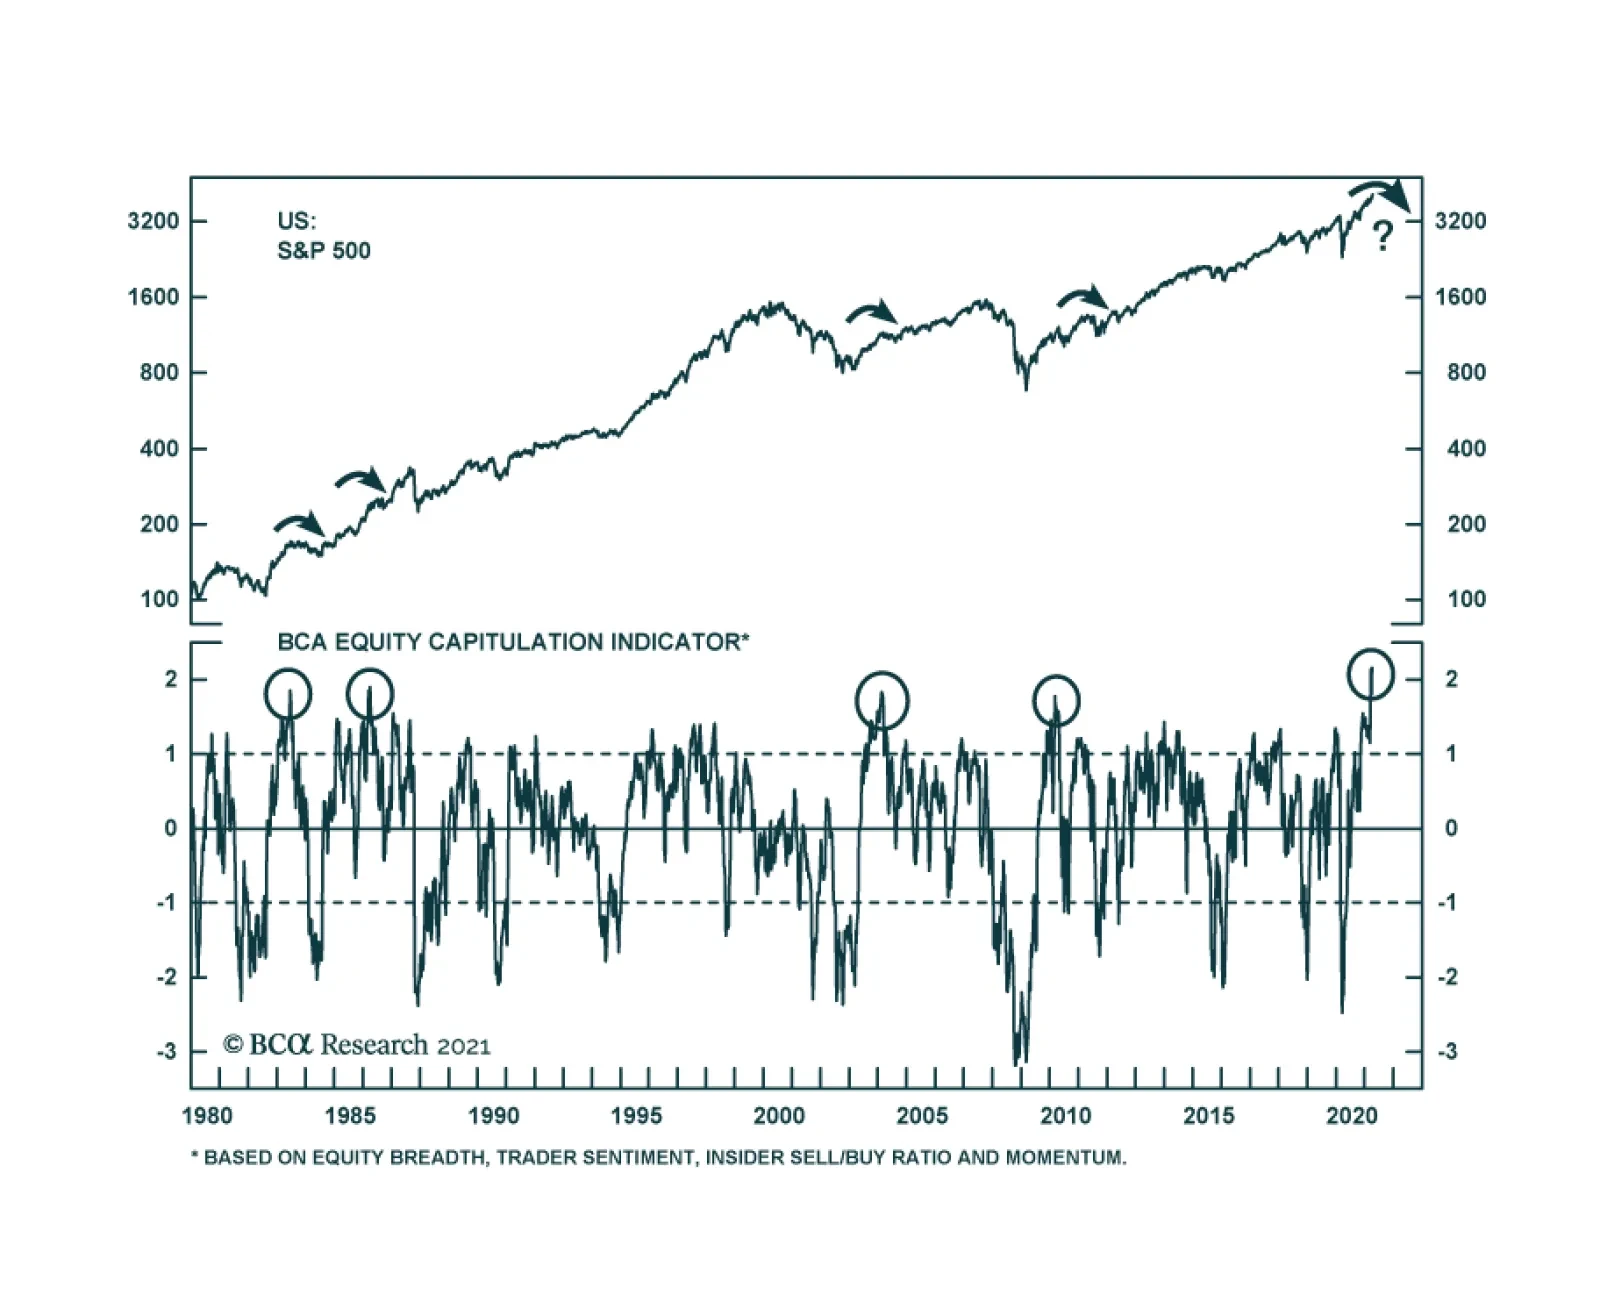
Technicals point to a counter-trend bounce in bond prices. Our BCA Composite Technical Indicator is massively oversold, our Composite Sentiment Indicator is extremely depressed, and speculators are aggressively shorting T-Bonds (Chart 12). The recent bond market behavior is puzzling. Despite March’s blockbuster non-farm payroll data and Manufacturing, as well as Services ISM surveys, yields are softening. Not even the announcement of the Biden administration’s $2.3 trillion American Jobs Plan could increase yields in recent weeks. This price action confirms that bonds are oversold and that, until the recent price decline is digested, the threshold to push yields higher has risen meaningfully. Equities are at risk of a pullback. Euphoria is prevalent, which increases the odds of corrective action in equities. Our BCA Equity Capitulation Index stands at a 45-year high (Chart 13) and our US Equity Strategy team’s Risk Appetite Index is at its highest levels since 2007, both of which suggest that complacency is rife. Moreover, the put/call ratio has collapsed to 0.45, which shows the carefree attitude of traders. Yields will decline if stock prices correct. EM equities are underperforming US stocks. EM benchmarks are more sensitive to marginal changes in the global growth outlook. For now, the risk is that growth disappoints lofty expectations. Since 2014, periods of relative weakness in EM bourses precede declines in Treasury yields (Chart 14). Authorities are trying to limit credit growth in China. As we argued two weeks ago, Beijing is aiming to slow credit growth to prevent systemic vulnerabilities from developing. This process is fraught with risks and is likely to result in a deceleration in China’s economy. While Europe and most emerging markets remained mired in a health crisis, China will be a source of temporary downside for global economic activity. The recent announcement that the PBoC asked Chinese banks to limit new loans confirms this assessment. Chart 13Euphoria!
Euphoria!
Euphoria!
Chart 14EM Stocks Are Telling Us Something
EM Stocks Are Telling Us Something
EM Stocks Are Telling Us Something
Bottom Line: For now, investors with a cyclical horizon (two years) should only keep a modest overweight position in Eurozone equities because the near-term outlook for yields points to some temporary downside. Not allocating the full allowable capital budget to Europe will allow investors to upgrade their overweight after the near-term downside in yields has passed. Investors may also consider implementing some hedges. Our foreign exchange strategist recommends a short EUR/JPY position as a form of portfolio protection. Keeping some cash in yen to deploy later in Europe mimics this advice. Short-term traders should stay clear of Europe as long as bond markets have not digested their oversold condition. Market Focus: Investment Grade Corporates and the ECB The ECB’s minutes highlight that investment grade corporate bonds are attractive within European fixed-income portfolios. The recently released ECB minutes revealed that higher real rates do not overly concern the Governing Council, because they reflect an improving global economic outlook and not an eventual policy tightening. Moreover, the GC does not want to give the impression it will engage in yield control, yet the pace of purchases under the Pandemic Emergency Purchase Programme (PEPP) will remain accelerated and flexible until June, at a minimum. The ECB will not derail the supportive environment for economic activity anytime soon. Meanwhile, as we have argued in past reports, fiscal policy in Europe will also stay relaxed for the time being. Thus, the Eurozone’s policy environment remains supportive for credit spreads, especially since the default cycle has been muted. However, do corporate bonds already fully price in this positive backdrop? According to the 12-month breakeven spread, European credit spreads can compress further. The breakeven spread is the amount of spread widening required for corporate bond returns to break even with a duration-matched position in government bond securities over a 12-month horizon. It is approximated by dividing the OAS of a bond (or an index) by its duration. The breakeven spread is then compared to its own history, by observing the percentage of time that it has been lower in the past.1 Chart 15Some Value Left
Some Value Left
Some Value Left
European credit spreads have tightened 160 bps since March last year and are already below their pre-Covid level (Chart 15). However, the 12-month breakeven spread has been tighter 18% of the time since 1999. In other words, higher quality corporate bonds in Europe have room to see further spread compression, since policy will remain relaxed for a long time. This is especially true in the Aa-rated credit tier, where the breakeven spread has been more expensive 35% of the time (not shown). Meanwhile, US breakeven spreads for IG corporate bonds are in their 2nd percentile and policy will tighten sooner than in Europe. Therefore, bond investors with a European-only mandate are not forced to step down the quality ladder as aggressively as those in the US do. Table 2Norway, France And Italy Stand Out
Time And Attraction
Time And Attraction
Table 2 provides the same analysis at the country level. Taking into consideration the average credit rating of each countries’ investment grade bonds, we find that Norwegian, French, and Italian spreads have the most value left. Interestingly, the ECB’s purchases of Italian and French paper is currently deviating widely from its capital keys, which should place downward pressure on credit spreads in these jurisdictions. Bottom Line: There is still value left in European investment grade corporate bonds, unlike in the US, where valuations are extremely expensive and a decrease in quality is warranted. For now, such a move is uncalled for in Europe, especially since the value in its high-yield index is concentrated in its riskiest credit tiers. At the country level, investors should favor Norwegian, French, and Italian investment grade corporate bonds. Mathieu Savary, Chief European Investment Strategist Mathieu@bcaresearch.com Jeremie Peloso, Senior Analyst JeremieP@bcaresearch.com Footnotes 1We find this valuation tool superior to others for two main reasons: (i) using the breakeven spread rather than the average index OAS allows us to control for the changing average duration of the benchmark bond indices; and (ii) the percentile rank is often a better representation of credit spreads than the spread itself. Cyclical Recommendations Structural Recommendations Trades Currency Performance
Time And Attraction
Time And Attraction
Fixed Income Performance Government Bonds
Time And Attraction
Time And Attraction
Corporate Bonds
Time And Attraction
Time And Attraction
Equity Performance Major Stock Indices
Time And Attraction
Time And Attraction
Geographic Performance
Time And Attraction
Time And Attraction
Sector Performance
Time And Attraction
Time And Attraction
Closed Trades
In a Daily Insight on 1st April, we discussed why Japan has lagged global markets during the equity rally, despite its cyclicality, large exposure to China, and tilt towards manufacturing. Year-to-date, Japanese equities are up only 3% in USD terms, compared…
The VIX closed a hair below 17 on Thursday and is continuing to decline on Friday, making a new pandemic low. The drop indicates that investor sentiment is improving amid and a perception of receding market risk. This progress is in line with other market…
Weekly Performance Update For the week ending Thu Apr 08, 2021 The Market Monitor displays the trailing 1-quarter performance of strategies based around the BCA Score. For each region, we construct an equal-weighted, monthly rebalanced portfolio consisting of the top 3 stocks per sector and compare it with the regional benchmark. For each portfolio, we show the weekly performance of individual holdings in the Top Contributors/Detractors table. In addition, the Top Prospects table shows the holdings that currently have the highest BCA Score within the portfolio. For more details, click the region headers below to be redirected to the full historical backtest for the strategy. BCA US Portfolio
Market Monitor (Apr 08, 2021)
Market Monitor (Apr 08, 2021)
Total Weekly Return BCA US Portfolio S&P500 TRI 1.66% 1.97% Top Contributors UTHR:US TGNA:US TTEC:US QFIN:US SCCO:US Weekly Return 15 bps 15 bps 14 bps 14 bps 14 bps Top Detractors EXPI:US VIPS:US TRTN:US MDU:US TX:US Weekly Return -11 bps -10 bps -3 bps -2 bps -1 bps Top Prospects TX:US ESGR:US QFIN:US VIPS:US SCCO:US BCA Score 99.70% 99.17% 97.50% 95.27% 94.26% BCA Canada Portfolio
Market Monitor (Apr 08, 2021)
Market Monitor (Apr 08, 2021)
Total Weekly Return BCA Canada Portfolio S&P/TSX TRI 1.12% 1.35% Top Contributors CFP:CA IFP:CA RUS:CA WIR.UN:CA TCL.A:CA Weekly Return 43 bps 34 bps 18 bps 16 bps 16 bps Top Detractors WEED:CA APHA:CA VII:CA PXT:CA LIF:CA Weekly Return -32 bps -29 bps -14 bps -10 bps -5 bps Top Prospects LNF:CA LIF:CA IFP:CA CFP:CA LNR:CA BCA Score 99.24% 97.42% 96.50% 96.15% 96.12% BCA UK Portfolio
Market Monitor (Apr 08, 2021)
Market Monitor (Apr 08, 2021)
Total Weekly Return BCA UK Portfolio FTSE 100 TRI 2.07% 3.10% Top Contributors AO.:GB FXPO:GB SSE:GB OXIG:GB NCC:GB Weekly Return 27 bps 26 bps 17 bps 17 bps 16 bps Top Detractors CNE:GB ROSN:GB VEC:GB TUNE:GB FIVE:GB Weekly Return -10 bps -10 bps -8 bps -6 bps -5 bps Top Prospects NLMK:GB SVST:GB GLTR:GB FXPO:GB GYS:GB BCA Score 99.52% 99.39% 97.74% 97.33% 96.11% BCA Eurozone Portfolio
Market Monitor (Apr 08, 2021)
Market Monitor (Apr 08, 2021)
Total Weekly Return BCA EMU Portfolio MSCI EMU TRI 0.87% 0.78% Top Contributors TKA:AT FLUX:BE MOL:IT TTALO:FI AOF:DE Weekly Return 13 bps 12 bps 11 bps 9 bps 9 bps Top Detractors TEN:IT HDG:NL SOLV:BE OMV:AT RIN:FR Weekly Return -12 bps -7 bps -6 bps -6 bps -4 bps Top Prospects PHH2:DE SOL:IT SOLV:BE GCO:ES SES:IT BCA Score 99.41% 99.39% 99.04% 96.47% 95.00% BCA Japan Portfolio
Market Monitor (Apr 08, 2021)
Market Monitor (Apr 08, 2021)
Total Weekly Return BCA Japan Portfolio TOPIX TRI -0.65% -0.30% Top Contributors 8595:JP 4980:JP 8966:JP 3132:JP 9413:JP Weekly Return 13 bps 10 bps 10 bps 9 bps 7 bps Top Detractors 7817:JP 9503:JP 9543:JP 6960:JP 4534:JP Weekly Return -16 bps -14 bps -13 bps -12 bps -11 bps Top Prospects 9436:JP 4008:JP 8255:JP 7279:JP 7994:JP BCA Score 99.11% 98.67% 98.38% 98.28% 98.15% BCA Hong Kong Portfolio
Image
Total Weekly Return BCA Hong Kong Portfolio Hang Seng TRI 2.39% 0.24% Top Contributors 990:HK 719:HK 3306:HK 148:HK 1378:HK Weekly Return 72 bps 28 bps 27 bps 25 bps 22 bps Top Detractors 1866:HK 991:HK 373:HK 2232:HK 737:HK Weekly Return -10 bps -9 bps -7 bps -4 bps -4 bps Top Prospects 990:HK 2232:HK 1866:HK 737:HK 1378:HK BCA Score 99.96% 99.49% 98.85% 98.74% 98.69% BCA Australia Portfolio
Market Monitor (Apr 08, 2021)
Market Monitor (Apr 08, 2021)
Total Weekly Return BCA Australia Portfolio S&P/ASX All Ord. TRI 2.75% 2.64% Top Contributors REH:AU SGF:AU CAJ:AU PDN:AU HSN:AU Weekly Return 34 bps 31 bps 31 bps 28 bps 26 bps Top Detractors BSE:AU RIC:AU AHY:AU SKI:AU DDR:AU Weekly Return -41 bps -10 bps -2 bps -1 bps -1 bps Top Prospects BSE:AU ZIM:AU GRR:AU ADH:AU PIC:AU BCA Score 99.87% 99.65% 99.31% 98.06% 97.96%