Equities

Highlights Private-sector savings exploded during the pandemic, swelling the already large global savings glut. Reluctant to sit on excess cash, households shifted some of their funds into the stock market. With corporate buybacks outpacing new share issuance, stock prices had nowhere to go but up. Falling bond yields further supercharged equity valuations. Despite the run-up in stocks, the global equity risk premium – measured as the forward equity earnings yield minus the real bond yield – still stands at about 6%, similar to where it was in late-2009. Using a simple example, we show why investors should hold more stock than the standard 60/40 rule suggests when bond yields are still this low. While bond yields will rise further over the coming years, it is likely to be a slow process. Investors should remain bullish on stocks over a 12-month horizon, favouring non-US equities over their US peers. Did A Surfeit Of Savings Lead To A Shortage Of Assets? Real interest rates have fallen dramatically since the early 1980s (Chart 1). Economic theory posits that lower real rates discourage savings while encouraging spending. Yet, as Chart 2 shows, with the exception of the late-1990s and the mid-2000s – two periods when spending was buoyed first by the dotcom bubble and then by the housing bubble – the US private sector has run a large financial surplus; that is to say, it has consistently spent less than it earned. Private-sector financial balances in most other economies have followed a similar trend. Chart 1Real Bond Yields Have Been Trending Lower Since The 1980s
Real Bond Yields Have Been Trending Lower Since The 1980s
Real Bond Yields Have Been Trending Lower Since The 1980s
Chart 2The Private Sector Has Been Mostly Running Surpluses
The Private Sector Has Been Mostly Running Surpluses (I)
The Private Sector Has Been Mostly Running Surpluses (I)
Ben Bernanke famously cited chronic private-sector financial surpluses as evidence of a “global savings glut.” The concept of a savings glut is closely related to the concept of demand-side secular stagnation, an idea popularized by Larry Summers prior to his heel-turn towards stimulus skeptic. When the private sector is unable to find enough worthy investment projects to make use of all available savings, the economy will struggle to attain full employment, even in the presence of very low interest rates. The concept of a savings glut is also related to another, less well known, concept: a safe asset shortage. If the private sector earns more than it spends, it must, by definition, accumulate assets. In principle, governments can satiate the demand for safe assets by issuing more bonds. In practice, governments have often been reluctant to run persistently large budget deficits for fear that this could undermine their credibility. Faced with a shortage of safe assets, the private sector has stepped in to fill the void, often with disastrous consequences. Most notably, in the lead-up to the Global Financial Crisis, banks sliced and diced portfolios of risky mortgages with the goal of creating safe assets that could be sold into the market. Most financial crashes occur when investors conclude that the assets they once thought were safe are not so safe after all. This was precisely what happened to mortgage-backed securities during the 2008 mortgage meltdown. The exact same pattern repeated itself two years later when investors finally came around to the seemingly obvious conclusion that Greek government bonds were not as safe as say, German bunds. The Safe Asset Shortage In A Post-Pandemic World This brings us to the present day. After falling from 7% of GDP in 2009 to 3% of GDP in the lead-up to the pandemic, the global private-sector financial balance surged to 11% of GDP in 2020. The IMF expects the global private-sector balance to average 9% of GDP in 2021 before trending lower over the coming years. Arithmetically, the private-sector financial balance must equal the sum of the fiscal deficit and the current account balance.1 By running large budget deficits during the pandemic, governments endowed the private sector with income they otherwise would not have had. This income consisted of transfers (stimulus checks, expanded unemployment benefits, business subsidies, etc.) as well as income generated from direct government spending on goods and services. As of the end of March, we estimate that US households had accumulated about $2.2 trillion (10.5% of GDP) in savings over and above what they would have had in the absence of the pandemic. About 40% of those “excess savings” stemmed from fiscal policy with the remainder reflecting decreased consumption (Chart 3). Chart 3Lower Spending And Higher Income Have Led To Mounting Savings
Savings Gluts, Asset Shortages, And The 60/40 Split
Savings Gluts, Asset Shortages, And The 60/40 Split
Chart 4Government Largesse Boosted Savings And Fattened Bank Deposits
Government Largesse Boosted Savings And Fattened Bank Deposits
Government Largesse Boosted Savings And Fattened Bank Deposits
As the private sector’s financial balance increased, so did its asset holdings. Unlike in normal fiscal expansions where governments fund budget deficits by selling debt to the public, this time around, governments largely sold the debt to central banks. The money that governments received from central banks in return was then pumped into the economy, leading to a surge in bank deposits (Chart 4). The Nature Of Stock Market “Flows” What happened to the money after it reached people’s bank accounts? A popular narrative is that some of it flowed into the stock market. While this description is technically true, it is somewhat misleading in that it conveys the false impression that there was a net inflow of money into stocks. The reality is more nuanced. When I buy some stock, I gain some shares but lose some cash. Conversely, whoever sold me the stock gains some cash and loses some shares. In aggregate, there is no change in either the number of shares or the amount of cash that investors hold. What does change is the value of the shares in relation to the cash that investors hold. My purchase must lift the share price by enough to persuade someone else to part with their shares. If the seller does not want to hold the additional cash, he or she may try to place an order to purchase a different stock that appears more attractively priced. This game of hot potato will only end when the value of the stock market rises by enough that all investors are happy with how much stock they own in relation to how much cash they hold. Rethinking The 60/40 Split The standard investment mantra is that investors should hold 60% of their portfolios in stock and the rest in cash, bonds, and other financial assets. The discussion above casts doubt on this simple rule of thumb. Suppose that Melanie holds $600 in stock and $400 in cash, and that cash earns a real interest rate of 2%. Let us also assume that Melanie requires a 4% equity risk premium. Hence, the equity earnings yield must be 6% (i.e., her $600 in stock must correspond to $36 in earnings).2 Now let us suppose that the central bank cuts the policy rate, so that the real interest rate falls to zero. In order to maintain a 4% equity risk premium, the earnings yield must decline to 4%, which implies that the value of the stock must rise to $900 ($36/0.04=$900). Thus, we have gone from a position where Melanie holds 60% of her portfolio in stock to one where she holds about 69% ($900/$1300) in stock. In other words, even though the equity risk premium did not change at all, the desired ratio of stock-to-cash rose from $600/$400=1.5 to $900/$400=2.25. Let us continue the thought experiment and imagine a scenario where the government sends Melanie and everyone else a stimulus check of $100. Now she has $500 in cash and $900 in stock. If she wants to maintain a stock-to-cash ratio of 2.25, she would need to use some of her cash to buy stock. However, since everyone else is also looking to purchase stock with their stimulus checks, before Melanie has a chance to enter a buy order, she finds that the stock in her portfolio has appreciated to $1125. Since $1125/$500 is equal to 2.25, Melanie cancels her buy order, content with the knowledge that she holds as much stock as she wants. Notice that in this simple example, neither interest rate cuts nor stimulus checks did anything to boost corporate profits. All that happened is that stock prices rose, causing the equity earnings yield to first fall from 6% to 4% after the central bank cut rates, and then fall again from 4% to 3.2% ($36/$1125) after the stimulus checks were sent out. If all of this sounds a bit familiar, it should. The sequence of events described above is precisely what has happened over the past 12 months. And not just to stock prices. As interest rates fell and cash balances swelled, other risky assets such as cryptocurrencies went to the proverbial moon. Is The Party Over? Given that fiscal stimulus has peaked and interest rates cannot be cut any further in the major economies, are stocks set to fall? Not necessarily! The amount of stock that investors choose to hold in relation to their cash balances is a function of animal spirits. While US consumer confidence rebounded in March to the highest level in a year, it still remains well below pre-pandemic levels (Chart 5). The percentage of households in The Conference Board’s survey who expect stock prices to rise over the next 12 months is still around its long-term average (Chart 6). Chart 5Stocks Could Rise Further As Confidence Recovers
Stocks Could Rise Further As Confidence Recovers
Stocks Could Rise Further As Confidence Recovers
Chart 6The Percentage Of Households Who Expect Stock Prices To Rise Over The Next 12 Months Is Still Around Its Long-Term Average
The Percentage Of Households Who Expect Stock Prices To Rise Over The Next 12 Months Is Still Around Its Long-Term Average
The Percentage Of Households Who Expect Stock Prices To Rise Over The Next 12 Months Is Still Around Its Long-Term Average
Fortunately, the US is on target to provide a vaccine shot to everyone who wants one by the end of April.3 As the economy continues to reopen, confidence will rise further. Rising confidence, in turn, may prompt investors to increase their equity holdings. Our US equity strategists expect share buybacks to exceed share issuance over the next 12 months. Thus, the value of equity portfolios will only be able to rise if share prices go up. Outside the US and the UK and a few other smaller economies, the vaccination campaign has gotten off to a rocky start. However, the pace of inoculations is set to accelerate rapidly in the second quarter, which should pave the way to faster global growth. Global equities usually outperform bonds when growth is on the upswing (Chart 7). Chart 7Stocks Usually Outperform Bonds When Economic Growth Is Strong
Stocks Usually Outperform Bonds When Economic Growth Is Strong
Stocks Usually Outperform Bonds When Economic Growth Is Strong
While equity allocations have risen, they are below the level reached in 2000 (Chart 8). Back then, the global equity earnings yield was on par with the real bond yield. Today, the earnings yield is about six percentage points above the bond yield, a similar gap to what prevailed in late-2009 (Chart 9). Chart 8Stock Allocations Have Rebounded, But Remain Below Their 2000 Peak
Stock Allocations Have Rebounded, But Remain Below Their 2000 Peak
Stock Allocations Have Rebounded, But Remain Below Their 2000 Peak
Chart 9The Equity Risk Premium Is At Levels Similar To Late-2009
The Equity Risk Premium Is At Levels Similar To Late-2009
The Equity Risk Premium Is At Levels Similar To Late-2009
Granted, today’s high equity risk premium largely reflects the exceptionally low level of bond yields. If bond yields were to move up, the equity risk premium would shrink. While we do think that bond yields will rise by more than expected in the long run, the path to higher yields is likely to be a slow one. Rate expectations 2-to-3 years out tend to move closely in line with the 10-year yield (Chart 10). Already, there is a large gap between market expectations and the Fed dots. Whereas the market expects the Fed to start lifting rates late next year, the median Fed “dot” continues to signal no rate hike at least until 2024 (Chart 11). It is unlikely that market expectations will shift towards an even more aggressive path of rate tightening unless the Fed’s dovish rhetoric turns hawkish. As we discussed in our recently published Second Quarter Strategy Outlook, we do not expect this to happen anytime soon. Thus, with monetary policy still very loose, stocks can continue to grind higher. Chart 10Bond Yields Are Unlikely To Rise Much Unless The Market Lifts Its Estimate Of Where The Fed Funds Rate Will Be 2-To-3 Years Out
Bond Yields Are Unlikely To Rise Much Unless The Market Lifts Its Estimate Of Where The Fed Funds Rate Will Be 2-To-3 Years Out
Bond Yields Are Unlikely To Rise Much Unless The Market Lifts Its Estimate Of Where The Fed Funds Rate Will Be 2-To-3 Years Out
Chart 11A Wide Gap Has Opened Up Between Market Expectations And The Fed Dots
A Wide Gap Has Opened Up Between Market Expectations And The Fed Dots
A Wide Gap Has Opened Up Between Market Expectations And The Fed Dots
Regionally, we favour stock markets outside the US. Not only will overseas markets benefit from a rotation in growth from the US to the rest of the world in the second half of this year, but US corporate tax rates are almost certain to rise. We will be exploring the tax issue over the coming weeks. Peter Berezin Chief Global Strategist pberezin@bcaresearch.com Footnotes 1 Just as the private-sector financial balance is the difference between what the private sector earns and spends, the fiscal balance is the difference between what the government earns and spends. If the fiscal balance is negative, the government runs a deficit. If the fiscal balance is positive, the government runs a surplus. Thus, added together, the private-sector financial balance and the fiscal balance simply equals the difference between what the country as a whole earns and spends which, by definition, is equal to the current account balance. One can also see this point by rewriting the equation Y=C+I+G+X-M as (Y-T)-(C+I)=(G-T)+(X-M) where T is tax revenue, Y-T is private-sector earnings, C+I is what the private sector spends on consumption and capital goods, G-T is the fiscal deficit, and X-M is the current account balance, broadly defined to include not only the trade balance but also net income from abroad. 2 The relative attractiveness of stocks can also be inferred by subtracting the real bond yield from the earnings yield on stocks in order to get an implied equity risk premium (ERP). It is necessary to subtract the real bond yield, rather than the nominal bond yield, from the earnings yield because the earnings yield provides an estimate of the real total expected return to shareholders. For further discussion on this, please see Appendix A of the Global Investment Strategy Special Report, “TINA To The Rescue?” dated August 23, 2019. 3 Mia Sato, “The US is about to reach a surprise milestone: too many vaccines, not enough takers,” MIT Technology Review, March 22, 2021. Global Investment Strategy View Matrix
Savings Gluts, Asset Shortages, And The 60/40 Split
Savings Gluts, Asset Shortages, And The 60/40 Split
Special Trade Recommendations
Savings Gluts, Asset Shortages, And The 60/40 Split
Savings Gluts, Asset Shortages, And The 60/40 Split
Current MacroQuant Model Scores
Savings Gluts, Asset Shortages, And The 60/40 Split
Savings Gluts, Asset Shortages, And The 60/40 Split
We calculate sector and country effects for an Emerging Market portfolio. We then use our results to make conclusions on EM equity allocations. Although sector effects increased significantly over the past three years in EM, country effects continue to play a larger role. This means that EM equity investors should continue incorporating country macro views into their portfolio construction. Sector composition is more important for countries like Colombia, Mexico, and Russia whose composition is substantially different from the EM benchmark.
Put A Rolling Stop On The "Back-To-Work" Versus "COVID-19 Winners Trade"
Put A Rolling Stop On The "Back-To-Work" Versus "COVID-19 Winners Trade"
We nearly fully captured the economic reopening theme through our long “Back-To-Work”/short “COIVD-19 Winners” baskets pair trade. As a brief summary, we first initiated this trade in the September 8th, 2020 Strategy Report, and subsequently closed it earlier this year for a gain of 21.5% via a rolling stop trigger, until we reopened it once again on February 3. Fast-forward to today, and this pair trade has vaulted another 25.5% since the second inception. Now that the US equity market is euphoric on the back of stimulus news and more importantly given that the bond market is no longer responsive having already priced in four Fed hikes by the end of 2023, we opt to re-introduce a 5% rolling stop as a risk management tool in order to protect handsome profits. Bottom Line: Institute a 5% rolling stop in the long “Back-To-Work”/short “COIVD-19 Winners” baskets pair trade today.
Feature The selloff in Chinese stocks since mid-February reflects a rollover in earnings growth and multiples. Lofty valuations in Chinese equities driven by last year’s massive stimulus means that stock prices are vulnerable to any pullback in policy supports (Chart 1A and 1B). Chart 1AGrowth In Chinese Investable Earnings And Multiple Expansions Has Rolled Over
Growth In Chinese Investable Earnings And Multiple Expansions Has Rolled Over
Growth In Chinese Investable Earnings And Multiple Expansions Has Rolled Over
Chart 1BEarnings Outlook Still Looks Promising In The Onshore Market, But May Soon Peak
Earnings Outlook Still Looks Promising In The Onshore Market, But May Soon Peak
Earnings Outlook Still Looks Promising In The Onshore Market, But May Soon Peak
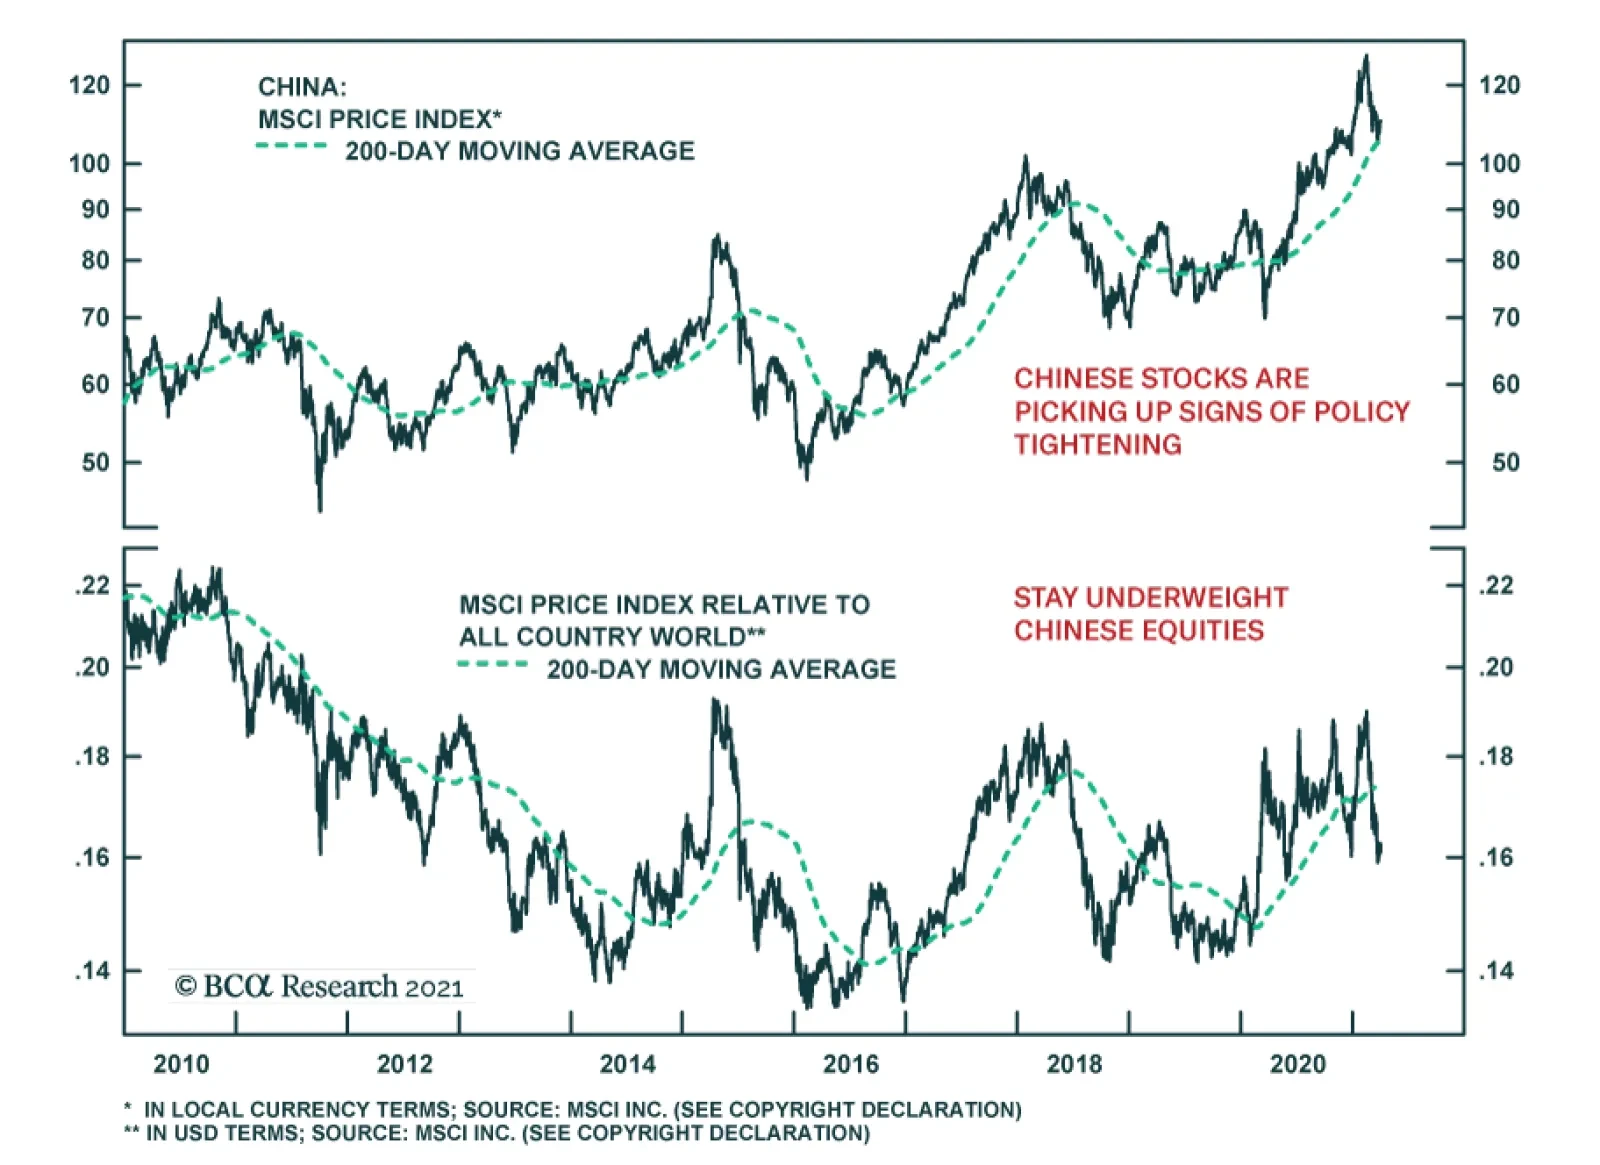
After diverging in the past seven to eight months, Chinese stocks have started to gravitate towards deteriorating monetary conditions index. The market may be beginning to price in a peak in economic as well as corporate profit growth (Chart 2). Defensive stocks in China’s onshore and offshore equity markets have also outperformed cyclicals since February, which confirms that investors expect earnings growth will slow in the coming months (Chart 3). A tighter monetary policy stance, coupled with increased regulations targeting the real estate, banking, and tech sectors have further dampened investors’ appetite for Chinese stocks. Chart 2A-Share Prices Start To Gravitate Towards Tightening Monetary Conditions
A-Share Prices Start To Gravitate Towards Tightening Monetary Conditions
A-Share Prices Start To Gravitate Towards Tightening Monetary Conditions
Chart 3Defensives Have Prevailed Over Cyclicals In Both Onshore And Offshore Markets
Defensives Have Prevailed Over Cyclicals In Both Onshore And Offshore Markets
Defensives Have Prevailed Over Cyclicals In Both Onshore And Offshore Markets
The official PMIs bounced back smartly in March following three consecutive months of decline. However, the strong PMI readings do not change our view that the speed of China’s economic recovery is near its zenith. PMIs in the first two months of the year are typically lower due to the Lunar New Year (LNY), and the improvement in March’s PMI did not exceed seasonal rebounds experienced in previous years. Weakening fixed-asset investments also indicate that economic activity is moderating. We remain cautious on the 6 to 12-month outlook for Chinese stocks, in both absolute and relative terms. Qingyun Xu, CFA Associate Editor qingyunx@bcaresearch.com Jing Sima China Strategist jings@bcaresearch.com China’s NBS manufacturing and non-manufacturing PMIs in March beat market expectations with sharp rebounds after moderating in the previous three months. The improvement in the PMIs will likely provide authorities with confidence to stay the course on policy normalization. The methodology calculating PMI indexes reflects the net reported improvement in business activities relative to the previous month and there was a notable decline in PMIs in February, due to the LNY holiday and travel restrictions related to the spread of COVID-19. Additionally, the average reading of China’s official composite PMI in Q1 this year was 2.2 percentage points lower than in Q4 last year and weaker than the Q1 PMI figures in most of the pre-pandemic years. Moreover, Chinese Caixin manufacturing PMI, which focuses on smaller and private corporates, declined further in March as it continued its downward trend started in December 2020. Chart 4Q1 PMIs Slowed By More Than Seasonal Factors
Q1 PMIs Slowed By More Than Seasonal Factors
Q1 PMIs Slowed By More Than Seasonal Factors
Chart 5Caixin PMI Shows Further Deterioration Among Private-Sector Manufacturers
Caixin PMI Shows Further Deterioration Among Private-Sector Manufacturers
Caixin PMI Shows Further Deterioration Among Private-Sector Manufacturers
Growth in credit expansions in February was better than expected, supported by a substantial increase in corporates’ demand for medium- and long-term loans. Travel restrictions during this year’s LNY led to a shorter holiday, a faster resumption in manufacturing activity after the break and stronger credit demand in February. China’s Monetary Policy Committee meeting last week reiterated the authorities’ hawkish policy tone and removed dovish language prevalent in last month’s National People’s Congress, such as “maintaining the consistency, stability, and sustainability in monetary policy” and “not making a sudden turn in policymaking.” Given the strong headline economic and credit data in January and February, the authorities will be unlikely to slow normalizing monetary policy. Therefore, the risk of a policy-tightening overshoot remains high. The PBoC has continued to drain net liquidity in the interbank system since early this year, evidenced by falling excess reserves at the central bank. Excess reserves normally lead the credit impulse by about six months, signaling that the latter will continue to decelerate in the months ahead. In turn, the credit impulse normally leads the business cycle by six to nine months, meaning that China’s cyclical economic recovery will likely peak in the first half of 2021. Chart 6Corporates Demand For Longer-Term Bank Loans Resumed Their Upward Trend Early This Year
Corporates Demand For Longer-Term Bank Loans Resumed Their Upward Trend Early This Year
Corporates Demand For Longer-Term Bank Loans Resumed Their Upward Trend Early This Year
Chart 7Falling Excess Reserves Leads To A Deceleration In Credit And Economic Growth
Falling Excess Reserves Leads To A Deceleration In Credit And Economic Growth
Falling Excess Reserves Leads To A Deceleration In Credit And Economic Growth
Robust industrial activities and improving profitability helped to boost profit growth in January and February. The bounce in producer prices also drove up returns in industrial output, particularly in upstream industries loaded with commodity producers. Nevertheless, weak final demand is limiting the ability of Chinese producers to pass on higher prices to domestic consumers, highlighted in the divergence between Chinese PPI and CPI. In addition, China’s domestic demand for commodities and industrial metals may reach its cyclical peak in mid-2021, following ongoing credit tightening and reduced economic activity. Commodity inventories have surged to historical highs due to soaring imports (which far exceeded consumption) during 2H20. Inventory destocking pressures will weigh on commodity prices with China’s domestic demand reaching its cyclical peak. Disinflation/deflation pressures may re-emerge in 2H21, which will pose downside risks to China’s industrial profits. Chart 8Industrials Posted A Strong Rebound In The First Two Months of 2021
Industrials Posted A Strong Rebound In The First Two Months of 2021
Industrials Posted A Strong Rebound In The First Two Months of 2021
Chart 9Surging Commodity Prices Helped To Boost Upstream Industry Profits
Surging Commodity Prices Helped To Boost Upstream Industry Profits
Surging Commodity Prices Helped To Boost Upstream Industry Profits
Chart 10Domestic Final Demand Remains Sluggish
Domestic Final Demand Remains Sluggish
Domestic Final Demand Remains Sluggish
Chart 11Decelerating Chinese Credit Growth Poses Downside Risks To Global Commodity Prices
Decelerating Chinese Credit Growth Poses Downside Risks To Global Commodity Prices
Decelerating Chinese Credit Growth Poses Downside Risks To Global Commodity Prices
Chart 12Chinas Raw Material Inventory Restocking Cycle May Be Near A Cyclical Peak
Chinas Raw Material Inventory Restocking Cycle May Be Near A Cyclical Peak
Chinas Raw Material Inventory Restocking Cycle May Be Near A Cyclical Peak
Chart 13Real Estate And Infrastructure Investment Losing Steam In 2021
Real Estate And Infrastructure Investment Losing Steam In 2021
Real Estate And Infrastructure Investment Losing Steam In 2021
Investments in infrastructure and real estate drove China’s economic recovery in the second half of 2020. However, growth momentum in both sectors has slowed because of retreating government spending in infrastructure and tightening regulations in the property sector. Both home sales and housing prices, especially in tier-one cities, rose significantly in January-February this year, deepening authorities’ concerns over bubble risks in the property market. The share of mortgages, deposits and advanced payments as a source of funds for property developers reached an all-time high in February. Following the LNY, the authorities introduced a slew of new restrictions on the housing market to curb excessive demand. These were in addition to placing limits on bank lending to both property developers and household mortgages. All of these measures will weigh on housing supply and demand, and the impact is already evident in falling land purchases and housing starts. At the same time, property developers are rushing to complete existing projects. The tighter regulations on real estate financing will likely weaken growth in real estate investment and construction activities in the second half of this year. Chart 14Housing Prices In Top-Tier Cities Have Been On A Tear …
Housing Prices In Top-Tier Cities Have Been On A Tear
Housing Prices In Top-Tier Cities Have Been On A Tear
Chart 15… But Bank Lending To Developers And Mortgage Loans Continue Downward Trend
But Bank Lending To Developers And Mortgage Loans Continue Downward Trend
But Bank Lending To Developers And Mortgage Loans Continue Downward Trend
Chart 16Property Developers Are Rushing To Sell And Complete Existing Projects
Property Developers Are Rushing To Sell And Complete Existing Projects
Property Developers Are Rushing To Sell And Complete Existing Projects
Chart 17Forward-Looking Indicators Suggest A Slowdown In Housing And Construction Activities
Forward-Looking Indicators Suggest A Slowdown In Housing And Construction Activities
Forward-Looking Indicators Suggest A Slowdown In Housing And Construction Activities
Table 1China Macro Data Summary
China Macro And Market Review
China Macro And Market Review
Table 2China Financial Market Performance Summary
China Macro And Market Review
China Macro And Market Review
Footnotes Cyclical Investment Stance Equity Sector Recommendations
Book Handsome Gains In Synthetic SPX Long
Book Handsome Gains In Synthetic SPX Long
Last week we highlighted BCA’s Risk Appetite Index (RAI) that has catapulted to uncharted territory. While such euphoria has not historically spelled cyclical or structural SPX trouble, it does warrant some near-term caution. Tack on the blockbuster non-farm payrolls and ISM manufacturing releases from last week and this week’s ISM services all-time high print and investors have further stampeded into stocks. Moreover, we recently showed that seasonality would boost the SPX in April before the dreaded month of May. Lastly, the equity put/call ratio collapsed to 0.38 on Monday, the VIX broke 18 and the SPX surpassed our end-2021 target of 4,000 (please look forward to receiving our SPX DDM update scheduled for the April 19 Strategy Report publication). Amidst such exuberance, and given that the 10-year US Treasury yield appears exhausted unable to breakout to fresh recovery highs, we are compelled to book handsome profits in our synthetic SPX long via closing the long $400/$420 call spread short $340 put on the SPY for June expiry for a gain of $8.86/contract or 2850% since the February 11 inception (middle panel). As a reminder, our previous synthetic long netted us $5.41/contract of 676% return as we managed to lock in gains before it fell to $0 at expiry (bottom panel). For clients that want to roll over the synthetic long position and continue to chase this manic market, we would recommend a long $415/$435 call spread with a short $365 put on the SPY for the August expiry at a net outflow of $0.2/contract. Bottom Line: Crystalize gains of $8.86/contract or 2850% and move to the sidelines on the SPX synthetic long position for now, but stay tuned. The SPX is now above our 4,000 yearend target and some near-term caution is warranted.
The Goldilocks environment for risk assets – where growth is strong, inflation is contained, and monetary policy is accommodative – has further to run and suggests that investors operating on a 12-month horizon should continue to favor stocks over bonds. The…
The global economy has been characterized by divergent recoveries. For example, the IMF’s April World Economic Outlook upgraded its 2021 US growth forecast by 1.3pp to 6.4%, versus the much more muted 0.2pp upgrade to the Euro Area growth forecast of 4.4%.…
China’s Caixin PMI showed an expansion in economic activity in March, in line with the message from the official PMI released last week. The Caixin Services PMI rebounded to 54.3 from 51.5, exceeding expectations of a 52.1 print. This offset the impact of the…
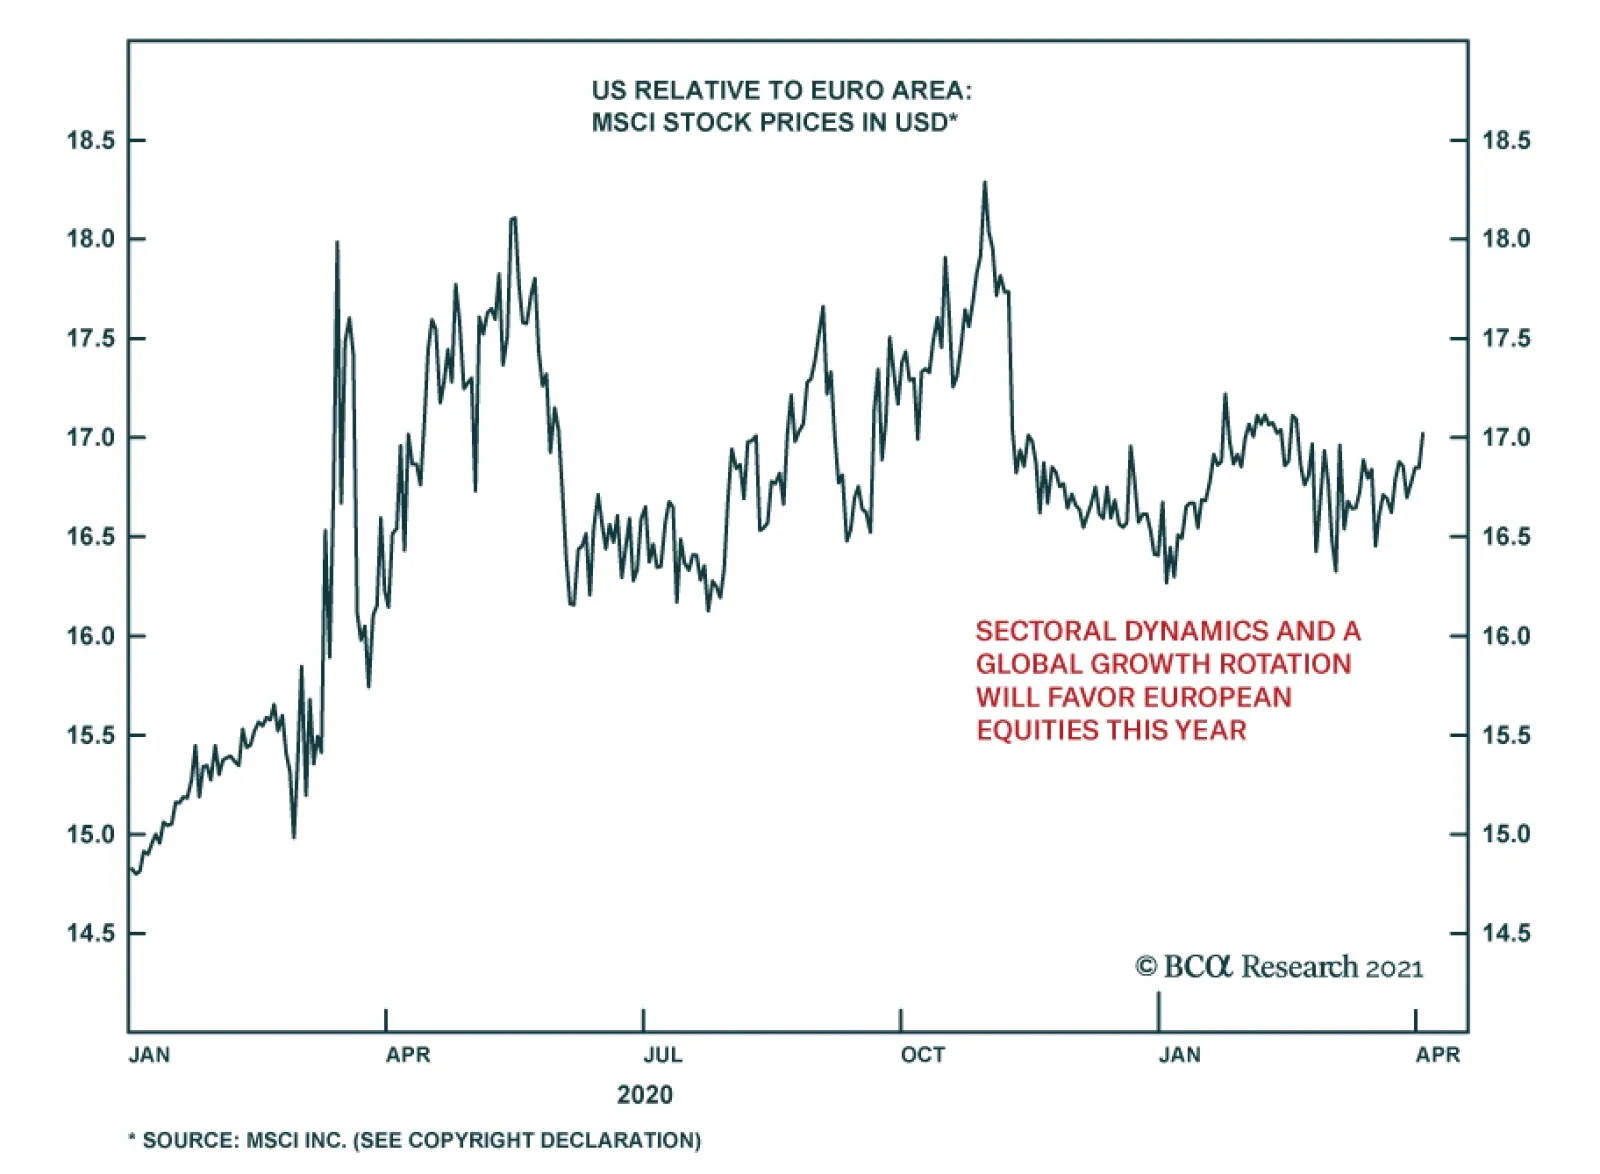
Please note that there was an error in computing Europe’s relative performance in the original text of this Insight. The revised version below corrects this error. We apologize for any inconvenience this may have caused. In local currency terms, the Dow…
Highlights The Eurozone economy and assets remain beholden to the global manufacturing cycle. This sensitivity reflects the large share of output generated by capex and exports. Yet, the second half of 2021 and first half of 2022 could see euro area growth follow the beat of its own drum. This is a consequence of the unique role of consumption in the COVID-19 recession. European growth will therefore outperform expectations, even if economic momentum slows outside of Europe. Consequently, the euro and Eurozone equities will outperform for the coming 12 to 18 months. Feature For the past 20 years, investors have used a simple rule of thumb to understand European growth and markets. Europe is a derivative of global growth because of its large manufacturing sector and torpid domestic economy. A reductionist approach would even argue that China’s economy is what matters most for Europe. Is this model still valid to analyze Europe? In general, this approach still holds up well. However, the nature of the 2020 COVID-19 recession suggests that the European economy could still accelerate in the second half of the year, despite a small slowdown in the Chinese economy and global manufacturing sector. The Origin Of The Pro-Cyclicality Narrative Investors in European markets have long understood that Eurozone equities outperform when the global manufacturing cycle accelerates. This pro-cyclicality of European stocks is a consequence of their heavy weighting toward cyclical and value stocks, such as industrials, consumer discretionary and financials. Chart 1German/US Spreads: Global Manufacturing Cycle
German/US Spreads: Global Manufacturing Cycle
German/US Spreads: Global Manufacturing Cycle
Historically, European yields have also moved in a very pro-cyclical fashion. Over the past 30 years, periods when German 10-year yields rose relative to that of US Treasury Notes have coincided with an improvement in the global manufacturing sector as approximated by the ISM Manufacturing survey (Chart 1). Investors also understand that the euro is a pro-cyclical currency. Some of this behavior reflects the counter-cyclicality of the US dollar. However, if German yields rise more than US ones when global growth improves and European equities outperform under similar conditions, the euro naturally attracts inflows when the global manufacturing sector strengthens. Chart 2China Is A Key Determinant Of European Activity
China Is A Key Determinant Of European Activity
China Is A Key Determinant Of European Activity
Ultimately, the responsiveness of the euro and European assets to global growth is rooted in the nature of the European economy. Trade and manufacturing account for nearly 40% and 14% of GDP, respectively, compared to 26% and 11% for the US. This economic specialization has made Europe extremely sensitive to the gyrations of the Chinese economy, the largest contributor to fluctuation in the global demand for capital goods. As Chart 2 highlights, European IP and PMI outperform the US when China’s marginal propensity to consume (as approximated by the growth in M1 relative to M2) picks up. Is The Pro-Cyclical Narrative Still Valid? Despite the euro area debt crisis and the slow health and fiscal policy response of European authorities to COVID-19, evidence suggests that the Eurozone’s pro-cyclicality is only increasing. Chart 3Europe Is Becoming More Sensitive To The Rest Of The World Europe Is Becoming More Sensitive To The Rest Of The World
Europe Is Becoming More Sensitive To The Rest Of The World Europe Is Becoming More Sensitive To The Rest Of The World
Europe Is Becoming More Sensitive To The Rest Of The World Europe Is Becoming More Sensitive To The Rest Of The World
A simple statistical analysis confirms this hypothesis. A look at the beta of European GDP growth against the Global PMI reveals that the sensitivity of Eurozone growth and German growth to the Global PMI has steadily increased over the past 20 years (Chart 3, top panel). Moreover, the beta of euro area growth to the global PMI is now higher than that of the US, despite a considerably lower potential GDP growth, which means that a greater proportion of the Eurozone’s GDP growth is affected by globally-driven fluctuations. The bottom panel of Chart 3 shows a more volatile but similar relationship with Chinese economic activity. Correlation analysis confirms that Europe remains very sensitive to global factors. Currently, the rolling correlation of a regression of Eurozone GDP growth versus that of China stands near 0.7, which is comparable to levels that prevailed between 2005 and 2012. The correlation between German and Chinese GDP growth is now higher than at any point during the past two decades. Chart 4The Declining Role Of Consumption
The Declining Role Of Consumption
The Declining Role Of Consumption
The increasing influence of global economic variables on the European economy reflects the evolution of the composition of the Eurozone’s GDP. Over the past 11 years, the share of consumption within GDP has decreased from 57% to 52%. For comparison’s sake, consumption accounts for 71% of US GDP. The two sectors that have taken the primacy away from consumption are capex and net exports, whose combined share has grown from 22% to 26% of GDP (Chart 4). This shift in the composition of GDP echoes the structural forces facing the Eurozone. An ageing population, a banking system focused on rebuilding its balance sheet, and the tackling of the competitiveness problems of peripheral economies have hurt wage growth, consumption and imports. Meanwhile, exports have remained on a stable trend, thanks to both the comparative vigor of the euro area’s trading partners and a cheap euro. Therefore, net exports expanded. Capex benefited from the strength in European exports. A Granger causality test reveals that consumption has little impact on fixed-capital formation in the euro area. However, the same method shows that fluctuations in export growth cause changes in investment. This makes sense. The variance in exports is an important contributor to the variability of Eurozone profits (Chart 5). Thus, rising exports incentivize the European corporate sector to expand its capital stock to fulfill foreign demand. The expanding share of output created by exports and capex along with the role of exports as a driver of capex explains why Europe economic activity is bound to remain so sensitive to the fluctuations in global trade and manufacturing activity. Moreover, the capex/exports interplay even affects consumption. As Chart 6 shows, the growth of euro area personal expenditures often bottoms after the annual rate of change of the new orders of capital goods has troughed, which reflects the role of exports as a driver of European income. Chart 5Profits And Exports
Profits And Exports
Profits And Exports
Chart 6Consumption Doesn't Move In A Vacuum
Consumption Doesn't Move In A Vacuum
Consumption Doesn't Move In A Vacuum
Bottom Line: European economic activity remains a high beta play on global and Chinese growth. The decrease in consumption to the benefit of exports and capex explains why this reality will not change anytime soon. 2021, An Idiosyncratic Year? In 2021, consumption will be the key input to the European economic performance, despite the long-term relationship between European GDP and foreign economic activity. This will allow European growth to narrow some of its gap with the US and the rest of the world in the second half of this year and the first half of 2022, even if the global manufacturing sector comes off its boil soon. The 2020 recession was unique. In a normal recession, capex, real estate investment, spending on durable goods and the manufacturing sector are the main contributors to the decline in GDP. This time, consumption and the service sector generated most of the contraction in output. These two sectors also caused the second dip in GDP following the tightening of lockdown measures across Europe last winter. Once the more recent wave of lockdowns is behind us, consumption will most likely slingshot to higher levels. More than the US, where the economy has been partially open for months now, Europe remains replete with significant pent-up demand. Obviously, fulfilling this demand will require further progress in the European vaccination campaign, something we recently discussed. Chart 7The Money Supply Forecasts A Rapid Recovery
The Money Supply Forecasts A Rapid Recovery
The Money Supply Forecasts A Rapid Recovery
The surge in M1 also points to a sharp rebound in consumption once governments lift the current lockdowns (Chart 7). M1 is a much more reliable predictor of economic activity in Europe than in the US, because disintermediation is not as prevalent in the Eurozone, where banks account for 72% and 88% of corporate and household credit, respectively, compared to 32% and 29% in the US. We cannot dismiss the explosion in the money supply as only a function of the ECB’s actions. European banks are in much better shape today than they were 10 years ago. Non-performing loans have been steadily decreasing. A rise in delinquencies is likely in the coming quarters due to the pandemic; however, the EUR3 trillion in credit guarantees by governments will limit the damages to the private sector’s and banking system’s balance sheets. Moreover, the Tier-1 capital ratio of the banking system ranges between 14% for Spain and 17% for Germany, well above the 10.5% threshold set by Basel-III (Chart 8). In this context, the pick-up in money supply mirrored credit flows. Thus, even if some of that credit reflects precautionary demand, the likelihood is high that a significant proportion of the built-up cash balances will find its way into the economy. Another positive sign for consumption comes from European confidence surveys. Despite tighter lockdown measures, consumer confidence has sharply rebounded, which historically heralds stronger consumption. Moreover, according to the ECB’s loan survey, stronger consumer confidence is causing an improvement in credit demand, which foreshadows a decline in savings intentions, especially now that wage growth is stabilizing (Chart 9). Nonetheless, there is still a risk that the advance in wages peters off. The recent wage agreement reached by Germany’s IG Metall union in North Rhine Westphalia was a paltry 1.3% annual pay raise, and once the Kurzarbeit programs end, the true level of labor market slack will become evident. However, for consumption to grow, all that we need to see now is stable wage growth, even if at a low rate. Chart 8European Banks Are Feeling Better
European Banks Are Feeling Better
European Banks Are Feeling Better
Chart 9Confidence Points To Stronger Consumption
Confidence Points To Stronger Consumption
Confidence Points To Stronger Consumption
Beyond consumption, Europe’s fiscal policy will be positive compared to the US next year. The NGEU plan will add roughly 1% to GDP in both 2021 and 2022. As a result, the Eurozone’s net fiscal drag should be no greater than 1% of GDP next year. This compares to a fiscal thrust of -7% in the US in 2022, even after factoring in the new “American Jobs Act” proposed by the Biden Administration last week, according to our US Political Strategy team. Bottom Line: The revival in European consumption in the second half of 2021 and the first half of 2022 will allow the gap between European and global growth to narrow. This dynamic will be reinforced next year, when the fiscal drag will be lower in Europe than in the US. These forces will create a rare occasion when European growth will improve despite a deceleration (albeit a modest one) in global manufacturing activity. Investment Conclusions The continued sensitivity of the euro area economy to the global industrial and trade cycle indicates that over the long-term, European assets will remain beholden to the gyrations of global growth. In other words, the euro and European stocks will outperform in periods of accelerating global manufacturing activity, as they have done over the past 30 years. The next 12 to 18 month may nonetheless defy this bigger picture, allowing European assets to generate alpha for global investors. Chart 10The Euro Will Like Idiosyncratic European Growth
The Euro Will Like Idiosyncratic European Growth
The Euro Will Like Idiosyncratic European Growth
First, the gap between US and euro area growth will narrow over the coming 12 to 18 months, thus the euro will remain well bid, even if the maximum acceleration in global industrial activity lies behind. As investors re-assess their view of European economic activity and the current period of maximum relative pessimism passes, inflows into the euro area will accelerate and the euro will appreciate (Chart 10). Hence, we continue to see the recent phase of weakness in EUR/USD as transitory. Second, European equities have scope to outperform US ones over that window. Some of that anticipated outperformance reflects our positive stance on the euro. However, a consumption-driven economic bounce will be positive for European financials as well. Such a recovery will let investors ratchet down their estimates of credit losses in the financial system. Moreover, banks are well capitalized, thus the ECB will permit the resumption of dividend payments. Under these circumstances, European banks have scope to outperform US ones temporarily, especially since Eurozone banks trade at a 56% discount to their transatlantic rivals on a price-to-book basis. An outperformance of financials will be key for Europe’s performance. Chart 11German/US Spreads Near Equilibrium?
German/US Spreads Near Equilibrium?
German/US Spreads Near Equilibrium?
Finally, we could enter a period of stability in US/German yield spreads over the coming months. The ECB remains steadfast at limiting the upside in European risk-free rates, as Christine Lagarde reiterated last week. However, BCA’s US bond strategist, Ryan Swift, believes US yields will enter a temporary plateau, as the Federal Reserve will not adjust rates until well after the US economy has reached full employment. Hence, the Fed is unlikely to let the OIS curve bring forward the date of the first hike currently priced in for August 2022 on a durable basis, which also limits the upside to US yields. Thus, looking at core CPI and policy rate differences, US yields have reached a temporary equilibrium relative to Germany (Chart 11). Mathieu Savary, Chief European Investment Strategist Mathieu@bcaresearch.com