Equities

Highlights Fiscal stimulus props up output when it’s injected into an economy, but is a consumption hangover just around the corner?: Fiscal drag is a very real phenomenon but we don’t think US investors have to worry about a consumption drag any time soon, given that consumption has yet to see a bounce. Is the housing market’s boom vulnerable to reversing?: Powered by an outward shift in the demand curve for single-family homes in the suburbs and beyond and helped along by a chronic supply deficit, it appears that the housing boom has at least another year or two to run. Is the Archegos implosion a sign of broader weaknesses?: Based on what we know now, we do not believe that one levered investor’s reported demise is a symptom of systemic problems in financial markets or the banking system. Feature BCA’s monthly editorial view meeting, held last week, underlined the unusual level of uncertainty confronting investors. Against a backdrop of enormous domestic fiscal stimulus and global monetary accommodation, an entire generation of market participants is ruminating about inflation for the very first time. The course of the pandemic remains a significant unknown; while the US has seemingly lined up all the vaccine doses it will need and has begun to hit its vaccination stride, infections are rising and Europe and Canada are still mired in shutdowns. It has been easy to tally up the excess pandemic savings as they’ve accumulated into what we expect will be a $2 trillion mass, but we can only guess how much of the hoard will be spent and when. It is unclear what elements of the infrastructure spending vision laid out by President Biden last week will make it through a Congress deeply riven by partisan conflict and fissures within the Democratic caucus and the fate of its associated tax hike proposals is therefore uncertain. Against this backdrop of unknowns, we highlight the questions that have come up the most in our recent discussions with clients. We continue to have a constructive view on risk assets and the economy but the situation is fluid and we will take our cue from the evidence as it emerges. A Stimulus Hangover? Q: I get that fiscal stimulus will produce a big GDP pop this year, but what happens after it’s gone? Is the US heading for a consumption/income hangover in 2022? It’s true that the US cannot keep pumping out transfer payments to households at its 2020 and 2021 rate. It’s also true, however, that fewer and fewer households are in need of them. Employee compensation surpassed its February 2020 pre-pandemic peak in both January and February (Chart 1) and it should continue to rise as more and more people go back to work. Conversely, unemployment assistance should naturally dwindle as vaccinations allow the private sector to take the baton from the federal government. Chart 1Aggregate Compensation Is Making New Highs
Aggregate Compensation Is Making New Highs
Aggregate Compensation Is Making New Highs
Chart 2The Big Surge Has Yet To Come
The Big Surge Has Yet To Come
The Big Surge Has Yet To Come
The end of the economic impact payments ($1,400 to adults earning $75,000 or less in the current round, following $1,200 and $600 rounds last spring and this January) will represent something of a fiscal cliff for vulnerable households. They have a high marginal propensity to consume and presumably have been depending on the transfers, as evidenced by the revised 7.6% month-over-month spike in January retail sales upon the distribution of the $600 round and its subsequent 3% decline in February (Chart 2). As people return to work, however, the number of vulnerable households should shrink. We nonetheless do not fear a near-term consumption hangover for the simple reason that there was no consumption sugar rush in 2020. Consumption growth has badly lagged increases in household net worth as the multitude of households who didn’t really need the economic impact payments used them to pad their savings, pay down debt or buy stocks. Once the $1,400 checks are fully disbursed, we estimate that excess household savings will top $2 trillion. Much of those excess pandemic savings have accumulated because households were unable to spend on things like restaurant meals, travel, movies, concerts and sporting events. We are confident that they will spend again once they recover their full menu of options, but much of the forgone services spending will simply be lost. Some of the unintended pandemic savings will remain savings and the consumption tailwind driven by pent-up demand will eventually dissipate. When that happens, consumption may indeed hit a bit of a wall and economic growth will likely decelerate. The key for our twelve-month market outlook is that the unfettered release of pent-up demand cannot begin until households recover their full range of consumption options. They won’t do so until the economy fully reopens, which means the inevitable slowdown clock has not yet begun to tick. One can’t be hungover without first getting drunk and the longer it takes for the consumption surge to arrive, the longer the slowdown will be delayed. In our most likely scenario, the hangover won’t arrive until 2023, beyond the time horizon of most institutional investors. How Vulnerable Is The Housing Market? Q: The US housing market has experienced a remarkable recovery. Is the real estate boom sustainable or is it vulnerable to a sudden reversal? We believe the real estate boom can be sustained over the next year and beyond. It is supported by strong demand, affordable financing and tight supplies. Against a backdrop of extended supply shortfalls, there is scope for prices to continue to rise even as new construction activity accelerates (Chart 3). Residential investment accounts for a modest amount of economic activity but housing is nonetheless likely to remain in a sweet spot in which rising prices boost household wealth at the margin and increasing activity boosts employment and income. Chart 3Falling Supply, Rising Prices
Falling Supply, Rising Prices
Falling Supply, Rising Prices
Chart 4A Seller's Market
A Seller's Market
A Seller's Market
The pandemic has acted to stoke demand for suburban single-family homes and it appears as if at least some of the migration from urban centers to suburban and exurban/rural communities will outlast the pandemic. Several businesses have already moved to lower their real estate expenses by shrinking their office footprints in high-cost central business districts (CBD). Working from home will be an option for many professionals going forward and a lot of them may choose to trade high-cost-per-square-foot city apartments for much cheaper space in the suburbs and beyond now that they are no longer tethered to their CBD offices five days a week. In addition to the work-from-home catalyst, the flow from cities may be persistent if urban living becomes less attractive in a post-pandemic world that features fewer bars and restaurants and lingering wariness about close interactions with crowds. The supply of houses is historically low when adjusted for the total number of US households (Chart 4) and the tight conditions are only partly related to the pandemic. The first pandemic feature is an unwillingness to have (potentially infected) prospective buyers trooping through one’s house to examine it. The second is an aversion among older people to sell their homes and move to the senior-living facilities that incubated infections in the pandemic’s initial waves. Both of these factors are temporary and should ease quickly once widespread immunization stifles COVID’s spread. The longer-run supply factor is restrictive zoning laws that make it difficult to construct new homes. This is an intractable issue in many if not most of the more desirable locations across the country and it will not be solved quickly or easily (Chart 5). Demand was poised to exceed supply in many of the nation’s housing markets even before work from home unshackled skilled professionals from their offices. That dynamic should help keep prices firm while supporting residential investment and construction employment. Chart 5New Home Construction Has Lagged Since The GFC
New Home Construction Has Lagged Since The GFC
New Home Construction Has Lagged Since The GFC
Chart 6Homes Are Still Affordable
Homes Are Still Affordable
Homes Are Still Affordable
Finally, houses remain quite affordable (Chart 6, top panel). Despite a backup of 40-50 basis points from the 2.8% bottom, the rates on 30-year fixed-rate mortgages are still extremely low relative to history (Chart 6, third panel). Buying is an appealing alternative to renting despite the rise in home prices over the last year (Chart 6, bottom panel). The rate of price appreciation is likely to slow once the pandemic supply impediments fade, but US home construction has not kept pace with long-run household formation growth and we expect the housing market will remain robust for at least the next year or two. Have Termites Gotten Into The Beams? Q: Retail investors nearly brought down a hedge fund with a large short position in GameStop (GME). Now a family office that looked a lot like a hedge fund has blown up after its prime brokers allowed it to amplify long equity exposures with ridiculous amounts of leverage. We all know there’s never just one cockroach. Do you think there’s a deeper rot in this market after 12 years of gains disconnected from the fundamentals? The details of the reported fire sales of margin collateral that may have wiped out the multi-billion-dollar Archegos portfolio have not been made public. No one but the parties involved have definitive knowledge of what occurred but it’s always worth thinking about what could go wrong, especially twelve years into a bull market. We can state with full confidence, however, that the S&P 500’s extended run has not been disconnected from the fundamentals. Chart 7Earnings Growth Has Outpaced Multiple Expansion
Earnings Growth Has Outpaced Multiple Expansion
Earnings Growth Has Outpaced Multiple Expansion
Treating the pandemic sell-off as a vicious correction instead of a full-fledged bear market that ushered in a brand-new bull market, the current bull market began in March 2009 and has lasted for twelve years and one month (Chart 7, top panel). When it began, four-quarter forward consensus earnings estimates for the S&P 500 were $65. As of March 26th, forward four-quarter earnings were $180. Over the duration of the bull market, S&P 500 earnings estimates have nearly tripled, growing at an 8.75% annualized rate (Chart 7, middle panel). The index’s forward multiple has nearly doubled, from 11.25 to 21.5, rising at a 5.5% annualized rate (Chart 7, bottom panel). Earnings growth has accounted for the majority (about 61%) of the index’s 14.75% annualized gain. Through last January, ahead of the pandemic, when the forward multiple was 18.3, earnings growth accounted for two-thirds of the gain. The pandemic leg has been a re-rating phenomenon, but it slanders the overall advance to say that it has been disconnected from fundamentals. Earnings growth has been solid for an extended period of time and is poised to accelerate to 9.2% by the end of the year if today’s consensus expectations for calendar 2022 hold up. As for the issues raised by the news reports of Archegos’ demise, it is well understood that long bull markets breed excesses. It may be disheartening that a sizable pool of institutional capital found a way to use bespoke derivative instruments to game the system and evade regulatory attention but it’s certainly not surprising. When money, elections, university admissions, Olympic laurels, the World Series or the Tour de France are at stake, many people will do nearly anything to get an edge. Post-GFC measures like Basel III and the Volcker rule have made the regulated banking system more stable, but markets will never be completely shock-proof as long as humans are involved with them. We enjoy reading exposés as much as anyone else but we try to keep in mind that not every item the media sink their teeth into is evidence of systemic rot. There is a lot that is still not known about the Archegos saga beyond the apparent outlines of a highly leveraged investor who got into trouble when its underlying positions went the wrong way. It is striking to see broker-dealers challenging the three major ETF sponsors for ownership primacy in individual equities, as they do in DISCA, GSX, IQ, TME and VIAC – all stocks in which Archegos reportedly amassed large synthetic exposures. Credit Suisse and Nomura, which were singed the worst by Archegos exposures, have sizable holdings in several other companies, as do other broker-dealers. The presence of those other holdings might lead one to conclude that Archegos was not the only investor to discover that total-return swaps/contracts for difference offered a way to ramp up exposures. One might also conclude that the broker-dealers, finding households and non-financial businesses had little appetite for loans, were only too happy to provide leverage to investors via their prime brokerage arms. The two conclusions do not mean that a collapse is imminent, however. We continue to recommend that investors maintain risk-friendly portfolio positioning, albeit with added vigilance and a bias to shorten holding periods given the uncertain and potentially volatile backdrop. Doug Peta, CFA Chief US Investment Strategist dougp@bcaresearch.com
Weekly Performance Update For the week ending Thu Apr 01, 2021 The Market Monitor displays the trailing 1-quarter performance of strategies based around the BCA Score. For each region, we construct an equal-weighted, monthly rebalanced portfolio consisting of the top 3 stocks per sector and compare it with the regional benchmark. For each portfolio, we show the weekly performance of individual holdings in the Top Contributors/Detractors table. In addition, the Top Prospects table shows the holdings that currently have the highest BCA Score within the portfolio. For more details, click the region headers below to be redirected to the full historical backtest for the strategy. BCA US Portfolio
Market Monitor (Apr 01, 2021)
Market Monitor (Apr 01, 2021)
Total Weekly Return BCA US Portfolio S&P500 TRI 2.30% 2.84% Top Contributors UTHR:US TX:US QFIN:US WES:US VICI:US Weekly Return 43 bps 26 bps 18 bps 18 bps 17 bps Top Detractors VIPS:US ESGR:US ARD:US UGI:US ACHC:US Weekly Return -17 bps -8 bps -4 bps -4 bps -3 bps Top Prospects ESGR:US TX:US QFIN:US VIPS:US SCCO:US BCA Score 99.76% 99.39% 97.20% 96.28% 95.00% BCA Canada Portfolio
Market Monitor (Apr 01, 2021)
Market Monitor (Apr 01, 2021)
Total Weekly Return BCA Canada Portfolio S&P/TSX TRI 2.75% 1.95% Top Contributors IFP:CA PXT:CA CFP:CA VII:CA TOU:CA Weekly Return 47 bps 35 bps 33 bps 33 bps 25 bps Top Detractors QBR.A:CA RCI.B:CA T:CA LNF:CA WEED:CA Weekly Return -11 bps -11 bps -10 bps -8 bps -7 bps Top Prospects LNF:CA IFP:CA LNR:CA CFP:CA LIF:CA BCA Score 98.91% 97.52% 97.24% 97.01% 96.13% BCA UK Portfolio
Market Monitor (Apr 01, 2021)
Market Monitor (Apr 01, 2021)
Total Weekly Return BCA UK Portfolio FTSE 100 TRI 1.94% 0.96% Top Contributors OXIG:GB NLMK:GB SVST:GB TM17:GB IPO:GB Weekly Return 36 bps 25 bps 22 bps 20 bps 17 bps Top Detractors DRX:GB XPP:GB ROSN:GB CNE:GB TYMN:GB Weekly Return -15 bps -8 bps -6 bps -6 bps -4 bps Top Prospects NLMK:GB GLTR:GB SVST:GB FXPO:GB BPCR:GB BCA Score 98.61% 97.92% 97.85% 96.33% 95.79% BCA Eurozone Portfolio
Market Monitor (Apr 01, 2021)
Market Monitor (Apr 01, 2021)
Total Weekly Return BCA EMU Portfolio MSCI EMU TRI 2.54% 2.74% Top Contributors SOL:IT PAH3:DE TEN:IT VGP:BE MOL:IT Weekly Return 29 bps 20 bps 16 bps 15 bps 15 bps Top Detractors SES:IT PHH2:DE HDG:NL MMT:FR GCO:ES Weekly Return -6 bps -5 bps -5 bps -4 bps -0 bps Top Prospects PHH2:DE SOLV:BE BEKB:BE SOL:IT SES:IT BCA Score 99.57% 99.23% 97.72% 97.51% 95.53% BCA Japan Portfolio
Market Monitor (Apr 01, 2021)
Market Monitor (Apr 01, 2021)
Total Weekly Return BCA Japan Portfolio TOPIX TRI -0.72% 0.97% Top Contributors 2362:JP 4980:JP 8595:JP 8966:JP 3132:JP Weekly Return 27 bps 14 bps 11 bps 10 bps 7 bps Top Detractors 9506:JP 9503:JP 2692:JP 5943:JP 7942:JP Weekly Return -16 bps -16 bps -15 bps -12 bps -11 bps Top Prospects 9436:JP 5451:JP 4008:JP 7279:JP 7942:JP BCA Score 99.17% 98.88% 98.73% 98.65% 98.57% BCA Hong Kong Portfolio
Image
Total Weekly Return BCA Hong Kong Portfolio Hang Seng TRI 3.97% 3.72% Top Contributors 148:HK 1888:HK 1088:HK 990:HK 856:HK Weekly Return 48 bps 45 bps 34 bps 34 bps 27 bps Top Detractors 41:HK 3306:HK 3369:HK 737:HK 991:HK Weekly Return -13 bps -4 bps -4 bps -3 bps 0 bps Top Prospects 990:HK 1378:HK 86:HK 737:HK 3306:HK BCA Score 99.89% 99.32% 98.84% 98.79% 98.51% BCA Australia Portfolio
Market Monitor (Apr 01, 2021)
Market Monitor (Apr 01, 2021)
Total Weekly Return BCA Australia Portfolio S&P/ASX All Ord. TRI 1.30% 0.63% Top Contributors ZIM:AU PDN:AU GRR:AU AQZ:AU BSE:AU Weekly Return 72 bps 25 bps 24 bps 15 bps 10 bps Top Detractors AGL:AU BLX:AU WPP:AU ADH:AU SOL:AU Weekly Return -19 bps -14 bps -13 bps -11 bps -6 bps Top Prospects GRR:AU BSE:AU ZIM:AU BLX:AU WPP:AU BCA Score 99.50% 99.47% 99.43% 98.58% 96.21%
Highlights Global manufacturing activity will soon peak due to growing costs and China’s policy tightening. This process will allow the dollar’s rebound to continue. EUR/USD’s correction will run further. This pullback in the euro is creating an attractive buying opportunity for investors with a 12- to 24-month investment horizon. Eurozone banks will continue to trade in unison with the euro. Feature The correction in the euro has further to run. The dollar currently benefits from widening real interest differentials, but a growing list of headwinds will cause a temporary setback for the global manufacturing sector, which will fuel the greenback rally further. Nonetheless, EUR/USD will stabilize between 1.15 and 1.12, after which it will begin a new major up-leg. Consequently, investors with a 12- to 24-month investment horizon should use the current softness to allocate more funds to the common currency. A Hiccup In Global Industrial Activity Global manufacturing activity is set to decelerate on a sequential basis and the Global Manufacturing PMI will soon peak. The first problem for the global manufacturing sector is the emergence of financial headwinds. The sharp rebound in growth in the second half of 2020 and the optimism created by last year’s vaccine breakthrough as well as the rising tide of US fiscal stimulus have pushed US bond yields and oil prices up sharply. These financial market moves are creating a “growth tax” that will bite soon. Mounting US interest rates have lifted global borrowing costs while the doubling in Brent prices has increased the costs of production and created a small squeeze on oil consumers. Thus, even if the dollar remains well below its March 2020 peak, our Growth Tax Indicator (which incorporates yields, oil prices and the US dollar) warns of an imminent top in the US ISM Manufacturing and the Global Manufacturing PMI (Chart 1). Already, the BCA Global Leading Economic Indicator diffusion index has dipped below the 50% line, which usually ushers in downshifts in global growth. A deceleration in China’s economy constitutes another problem for the global manufacturing cycle. Last year’s reflation-fueled rebound in Chinese economic activity was an important catalyst to the global trade and manufacturing recovery. However, according to BCA Research’s Emerging Market Strategy service, Beijing is now tightening policy, concerned by a build-up in debt and excesses in the real estate sector. Already, the PBoC’s liquidity withdrawals are resulting in a decline of commercial bank excess reserves, which foreshadows a slowing of China’s credit impulse (Chart 2). Chart 1The Global Growth Tax Will Bite
The Global Growth Tax Will Bite
The Global Growth Tax Will Bite
Chart 2Chinese Credit Will Slow
Chinese Credit Will Slow
Chinese Credit Will Slow
In addition to liquidity withdrawals, Chinese policymakers are also tightening the regulatory environment to tackle excessive debt buildups and real estate speculation. The crackdown on property developers and house purchases will cause construction activity to shrink in the second half of 2021. Meanwhile, tougher rules for both non-bank lenders and the asset management divisions of banks will further harm credit creation. BCA’s Chief EM strategist, Arthur Budaghyan, notes that consumer credit is already slowing. Chinese fiscal policy is unlikely to create a counterweight to the deteriorating credit impulse. China’s fiscal impulse will be slightly negative next year. Chinese financial markets are factoring in these headwinds, and on-shore small cap equities are trying to break down while Chinese equities are significantly underperforming global benchmarks. Chart 3Deteriorating Surprises
Deteriorating Surprises
Deteriorating Surprises
Bottom Line: The combined assault from the rising “growth tax” and China’s policy tightening is leaving its mark. Economic surprises in the US, the Eurozone, EM and China have all decelerated markedly (Chart 3), which the currency market echoes. Some of the most pro-cyclical currencies in the G-10 are suffering, with the SEK falling relative to the EUR and the NZD and AUD both experiencing varying degrees of weakness. The Euro Correction Will Run Further… Until now, the euro’s decline mostly reflects the rise in US interest rate differentials; however, the coming hiccup in the global manufacturing cycle is causing a second down leg for the euro. First, the global economic environment remains consistent with more near-term dollar upside, due to: Chart 4Commodities Are Vulnerable
Commodities Are Vulnerable
Commodities Are Vulnerable
A commodity correction that will feed the dollar’s rebound. Aggregate speculator positioning and our Composite Technical Indicator show that commodity prices are technically overextended (Chart 4). With this backdrop, the coming deceleration in Chinese economic activity is likely to catalyze a significant pullback in natural resources, which will hurt rates of returns outside the US and therefore, flatter the dollar. The dollar’s counter-cyclicality. The expected pullback in the Global Manufacturing PMI is consistent with a stronger greenback (Chart 5). The dollar’s momentum behavior. Among G-10 FX, the dollar responds most strongly to the momentum factor (Chart 6). Thus, the likelihood is high that the dollar’s recent rebound will persist, especially because our FX team’s Dollar Capitulation Index has only recovered to neutral from oversold levels and normally peaks in overbought territory. Chart 5The Greenback's Counter-Cyclicality
The Greenback's Counter-Cyclicality
The Greenback's Counter-Cyclicality
Chart 6The Dollar Is A High Momentum Currency
The Euro Dance: One Step Back, Two Steps Forward
The Euro Dance: One Step Back, Two Steps Forward
Second, the euro’s specific dynamics remain negative for now. Based on our short-term valuation model, the fair value of EUR/USD has downshifted back to 1.1, which leaves the euro 7% overvalued (Chart 7). Until now, real interest rate differentials and the steepening of the US yield curve relative to Germany’s have driven the decline in the fair value estimate. However, the deceleration in global growth also hurts the euro’s fair value because the US is less exposed than the Eurozone to the global manufacturing cycle. Chart 7The Euro's Short-Term Fair Value Is At 1.1
The Euro's Short-Term Fair Value Is At 1.1
The Euro's Short-Term Fair Value Is At 1.1
Chart 8Speculators Have Not Capitulated
Speculators Have Not Capitulated
Speculators Have Not Capitulated
The euro is also technically vulnerable, similar to commodities. Speculators are still massively net long EUR/USD and the large pool of long bets in the euro suggests that a capitulation has yet to take place (Chart 8). The euro responds very negatively to a weak Chinese economy. The Eurozone has deeper economic ties with China than the US. Exports to China account for 1.7% of the euro area’s GDP, and 2.8% of Germany’s compared to US exports to China at 0.5% of GDP. Indirect financial links are also larger. Credit to EM accounts for 45% of the Eurozone’s GDP compared to 5% for the US. Thus, the negative impact of a Chinese slowdown on EM growth has greater spillovers on European than on US ones rates of returns. A weak CNY and sagging Chinese capital markets harm the euro. The euro’s rebound from 1.064 on March 23 2020 to 1.178 did not reflect sudden inflows into European fixed-income markets. Instead, the money that previously sought higher interest rates in the US left that country for EM bonds and China’s on-shore fixed-income markets, the last major economies with attractive yields. These outflows from the US to China and EM pushed the dollar down, which arithmetically helped the euro. Thus, the recent EUR/USD correlates closely with Sino/US interest rate and with the yuan because the euro’s strength reflects the dollar demise (Chart 9). Consequently, a decelerating Chinese economy will also hurt EUR/USD via fixed-income market linkages. Finally, the euro will depreciate further if global cyclical stocks correct relative to defensive equities. Deep cyclicals (financials, consumer discretionary, energy, materials and industrials) represent 59% of the Eurozone MSCI benchmark versus 36% of the US index. Cyclical equities are exceptionally overbought and expensive relative to defensive names. They are also very levered to the global business cycle and Chinese imports. In this context, the expected deterioration in both China’s economic activity and the Global Manufacturing PMI could cause a temporary but meaningful pullback in the cyclicals-to-defensives ratio and precipitate equity outflows from Europe into the US (Chart 10). Chart 9EUR/USD And Chinese Rates
EUR/USD And Chinese Rates
EUR/USD And Chinese Rates
Chart 10EUR/USD Will Follow Cyclicals/Defensives
EUR/USD Will Follow Cyclicals/Defensives
EUR/USD Will Follow Cyclicals/Defensives
Bottom Line: A peak in the global manufacturing PMI will hurt the euro, especially because China will meaningfully contribute to this deceleration in global industrial activity. Thus, the euro’s pullback has further to run. An important resistance stands at 1.15. A failure to hold will invite a rapid decline to EUR/USD 1.12. Nonetheless, the euro’s depreciation constitutes nothing more than a temporary pullback. … But The Long-Term Bull Market Is Intact We recommend buying EUR/USD on its current dip because the underpinnings of its cyclical bull market are intact. Chart 11Investors Structurally Underweight Europe
Investors Structurally Underweight Europe
Investors Structurally Underweight Europe
First, investors are positioned for a long-term economic underperformance of the euro area relative to the US. The depressed level of portfolio inflows into Europe relative to the US indicates that investors already underweight European assets (Chart 11). This pre-existing positioning limits the negative impact on the euro of the current decrease in European growth expectations (Chart 11, bottom panel). Second, as we wrote last week, European growth is set to accelerate significantly this summer. Considering the absence of ebullient investor expectations toward the euro, this process can easily create upside economic surprises later this year, especially when compared to the US. Moreover, the deceleration in Chinese and global growth will most likely be temporary, which will limit the duration of their negative impact on Europe. Third, the US stimulus measure will create negative distortions for the US dollar. The addition of another long-term stimulus package of $2 trillion to $4 trillion to the $7 trillion already spent by Washington during the crisis implies that the US government deficit will not narrow as quickly as US private savings will decline. Therefore, the US current account deficit will widen from its current level of 3.5% of GDP. As a corollary, the US twin deficit will remain large. Meanwhile, the Fed is unlikely to increase real interest rates meaningfully in the coming two years because it believes any surge in inflation this year will be temporary. Furthermore, the FOMC aims to achieve inclusive growth (i.e. an overheated labor market). This policy combination forcefully points toward greater dollar weakness. The US policy mix looks particularly dollar bearish when compared to that of the Eurozone. To begin with, the balance of payment dynamics make the euro more resilient. The euro area benefits from the underpinning of a current account surplus of 1.9% of GDP. Moreover, the European basic balance of payments stands at 1.5% of GDP compared to a 3.6% deficit for the US. Additionally, FDI into Europe are rising relative to the US. The divergence in the FDI trends will continue due to the high probability that the Biden administration will soon increase corporate taxes. Chart 12The DEM In The 70s
The DEM In The 70s
The DEM In The 70s
The combination of faster vaccine penetration and much larger fiscal stimulus means that the US economy will overheat faster than Europe’s. Because the Fed seems willing to tolerate higher inflation readings, US CPI will rise relative to the Eurozone. In the 1970s, too-easy policy in Washington meant that the gap between US and German inflation rose. Despite the widening of interest rate and growth differentials in favor of the USD or the rise in German relative unemployment, the higher US inflation dominated currency fluctuations and the deutschemark appreciated (Chart 12). A similar scenario is afoot in the coming years, especially in light of the euro bullish relative balance of payments. Fourth, valuations constitute an additional buttress behind the long-term performance of the euro. Our FX strategy team Purchasing Power Parity model adjusts for the different composition of price indices in the US and the euro area. Based on this metric, the euro is trading at a significant 13% discount from its long-term fair value, with the latter being on an upward trend (Chart 13). Furthermore, BCA’s Behavioral Exchange Rate Model for the trade-weighted euro is also pointing up, which historically augurs well for the common currency. Lastly, even if the ECB’s broad trade-weighted index stands near an all-time high, European financial conditions remain very easy. This bifurcation suggests that the euro is not yet a major hurdle for the continent and can enjoy more upside (Chart 14). Chart 13EUR/USD Trades Well Below Long-Term Fair Value
EUR/USD Trades Well Below Long-Term Fair Value
EUR/USD Trades Well Below Long-Term Fair Value
Chart 14Easy European Financial ##br##Conditions
Easy European Financial Conditions
Easy European Financial Conditions
Chart 15Make Room For the Euro!
Make Room For the Euro!
Make Room For the Euro!
Finally, the euro will remain a beneficiary from reserve diversification away from the USD. The dollar’s status as the premier reserve currency is unchallenged. However, its share of global reserves has scope to decline while the euro’s proportion could move back to the levels enjoyed by legacy European currencies in the early 1990s (Chart 15). Large reserve holders will continue to move away from the dollar. BCA Research’s Geopolitical Strategy team argues that US tensions with China transcend the Trump presidency. Meanwhile, the current administration’s relationship with Russia and Saudi Arabia will be cold. For now, their main alternative to the dollar is the euro because of its liquidity. Moreover, the NGEU stimulus program creates an embryonic mechanism to share fiscal risk within the euro area. The Eurozone is therefore finally trying to evolve away from a monetary union bereft of a fiscal union. This process points toward a lower probability of a break up, which makes the euro more attractive to reserve managers. Bottom Line: Despite potent near-term headwinds, the euro’s long-term outlook remains bright. Global investors already underweight European assets, yet balance of payment and policy dynamics point toward a higher euro. Moreover, valuations and geopolitical developments reinforce the cyclical tailwinds behind EUR/USD. Thus, investors with a 12- to 24-month investment horizon should use the current euro correction to gain exposure to the European currencies. Any move in EUR/USD below 1.15 will generate a strong buy signal. Sector Focus: European Banks And The Istanbul Shake The recent decline in euro area bank stocks coincides with the 14% increase in USD/TRY and the 17% decline in the TUR Turkish equities ETF following the sacking of Naci Ağbal, the CBRT governor. President Erdogan is prioritizing growth over economic stability because his AKP party is polling poorly ahead of the 2023 election. The Turkish economy is already overheating, and the lack of independence of the CBRT under the leadership of Şahap Kavcıoğlu promises a substantial increase in Turkish inflation, which already stands at 16%. Hence, foreign investors will flee this market, creating further downward pressures on the lira and Turkish assets. European banks have a meaningful exposure to Turkey. Turkish assets account for 3% of Spanish bank assets or 28% of Tier-1 capital. For France, this exposure amounts to 0.7% and 5% respectively, and for the UK, it reaches 0.3% and 2%. As a comparison, claims on Turkey only represent 0.3% and 0.5% of the assets and Tier-1 capital of US banks. Unsurprisingly, fluctuations in the Turkish lira have had a significant impact one the share prices of European banks in recent years, even after controlling for EPS and domestic yield fluctuations (Table 1). Table 1TRY Is Important To European Banks…
The Euro Dance: One Step Back, Two Steps Forward
The Euro Dance: One Step Back, Two Steps Forward
Nonetheless, today’s TRY fluctuations are unlikely to have the same lasting impact on European banks share prices as they did from 2017 to 2019 because European banks have already shed significant amounts of Turkish assets (Chart 16). This does not mean that European banks are out of the woods yet. The level of European yields remains a key determinant of the profitability of Eurozone’s banks, and thus, of their share prices (Chart 17, top panel). Moreover, the euro still tightly correlates with European bank stocks as well (Chart 17, bottom panel). As a result, our view that the global manufacturing cycle will experience a temporary downshift and the consequent downside in EUR/USD both warn of further underperformance of European banks. Chart 16… But Less Than It ##br##Once Was
The Euro Dance: One Step Back, Two Steps Forward
The Euro Dance: One Step Back, Two Steps Forward
Chart 17Higher Yields And A stronger Euro, These Are Few Of My Favorite Things
Higher Yields And A stronger Euro, These Are Few Of My Favorite Things
Higher Yields And A stronger Euro, These Are Few Of My Favorite Things
These same views also suggest that this decline in bank prices is creating a buying opportunity. Ultimately, we remain cyclically bullish on the euro and the transitory nature of the manufacturing slowdown implies that global yields will resume their ascent. The cheap valuations of European banks, which trade at 0.6-times book value, make them option-like vehicles to bet on these trends, even if the banking sectors long-term prospects are murky. Moreover, they are a play on Europe’s domestic recovery this summer. We will explore banks in greater detail in future reports. Mathieu Savary, Chief European Investment Strategist Mathieu@bcaresearch.com
Highlights The Biden administration is combining Trumpian nationalism with a renewed push for US innovation in a major infrastructure bill that is highly likely to become law. Populism and Great Power struggle with China and Russia are structural forces that give enormous momentum to this effort. Don’t bet against it. President Biden’s $2.4 trillion infrastructure and green energy plan has a subjective 80% chance of passing into law by the end of the year, as infrastructure is popular and Democrats control Congress. The net deficit increase will range from $700 billion to $1.3 trillion depending on the size of corporate tax hikes in the final bill. The second part of Biden’s plan, the roughly $2 trillion American Families Plan, has a much lower chance of passage – at best 50/50 – as the 2022 midterm elections will loom and fiscal fatigue will set in. While the US infrastructure package is a positive cyclical catalyst, it was largely expected, and the Biden administration still faces early stress-tests on China/Taiwan, Russia, Iran, and even North Korea. Game theory helps explain why financial markets cannot ignore the 60% chance of a crisis in the Taiwan Strait. A full-fledged war is still low-probability but Taiwan remains the world’s preeminent geopolitical risk. In emerging markets, stay short Russian and Brazilian currency and assets – and continue favoring Indian stocks over Chinese. Feature The “arsenal of democracy” is a phrase that President Franklin Delano Roosevelt used to describe the full might of US government, industry, and labor in assisting the western allies in World War II. The US is reviving this combination of productive forces today, with President Joe Biden’s $4 trillion-plus American Jobs and Families Plan unveiled in Pittsburgh on March 31. The context is once again a global struggle among the Great Powers, albeit not world war (at least not yet … more on that below). The US is reviving its post-WWII pursuit of global liberal hegemony – symbolized by its role, growing once again, as the world’s chief consumer and chief warrior (Chart 1). Biden promoted his plan to build up the US’s infrastructure and social safety net explicitly as a historic and strategic investment – “in 50 years, people are going to look back and say this was the moment that American won the future.”1 It is critical for investors to realize that they are not witnessing another round of COVID-19 fiscal relief. That task is already completed with the Republican spending of 2020 and Biden’s own $1.9 trillion American Rescue Plan Act (ARPA), which together with the vaccine rollout are delivering a jolt to growth (Chart 2). Chart 1America Pursues Hegemony Anew
America Pursues Hegemony Anew
America Pursues Hegemony Anew
Chart 2Consensus Expects 6.5% US GDP Growth After American Rescue Plan
Consensus Expects 6.5% US GDP Growth After American Rescue Plan
Consensus Expects 6.5% US GDP Growth After American Rescue Plan
Our own back-of-the-envelope estimates of growth suggest that there is considerable upside risk even under current law (Chart 3). The output gap is also guesstimated here, and it will tighten faster than expected, especially as the service sector revives on economic reopening. Chart 3Back-Of-Envelope: US GDP And Output Gap Show Upside Risk After American Rescue Plan Act (ARPA)
The Arsenal Of Democracy
The Arsenal Of Democracy
A growth overshoot is even more likely considering that the first part of Biden’s proposal, the $2.4 trillion American Jobs Plan consisting mostly of infrastructure and green energy, is highly likely to pass Congress (by July at earliest and December at latest, most likely late fall). Our revised estimates for the US budget deficit show that this bill will add considerably to the deficit in the coming years, peaking in three or four years, thus averting the “fiscal cliff” in 2022-23 and adding to aggregate demand in the years after the short-term COVID-era cash handouts dry up (Chart 4). The net deficit increase will be $700 billion if Biden gets all of his tax hikes and $1.3 trillion if he only gets half of them, according to our sister US Political Strategy. Chart 4US Budget Deficit Will Remain Fat In Coming Years
The Arsenal Of Democracy
The Arsenal Of Democracy
We give Biden’s $2.4 trillion American Jobs Plan an 80% chance of passing through Congress by the end of the year. Infrastructure is broadly popular – as President Trump’s own $2 trillion infrastructure campaign proposal revealed – and Democrats have just enough votes to push it through the Senate via budget reconciliation, which requires zero votes from Republicans. Biden’s political capital is still strong given that his approval rating will stay above 50% as long as Trump is the obvious alternative and the Republicans are deeply divided over their own future (Chart 5).2 The second part of his plan, the $1.95 trillion American Families Plan, is much less likely to pass before the 2022 midterm elections – we would say 50/50 odds at best, if the infrastructure deal passes quickly. Chart 5Biden’s Political Capital Is Sufficient To Pass Another Major Law
The Arsenal Of Democracy
The Arsenal Of Democracy
Of course there are very important differences between Biden’s $2.4 trillion infrastructure plan and the similarly sized proposal that Trump would have unveiled this month had he been re-elected: Biden’s proposal is probably heavier on innovation and research and development, and certainly heavier on unionization and labor regulation, than Trump’s would have been. Biden’s plan integrates infrastructure with sustainability, renewable energy, and climate change initiatives that will help the US catch up with Europe and China on the green front. The plan will consist of direct government spending – rather than government seed money to promote private investment. It will be partially offset by repealing the corporate tax cuts in Trump’s signature Tax Cuts and Jobs Act. Most importantly – from a geopolitical point of view – Biden is making a bid for the US to resume its post-WWII quest for global liberal hegemony. He argued that the US stands at the crossroads of a global choice between “democracies and autocracies” and that rebuilding US infrastructure is ultimately about proving that democracies can create consensus and “deliver for their people.” Autocratic regimes, fairly or not, routinely call attention to the divisiveness of modern party politics in the West and the resulting policy gridlock which produces bad outcomes for many citizens, resulting in greater domestic dysfunction and “chaos.” It is important to note that this bid for hegemony will be more, not less, destabilizing for global politics as it will make the US economy more self-sufficient and insulated from the world. It will intensify the US-China and US-Russia strategic competition while making it more difficult for Biden to conduct bilateral diplomacy with these states given their differences in moral values and frequent human rights violations. What is happening now is the culmination of political shifts that pre-date the pandemic, but were galvanized by the pandemic, and it is of global, geopolitical significance for the coming decade and beyond.3 Biden and the establishment Democrats – embattled by populism on their right and left flanks – are shamelessly coopting President Trump’s “Make America Great Again” nationalism with a larger-than-life, infrastructure-and-manufacturing initiative that emphasizes productivity as well as “Buy American” protectionism. Biden explicitly argued that Americans need to boost innovation to “put us in a position to win the global competition with China in the upcoming years.” At Biden’s first press conference on March 25, he made a similar point about China: So I see stiff competition with China. China has an overall goal, and I don’t criticize them for the goal, but they have an overall goal to become the leading country in the world, the wealthiest country in the world, and the most powerful country in the world. That’s not going to happen on my watch because the United States are going to continue to grow and expand.4 The US trade deficit is set to widen a lot further under this massive domestic buildout. It aims to be the largest government investment program since Dwight Eisenhower’s building of the highways or the Kennedy-Johnson-Nixon space race. But it explicitly aims to diminish China’s role as a supplier of US goods and materials and the US trade deficit already shows evidence of economic divorce (Chart 6). The US is bound to have a larger trade deficit due to its own savings-and-investment imbalances but it has a powerful interest in redistributing this trade deficit to its allies and reducing over-dependency on China, which is itself pursuing strategic self-sufficiency and military modernization in anticipation of an ongoing rivalry this century. Chart 6Biden's Coopts Trump's Trade And Manufacturing Agenda
Biden's Coopts Trump's Trade And Manufacturing Agenda
Biden's Coopts Trump's Trade And Manufacturing Agenda
Bottom Line: Biden’s $2.4 trillion American Jobs Plan has an 80% chance of passing Congress later this year with a net increase to the fiscal thrust of between $700 billion and $1.3 trillion, depending on how many and how high the corporate tax hikes. The other $2 trillion social spending part of Biden’s plan has only a 50/50 chance of passage. The infrastructure and green energy rebuild should be understood as a return of Big Government motivated by populism and Great Power competition – it is a geopolitical theme with enormous momentum. The result will be faster US growth and higher inflation expectations, with the upside risk of a productivity boom (or boomlet) from the combination of public and private sector innovation. Investors should not bet against the cyclical bull market even though any increase in long-term potential GDP is speculative. A Fourth Taiwan Strait Crisis And The Cuban Missile Crisis Biden’s American Jobs Plan reserves $50 billion for US semiconductor manufacturing, a vast sum, larger than expectations and far larger than the relatively small public investments that helped revolutionize the US chip industry in the 1980s. But it will take a long time for these investments to pay off in the form of secure and redundant supply chains, while a semiconductor shortage is raging today that is already entangled with the US-China rivalry and tensions over the Taiwan Strait. The risk of a diplomatic or military incident is urgent because the chip shortage exacerbates China’s vulnerabilities at a time when the Biden administration is about to make critical decisions regarding the tightness of new export controls that cut off China’s access to US semiconductor chips, equipment, and parts. If the Biden administration appears to pursue a full-fledged tech blockade, as the Trump administration seemed bent on doing, then China will retaliate economically or militarily. Before going further we should point out that there are still areas of potential US-China cooperation under the Biden administration that could reduce tensions this year (though not over the long run). Biden and Xi Jinping might meet virtually as early as this month to discuss carbon emission reduction targets. Meanwhile China is positioning itself to serve as power-broker on two major foreign policy challenges – Iran and North Korea. Biden expressly seeks Chinese and Russian assistance based on the mutual interest in nuclear non-proliferation. Notably, Beijing’s renewed strategic dealings with Iran over the past month highlight its confidence that Biden does not have the appetite to stick with Trump’s “maximum pressure” but rather will seek to reduce sanctions and restore the 2015 nuclear deal. Hence China will seek to parlay influence over Tehran in exchange for reduced US pressure on its trade and economy (Chart 7). Beijing is making a similar offer on North Korea. Chart 7China Holds The Key To Iran, As With North Korea?
China Holds The Key To Iran, As With North Korea?
China Holds The Key To Iran, As With North Korea?
Ironically both Iranian and North Korean geopolitical tensions should skyrocket in the short term since high-stakes negotiations are beginning, even though they are ultimately more manageable risks than the mega-risk of US-China conflict over Taiwan. China cannot gain the advanced technology it needs to achieve a strategic breakthrough if the US should impose a total tech blockade, e.g. draconian export controls enforced on US allies. Yet it is highly unlikely to gain the tech by seizing Taiwan, since war would likely destroy the computer chip fabrication plants and provoke global sanctions that would crush its economy. The result is that China is launching a massive campaign of domestic production and indigenous innovation while circumventing US restrictions through cyber and other means. Still, a dangerous strategic asymmetry is looming because the US will retain access to the most advanced computer chips via its alliances and on-shoring, whereas China will remain vulnerable to a tech blockade via Taiwan. This brings us to our chief global geopolitical risk: a US-China showdown in the Taiwan Strait. Highlighting the urgency of the risk, Admiral John Aquilino, the nominee for Commander of the US Indo-Pacific Command, told the Senate Armed Services Committee that China might not wait six years to attack Taiwan: “My opinion is that this problem is much closer to us than most think and we have to take this on.”5 To illustrate the calculus of such a showdown – and our reasons for maintaining an alarmist tone and building up market hedges and safe-haven investments – we turn to game theory. Game theory is not a substitute for empirical analysis but a tool to formalize complex international systems with multiple decision-makers. An obvious yet fair analogy to a US-China-Taiwan crisis is the Cuban missile crisis of 1962.6 The standard construction of the Cuban missile crisis in game theory goes as follows: if the US maintains a blockade and the Soviets withdraw their missiles a compromise is achieved and war is averted; if the US conducts air strikes and the Soviets maintain or use their missiles then war ensues. The payouts to each player are shown in the matrix in Diagram 1. Diagram 1Cuban Missile Crisis, 1962
The Arsenal Of Democracy
The Arsenal Of Democracy
One concern about this construction is that the payouts may underestimate the costs of war since nuclear arms could be used. We insert a comment into the diagram highlighting that the payouts could be altered to account for nuclear war. Note that this alteration does not change the final outcome: the equilibrium scenario is still US blockade and Soviet withdrawal, which is what happened in reality. If we model a US-China-Taiwan conflict along similar lines, the US takes the role of the Soviet Union while China stands where the US stood in 1962 (Diagram 2). This is a theoretical scenario in which the US offers Taiwan a decisive improvement in its security or offensive military capabilities. However, because of the unique circumstances of the Chinese civil war, in which the victors established the People’s Republic of China in Beijing in 1949 and the defeated forces retreated to Taiwan, China’s regime legitimacy is at stake in any showdown over Taiwan. If Beijing suffered a defeat that secured Taiwan’s independence while degrading Beijing’s regime legitimacy and security, the Chinese regime might not survive the domestic blowback.7 Diagram 2Fourth Taiwan Strait Crisis – What Happens If The US Offers Game-Changing Military Support To Taiwan?
The Arsenal Of Democracy
The Arsenal Of Democracy
Thus we reduce the Chinese payout in the case of American victory. In the top right cell of Diagram 2, the row player’s payout falls from two points (2ppt) in the first diagram to one point (1ppt) in this diagram. This seemingly slight change entirely alters the outcome of the game. Beijing now faces equally bad outcomes in the event of defeat, whereas victory remains preferable to a tie. Therefore as long as China believes that the US will not resort to nuclear weapons to defend Taiwan (a reasonable assessment) then it may make the mistake of opting for military force to ensure victory. Fortunately for global investors the US is not providing Taiwan with game-changing military capabilities, although it is ultimately up to China to decide what threatens its security and the US is in the process of upgrading Taiwan’s defense in an effort to deter Beijing from forceful reunification. Thus the exercise demonstrates why we do not expect immediate war – no game-changer yet – but at the same time it shows why war is much likelier than the consensus holds if the military or political status quo changes in a way that China deems strategically unacceptable. A lower-degree Taiwan crisis should be expected – i.e. one in which the US maintains tech restrictions, offers arms sales or military training that do not upend the military balance, or signs free trade agreements or other significant upgrades to the US-Taiwan relationship.8 We would give a 60% probability to some kind of crisis over the next 12-24 months. The global equity market could at least suffer a 10% correction in a standard geopolitical crisis and it could easily fall 20% if US-China war appears more likely. What would trigger a full-fledged Taiwan war? We would grow even more alarmed if we saw one of three major developments: Chinese internal instability giving rise to a still more aggressive regime; the US providing Taiwan with offensive military capabilities; or Taiwan seeking formal political independence. The first is fairly likely, the second lends itself to miscalculation, and the third is unlikely. But it would only take one or two of these to increase the war risk dramatically. Bottom Line: The Taiwan Strait is still the critical geopolitical risk and Biden’s policy on China is still unclear. Iranian and North Korean tensions will escalate in the short run but the fundamental crisis lies in Taiwan. Since some kind of showdown is likely and war cannot be ruled out we advise clients to accumulate safe-haven assets like the Japanese yen and otherwise not to bet headlong against the US dollar until it loses momentum. Emerging Markets Round-Up In this section we will briefly update some important emerging market themes and views: Chart 8Favor USMCA Over Putin's Russia
Favor USMCA Over Putin's Russia
Favor USMCA Over Putin's Russia
Russia: US-Russia tensions are escalating in the face of Biden’s reassertion of the US bid for liberal hegemony, which poses a direct threat to Russia’s influence in eastern Europe and the former Soviet Union. Ukraine is expected to see a renewed conflict this spring. The top US and Russian military commanders spoke on the phone for the second time this year after Ukrainian military reports indicated that Russia is amassing forces on the border. We also assign a 50/50 chance that the US will use sanctions to prevent the completion of the NordStream II pipeline from Russia to Germany, an event that would shake up the German election as well as provoke a Russian backlash. The Russian ruble has suffered a long slide since Putin’s invasion of Georgia in 2008 and Crimea in 2014 and the country’s currency and equities have not staged much of a comeback amid the global cyclical upswing and commodity price rally post-COVID. We recommend investors favor the Canadian dollar and Mexican peso as oil plays in the context of American stimulus and persistent Russian geopolitical risk (Chart 8). We also favor developed market European stocks over emerging Europe, which will suffer from renewed US-Russia tensions. Brazil: Brazilian President Jair Bolsonaro’s domestic political troubles are metastasizing as expected – the rally-around-the-flag effect in the face of COVID-19 has faded and his popular approval rating now looks dangerously like President Trump’s did, relative to previous presidents, which is an ominous warning for the “Trump of the South,” who faces an election in October 2022 (Chart 9). The COVID-19 deaths are skyrocketing, with intensive care units reaching critical levels across the country. The president has reshuffling his cabinet, including all three heads of the military in an unprecedented disruption that compounds fears about his willingness to politicize the military.9 Meanwhile the judicial system looks likely (but not certain) to clear former President Luiz Inácio Lula da Silva to run against Bolsonaro for the presidency, a potent threat (Chart 10). Bolsonaro’s three pillars of political viability have cracked under the pandemic: the country remains disorderly, the systemic corruption and the “Car Wash” scandal under the former ruling party are no longer at the center of public focus, and fiscal stimulus has replaced structural reform. Chart 9Brazil: Will ‘Trump Of The South’ Face Trump’s Fate?
The Arsenal Of Democracy
The Arsenal Of Democracy
Our Brazilian GeoRisk Indicator has reached a peak with Bolsonaro’s crisis – and likely breaking of the fiscal spending growth cap put in place at the height of the political crisis in 2016 – while Brazilian equities relative to emerging markets have hit a triple bottom (Chart 11). It is too soon for investors to buy into Brazil given that the political upheaval can get worse before it gets better and a Lula administration is no cure for Brazil’s public debt crisis, though a short-term technical rally is at hand. Chart 10Brazil’s Lula Looks To Be A Contender In 2022?
The Arsenal Of Democracy
The Arsenal Of Democracy
Chart 11Brazil: Policy Risk Peaks, Equities Hit Triple-Bottom Versus EM
Brazil: Policy Risk Peaks, Equities Hit Triple-Bottom Versus EM
Brazil: Policy Risk Peaks, Equities Hit Triple-Bottom Versus EM
India: A lot has happened since we last updated our views on India, South Asia, and the broader Indian Ocean basin. Farmer protests broke out in India, forcing Prime Minister Narendra Modi to temporarily suspend his much-needed structural reforms to the agricultural sector, while China-backed military coup broke out in Myanmar, and the US election set up a return to negotiations with Iran and the Taliban in Afghanistan. Perhaps the biggest surprise was the Indo-Pakistani ceasefire, despite boiling tensions over India’s decision to make Jammu and Kashmir a federal union territory. The ceasefire is temporary but it does highlight a changing geopolitical dynamic in the region. India and Pakistan ceased fire along the Line of Control where they have fought many times. The ceasefire does not resolve core problems – Pakistan will not stop supporting militant proxies and India will not grant Kashmir autonomy – but it does show their continued ability to manage the intensity of disputes while dealing with the global pandemic. An earlier sign of coordination occurred after the exchange of air strikes in early 2019, which preceded the Indian election and suggested that India and Pakistan had the ability to control their military encounters. India’s move to revoke the autonomy of Jammu and Kashmir in August 2019, along with various militant operations, created the basis for another major conflict this year. After all, the Kargil war in 1999 followed nuclear weaponization, while the 2008 conflict followed the Mumbai attack. But instead India and Pakistan have agreed to a temporary truce. A major India-Pakistan conflict would be a “black swan” as nobody is expecting it at this point. Not coincidentally, India and China also reduced tensions after the flare-up in their Himalayan territorial disputes in 2020. China may be reducing tensions now that it no longer has to distract its population from Trump and the US election. China is shifting its focus to the Myanmar coup, another area where it hopes to parlay its influence with a Biden administration preoccupied with democracy and human rights. Sino-Indian tensions will resume later, especially as China continues its infrastructure construction at the farthest reaches of its territory for the sake of economic stimulus, internal control, and military logistics. The Biden administration is adopting the Trump administration’s efforts to draw India into a democratic alliance. But more urgently it is trying to withdraw from Afghanistan and cut a deal with Iran, which means it will need Indian and Pakistani cooperation and will want India to play a supportive role. Typically India eschews alliances and it will disapprove of Biden’s paternalism. For both China and Pakistan, making a temporary truce with India discourages it from synching up relations with the US immediately. Still, we expect India to cooperate more closely with the US over time, both on economic and security matters. This includes a beefed up “Quad” (Quadrilateral Security Dialogue) with Japan and Australia, which already have strong economic ties with India. Biden’s attempt to frame US foreign policy as a global restoration of democracy and liberalism will not go very far if he alienates the largest democracy in the world and in Asia. Nor will his attempt to diversify the US economy away from China or counter China’s regional assertiveness. Therefore Biden will have to take a supportive role on US-India ties. We are sticking with our contrarian long India / short China equity trade (Chart 12). India cannot achieve its geopolitical goals without reforming its economy and for that very reason it will redouble its structural reform drive, which is supported by changing voting patterns in favor of accelerating nationwide economic development. India will also receive a tailwind from the US and its allies as they seek to diversify production sources and reduce supply chain dependency on China, at least for health, defense, and tech. Meanwhile China’s government is pursing import substitution, deleveraging, and conflict with its neighbors and the United States. While Chinese equities are much cheaper than Indian equities on a P/E basis, they are not as pricey on a P/B and P/S basis (Chart 13) – and valuation trends can continue under the current macro and geopolitical backdrop. Indian equities are more volatile but from a long-term and geopolitical point of view, India’s moment has arrived. Chart 12Contrarian Trade: Stick To Long India / Short China
Contrarian Trade: Stick To Long India / Short China
Contrarian Trade: Stick To Long India / Short China
Bottom Line: Stay long Indian equities relative to Chinese and stay short Russian and Brazilian currencies and assets. These views are based on political and geopolitical themes that will remain relevant over the long run but are also seeing short-term confirmation. Chart 13Indian Stocks Not As Over-Priced On Price-To-Book, Price-To-Sales
Indian Stocks Not As Over-Priced On Price-To-Book, Price-To-Sales
Indian Stocks Not As Over-Priced On Price-To-Book, Price-To-Sales
Investment Takeaways To conclude we want to highlight two investment takeaways. First, while the market has rallied in expectation of the US stimulus package, Biden must now get the package passed. This roller coaster process, combined with the inevitable European recovery once the vaccine rollout gets on its feet (Chart 14), will power an additional rally in cyclicals, value stocks, and commodities. This is true as long as China does not tighten monetary and fiscal policy too abruptly, a risk we have highlighted in previous reports. Chart 14Europe's Vaccination Problem
Europe's Vaccination Problem
Europe's Vaccination Problem
While the US is pursuing “Buy American” provisions within its stimulus package, its growing trade deficit shows that it will be forced to import goods and services to meet its surging demand. This is beneficial for its nearest trade partners, Canada and Mexico, and Europe – as well as China substitutes further afield in some cases. Our European Investment Strategist Mathieu Savary has pointed out the opportunities lurking in Europe at a time when vaccine troubles and lockdowns are clouding the medium-term economic view, which is brightening. He recommends going long the “laggard” sectors and sub-sectors that have not benefited much relative to “leaders” that rallied sharply in the wake of last year’s stimulus, vaccine discovery, and defeat of President Trump (Chart 15). The laggard sectors are primed to outperform on rising US interest rates and decelerating Chinese economy as well (Chart 16). Therefore we recommend going long his basket of Euro Area laggards and short the leaders. Chart 15Europe’s Laggards And Leaders
The Arsenal Of Democracy
The Arsenal Of Democracy
Chart 16Macro Forces Favor The Laggards over the Leaders
Macro Forces Favor The Laggards over the Leaders
Macro Forces Favor The Laggards over the Leaders
Chart 17Will OPEC 2.0 Maintain Production Discipline To Keep Oil Supplies Tight?
Will OPEC 2.0 Maintain Production Discipline To Keep Oil Supplies Tight?
Will OPEC 2.0 Maintain Production Discipline To Keep Oil Supplies Tight?
Commodities – especially base metals – will continue to benefit from the global and European reopening as well as the US infrastructure buildout, assuming that China does not shoot its economy in the foot. Our Commodity & Energy Strategy highlights that global oil prices should remain in a $60-$80 per barrel range over the coming years on the back of tight supply/demand balances and ongoing OPEC 2.0 production management (Chart 17). We continue to see upside oil price risks in the first half of the year but downside risks in the second half. The US pursuit of a deal with Iran may trigger sparks initially – i.e. unplanned supply outages – but this will be followed by increased supply from Iran and/or OPEC 2.0 as a deal becomes evident. Matt Gertken Vice President Geopolitical Strategy mattg@bcaresearch.com Footnotes 1 White House, "Remarks by President Biden on the American Jobs Plan," Pittsburgh, Pennsylvania, March 31, 2021, whitehouse.gov. 2 A bipartisan bill is conceivably, barely, since Republicans face pressure to join with such a popular bill, but they cannot accept the corporate tax hikes, unionization, or green boondoggles that will inevitably occur. 3 The pandemic and President Trump’s hands-off attitude toward it helped galvanize this revival of Big Government, but the revival was already well on its way prior to the pandemic. 4 White House, "Remarks by President Biden in Press Conference," March 25, 2021, whitehouse.gov. 5 Again, "the most dangerous concern is that of a military force against Taiwan," though he implied that Beijing would wait until after the February 2022 Winter Olympics before taking action. He requested that the US urgently increase regional military defense. See Senate Armed Services Committee, "Nomination – Aquilino," March 23, 2021, armed-services.senate.gov. 6 At that time the Soviet Union stationed nuclear missiles in Cuba that threatened the US homeland directly and sent a convoy to make the missile installation permanent. The US imposed a blockade. A showdown ensued, at great risk of war, until the Soviets withdrew and the Americans made some compromises regarding missiles in Turkey. 7 Note that this was not the case for the US in 1962: Cuba did not have special significance for the legitimacy of the American republic and the American regime would have survived a defeat in the showdown, although its security would have been greatly compromised. 8 Taiwan is proposing to buy a missile segment enhancement for its Patriot Advanced Capability-3 missile defense system for delivery in 2025, though this is not yet confirmed by the Biden administration. See for example Yimou Lee, "Taiwan To Buy New U.S. Air Defence Missiles To Guard Against China," Reuters, March 31, 2021, reuters.com. 9 See Monica Gugliano, "I Will Intervene! The Day Bolsonaro Decided To Send Troops To The Supreme Court," Folha de São Paulo, August 2020, piaui.folha.uol.com.br.
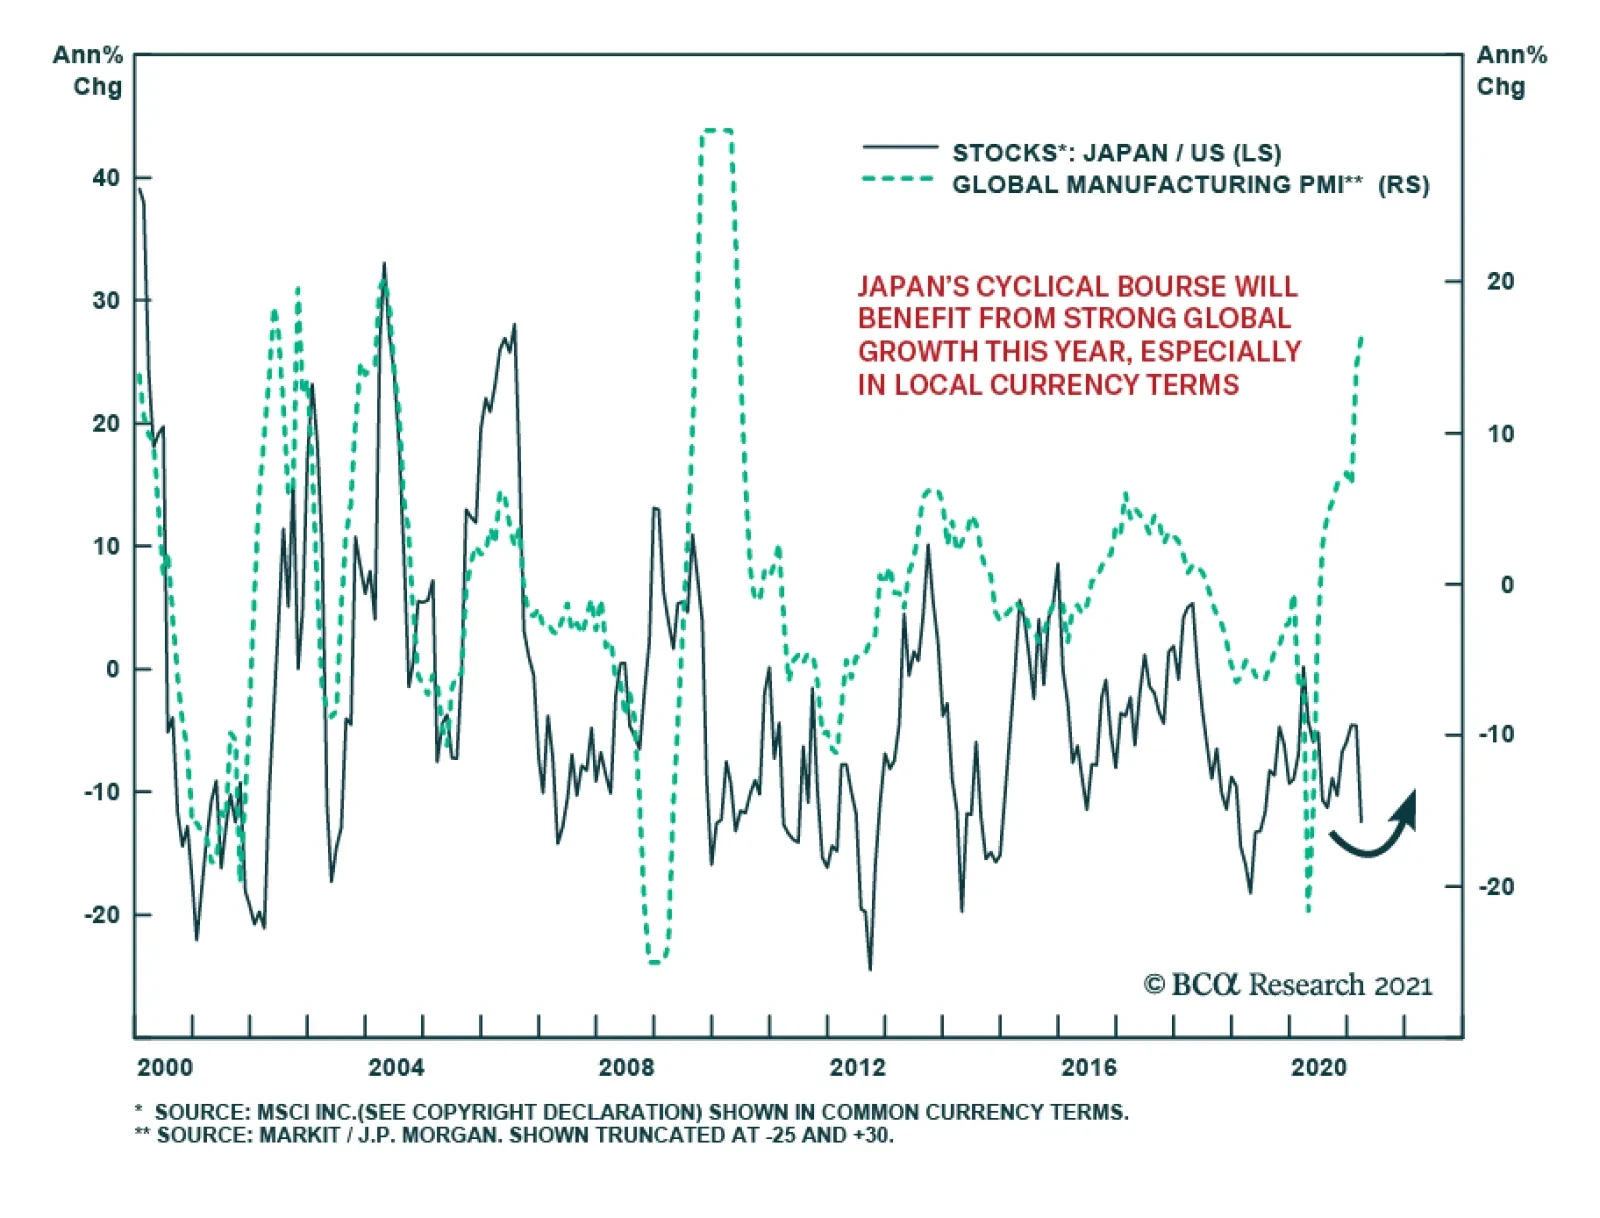
Japanese equities have stalled so far this year. The MSCI Japan index is up a negligible 0.8% in US dollar terms, underperforming the MSCI All-Country World index. Nonetheless, in local currency terms, Japanese equities outperformed, which fits with the…
Highlights President Biden’s $2.4 trillion “American Jobs Plan” is a major US public investment that will dispel any endogenous deflationary tail risk from the US economy this cycle, increase inflation expectations yet boost productivity, and hike corporate taxes. The proposal has an 80% chance of passage before the end of the year given that infrastructure is popular and Democrats can pass the bill via reconciliation with zero Republican votes. The $2.4 trillion infrastructure proposal will take effect over eight years and will be offset by corporate tax hikes that will take effect over 15 years. The increase in the budget deficit will be around $400 billion if all tax hikes pass and $1.4 trillion if only half the tax hikes pass. The American Families Plan will follow with another roughly $700 billion to $1.3 trillion increase to the budget deficit, depending on how much individual/household taxes go up. But this bill only has a 50/50 chance of passing before the 2022 midterm elections. Investors should maintain a bullish cyclical (12-month) bias and keep favoring value stocks, industrials, and materials over tech and health care. We also recommend going long consumer discretionary stocks and energy large caps versus small caps. Feature President Joe Biden spoke in Pittsburgh on Wednesday to unveil his economic vision and policy proposals going forward. Biden proposed a $2.4 trillion “American Jobs Plan” infrastructure and green energy package to be implemented over eight years, which will be part of a $4 trillion-plus “Build Back Better” legislative agenda that will be partially offset by an estimated $3 trillion in tax hikes to take effect over 15 years. The result will be a pro-cyclical boost to fiscal thrust, GDP growth, and inflation expectations; some potential for a productivity boom; a possible expansion of the social safety net; and tax reform that reduces US corporate profits. Pennsylvania is a Rust Belt state, Biden’s home state, and a critical swing state in the 2016 and 2020 elections, so the location makes sense. Biden aims to solidify the economic recovery and restore the Democratic Party’s leadership on infrastructure and manufacturing after Republican President Trump nearly stole their thunder. If he succeeds then his administration and party will improve their support substantially. The US economy is opening rapidly while the COVID-19 vaccination campaign continues apace. Chart 1 shows that household disposable income and net worth surged as a result of giant fiscal relief while consumer spending lags behind due to social distancing. The $1.7 trillion treasure chest of personal savings creates the basis for an increase in spending as consumers get vaccinated and regain their freedom. Economic policy uncertainty has collapsed, even relative to global uncertainty (Chart 2). There are no longer doubts about whether government will spend the country out of a slump. Even state and local governments have been bailed out despite having much stronger finances than predicted. However, there are doubts about how much more deficit spending the Biden administration will be able to push through, and that is what will now be debated in Congress following Biden’s Pittsburgh proposals. Chart 1Lower Spending And Higher Income Led To Mounting Excess Savings
Lower Spending And Higher Income Led To Mounting Excess Savings
Lower Spending And Higher Income Led To Mounting Excess Savings
Chart 2US Policy Uncertainty Soon To Revive
US Policy Uncertainty Soon To Revive
US Policy Uncertainty Soon To Revive
There will not be much of a deflationary tail risk to the new business cycle in the context of this expansive fiscal policy, as bullish investors are well aware. However, policy uncertainty will revive going forward as more spending will raise the risk of economic overheating, tax hikes will affect different sectors disproportionately, deficits and debt will balloon, and Biden’s challenges with immigration and foreign policy will intensify. There is an upside risk for the stock market that Congress delays tax hikes but this is not our base case. In this week’s report we revise and update our estimates for the impact of Biden administration’s legislative proposals – including his projected $4 trillion-plus in spending on infrastructure, health, and education – taking into consideration Biden’s Pittsburgh speech, his first press conference on March 25, and all the rumors and leaks that have come to light over the past two weeks. Back-Of-The-Envelope Estimates Of US Growth And Output Gap After ARPA First we need to revise our back-of-the-envelope estimates of the impact of the $1.9 trillion American Rescue Plan Act (ARPA). Chart 3 shows two scenarios for US GDP growth. The first is the “maximum” scenario, in which US real GDP grows by 10.7% because all of the money authorized under the new law is spent. The second scenario puts real growth at 6% by using only the Congressional Budget Office’s expected federal outlays (as opposed to budget authority) to estimate the government spending component of GDP. In both cases we assume that 33% of the fiscal relief is spent in FY2021 and the remainder in FY2022. These scenarios do not include Biden’s American Jobs and Families Plans because those bills have yet to be drafted, let alone pass Congress. Chart 3Revised US GDP Estimates With ARPA
Biden’s Pittsburgh Speech And Legislative Agenda
Biden’s Pittsburgh Speech And Legislative Agenda
Consensus estimates put real GDP growth at 5.7% and the Federal Reserve estimates that 2021 growth will clock in at 6.5%, as shown in Chart 4. Not all of the government spending will translate directly into aggregate demand because 37% of the ARPA consists of direct checks and unemployment benefits to households that may only spend one-third of the amount they receive (while paying down debt with a third of it and saving a third of it). Yet more government deficit spending is coming down the pike and consumers are sitting on a huge pile of savings, which implies that growth could surprise to the upside of consensus estimates. Chart 4Consensus Estimates Of US GDP PosT-ARPA
Consensus Estimates Of US GDP PosT-ARPA
Consensus Estimates Of US GDP PosT-ARPA
Chart 5 uses our same back-of-the-envelope calculation to estimate the impact of current law (including ARPA) on the US output gap. The output gap is the difference between actual GDP growth and potential GDP growth – during busts the country’s growth falls well beneath potential while during booms it rises above potential. The chart shows that if all of the government relief funds are spent then the output gap will be more than closed by the end of the year. By contrast, the CBO’s January projection shows the output gap persisting through 2025. While our estimates in Chart 5 may be too generous regarding federal cash handouts translating directly to consumer spending and higher demand, nevertheless the consensus estimate is entirely understated and out of date as a result of ARPA and the Biden administration’s additional fiscal spending that is coming. Chart 5Revised US Output Gap Estimates With ARPA
Biden’s Pittsburgh Speech And Legislative Agenda
Biden’s Pittsburgh Speech And Legislative Agenda
Chart 6Revised US Budget Deficit Projection Post-ARPA
Biden’s Pittsburgh Speech And Legislative Agenda
Biden’s Pittsburgh Speech And Legislative Agenda
Chart 6 updates our US budget deficit outlook using the CBO’s February budget baseline. The ARPA’s increase in government spending is added to create the new Democratic Party status quo scenario over the next ten years, with the budget normalizing by 2025. The Democratic low spending scenario assumes that Biden passes the $2.4tn infrastructure-plus plan announced in Pittsburgh (Table 1) using all the revenue from all the corporate tax hikes. Biden’s agenda will be broken into separate bills with varying probabilities of success. So in our budget deficit outlook we only include the infrastructure-and-corporate-tax-hikes component that is apparently being prioritized. Table 1Biden's 'American Jobs Plan'
Biden’s Pittsburgh Speech And Legislative Agenda
Biden’s Pittsburgh Speech And Legislative Agenda
Bottom Line: US growth will surprise to the upside of consensus estimates while the US output gap will be closed much sooner than expected. Financial markets are largely prepared for this outcome, although it reinforces that investors should maintain a cyclically bullish view and tactically should buy on the dips. Biden’s Pittsburgh Speech And ‘American Jobs Plan’ Budget Impacts Our view is that the Biden administration has a subjective 80% chance of passing a second major budget reconciliation bill (FY2022) and a 50% chance of passing a third budget reconciliation bill (FY2023). The question appears to be resolved that Democrats will prioritize infrastructure over social welfare. Whichever one they prioritize can be linked to tax hikes and yet will still be highly likely to pass given that no Republican votes are needed under budget reconciliation rules. Moderate Democrats may water down the tax provisions but they would be suicidal to oppose their entire party on the administration’s signature piece of legislation. The social spending bill, assuming it follows infrastructure, would have to be pursued via a third reconciliation bill for FY2023 but it is less likely to pass. By next year Biden will have spent a lot of his political capital, fiscal spending fatigue will be a real phenomenon, and the 2022 midterm elections will loom. What matters for investors is the impact on the budget deficit since that will determine how big of an impact will hit GDP and how long US fiscal policy remains accommodative. Table 2 shows the impact on the budget balance if Biden gets all of his spending and all revenue proposals (Baseline), if he gets all the spending but only half the tax hikes (Scenario 1), and if he gets half the spending and half the tax hikes (Scenario 2). Scenarios 3 and 4 treat the social spending plan with varying degrees of tax revenue from the proposed individual tax hikes, while Scenarios 5 and 6 treat the infrastructure plan with varying tax revenue from corporate tax hikes. Table 2Biden’s Forthcoming ‘American Jobs Plan’ Legislative Proposals
Biden’s Pittsburgh Speech And Legislative Agenda
Biden’s Pittsburgh Speech And Legislative Agenda
Table 3 shows the Biden campaign’s proposed tax hikes by line item along with the spending proposals. The range of net deficit spending runs from about $400 billion to about $3 trillion over ten years, which is a broad range and not very telling but which seems, subjectively, likely to settle in the $2 trillion range. Chart 7 shows the budget deficit’s deviation from the status quo trajectory in each of these scenarios, i.e. additional fiscal thrust. Table 3Biden’s Tax-And-Spend Proposals In Detail
Biden’s Pittsburgh Speech And Legislative Agenda
Biden’s Pittsburgh Speech And Legislative Agenda
Chart 7US Budget Deficit Projections With ‘American Jobs Plan’ Agenda
Biden’s Pittsburgh Speech And Legislative Agenda
Biden’s Pittsburgh Speech And Legislative Agenda
The infrastructure package consists of a range of proposals having to do with traditional roads and bridges, renewable energy, rural broadband Internet, domestic manufacturing incentives, supply chain security initiatives, affordable housing, and research and development (see Table 1 above). The social safety net expansion consists of making permanent the child tax credit that was extended in the ARPA; lowering the Medicare eligibility requirement to age 60 from 65; lengthening paid family/medical leave for workers; funding universal pre-school; and funding tuition-free community college. Some Democrats will oppose delaying social spending and tax hikes because they may not pass before the midterms and Republicans could easily take back control of the House of Representatives in 2022. Hence there is still a chance that Biden will pursue infrastructure on a bipartisan and piecemeal basis while using the FY2022 budget reconciliation for his social spending and tax hikes. The reasoning goes as follows: Historically the House has a high probability of shifting against a new president’s party in his first midterm election. The only exception to this rule were George W. Bush and Franklin D. Roosevelt. Republicans will definitely oppose social welfare and tax hikes, whereas they could be convinced to support an infrastructure plan. Republicans will not vote for infrastructure if it includes tax hikes and many Democrats believe that long-term infrastructure spending will enhance productivity and hence need not require revenue offsets. Hence there is still a chance of a bipartisan infrastructure bill. This would jeopardize its overall passage but it would ensure that Democrats could pass their social agenda via FY2022 reconciliation. What are the odds of bipartisanship? Throughout this year we have reserved some space for bipartisan lawmaking to take place under the radar. A recent example is the Paycheck Protection Program (PPP) Extension Act of 2021, which Biden signed into law on March 30. This is a bipartisan extension of the small business emergency loan program that began under President Trump. Senate Majority Leader Mitch McConnell quashed objections from within his party to extending the program, which has substantial support from the National Federation of Independent Business.1 The result was a 92-7 vote majority in the Senate, showing that Republican cooperation is possible. The fact that Republicans also cleared the way for the use of earmarks, or pork barrel spending directed at a critical lawmaker’s constituency in exchange for his or her vote, also suggests that bipartisanship is possible, particularly on infrastructure. Republicans can also be brought to support efforts to secure supply chains and energize the US technological race with China, such as the $50 billion funding for semiconductor manufacturing, which could be part of a major infrastructure package or regular budget appropriations. The catch is that Republicans will not support tax hikes, unionization, IRS strengthening, workplace enforcement, or climate change policies pursued under the guise of infrastructure. As a result the Democrats are highly incentivized to bypass Republicans from the beginning and pursue their agenda through two separate reconciliation bills. Finally, Democrats still have the option of removing the Senate filibuster, enabling regular bills to pass with merely 51 votes. Investors should plan on this occurring despite the news media narrative suggesting that moderate Democrats do not want it to happen – the point is that it is not an invincible check on the ruling party’s power. Biden signaled in his first press conference on March 25 that he is willing to see the filibuster removed. Bottom Line: Democrats can pass most of their infrastructure and social safety net proposals via budget reconciliation bills for FY2022 and FY2023, without a single Republican vote. If they do so they can only spare three votes in the House and zero votes in the Senate – meaning that the devil is in the details. Their odds of passing the first are high at a subjective 80% but then their odds of passing the second are 50/50 at best. Thus it is not wise to bet against Democratic tax hikes or new spending. The net impact on the deficit will be negative and hence stimulating for the economy. Growth and inflation will surprise to the upside. Biden’s Political Capital Still Moderate-To-Strong Our argument above is based in great part on Biden’s political capital, which is moderate but likely to strengthen as consumer sentiment rises. Table 4 updates our US Political Capital Index. Political polarization is subsiding from extreme peaks, and business sentiment and economic conditions are improving (with a surge in capex intentions albeit rising concerns over regulation). Table 4Biden’s Political Capital Sufficient For Another Major Bill
Biden’s Pittsburgh Speech And Legislative Agenda
Biden’s Pittsburgh Speech And Legislative Agenda
The weak spot is household sentiment as Biden’s approval rating is falling (normal for presidents as their honeymoon ends). However, consumer confidence is already picking up and will surely accelerate with vaccinations gaining ground, the dole being delivered, and the service sector reviving. Chart 8 shows that Biden’s approval rating is settling in the mid-50% range, which is substantially better than Trump’s at this time although worse than President Obama’s. Biden can be understood as a synthesis of these two predecessors given that he is coopting Trump’s agenda on fiscal spending, infrastructure, trade, and manufacturing while continuing Obama’s legacy on regulation, immigration, civil rights, and foreign policy. We expect Biden’s approval rating not to fall too far, unless he suffers a foreign policy disaster with China, Iran, or Russia, given that over 50% of voters will tend to support him as long as President Trump is the obvious alternative. Chart 9 suggests that Biden’s economic approval rating is weak but this score is going to rise once the new relief funds are distributed and the economic recovery gets going full steam. The early business cycle will probably be a constant source of support for the president over his four-year term. Chart 8Biden’s Approval Rating Fairly Stout
Biden’s Pittsburgh Speech And Legislative Agenda
Biden’s Pittsburgh Speech And Legislative Agenda
Chart 9Biden’s Approval On Economy Will Rise
Biden’s Pittsburgh Speech And Legislative Agenda
Biden’s Pittsburgh Speech And Legislative Agenda
Remarkably even the US Congress is gaining greater popular approval (Chart 10). This is very rare in modern times and could suggest that a major change is taking shape as Congress pursues populist fiscal policy under both Trump and Biden. Congress is handing out free money so people suddenly don’t hate it as much. There is a limit to how popular Congress will become and it will certainly not shake off its hard-earned reputation for gridlock and partisan rancor by suddenly exemplifying enlightenment and bipartisanship. But any rise in congressional approval is notable and would imply greater political capital for the current government and hence greater policy certainty for investors in the short run. Biden’s political capital is not yet suffering due to economic overheating as the latter has not yet happened – but it is a risk to monitor over the medium term. Inflationary pressures continue to build across the supply chain. Small businesses are increasingly flagging cost of labor as a rising concern while consumer price inflation is likely to pick up. Chart 10Congress Is Becoming More Popular
Biden’s Pittsburgh Speech And Legislative Agenda
Biden’s Pittsburgh Speech And Legislative Agenda
Inflation expectations are critical and will take time to change. Americans think about inflation through prices at the pump. Chart 11 shows the US and global crude oil price and average gasoline prices at the gas station for US consumers. Gasoline prices have surged although they are not yet at the $4 per gallon level that causes popular concern to escalate sharply. Chart 11Inflation Is Coming But Geopolitics Brings Oil Price Volatility
Inflation Is Coming But Geopolitics Brings Oil Price Volatility
Inflation Is Coming But Geopolitics Brings Oil Price Volatility
Oil prices are expected to go higher in the coming two years, according to our Commodity & Energy Strategy, but over a five-year period global supply-demand trends and balances suggest that the price will fluctuate within the $60-$80 dollar range. Biden’s regulations and foreign policy will introduce some volatility by hampering domestic US production, triggering sparks in the Middle East over Iran, and yet ultimately increasing global supply via any diplomatic deal with Iran. The BCA Research House View holds that today’s inflation is a temporary phenomenon whereas a more substantial bout of inflation is waiting in the medium-to-long term. The reason our strategists are not overly concerned in the near term is that there is still substantial slack in the economy: the labor force participation rate has fallen from 63.3% to 61.4% since the pandemic, the U6 unemployment rate stands at 11.1% (up from 7% prior to the pandemic), and the all-important employment-to-population ratio for prime-age workers stands at 57.6%, down from 61.1% prior to the pandemic. However, this slack is on pace to be tightened quickly as long as the pandemic subsides and Biden’s American Jobs Plan passes. Bottom Line: Our US Political Capital Index suggests Biden’s political capital is moderate-to-strong, which supports our view that he can pass at least one more major piece of legislation and possibly two. Inflation expectations will rise further and the selloff in US treasuries will continue. Investment Takeaways The market rally since January has priced a lot of the good news from Biden’s proposals, which are broadly similar to his campaign proposals. There is not a clear legislative strategy and passing two major bills before the midterm elections is a stretch. The priority bill, however, looks to pass by the end of this year after a roller-coaster ride of congressional negotiations and horse-trading. Deep cyclical sectors will benefit the most. We remain long value over growth stocks, specifically industrials and materials. We are also maintaining our long BCA infrastructure basket at least until passage of the bill is secured. Our infrastructure basket consists of a range of materials and machinery producers, construction services, and environmental services, and does not focus on headline “infrastructure” companies in the utilities and telecoms sectors. We recommend going long large cap energy stocks relative to small caps, which will have a harder time adjusting to Biden’s regulatory, tax, and green agenda. A long-term infrastructure plan that includes green energy, manufacturing, digital infrastructure, and R&D could create a productivity boost. Hiking the corporate tax rate to 28% is negative for corporate earnings but it will take place over a longer time frame and is being introduced in the context of a cyclical upswing. Hence we remain bullish over the course of this year. Biden’s Pittsburgh speech ostensibly confirmed the news flow over the past month suggesting that the Democrats will not propose a government-provided health insurance option in their upcoming legislative proposals. Instead they are prioritizing lowering the Medicare eligibility requirement and enabling Medicare to negotiate pharmaceutical prices. Our short of the managed health care sub-sector suffered from this shift in policy focus although we will maintain the trade as we expect the public option to reemerge at a later date. Meanwhile our pair trade of long health equipment and facilities relative to pharmaceuticals and bio-tech continues to perform well (Chart 12). A clear beneficiary of the US’s newfound proactive fiscal policy is the consumer. Consumer spending has not fully recovered from the pandemic and recession. Household disposable income ticked down in February from January, after the distribution of the government’s $900 billion COVID-19 relief funds in the Consolidated Appropriations Act passed in December. However, disposable income is up 8% over the 12 months since COVID broke out, due to fiscal relief. The result of lower spending and higher income is an increase in the personal saving rate to 13.6% in February, well above normal, as our US Bond Strategy highlights in its latest report. Recent research from our US Investment Strategy highlights that consumer growth should track relatively well with increases in household net worth, implying that nominal personal consumption expenditures could grow at a rate of 8.8% by the end of the year and 6.9% by the end of next year. Chart 12Stay Long Industrials Over Health Care
Stay Long Industrials Over Health Care
Stay Long Industrials Over Health Care
Chart 13Go Long Consumer Discretionary Stocks
Go Long Consumer Discretionary Stocks
Go Long Consumer Discretionary Stocks
In this context we take a positive view of consumer stocks in general. Cyclically we would favor consumer discretionary stocks and recommend investors go long. While discretionary spending should outperform as the economic upswing gains pace, we are holding consumer staples as a hedge against bad news (Chart 13). Not only will Biden’s tax hikes, inflation, and the rise in bond yields cause ongoing risks to cyclical sectors, but Biden also faces a series of imminent foreign policy tests with China/Taiwan, Iran, Russia, and North Korea, as highlighted in our sister Geopolitical Strategy. Matt Gertken Vice President Geopolitical Strategy mattg@bcaresearch.com Appendix Table A1Political Risk Matrix
Biden’s Pittsburgh Speech And Legislative Agenda
Biden’s Pittsburgh Speech And Legislative Agenda
Table A2APolitical Capital: White House And Congress
Biden’s Pittsburgh Speech And Legislative Agenda
Biden’s Pittsburgh Speech And Legislative Agenda
Table A2BPolitical Capital: Household And Business Sentiment
Biden’s Pittsburgh Speech And Legislative Agenda
Biden’s Pittsburgh Speech And Legislative Agenda
Table A2CPolitical Capital: The Economy And Markets
Biden’s Pittsburgh Speech And Legislative Agenda
Biden’s Pittsburgh Speech And Legislative Agenda
Table A3Biden’s Cabinet Position Appointments
Biden’s Pittsburgh Speech And Legislative Agenda
Biden’s Pittsburgh Speech And Legislative Agenda
Footnotes 1 Bill Scher, “The Bipartisan Senate Bill You Haven’t Heard About,” Real Clear Politics, realclearpolitics.com.
Feature The global macro landscape over the next six months or so will be characterized by a booming US economy and decelerating growth in China. Financial markets will move accordingly. US Treasury yields will remain under upward pressure, the US dollar will rebound, commodities prices will experience a setback and EM equities will continue underperforming DM stocks. The upcoming US economic boom is a well-known narrative and does not require much elaboration. China’s slowdown, on the other hand, is a matter of debate among investors and commentators. We have been arguing that macro policy tightening and a resumption of regulatory clampdowns on the financial system and property market are bound to result in a growth deceleration in China. There are already leading indicators that point to an impending growth slowdown: Chart 1China Is Set To Decelerate
China Is Set To Decelerate
China Is Set To Decelerate
The latest datapoint for domestic orders from the PBOC’s survey of 5000 industrial enterprises has relapsed in Q1. It leads A-share companies EPS growth by six months (Chart 1, top panel). The message is that industrial companies’ profit growth will once again slow in H2 2021. The recent setback in Chinese A-shares is evidence that markets are already beginning to price in a profit deceleration in H2. The bottom panel of Chart 1 indicates that banks’ claims on enterprises and households have rolled over and will continue downshifting. This is consistent with easing bank loan approvals and reflects policymakers’ guidance for banks. In Charts 3, 4, 6, 7, 8, 9, 10, 11 and 13 below, we illustrate more indicators and evidence of a forthcoming peak in the Chinese business cycle in general and commodities prices in particular. Weakening growth in China will hurt EM stocks and currencies more than those in DM, as many emerging economies are exposed to industrial commodities that are much more sensitive to demand in China versus trends in the US. Also, many Asian economies export more to China than they do to the US and Europe. Besides, the growth outlook in EM (ex-China, Korea and Taiwan) remains sub-par, especially relative to the US and DM more broadly. The reasons for this are slower vaccination rates and by extension economic reopening, a lack of fiscal stimulus and unhealthy banking systems. Notably, Chart 39 below demonstrates that EM bank stocks are breaking down relative to DM bank stocks. This potential breakdown reflects the state of EM fundamentals relative to those of DM. This week we recommend a new trade: short EM banks / long DM banks. In the US, the feature story will be the brisk pace of its reopening, an economic boom and intensifying inflationary pressures. So long as US bond yields continue rising, the US dollar will be supported. The next downleg in the greenback will occur when inflation rises but the Fed explicitly refuses to tackle it. Odds are that we are several months away from that. Hence, rising US bond yields will prop up the US dollar for now. The rebound in the US dollar and rising US bond yields will weigh on EM fixed income. The bottom panel of Chart 30 below illustrates that EM credit spreads negatively correlate with commodity prices. All in all, EM credit spreads will likely widen. Together with ascending US Treasury yields, this means higher EM sovereign and corporate dollar bond yields. The latter have always been associated with lower EM share prices (Chart 2, top panel). Chart 2Rising Corporate Bond Yields Are A Threat To Stocks
Rising Corporate Bond Yields Are A Threat To Stocks
Rising Corporate Bond Yields Are A Threat To Stocks
Strategy: As a tactical strategy (three to six months), last week we recommended downgrading the allocation to EM within global equity and credit portfolios from neutral to underweight. We also recommended shorting a basket of the following EM currencies versus the US dollar for the next several months: HUF, PLN, PHP, TRY, CLP, ZAR, KRW, BRL and THB. Strategic portfolios should maintain neutral allocations to EM equities, credit, local bonds and currencies. Arthur Budaghyan Chief Emerging Markets Strategist arthurb@bcaresearch.com Chinese Share Prices Point To A Top In Commodities Prices The recent underperformance of Chinese onshore cyclical stocks relative to defensive stocks heralds a slowdown in growth and has historically been a good indicator for raw materials prices. Consistently, the latest pullback in share prices of materials companies included in the MSCI China Investable Index also signals a drop in industrial metals prices. Chart 3Chinese Share Prices Point To A Top In Commodities Prices
Chinese Share Prices Point To A Top In Commodities Prices
Chinese Share Prices Point To A Top In Commodities Prices
Chart 4Chinese Share Prices Point To A Top In Commodities Prices
Chinese Share Prices Point To A Top In Commodities Prices
Chinese Share Prices Point To A Top In Commodities Prices
Commodities: New Secular Bull Market Or A Trading Range? Various Chinese liquidity and money measures have historically led the CRB Raw Materials Price Index and presently signal a relapse in commodities. The 200-year chart showing raw materials (excluding oil and gold) prices in real (inflation-adjusted) terms suggests that commodities prices have not undershot their long-term time-trend (Chart 5). We do not argue for a continuation of a structural bear market in commodities, but a medium-term setback is likely in the next three to six months. Chart 5Commodities: New Secular Bull Market Or A Trading Range?
Commodities: New Secular Bull Market Or A Trading Range?
Commodities: New Secular Bull Market Or A Trading Range?
Chart 6Commodities: New Secular Bull Market Or A Trading Range?
Commodities: New Secular Bull Market Or A Trading Range?
Commodities: New Secular Bull Market Or A Trading Range?
Chart 7Commodities: New Secular Bull Market Or A Trading Range?
Commodities: New Secular Bull Market Or A Trading Range?
Commodities: New Secular Bull Market Or A Trading Range?
EM Share Prices Are Beginning To Price A Profit Slowdown In H2 2021 The rally in EM share prices last year has priced the ongoing profit recovery. However, the apex in Chinese money/credit measures entails an EM profit slowdown in H2 this year (Chart 8). Besides, the considerable pullback in Chinese cyclicals-to-defensive stock prices implies further drawdown in EM share prices. Chart 8EM Share Prices Are Beginning To Price A Profit Slowdown In H2 2021
EM Share Prices Are Beginning To Price A Profit Slowdown In H2 2021
EM Share Prices Are Beginning To Price A Profit Slowdown In H2 2021
Chart 9EM Share Prices Are Beginning To Price A Profit Slowdown In H2 2021
EM Share Prices Are Beginning To Price A Profit Slowdown In H2 2021
EM Share Prices Are Beginning To Price A Profit Slowdown In H2 2021
The Chinese Economy: Shifting Into Low Gear In China, liquidity and money measures portend a peak business cycle. Excluding TMT companies, Chinese investable stocks have failed to break above their trading range of the past ten years. Notably, the slowdown is not limited to the old economy. The Caixin New Economy Index has dropped to its early 2019 level. Chart 10The Chinese Economy: Shifting Into Low Gear
The Chinese Economy: Shifting Into Low Gear
The Chinese Economy: Shifting Into Low Gear
Chart 11The Chinese Economy: Shifting Into Low Gear
The Chinese Economy: Shifting Into Low Gear
The Chinese Economy: Shifting Into Low Gear
Chart 12The Chinese Economy: Shifting Into Low Gear
The Chinese Economy: Shifting Into Low Gear
The Chinese Economy: Shifting Into Low Gear
Chart 13The Chinese Economy: Shifting Into Low Gear
The Chinese Economy: Shifting Into Low Gear
The Chinese Economy: Shifting Into Low Gear
Peak Growth And Equity Sentiment We have been showing Chart 14 for the past several months. The record high sentiment on EM equities in January preceded with an apex in EM share prices in February. This measure of sentiment is not yet low enough to expect a bottom in EM stocks. Chart 15 shows a similar indicator for euro area equities. Will it play out in the euro area as it did with EM? Chart 14Peak Growth And Equity Sentiment
Peak Growth And Equity Sentiment
Peak Growth And Equity Sentiment
Chart 15Peak Growth And Equity Sentiment
Peak Growth And Equity Sentiment
Peak Growth And Equity Sentiment
Booming IPOs And Secondary Issues = Peak Investor Sentiment The numbers of IPOs and secondary issuances have risen to a record high in China and EM. Often, this development is consistent with peak investor sentiment that coincides with some sort of top in share prices. Chart 16Booming IPOs And Secondary Issues = Peak Investor Sentiment
Booming IPOs And Secondary Issues = Peak Investor Sentiment
Booming IPOs And Secondary Issues = Peak Investor Sentiment
Chart 17Booming IPOs And Secondary Issues = Peak Investor Sentiment
Booming IPOs And Secondary Issues = Peak Investor Sentiment
Booming IPOs And Secondary Issues = Peak Investor Sentiment
Chart 18Booming IPOs And Secondary Issues = Peak Investor Sentiment
Booming IPOs And Secondary Issues = Peak Investor Sentiment
Booming IPOs And Secondary Issues = Peak Investor Sentiment
Equity Risk Premium: EM Equities Are Not Cheaper Than European And Japanese Equities Equity earnings yield minus interest rates (a proxy for equity risk premium) in EM is similar to that of the US. Hence, adjusted for local interest rates, EM stocks are not cheap. In fact, European and Japanese stocks are cheaper than EM stocks. Chart 19Equity Risk Premium: EM Equities Are Not Cheaper Than European And Japanese Equities
Equity Risk Premium: EM Equities Are Not Cheaper Than European And Japanese Equities
Equity Risk Premium: EM Equities Are Not Cheaper Than European And Japanese Equities
Chart 20Equity Risk Premium: EM Equities Are Not Cheaper Than European And Japanese Equities
Equity Risk Premium: EM Equities Are Not Cheaper Than European And Japanese Equities
Equity Risk Premium: EM Equities Are Not Cheaper Than European And Japanese Equities
A US Dollar Rebound = EM Setback Both EM equity recent selloffs and relative underperformance versus DM occur alongside US dollar strength. Besides, EM equity relative performance often moves counter to US stocks relative performance against the global benchmark (Chart 23). Finally, emerging Asian stocks’ relative performance versus the global index has hit a major technical resistance. The path of least resistance is, for now, on the downside. Chart 21A US Dollar Rebound = EM Setback
A US Dollar Rebound = EM Setback
A US Dollar Rebound = EM Setback
Chart 22A US Dollar Rebound = EM Setback
A US Dollar Rebound = EM Setback
A US Dollar Rebound = EM Setback
Chart 23A US Dollar Rebound = EM Setback
A US Dollar Rebound = EM Setback
A US Dollar Rebound = EM Setback
Chart 24A US Dollar Rebound = EM Setback
A US Dollar Rebound = EM Setback
A US Dollar Rebound = EM Setback
EM Stocks Have Formed A Medium-Term Top The EM overall equity benchmark (shown in Chart 20) as well as EM ex-TMT stocks, EM (ex-China, Korea and Taiwan) share prices, EM small caps and the EM equal-weighted index have so far failed to break out. The forthcoming slowdown in China, rising US Treasury yields, the US dollar rebound and poor fundamentals in EM (ex-China, Korea and Taiwan) are consistent with these technical patterns and warrant caution for now. Chart 25EM Stocks Have Formed A Medium-Term Top
EM Stocks Have Formed A Medium-Term Top
EM Stocks Have Formed A Medium-Term Top
Chart 26EM Stocks Have Formed A Medium-Term Top
EM Stocks Have Formed A Medium-Term Top
EM Stocks Have Formed A Medium-Term Top
Chart 27EM Stocks Have Formed A Medium-Term Top
EM Stocks Have Formed A Medium-Term Top
EM Stocks Have Formed A Medium-Term Top
Chart 28EM Stocks Have Formed A Medium-Term Top
EM Stocks Have Formed A Medium-Term Top
EM Stocks Have Formed A Medium-Term Top
Rising US Treasury Yields Are A Bad Omen For EM Fixed-Income Investor sentiment on US Treasurys is neutral, as is JP Morgan’s duration survey. Major market moves do not halt when sentiment is neutral but rather persist until sentiment becomes extreme. This and the economic boom and rising inflationary pressures in the US are the basis for higher US bond yields. The latter will push up both EM local currency and US dollar bond yields. In turn, a relapse in commodities prices will lead to a widening EM credit spread. Chart 29Rising US Treasury Yields Are A Bad Omen For EM Fixed-Income
Rising US Treasury Yields Are A Bad Omen For EM Fixed-Income
Rising US Treasury Yields Are A Bad Omen For EM Fixed-Income
The US Dollar Rebound Is In The Making The US dollar will continue its rebound as the US economic growth outpaces others and US yields rise relative to their peers. In turn, a rollover in commodities prices is a harbinger of EM currency weakness. Chart 30The US Dollar Rebound Is In The Making
The US Dollar Rebound Is In The Making
The US Dollar Rebound Is In The Making
Chart 31The US Dollar Rebound Is In The Making
The US Dollar Rebound Is In The Making
The US Dollar Rebound Is In The Making
Chart 32The US Dollar Rebound Is In The Making
The US Dollar Rebound Is In The Making
The US Dollar Rebound Is In The Making
Chart 33The US Dollar Rebound Is In The Making
The US Dollar Rebound Is In The Making
The US Dollar Rebound Is In The Making
A Strong Dollar Will Redistribute Inflation From The US To The Rest Of the World US import prices are rising in US dollar terms but not enough to offset exporters’ currency appreciation of the past 12 months. In fact, export prices in local currency terms have been tame in China and Korea. The greenback might appreciate in the near term to redistribute inflationary pressures from the US to the rest of the world, where the risk remains deflation/disinflation. Chart 34A Strong Dollar Will Redistribute Inflation From The US To The Rest Of the World
A Strong Dollar Will Redistribute Inflation From The US To The Rest Of the World
A Strong Dollar Will Redistribute Inflation From The US To The Rest Of the World
Chart 35A Strong Dollar Will Redistribute Inflation From The US To The Rest Of the World
A Strong Dollar Will Redistribute Inflation From The US To The Rest Of the World
A Strong Dollar Will Redistribute Inflation From The US To The Rest Of the World
EMs’ Poor Fundamentals In recent weeks, Brazil and Russia have hiked their policy rates. However, core consumer price inflation in both countries remains well behaved. Both economies are sluggish. In short, economic growth and inflation did not herald higher policy rates. Higher borrowing costs will jeopardize growth in these and other EM economies. Critically, the breakdown in EM relative to DM bank share prices (Chart 39) is a sign of poor health of EM banks and their inability to finance the economic recovery. Chart 36EMs' Poor Fundamentals
EMs' Poor Fundamentals
EMs' Poor Fundamentals
Chart 37EMs' Poor Fundamentals
EMs' Poor Fundamentals
EMs' Poor Fundamentals
Chart 38EMs' Poor Fundamentals
EMs' Poor Fundamentals
EMs' Poor Fundamentals
Investment Ideas A few of our investment recommendations outside our main strategy are: (1) long Chinese A-shares / short investable stocks; (2) long global value / short Chinese investable value stocks; (3) long global industrials / short global materials; (4) short a basket of EM currencies versus the US dollar or go long EM currency volatility. This week we are adding a new recommendation: short EM banks / long DM banks (Chart 39). Chart 39Investment Ideas
Investment Ideas
Investment Ideas
Chart 40Investment Ideas
Investment Ideas
Investment Ideas
Chart 41Investment Ideas
Investment Ideas
Investment Ideas
Footnotes Equities Recommendations
Growth Divergence: Booming US, Slowing China
Growth Divergence: Booming US, Slowing China
Currencies, Credit And Fixed-Income Recommendations
What To Make Of Near Insatiable Risk Appetite?
What To Make Of Near Insatiable Risk Appetite?
We recently came across an old BCA indicator – the Risk Appetite Index (RAI) – and after dusting it off we tweaked it a bit and are updating it today for the first time since US Equity Strategy last showed it in 2007! The RAI comprises eight equally weighted risk on and off indicators shown as a z-score and constructed so that a rising value indicates increasing risk appetite and vice versa. For example, a rising VIX indicates risk off and thus is inverted as part of the RAI. Currently the RAI has literally gone off the charts and signals that investors are craving risk. True, previous nose bleed readings have been associated with significant market tops including late-1990s, mid-2008 and late-2019 RAI readings over one (see chart). However, the last time the RAI was over four standard deviations above the historical mean was during the GFC rebound from late-2009/early-2010 when the SPX also had a monster run-up as we recently showed in our research. Excessive leverage and the January Melvin Capital and more recent Archegos Capital Management blowup anecdotes are unnerving, and in the near-term some caution is warranted (as a reminder, we continue to hold the long VIX June futures as a hedge). However, more often than not such a high RAI reading has been resolved with an SPX correction and not a meltdown. As we have been highlighting recently, our biggest risk, aside from China’s slowdown, remains the Fed becoming at the margin less accommodative in the back half of the year when it will start talking about talking about tapering. Bottom Line: While the SPX is getting close to our 4,000 year-end target and some near-term caution is warranted, the equity bull market (and business cycle) is in its infancy and we reiterate our cyclical and structural sanguine views.
The BCA Research Global Asset Allocation (GAA) Forum will take place online on May 18th. We have put together a great lineup of speakers to discuss issues of importance to CIOs and asset allocators. These include the latest thinking on portfolio construction, factor investing, alternatives, and ESG. Our keynote speaker will be Keith Ambachtsheer, founder of KPA Advisory and author of many books on investment management including "The Future of Pension Management: Integrating Design, Governance and Investing" (2016). His presentation will be followed by a panel discussion of top CIOs including Maxime Aucoin of CDPQ, James Davis of OPTrust, and Catherine Ulozas of the Drexel University Endowment. The event is complimentary for all GAA subscribers, who can see a full agenda and register here. Others can sign up here. We hope you can join us on May 18th for what should be a stimulating and informative day of ideas and discussion. Highlights Recommended Allocation
Quarterly Portfolio Outlook: What Higher Rates Mean For Asset Allocation
Quarterly Portfolio Outlook: What Higher Rates Mean For Asset Allocation
Global growth will rebound later this year, fueled by an end of lockdowns and generous fiscal stimulus. Despite that, central banks will not move towards tightening until 2023 at the earliest. This remains a very positive environment for risk assets like equities, though the upside is inevitably limited given stretched valuations. We continue to recommend a risk-on position, with overweights in equities and higher-risk corporate bonds. It is unlikely that long-term rates will rise much further over the coming months. But there is a risk that they could, and so we become more wary on interest-sensitive assets. Accordingly, we cut our overweight on the IT sector to neutral, and go overweight Financials. We continue to prefer cyclical sectors, and stay overweight Industrials and Energy. Chinese growth is slowing and so we cut our recommendation on Chinese equities to underweight. Some Emerging Markets will suffer from tighter US financial conditions, so we would be selective in our positions in both EM equity and debt. We stay firmly underweight government bonds, and recommend an underweight on duration, and favor linkers. Within alternatives, we raise Private Equity to overweight. The return to normality will give PE funds a wider range of opportunities, and allow them to pick up distressed assets at attractive valuations. Overview What Higher Rates Mean For Asset Allocation The past few months have seen a sharp rise in long-term interest rates everywhere (Chart 1). These have reflected better growth prospects, but also a greater appreciation of the risk of inflation over the next few years (Chart 2). Our main message in this Quarterly Portfolio Outlook is that we do not expect long-term rates to rise much further over the coming months, but that there is a risk that they could. This would be unlikely to undermine the positive case for risk assets overall, but it would affect asset allocation towards interest-rate sensitive assets such as growth stocks and Emerging Markets, and could have an impact on the US dollar. Chart 1Rates Are Rising Everywhere
Rates Are Rising Everywhere
Rates Are Rising Everywhere
Chart 2...Because Of Both Growth And Inflation Expectations
Quarterly Portfolio Outlook: What Higher Rates Mean For Asset Allocation
Quarterly Portfolio Outlook: What Higher Rates Mean For Asset Allocation
We accordingly keep our recommendation for an overweight on equities and riskier corporate credit on the 12-month investment horizon, but are tweaking some of our other allocation recommendations. The macro environment for the rest of the year continues to look favorable. Pent-up consumer demand will be released once lockdowns end. In the US, this should be mid-July by when, at the current rate, the US will have vaccinated enough people to achieve herd immunity (Chart 3). Excess household savings in the major developed economies have reached almost $3 trillion (Chart 4). At least a part of that will be spent when consumers can go out for entertainment and travel again. Chart 3US On Track To Hit Herd Immunity By July
US On Track To Hit Herd Immunity By July
US On Track To Hit Herd Immunity By July
Chart 4Global Excess Savings Total Trillion
Global Excess Savings Total $3 Trillion
Global Excess Savings Total $3 Trillion
Fiscal stimulus remains generous, especially in the US after the passing of the $1.9 trillion package in March (with another $2 trillion dedicated towards infrastructure spending likely to be approved within the next six months). The OECD estimates that the recent US stimulus alone will boost US GDP growth by almost 3 percentage points in the first full year and have a significant knock-on effect on other economies (Chart 5). Central banks, too, remain wary of the uneven and fragile nature of the recovery and so will not move towards tightening in the next 12 months. The Fed is not signalling a rate hike before 2024 – and it is likely to be the first major central bank to raise rates. In this environment, it is not surprising that long-term rates have risen. We showed in March’s Monthly Portfolio Update that, since 1990, equities have almost always performed strongly when rates are rising. This is likely to continue unless there is either (1) an inflation scare, or (2) the Fed turns more hawkish than the market believes is appropriate. Inflation could spike temporarily over the coming months, which might spook markets (see What Our Clients Are Asking on page 9 for more discussion of this). But sustained inflation is improbable until the labor market recovers to a level where significant wage increases come through (Chart 6). This is unlikely before 2023 at the earliest. Chart 5US Fiscal Stimulus Will Help Everyone
Quarterly Portfolio Outlook: What Higher Rates Mean For Asset Allocation
Quarterly Portfolio Outlook: What Higher Rates Mean For Asset Allocation
Chart 6Labor Market Still Well Away From Full Employment
Labor Market Still Well Away From Full Employment
Labor Market Still Well Away From Full Employment
BCA Research’s fixed-income strategists do not see the US 10-year Treasury yield rising much above 1.8% this year.1 Inflation expectations should settle down around the current level (shown in Chart 2, panel 2) which is consistent with the Fed achieving its 2% PCE inflation target on average over the cycle. Treasury yields are largely driven by whether the Fed turns out to be more or less hawkish than the market expects (Chart 7). The market is already pricing in the first Fed rate hike in Q3 2022 (Chart 8). We think it unlikely that the market will start to price in an earlier hike than that. Chart 7The Fed Unlikely To Hike Ahead Of What Market Expects...
The Fed Unlikely To Hike Ahead Of What Market Expects...
The Fed Unlikely To Hike Ahead Of What Market Expects...
Chart 8...Since This Is As Early As Q3 2022
...Since This Is As Early As Q3 2021
...Since This Is As Early As Q3 2021
How much would a further rise in rates hurt the economy and stock market? Rates are still well below a level that would trigger problems. First, long-term rates are considerably below trend nominal GDP growth, which is around 3.5% (Chart 9). Second, short-term real rates are well below r* – hard though that is to measure at the moment given the volatility of the economy in the past 12 months (Chart 10). Finally, one of the best indicators of economic pressure is a decline in cyclical sectors (consumer spending on durables, corporate capex, and residential investment) as a percentage of GDP (Chart 11). This is because these are the most interest-rate sensitive parts of the economy. But, at the moment, consumers are so cashed up they do not need to borrow to spend. The same is true of corporates, which raised huge amounts of cash last year. The only potential problem is real estate, buoyed last year by low rates which are now reversing (Chart 12). But mortgage rates are still very low and this is not a big enough sector to derail the broader economy. Chart 9Long-Term Rates Well Below Damaging Levels...
Long-Term Rates Well Below Damaging Levels...
Long-Term Rates Well Below Damaging Levels...
Chart 10...Such As The R-Star
Fed Still Below Neutral ...Such As The R-Star
Fed Still Below Neutral ...Such As The R-Star
Chart 11Interest-Rate Sensitive Sectors Are Robust...
Interest-Rate Sensitive Sectors Are Robust...
Interest-Rate Sensitive Sectors Are Robust...
Chart 12...With The Possible Exception Of Housing
...With The Possible Exception Of Housing
...With The Possible Exception Of Housing
Chart 13Debt Levels Are High In Emerging Markets...
Debt Levels Are High In Emerging Markets...
Debt Levels Are High In Emerging Markets...
Chart 14...Which Makes Them Vulnerable To Tightening Financial Conditions
...Which Makes Them Vulnerable To Tightening Financial Conditions
...Which Makes Them Vulnerable To Tightening Financial Conditions
This sanguine view may not apply to Emerging Markets, however. Given the amount of foreign-currency debt they have built up in the past decade (Chart 13), they are very sensitive to US financial conditions, particularly a rise in rates and an appreciation of the US dollar (Chart 14). Accordingly, we have become more cautious on the outlook for both EM equity and debt over the next 6-12 months. Garry Evans, Senior Vice President Chief Global Asset Allocation Strategist garry@bcaresearch.com What Our Clients Are Asking What will happen to inflation? How can we tell if it is trending up? Chart 15Watch The Trimmed Mean Inflation Measure
Watch The Trimmed Mean Inflation Measure
Watch The Trimmed Mean Inflation Measure
How much inflation rises will be a key driver of asset performance over the next 12-18 months. Too much inflation will push up long-term rates and undermine the case for risk assets. But the picture is likely to be complicated. US inflation will rise sharply in year-on-year terms in March and April because of the base effect (comparison with the worst period of the pandemic in 2020), pricier gasoline, rising import prices due to the weaker dollar, and supply-chain bottlenecks that are pushing up manufacturing costs. Core PCE inflation could get close to 2.5% year-on-year (Chart 15, panel 1). In the second half, too, an end to lockdowns could push up service-sector inflation – which has unsurprisingly been weak in the past nine months – as consumers rush out to restaurants and on vacation (panel 3). The Fed has signalled that it will view these as temporary effects. But they may spook the market for a while. Next year, however, it would be surprising to see strong underlying inflation unless employment makes a miraculous recovery. Payrolls would have to increase by 420,000 a month to get back to “maximum employment” by end-2022.2 Absent that, wage growth is likely to stay muted. Conventional inflation gauges may not be very useful at indicating underlying inflation pressures, in a world where consumers switch their spending depending on what is currently allowed under pandemic regulations. The Dallas Fed’s Trimmed Mean Inflation indicator (which excludes the 31% of the 178 items in the consumer basket with the highest price rises each month, and the 24% with the lowest) may be the best true measure. Research shows that historically it has been closer to trend headline PCE inflation in the long run than the core inflation measure, and predicts future inflation better (panel 4). Currently it is at 1.6% year-on-year and trending down. Investors should focus on this measure to see whether rising inflation is becoming a risk. How can investors best protect against rising inflation? In May 2019 we released a report describing how to best to hedge against inflation.3 In that report, we analyzed every period of rising inflation dating back to the 1970s. Our conclusions were the following: The level of inflation will determine how rising inflation affects assets. When inflation goes from 1% to 2%, the macro environment is entirely different from when it goes from 5% to 6%. Thus, inflation hedging should not be thought of as a static exercise but a dynamic one (Table 1). Table 1Winners During Different Inflationary Regimes
Quarterly Portfolio Outlook: What Higher Rates Mean For Asset Allocation
Quarterly Portfolio Outlook: What Higher Rates Mean For Asset Allocation
As long as the annual inflation rate is below about 3%, equities tend to be the best performing asset during high inflation periods, surpassing even commodities. This is because monetary policy tends to stay accommodative and cost pressures remain benign for most companies. However, as inflation passes this threshold, things start to change. Central banks start to become restrictive as they seek to curb inflation. This rise in policy rates starts to choke off the bull market. Meanwhile cost pressures become more significant and, as a result, equities begin to suffer. It is at this time when commodities – particularly oil and industrial metals – and US TIPS become a much better asset to hold. Finally, if the central bank fails to quash inflation, inflation expectations become unanchored, creating a toxic cocktail of rising prices and poor growth. During such periods, the best strategy is to hold the most defensive securities in each asset class, such as Health Care or Utilities within the equity market, or gold within commodities. Can the shift to renewables drive a new commodities supercycle? Chart 16The Shift To Renewables Is Likely To Be A Tailwind For Metal Prices...
The Shift To Renewables Is Likely To Be A Tailwind For Metal Prices...
The Shift To Renewables Is Likely To Be A Tailwind For Metal Prices...
The rise in commodity prices in H2 2020 has made investors ask whether we are on the verge of a new commodities “supercycle” (Chart 16). Our Commodity & Energy strategists argue that the fundamental drivers of each commodities segment differ. Here we focus on industrial metals – particularly those pertaining to renewable energy and transport electrification. Prices of metals used in electric vehicles (EVs) have risen by an average 53% since July 2020, reflecting strong demand that is outstripping supply (Chart 16). In the short-term, metals markets are likely to be in deficit, especially as demand recovers after the pandemic. Modelling longer-term demand is tricky since it relies on assumptions for the emergence of new technologies, metals’ efficiency, recycling rates, and the share of renewables. A study by the Institute for Sustainable Futures showed that, in the most positive scenarios, demand for some metals will exceed available resources and reserves (Table 2).4 The most pessimistic scenarios – which, for example, assume no major electrification of the transport system – show demand at approximately half of available resources. It is likely that demand will lay somewhere between those scenarios. Table 2...As Future Demand Exceeds Supply
Quarterly Portfolio Outlook: What Higher Rates Mean For Asset Allocation
Quarterly Portfolio Outlook: What Higher Rates Mean For Asset Allocation
Supply is concentrated in a handful of countries: For example, the DR Congo is responsible for more than 65% of cobalt production and 50% of the world’s reserves;5 Australia supplies almost 50% of the world’s lithium and has 22% of its reserves.6 Production bottlenecks could therefore put significant upside pressures on prices. Factoring in supply/demand dynamics, as well as an assessment of future technological advancements, we conclude that industrial metals might be posed for a bull market over the upcoming years. How can we add alpha in the bond bear market? Chart 17Government Bond Yield Sensitivities To USTs
Government Bond Yield Sensitivities To USTs
Government Bond Yield Sensitivities To USTs
For a portfolio benchmarked to the global Treasury index, one way to add alpha is through country allocation. BCA’s Fixed Income Strategy recommends overweighting low yield-beta countries (Germany, France, and Japan) and underweighting high yield-beta countries (Canada, Australia, and the UK).7 The yield beta is defined as the sensitivity of a country’s yield change to changes in the US 10-year Treasury yield, as shown in Chart 17. BCA’s view is that the Fed will be the first major central bank to lift interest rate, therefore investors' underweights should be concentrated in the US Treasury index. It’s worth noting, however, that yield beta is influenced by many factors, and can change over time. When applying this approach, it’s important to pay attention to key factors in each country, especially those that are critical to central bank policy decisions (Table 3). Table 3A Watch List For Bond Investors
Quarterly Portfolio Outlook: What Higher Rates Mean For Asset Allocation
Quarterly Portfolio Outlook: What Higher Rates Mean For Asset Allocation
Global Economy Chart 18US Growth Already Looks Strong...
US Growth Already Looks Strong...
US Growth Already Looks Strong...
Overview: Growth continues to recover from the pandemic, although the pace varies. Manufacturing has rebounded strongly, as consumers spend their fiscal handouts on computer and household equipment, but services remain very weak, especially in Europe and Japan. Successful vaccination programs and the end of lockdowns in many countries should lead to strong growth in H2, as consumers spend their accumulated savings and companies increase capex to meet this demand. Perhaps the biggest risk to growth is premature tightening in China, but the authorities there are very aware of this risk and so it is unlikely to drag much on global growth. US: Although the big upside surprises to economic growth are over (Chart 18, panel 1), the US continues to expand more strongly than other major economies, due to its relatively limited lockdowns and large fiscal stimulus (which last year and this combined reached 25% of GDP, with another $2 trillion package in the works). Fed NowCasts suggest that Q1 GDP will come in at around 5-6% quarter-on-quarter annualized, with the OECD’s full-year GDP growth forecast as high as 6.5%. Nonetheless, there is still some way to go: Consumer expenditure and capex remain weak by historical standards, and new jobless claims in March still averaged 727,000 a week. Euro Area: More stringent pandemic regulations and slow vaccine rollout mean that the European service sector has been slow to recover. The services PMI in March was still only 48.4, though manufacturing has rebounded strongly to 64.2 (Chart 19, panel 1). Fiscal stimulus is also much smaller than in the US, with the EUR750 billion approved in December to be spent mostly on infrastructure over a period of years. Growth should rebound in H2 if lockdowns end and the vaccination program accelerates. But the OECD forecasts full-year GDP growth of only 3.9%. Chart 19...But Chinese Growth Has Probably Peaked
...But Chinese Growth Has Probably Peaked
...But Chinese Growth Has Probably Peaked
Japan has seen the weakest rebound among the major economies, slightly puzzlingly so given its heavy weight in manufacturing and large exposure to the Chinese economy. Industrial production still shrank 3% year-on-year in February (Chart 19, panel 2), exports were down 4.5% YoY in February, and the manufacturing PMI is barely above 50. The main culprit remains domestic consumption, with confidence very weak and wages still declining, leading to a 2.4% YoY decline in retail sales in January. The OECD full-year GDP growth forecast is just 2.4%. Emerging Markets: The Chinese authorities have been moderately tightening policy for six months and this is starting to impact growth. Both the manufacturing and services PMIs have peaked, though they remain above 50 (panel 3). The policy tightening is likely to be only moderate and so growth this year should not slow drastically. Nonetheless, there remains the risk of a policy mistake. Elsewhere, many EM central banks are struggling with the dilemma of whether to cut rates to boost growth, or raise rates to defend a weakening currency. Real policy rates range from over 2% in Indonesia to below -2% in Brazil and the Philippines. This will add to volatility in the EM universe. Interest Rates: Policy rates in developed economies will not rise any time soon. The Fed is signalling no rise until 2024 (although the futures are now pricing in the first hike in Q3 2022). Other major central banks are likely to wait even longer. A crucial question is whether long-term rates will rise further, after the jump in the US 10-year Treasury yield to a high of 1.73%, from 0.92% at the start of the year. We see only limited upside in yields over the next nine months, as underlying inflation pressures should remain weak and central banks will remain highly reluctant to bring forward the pace of monetary policy normalization. Global Equities Chart 20Has The Equity Market Priced In All The Earnings Growth?
Has The Equity Market Priced In All The Earnings Growth?
Has The Equity Market Priced In All The Earnings Growth?
The global equities index eked out a 4% gain in Q1 2021, completely driven by a rebound in the profit outlook, since the forward PE multiple slightly contracted by 4%. Forward EPS has now recovered to the pre-pandemic level, while both the index level and PE multiple are 52% and 43% higher than at the end of March 2020 (Chart 20). While BCA’s global earnings model points to nearly 20% earnings growth over the next 12 months and analysts are still revising up earnings forecasts, the key question in our mind is whether the equity market has priced in all the earnings growth. Equity valuations are still not cheap by historical standards despite the small contraction in PEs in Q1. In addition, the VIX index has come down to 19.6, right at its historical average since January 1990, and profit margins in both EM and DM have come under pressure. As an asset class, however, stocks are still attractively valued compared to bonds (panel 5). Given our long-held approach of taking risk where risk will most likely be rewarded, we remain overweight equities versus bonds at the asset-class level, but we are taking some risk off the table in our country and sector allocations by downgrading China to underweight (from overweight) and upgrading the UK to overweight (from neutral), and by taking profits in our Tech overweight and upgrading Financials to overweight (see next two pages). To sum up, we are overweight the US and UK, underweight Japan, the euro area, and China, while neutral on Canada, Australia, and non-China EM. Sector-wise, we are overweight Industrials, Financials, Energy, and Health Care; underweight Consumer Staples, Utilities, and Real Estate; and neutral on Tech, Consumer Discretionary, Communication Services, and Materials. Country Allocation: Downgrade China To Underweight From Overweight Chart 21China Is Risking Overtightening
China Is Risking Overtightening
China Is Risking Overtightening
We started to separate the overall EM into China and Other EM in the January Monthly Portfolio Update this year. We initiated China with an Overweight and “Other EM” with a Neutral weighting in the global equity portfolio. The key rationale was that Chinese growth would remain strong in H1 2021 due to its earlier stimulus, while some EM countries would benefit from Chinese growth but others were still suffering from structural issues. In Q1, China underperformed the global benchmark by 4.5%, while the other EM markets underperformed slightly. China’s National People’s Congress (NPC) indicated that Chinese policymakers will gradually pull back policy support this year. BCA’s China Investment Strategists think that fiscal thrust will be neutral in 2021 while credit expansion will be at a lower rate compared to 2020. The Chinese economy should remain strong in H1 but will slow to a benign and managed growth rate afterwards. Therefore, the risk of policy overtightening is not trivial and could threaten China’s economic growth and corporate profit outlook. The outperformance of Chinese stocks since the end of 2019 has been largely driven by multiple expansion (Chart 21, panel 1), but the slowdown in the credit impulse implies that the recent underperformance of Chinese equities has not run its course because multiple contraction will likely have to catch up and will therefore put more downward pressure on price (panels 2 and 3). We remain neutral on the non-China EM countries, implying an underweight for the overall EM universe. We use the proceeds to fund an upgrade of the UK to Overweight from Neutral because the UK index is comprised largely of globally exposed companies and because we have upgraded GBP to overweight (see page 21). Sector Allocation: Upgrade Financials To Overweight By Downgrading Tech To Neutral Chart 22Financials And Tech: Trading Places
Financials And Tech: Trading Places
Financials And Tech: Trading Places
One year ago, we upgraded Tech to overweight and downgraded Financials to neutral given our views on the impact of the pandemic and interest rates.8 This position has netted out an alpha of 1123 basis points in one year. BCA Research’s House View now calls for somewhat higher global interest rates and steeper yield curves (especially in the US) over the next 9-12 months. Accordingly, we are downgrading Tech to neutral and upgrading Financials to overweight. Financials have outperformed the broad market by about 20% since September 2020 after global yields bottomed in July 2020. We do not expect yields to rise significantly from the current level, nor do we expect Tech earnings growth to slow significantly (Chart 22, panel 5). So why do we make such shift between Financials and Tech? There are three key reasons: First, the Tech sector is a long-duration asset with high sensitivity to changes in the discount rate. In contrast, Financials’ earnings benefit from steepening yield curves. If history is any guide, we should see more aggressive analyst earnings revisions going forward in favor of Financials (Chart 22, panel 3). Second, the performance of Financials relative to Tech has been on a long-term structural downtrend since the Global Financial Crisis. A countertrend rebound to the neutral zone from the currently very oversold level would imply further upside (Chart 22, panel 1). Last, Financials are trading at an extremely large discount to the Tech sector (Chart 22, panel 2). In an environment where overall equity valuations are stretched by historical standards, it is prudent to rotate into an extremely cheap sector from an extremely expensive sector. Government Bonds Chart 23Policy Mix Is Bond-Bearish
Policy Mix Is Bond-Bearish
Policy Mix Is Bond-Bearish
Maintain Below-Benchmark Duration. Global bond yields have climbed sharply in Q1, supported by strong economic growth, mostly smooth rollout of vaccination and the Biden Administration’s very stimulative fiscal package of USD1.9 trillion. The US stimulus package changes the trajectory of the 2021 US fiscal impulse from a $0.8 trillion contraction to a $0.3 trillion expansion, according to estimates from the US Committee for a Responsible Federal Budget. Going forward, the path of least resistance for global yields is still up, though the upside will be limited given the resolve of central banks to maintain accommodative monetary policies (Chart 23). Chart 24Stay Long TIPS
Stay Long TIPS
Stay Long TIPS
Still Favor Linkers Vs. Nominal Bonds. Our overweight position in inflation-linked bonds relative to nominal bonds has panned out well so far this year, as has our positioning for a flattening inflation-protection curve. Even though inflation expectations have run up quickly, the 5 year-5 year forward inflation breakeven rate is still below 2.3-2.5%, the range that is consistent with core PCE reaching the Fed’s 2% target in a sustainable fashion (Chart 24). The US TIPS 5/10-year curve is inverted already, but our fixed income strategists are still reluctant to exit the curve-flattening position for two key reasons: 1) The Fed has indicated that it will tolerate core PCE overshooting the 2% target because it will try to hit the target from above rather than from below; and 2) the short end of the inflation expectation curve is more sensitive to actual inflation than the long end. There are signs (core producer prices, prices paid in the ISM manufacturing survey, and NFIB reported prices are all rising) that core PCE will reach 2% in the next 12 months. Corporate Bonds Chart 25High-Yield Offers Best Value In Fixed Income
Quarterly Portfolio Outlook: What Higher Rates Mean For Asset Allocation
Quarterly Portfolio Outlook: What Higher Rates Mean For Asset Allocation
Since the beginning of the year, investment-grade bonds have outperformed duration-matched Treasurys by 62 basis points, while high-yield bonds have outperformed duration-marched Treasurys by 232 basis points. In the current reflationary environment, we believe that the best strategy within fixed-income portfolios is to overweight low-duration assets and maximize credit exposure where the spread makes a large portion of the yield. Thus, we remain overweight high-yield bonds. We believe that high yield offers much better value than higher quality credits. Currently spreads for high-yield bonds are in the middle of their historical distribution – a stark contrast from their investment-grade counterparts, which are trading at very expensive levels (Chart 25, panel 1). Moreover, the reopening of the economy should help the more cyclical sectors of the bond market, where the lower credit qualities are concentrated. But could a rise in yields start hurting sub-investment-grade companies and increase their borrowing costs? We do not think this is likely for now. Most of the bonds in the US high-yield index mature in more than three years, which means that high-risk corporates will not have to finance themselves with higher rates yet (Chart 25, panel 2). On the other hand, we remain underweight investment-grade credit. Not only are these bonds expensive, but they offer very little upside in any scenario. On the one hand, these bonds should underperform further if raise continue to rise – a result of their high duration. On the other hand, if a severe recession were to hit, spreads would most likely widen, which will also result in underperformance. Commodities Chart 26Limited Upside For Oil From Here
Limited Upside For Oil From Here
Limited Upside For Oil From Here
Energy (Overweight): Despite the recent mid-March selloff, which was most likely triggered by profit taking, oil prices are still up 25% since the beginning of the year. This happened on the back of the restoration of some economic activity, the OPEC 2.0 coalition maintaining production discipline and therefore keeping supply in check, and the recovery in crude demand drawing down inventory. However, earlier forecasts of the 2021 oil demand recovery were a bit too optimistic amid continuing pandemic uncertainty. There is now, therefore, only limited upside for the oil price, at least this year. Our Commodity & Energy strategists expect the Brent crude price to average $65/bbl this year (Chart 26, panels 1 & 2). Industrial Metals (Neutral): We have previously highlighted that Chinese restocking activity in 2020 was a big factor behind the rally in industrial metals prices. As this eases, and Chinese growth slows, commodity prices might correct somewhat in the short term. However, fundamental changes in demand for alternative energy makes us ask whether we are now entering a new commodities “supercycle” for certain metals (for more analysis of this, see What Our Clients Are Asking on page 11). If history is any guide, however, the commodities bear market may have a little longer to run. Historically, commodity bear cycles lasted 17 years on average and we are only 10 years into this one (panel 3). On balance, therefore, we remain neutral on industrial metals for now. Precious Metals (Neutral): After peaking last August, the gold price has continued to tumble, down almost 19% since and 11% since the beginning of the year. We have been wary of the metal’s lofty valuation – the real price of gold remains near a historical high. The recent rise in real rates put more downside pressure on gold. However, the pullback in prices should provide investors who see gold as a long-term inflation hedge and do not buy the metal with a view to strong absolute performance over the next 12 months, with an attractive entry point. We maintain a slight overweight position to hedge against inflation and unexpected tail risks (panel 4). Currencies US Dollar Chart 27Vaccinations will help USD and GBP in 2021
Vaccinations will help USD and GBP in 2021
Vaccinations will help USD and GBP in 2021
While we still believe that the dollar is in a major bear market, the current environment could see a significant dollar countertrend. Thanks to its gargantuan fiscal stimulus as well as its relatively fast vaccination campaign, the US is likely to grow faster than the rest of the world during 2021 (Chart 27, panel 1). This dynamic should put further upward pressure on US real rates relative to the rest of the world, helping the dollar in the process. To hedge this risk, we are upgrading the US dollar from underweight to neutral in our currency portfolio. Euro The euro should experience a temporary pullback. Economic activity in Europe, particularly in the service sector is lagging the US – a consequence of Europe’s slow vaccination campaign. This sluggishness in economic activity will translate into a worse real rate differential vis-a-vis the US, dragging the euro lower in the process. Thus, we are downgrading the euro from overweight to neutral. British Pound One currency that might perform well in this environment is the British pound. Consumer spending in the UK was particularly hard hit during the pandemic, since such a high share of it is geared towards social activities like restaurants and hotels (Chart 27, panel 2). However, thanks to Britain’s successful vaccination campaign, UK consumption is likely to experience a sharp snapback. As growth expectations improve, real rates should grind higher vis-à-vis the rest of the world, pushing the pound higher. Moreover, valuations for this currency are attractive: The pound currently trades at a 10% discount to purchasing power parity fair value. As a result, we are upgrading the GBP from neutral to overweight. Alternatives Chart 28Turning More Positive On Private Equity
Turning More Positive On Private Equity
Turning More Positive On Private Equity
Return Enhancers: In last October’s Quarterly Outlook, we advised investors to prepare for new opportunities in Private Equity (PE) as fund managers look to deploy record high dry power. A gradual return to normality is likely to provide PE funds with a wider range of opportunities, while still allowing them to pick up distressed assets at attractive valuations. This is illustrated by the annualized quarterly returns of PE funds in Q2 and Q3 2020, which reached 43% and 56% respectively. PE funds raised in recession and early-cycle years tend to have a higher median net IRR than those raised in the latter stages of bull markets. This suggests that returns from the 2020 and 2021 vintages should be strong. In recent years, capital flows have increasingly gone to the longer established and larger funds, which tend to have better access to the most attractive deals and therefore record the strongest returns. This trend is likely to continue. Given the time it takes to shift allocations in private assets, we increase our recommended allocation in PE to overweight. Inflation Hedges: It is not clear that inflation will come roaring back in the next couple of years. But what is certain is that market participants are concerned about this risk, which should give a boost to inflation-hedge assets. Given this backdrop, we continue to favor commodity futures (Chart 28, panel 2). In other circumstances, real estate would also have been a beneficiary in this environment. But the slowdown in commercial real estate, as many corporate tenants review whether they need expensive city-center space, makes us remain cautious on real estate. Volatility Dampeners: We continue to favor farmland and timberland over structured products, particularly mortgage-backed securities (MBS). Farmland offers attractive yields and should continue to provide the best portfolio protection in the event of any market distress (Chart 28, panel 3). Risks To Our View The main risks to our central view are to the downside. Because global equities have risen by 55% over the past 12 months, and with the forward PE of the MSCI ACWI index at 19.5x (Chart 29), the room for price appreciation over the next 12 months is inevitably limited. There are several things that could undermine the economic recovery and equity bull market. The COVID-19 pandemic remains the greatest unknown. The vaccination rollout has been very uneven (Chart 30). New strains, especially the one first identified in Brazil, are highly contagious and people who previously had COVID-19 do not seem to have immunity against them. Behavior once COVID cases decline is also hard to predict. Will people be happy again to fly, attend events in large stadiums, and socialize in crowded bars, or will many remain wary for years? This would undermine the case for a strong rebound in consumption. Chart 29Is Perfection Priced In?
Is Perfection Priced In?
Is Perfection Priced In?
Chart 30Vaccination Has Been Spotty Vaccination Has Been Spotty
Vaccination Has Been Spotty Vaccination Has Been Spotty
Vaccination Has Been Spotty Vaccination Has Been Spotty
Chart 31China Slowing Again?
China Slowing Again?
China Slowing Again?
As often, a slowdown in China is a risk. The authorities there have signalled a pullback in stimulus, and the credit impulse has begun to slow (Chart 31). Our China strategists think the authorities will be careful not to tighten too drastically (with the fiscal thrust expected to be neutral this year), and that growth will slow only to a benign and moderate rate in the second half.9 But there is a lot of room for policy error. Finally, inflation. As we argue elsewhere in this Quarterly, it will inevitably pick up for technical reasons in March and April, and then again in late 2021 as renewed consumer demand for services (especially travel and entertainment) pushes up prices. The Fed has emphasized that these phenomena are temporary and that underlying inflation will not emerge until the economy returns to full employment. But the market might get spooked for a while when inflation jumps, pushing up long-term interest rates and triggering an equity market correction. Footnotes 1 Please see US Bond Strategy Report, “The Fed Looks Backward While Markets Look Forward,” dated March 23, 2021. 2 Please see US Bond Strategy Report, “The Fed Looks Backward While Markets Look Forward,” dated March 23, 2021, 3 Please see Global Asset Allocation Special Report, “Investors’ Guide To Inflation Hedging: How To Invest When Inflation Rises,” dated May 22, 2019. 4 Dominish, E., Florin, N. and Teske, S., 2019, Responsible Minerals Sourcing for Renewable Energy. Report prepared for Earthworks by the Institute for Sustainable Futures, University of Technology Sydney. The optimistic scenario is referred to as “total metals demand” scenario, which assumed current materials intensity and market share continues into the future without recycling or efficiency improvements. This study is based on 2018 production levels and therefore expansion of future production may vary results. 5US Geological Survey, Mineral Commodity Summaries 2021. 6 Chile is estimated to have the largest reserve of lithium. 7 Please see Global Fixed Income Strategy Report, “Harder, Better, Faster, Stronger,” dated March 16, 2021. 8 Please see Global Asset Allocation, “Quarterly Portfolio Outlook: Playing The Optionality,” dated April 1, 2020. 9 Please see China Investment Strategy Report, “National People’s Congress Sets Tone For 2021 Growth,” dated March 17, 2021. GAA Asset Allocation
Highlights Underweighting T-bonds, tech versus the market, growth versus value, new economy versus old economy, and US versus the euro area are all just one massive correlated trade. Get the direction of the T-bond yield right, and you will get the whole correlated trade right. The rise in the 10-year T-bond yield will meet resistance much closer to 2 percent than to 3 percent… …because the level of the yield is already starting to weigh on the stock market, the financial system, and the real economy. Hence, on a 6-month horizon, fade the massive correlated trade. When allocating to stock markets, don’t confuse a ‘stock effect’ for a ‘country effect’. Fractal trade shortlist: European autos and European personal products. The Pareto Principle Of Investment Chart of the WeekCorrelated Trade: Tech And The US
Correlated Trade: Tech And The US
Correlated Trade: Tech And The US
One of the guiding principles of investment is that: Investment is complex, but it is not complicated. The words complex and complicated are often used synonymously, but they mean different things. Complex means something that is not fully predictable or analysable. Complicated means something that is made up of many parts. Investment is not complicated because a few parts drive the relative prices of everything. This is also known as the Pareto Principle, or the 20:80 rule. Just 20 percent of the input determines 80 percent of the output.1 Right now, the 20 that is determining the 80 is the bond yield. Higher bond yields are hurting high-flying tech stocks. This is because the ‘net present value’ of cashflows that are weighted deep into the future are highly sensitive to rising yields. Therefore, underweighting T-bonds means underweighting tech versus the market. Which extends to growth versus value, new economy versus old economy, US versus the euro area, and so on. In effect, all these positions have become one massive correlated trade (Chart of the Week, Chart I-2, and Chart I-3). Chart I-2Correlated Trade: T-Bond, And Growth Vs. Value
Correlated Trade: T-Bond, And Growth Vs. Value
Correlated Trade: T-Bond, And Growth Vs. Value
Chart I-3Correlated Trade: Growth Vs. Value, ##br##And Tech
Correlated Trade: Growth Vs. Value, And Tech
Correlated Trade: Growth Vs. Value, And Tech
Get the direction of the bond yield right and your whole investment strategy will be right. You will be a hero. Get the direction of the bond yield wrong and your whole investment strategy will be wrong. You will be a zero. Get the direction of the bond yield right and your whole investment strategy will be right. The hero/zero decision for investors is: from the current level of 1.7 percent, at what level will the 10-year T-bond yield peak and reverse? If the answer is, say, 3 percent, then the recent direction of this correlated trade has much further to go, and investors should stay on the ride. But if the answer is, say, 2 percent, then this correlated trade does not have much further to go, and it will soon be time to get off. To repeat, investment is not complicated, but it is complex. The evolution of the bond yield is not fully analysable or predictable. Still, our assessment is that the rise in the 10-year T-bond yield will meet resistance much closer to 2 percent than to 3 percent. This is because the level of yields is already starting to weigh on the stock market, the financial system, and the real economy. Specifically: The global stock market rally has stalled since mid-February because high-flying growth stocks have been reined back by rising bond yields. Recent margin calls and liquidations in the hedge fund space presage points of fragility in the financial system. Note, there is never just one cockroach. US mortgage applications for home purchases and building permits for new housebuilding appear to be rolling over (Chart I-4). Admittedly, these are just straws in the wind. But straws in the wind can be the first sign of a brewing storm. Chart I-4Are Higher Bond Yields Starting To Weigh On The Housing Market?
Are Higher Bond Yields Starting To Weigh On The Housing Market?
Are Higher Bond Yields Starting To Weigh On The Housing Market?
On a 6-month horizon, fade the underweighting to bonds, tech versus the market, growth versus value, new economy versus old economy, and US versus the euro area correlated trade. Sectors Still Rule The Stock Market World The evolution of the pandemic, the pace of vaccination roll-outs, and the size of fiscal stimuluses have become polarised by region and country, with clear leaders and laggards. This raises the question: are the regions and countries that are winning against the pandemic the investment winners too? For the major stock markets, the answer is an emphatic no. Compared with the US, the euro area is experiencing an aggressive third wave of infections, is lagging in its vaccination roll-outs, and is unleashing much less fiscal stimulus. Yet euro area equities have not been underperforming US equities. Proving that the outperformance and underperformance of the major stock markets has very little to do with what is going on in the local economy. The outperformance and underperformance of the major stock markets has very little to do with what is going on in the local economy. By far the biggest driver of euro area versus US stock market performance is the euro area’s massive underweighting to tech stocks vis-à-vis the US. Hence, the tech sector’s recent travails have boosted the euro area stock market’s relative performance. Similar types of sector skews explain the relative performance of all the major stock markets (Table I-1). For example, developed markets (DM) versus emerging markets (EM) is nothing more than healthcare versus basic resources (Chart I-5). Table I-1The Sector Fingerprints Of The Major Stock Markets
The Pareto Principle Of Investment
The Pareto Principle Of Investment
Chart I-5DM Vs. EM Is Nothing More Than Healthcare Vs. Basic Resources
DM Vs. EM Is Nothing More Than Healthcare Vs. Basic Resources
DM Vs. EM Is Nothing More Than Healthcare Vs. Basic Resources
Exchange rates can also have a bearing on stock market relative performance – though the main transmission mechanism is not through competitiveness, but through the so-called ‘currency translation effect.’ Specifically, the multinationals that dominate the major stock markets have their cost bases diversified across multiple currencies. Hence, for a euro-listed multinational company, a weaker euro doesn’t boost its competitiveness. But it does boost the translation of its multi-currency profits into euros, the currency of its stock market listing. Thereby, the weaker euro boosts its stock price. Don’t Confuse A ‘Stock Effect’ For A ‘Country Effect’ Many people think that there is also a strong ‘country effect’ in stock market selection. For example, if US tech hardware outperforms euro area tech hardware, then this is clearly not a sector effect. It must be to do with a difference between the US and the euro area, meaning a country effect. The truth is more nuanced. Many sectors are now highly concentrated in one or two dominant stocks. US tech hardware is concentrated in Apple while euro area tech hardware is concentrated in ASML. Hence, if US tech hardware is outperforming euro area tech hardware, it is because Apple is outperforming ASML (Chart I-6). Chart I-6Is US Tech Vs. Euro Area Tech A 'Country Effect' Or A 'Stock Effect'?
Is US Tech Vs. Euro Area Tech A 'Country Effect' Or A 'Stock Effect'?
Is US Tech Vs. Euro Area Tech A 'Country Effect' Or A 'Stock Effect'?
Likewise, if euro area pharma is outperforming UK pharma, it is because the dominant euro area pharma stock, Sanofi, is outperforming the dominant UK pharma stock, AstraZeneca (Chart I-7). Chart I-7Is Euro Area Pharma Vs. UK Pharma A 'Country Effect' Or A 'Stock Effect'?
Is Euro Area Pharma Vs. UK Pharma A 'Country Effect' Or A 'Stock Effect'?
Is Euro Area Pharma Vs. UK Pharma A 'Country Effect' Or A 'Stock Effect'?
So, if US tech hardware is outperforming euro area tech hardware, and euro area pharma is outperforming UK pharma, are these ‘country effects’, or are they ‘stock effects’? We would argue that, in truth, they are stock effects. Meaning they have little to do with what is happening in the country of listing, and much more to do with the specifics of the company. For example, if UK pharma is underperforming, it is because AstraZeneca is underperforming. And if AstraZeneca is underperforming, it is more likely to do with the performance of its Covid-19 vaccine than the performance of the UK economy. The problem is that most performance attributions will incorrectly count what are stock effects as country effects. And the more concentrated that sectors become, the more pronounced this error becomes. Yet nowadays, extreme concentration in one or two stocks per sector is the norm rather than the exception. Hence, what appears to be a country effect is, in most cases, a stock effect. What appears to be a country effect is, in most cases, a stock effect. The important lesson is that when allocating to the major stock markets, do not think in terms of regions or countries because the country effect is, in truth, negligible. Think in terms of the sectors and the dominant stocks that you want to own, and the regional and country allocation will resolve itself automatically. On this basis our high-conviction structural position to be overweight DM versus EM simply follows from our high-conviction structural position to be overweight healthcare versus basic resources. In the DM versus EM decision, everything else is largely irrelevant. Candidates For Countertrend Reversals This week’s candidates for countertrend reversal are European autos, and European personal products. The euphoria towards electric vehicles (EVs) has taken European auto stocks to a technically overbought extreme (Chart I-8). Chart I-8European Autos Are Overbought
European Autos Are Overbought
European Autos Are Overbought
Conversely, the euphoria towards economic reopening plays has taken European personal products stocks to a technically oversold extreme (Chart I-9). Chart I-9European Personal Products Are Oversold
European Personal Products Are Oversold
European Personal Products Are Oversold
Our recommended trade is overweight European personal products versus European autos (Chart I-10), setting a profit target and symmetrical stop-loss at 15 percent. Chart I-10Overweight European Personal Products Versus European Autos
Overweight European Personal Products Versus European Autos
Overweight European Personal Products Versus European Autos
Dhaval Joshi Chief Strategist dhaval@bcaresearch.com Footnotes 1 The exact numbers 20 and 80 are simply indicative of the Pareto Principle rather than set in stone, they could also be 5 and 95, or indeed 5 and 99 as they do not need to sum to 100. Fractal Trading System
The Pareto Principle Of Investment
The Pareto Principle Of Investment
6-Month Recommendations
The Pareto Principle Of Investment
The Pareto Principle Of Investment
Structural Recommendations
The Pareto Principle Of Investment
The Pareto Principle Of Investment
Closed Fractal Trades
The Pareto Principle Of Investment
The Pareto Principle Of Investment
The Pareto Principle Of Investment
The Pareto Principle Of Investment
The Pareto Principle Of Investment
The Pareto Principle Of Investment
Asset Performance
The Pareto Principle Of Investment
The Pareto Principle Of Investment
Equity Market Performance
The Pareto Principle Of Investment
The Pareto Principle Of Investment
The Pareto Principle Of Investment
The Pareto Principle Of Investment
Indicators Bond Yields Chart II-1Euro Area
Indicators To Watch - Bond Yields - Euro Area
Indicators To Watch - Bond Yields - Euro Area
Chart II-2Europe Ex Euro Area
Indicators To Watch - Bond Yields - Europe Ex Euro Area
Indicators To Watch - Bond Yields - Europe Ex Euro Area
Chart II-3Asia
Indicators To Watch - Bond Yields - Asia
Indicators To Watch - Bond Yields - Asia
Chart II-4Other Developed
Indicators To Watch - Bond Yields - Other Developed
Indicators To Watch - Bond Yields - Other Developed
Interest Rate Chart II-5Expectations
Indicators To Watch - Interest Rate Expectations
Indicators To Watch - Interest Rate Expectations
Chart II-6Expectations
Indicators To Watch - Interest Rate Expectations
Indicators To Watch - Interest Rate Expectations
Chart II_7Expectations
Indicators To Watch - Interest Rate Expectations
Indicators To Watch - Interest Rate Expectations
Chart II-8Expectations
Indicators To Watch - Interest Rate Expectations
Indicators To Watch - Interest Rate Expectations