Equities

Weekly Performance Update For the week ending Thu Mar 25, 2021 The Market Monitor displays the trailing 1-quarter performance of strategies based around the BCA Score. For each region, we construct an equal-weighted, monthly rebalanced portfolio consisting of the top 3 stocks per sector and compare it with the regional benchmark. For each portfolio, we show the weekly performance of individual holdings in the Top Contributors/Detractors table. In addition, the Top Prospects table shows the holdings that currently have the highest BCA Score within the portfolio. For more details, click the region headers below to be redirected to the full historical backtest for the strategy. BCA US Portfolio
Market Monitor (Mar 25, 2021)
Market Monitor (Mar 25, 2021)
Total Weekly Return BCA US Portfolio S&P500 TRI -1.61% -0.13% Top Contributors LOW:US HD:US TTEC:US AWK:US AM:US Weekly Return 19 bps 16 bps 16 bps 12 bps 11 bps Top Detractors QFIN:US SCCO:US EVR:US YETI:US MORN:US Weekly Return -115 bps -28 bps -23 bps -16 bps -16 bps Top Prospects TX:US UHAL:US SCCO:US EVR:US MORN:US BCA Score 99.67% 96.73% 95.22% 93.86% 90.82% BCA Canada Portfolio
Market Monitor (Mar 25, 2021)
Market Monitor (Mar 25, 2021)
Total Weekly Return BCA Canada Portfolio S&P/TSX TRI -0.81% -0.95% Top Contributors AND:CA TA:CA SMU.UN:CA EMP.A:CA H:CA Weekly Return 14 bps 13 bps 11 bps 11 bps 9 bps Top Detractors NXE:CA IFP:CA APHA:CA CFP:CA TFII:CA Weekly Return -42 bps -21 bps -18 bps -18 bps -17 bps Top Prospects IFP:CA LNF:CA CFP:CA LNR:CA FTT:CA BCA Score 99.08% 98.99% 98.60% 97.26% 92.53% BCA UK Portfolio
Market Monitor (Mar 25, 2021)
Market Monitor (Mar 25, 2021)
Total Weekly Return BCA UK Portfolio FTSE 100 TRI -0.69% -1.44% Top Contributors TRMR:GB CVSG:GB DRX:GB SSE:GB AGRO:GB Weekly Return 54 bps 34 bps 21 bps 10 bps 8 bps Top Detractors MNOD:GB LNTA:GB FDEV:GB SVST:GB LSRG:GB Weekly Return -28 bps -23 bps -21 bps -17 bps -16 bps Top Prospects NLMK:GB GLTR:GB SVST:GB BPCR:GB AGRO:GB BCA Score 99.79% 99.65% 99.22% 96.22% 94.91% BCA Eurozone Portfolio
Market Monitor (Mar 25, 2021)
Market Monitor (Mar 25, 2021)
Total Weekly Return BCA EMU Portfolio MSCI EMU TRI -0.20% -0.96% Top Contributors KESKOB:FI DLG:IT FSKRS:FI QTCOM:FI SHUR:BE Weekly Return 32 bps 14 bps 12 bps 12 bps 11 bps Top Detractors SAA1V:FI REG1V:FI FTK:DE FLUX:BE SOLV:BE Weekly Return -21 bps -18 bps -17 bps -14 bps -11 bps Top Prospects SOLV:BE SOL:IT GCO:ES LOG:ES IPS:FR BCA Score 99.32% 98.74% 95.37% 95.35% 94.90% BCA Japan Portfolio
Market Monitor (Mar 25, 2021)
Market Monitor (Mar 25, 2021)
Total Weekly Return BCA Japan Portfolio TOPIX TRI -1.08% -2.64% Top Contributors 5930:JP 8174:JP 9436:JP 9532:JP 6448:JP Weekly Return 10 bps 9 bps 6 bps 6 bps 6 bps Top Detractors 8739:JP 4534:JP 3132:JP 8595:JP 8255:JP Weekly Return -18 bps -18 bps -17 bps -13 bps -13 bps Top Prospects 4008:JP 9436:JP 8133:JP 3132:JP 8255:JP BCA Score 98.88% 97.89% 97.21% 96.73% 96.68% BCA Hong Kong Portfolio
Market Monitor (Mar 25, 2021)
Market Monitor (Mar 25, 2021)
Total Weekly Return BCA Hong Kong Portfolio Hang Seng TRI -4.82% -5.11% Top Contributors 185:HK 1571:HK 86:HK 369:HK 2798:HK Weekly Return 38 bps 17 bps 14 bps 2 bps 1 bps Top Detractors 867:HK 1378:HK 297:HK 1830:HK 1911:HK Weekly Return -76 bps -48 bps -40 bps -29 bps -28 bps Top Prospects 1378:HK 1866:HK 86:HK 297:HK 3369:HK BCA Score 99.54% 99.09% 98.66% 97.14% 96.88% BCA Australia Portfolio
Market Monitor (Mar 25, 2021)
Market Monitor (Mar 25, 2021)
Total Weekly Return BCA Australia Portfolio S&P/ASX All Ord. TRI -0.07% 0.29% Top Contributors ADO:AU AGL:AU SIG:AU JLG:AU AST:AU Weekly Return 31 bps 29 bps 16 bps 14 bps 11 bps Top Detractors PDN:AU GRR:AU YAL:AU BSE:AU SGF:AU Weekly Return -66 bps -36 bps -13 bps -10 bps -8 bps Top Prospects GRR:AU BSE:AU BLX:AU BFG:AU WPP:AU BCA Score 99.92% 99.65% 99.23% 98.69% 96.91%
Dear Client, We are sending you our Strategy Outlook today, where we outline our thoughts on the macro landscape and the direction of financial markets for the rest of 2021 and beyond. Next week, please join me for a webcast on Thursday, April 1 at 10:00 AM EDT (3:00 PM BST, 4:00 PM CEST, 10:00 PM HKT) where I will discuss the outlook. Best regards, Peter Berezin, Chief Global Strategist Highlights Growth outlook: The global economy will rebound over the course of the year, with momentum rotating from the US to the rest of the world. Inflation: Structurally higher inflation is not a near-term risk, even in the US, but could become a major problem by the middle of the decade. Global asset allocation: Investors should continue to overweight equities on a 12-month horizon. Unlike in the year 2000, the equity earnings yield is still well above the bond yield. Equities: Value stocks will maintain their recent outperformance. Investors should favor banks and economically-sensitive cyclical sectors, while overweighting stock markets outside the US. Fixed income: Continue to maintain below average interest-rate duration exposure. Spread product will outperform safe government bonds. Favor inflation-protected securities over nominal bonds. Currencies: While the dollar could strengthen in the near term, it will weaken over a 12-month period. Large budget deficits, a deteriorating balance of payments profile, and an accommodative Fed are all dollar bearish. Commodities: Tight supply conditions and a cyclical recovery in oil demand will support crude prices. Strong Chinese growth will continue to buoy the metals complex. I. Macroeconomic Outlook Global Growth: The US Leads The Way… For Now The global economy should rebound from the pandemic over the remainder of the year. So far, however, it has been a two-speed recovery. Whereas the Bloomberg consensus has US real GDP growing by 4.8% in the first quarter, analysts expect the economies in the Euro area, UK, and Japan to contract by 3.6%, 13.3%, and 5%, respectively. Chart 1Dismantling Of Lockdown Measures Occurring At Varying Pace
Second Quarter 2021 Strategy Outlook: Inflation Cometh?
Second Quarter 2021 Strategy Outlook: Inflation Cometh?
Chart 2US Is Among The Vaccination Leaders
US Is Among The Vaccination Leaders
US Is Among The Vaccination Leaders
Two things explain US growth outperformance. First, the successful launch of the US vaccination campaign has allowed state governments to begin dismantling lockdown measures (Chart 1). Currently, the US has administered 40 vaccine shots for every 100 inhabitants. Among the major economies, only the UK has performed better on the vaccination front (Chart 2). In contrast, parts of continental Europe are still battling a new wave of Covid infections, prompting policymakers there to further tighten social distancing rules. Second, US fiscal policy has been more stimulative than elsewhere (Chart 3). On March 11, President Biden signed the $1.9 trillion American Rescue Plan Act into law. Among other things, the Act provides direct payments to lower- and middle-class households, extends and expands unemployment benefits, and offers aid to state and local governments (Chart 4). Unlike President Trump’s Tax Cuts and Jobs Act, the Democrats’ legislation will raise the incomes of the poor much more than the rich (Chart 5). Chart 3The US Tops The Stimulus Race
Second Quarter 2021 Strategy Outlook: Inflation Cometh?
Second Quarter 2021 Strategy Outlook: Inflation Cometh?
We expect growth leadership to shift from the US to the rest of the world in the second half of the year. Nevertheless, US real GDP in Q4 of 2021 will probably end up 7% above the level of Q4 of 2020, enough to close the output gap. In Section II of this report, we discuss whether this could cause inflation to take off on a sustained basis. We conclude that such an outcome is unlikely for the next two years. However, materially higher inflation is indeed a risk over a longer-term horizon. Chart 4Composition Of The American Rescue Plan Act
Second Quarter 2021 Strategy Outlook: Inflation Cometh?
Second Quarter 2021 Strategy Outlook: Inflation Cometh?
Chart 5Biden’s Package Will Boost The Income Of The Poor More Than The Rich
Second Quarter 2021 Strategy Outlook: Inflation Cometh?
Second Quarter 2021 Strategy Outlook: Inflation Cometh?
The EU: Recovery After Lockdown The EU will benefit from a cyclical recovery later this year as the vaccination campaign picks up steam. The recent weakness in Europe was concentrated in services (Chart 6). The latest European PMI data shows that the service sector may have turned the corner. As in the US, European households have accumulated significant excess savings. The unleashing of pent-up demand should drive consumption over the remainder of the year (Chart 7). Chart 6For Now, The Service Sector Is Doing Better In The US Than The Euro Area
Second Quarter 2021 Strategy Outlook: Inflation Cometh?
Second Quarter 2021 Strategy Outlook: Inflation Cometh?
Chart 7European Households Have Accumulated Excess Savings
European Households Have Accumulated Excess Savings
European Households Have Accumulated Excess Savings
Meanwhile, the manufacturing sector continues to do well, with the Euro area manufacturing PMI hitting all-time highs in March. Sentiment indices such as the Sentix and ZEW surveys point to further upside for manufacturing activity (Chart 8). Chart 8Positive Outlook For Euro Area Manufacturing Activity
Positive Outlook For Euro Area Manufacturing Activity
Positive Outlook For Euro Area Manufacturing Activity
Fiscal policy should also turn modestly more expansionary. The EU recovery fund will begin disbursing aid in the second quarter. This should allow the southern European economies to maintain more generous levels of fiscal support. It also looks increasingly likely that the Green Party will either lead or join the coalition government in Germany, which could translate into greater spending. UK: Recovering From A One-Two Punch The UK had to shutter its economy late last year due to the emergence of a new, more contagious, strain of the virus. The resulting hit to the economy came on top of a decline in exports to the EU following Brexit. The economic picture will improve over the coming months. Thanks to the speedy vaccination campaign, the government plans to lift the “stay at home” rules on March 29. Most retail, dining, and hospitality businesses are scheduled to reopen on April 12. A strong housing market and the extension of both the furlough schemes and tax holidays should also sustain demand. Japan: More Fiscal Support Needed Like many other countries, Japan had to introduce new lockdown measures in late 2020 after suffering its worst wave of the pandemic. While the number of new cases has dropped dramatically since then, they have edged up again over the past two weeks. Japanese regulations require that vaccines be tested on Japanese people. Prime Minster Yoshihide Suga has promised that vaccine shots will be available to the country’s 36 million seniors by the end of June. However, with less than 1% of the population vaccinated so far, strict social distancing will persist well into the summer. The Japanese government passed a JPY 73 trillion (13.5% of GDP) supplementary budget in December. However, only 40 trillion of that has been allocated for direct spending. Due to negative bond yields, the Japanese government earns more interest than it pays on its debt. It should be running much more expansionary fiscal policy. China: Policy Normalization, Not Deleveraging Chart 9China: Tailwind For Easier Monetary And Fiscal Policies Will Fade Over The Remainder Of The Year
China: Tailwind For Easier Monetary And Fiscal Policies Will Fade Over The Remainder Of The Year
China: Tailwind For Easier Monetary And Fiscal Policies Will Fade Over The Remainder Of The Year
China’s combined credit/fiscal impulse peaked late last year (Chart 9). The impulse leads growth by about six months, implying that the tailwind from easier monetary and fiscal policies will fade over the rest of the year. Nevertheless, we doubt that China’s economy will experience much of a slowdown. First and foremost, the shock from the pandemic should fade, helping to revive consumer and business confidence. Second, the Chinese authorities are likely to pursue policy normalization, rather than outright deleveraging. Jing Sima, BCA’s chief China strategist, expects the general government deficit to remain broadly stable at 8% of GDP this year. She also thinks that the rate of credit expansion will fall by only 2-to-3 percentage points in 2021, bringing credit growth back in line with projected nominal GDP growth of 8%. Total credit was 290% of GDP at end-2020. Thus, credit growth of 8% would still generate 290%*8%=23% of GDP of net credit formation, providing more than enough support to the economy. II. Feature: Will The US Economy Overheat? As of February, US households were sitting on around $1.7 trillion in excess savings. About two-thirds of those savings can be chalked up to reduced spending during the pandemic, with the remaining one-third arising from increased transfer payments (Chart 10). The recently passed stimulus bill will boost household savings by an additional $300 billion, bringing the stock of excess savings to $2 trillion by April. This cash hoard will support spending. Already, real-time measures of economic activity have hooked up. Traffic congestion in many US cities is approaching pre-pandemic levels. OpenTable’s measure of restaurant occupancy is progressing back to where it was before the pandemic (Chart 11). J.P. Morgan reported that spending using its credit cards rose 23% year-over-year in the 9-day period through to March 19 as stimulus payments reached bank accounts. Anecdotally, airlines and cruise line companies have been expressing optimism on the back of a surge in bookings. Chart 10Lower Spending And Higher Income Led To Mounting Excess Savings
Lower Spending And Higher Income Led To Mounting Excess Savings
Lower Spending And Higher Income Led To Mounting Excess Savings
Chart 11Real-Time Measures Of Economic Activity Have Hooked Up
Second Quarter 2021 Strategy Outlook: Inflation Cometh?
Second Quarter 2021 Strategy Outlook: Inflation Cometh?
Meanwhile, the supply side of the economy could face temporary constraints. Under the stimulus bill, close to half of jobless workers will receive more income through to September from extended unemployment benefits than they did from working. This could curtail labor supply at a time when firms are trying to step up the pace of hiring. The Fed Versus The Markets In the latest Summary of Economic Projections released last week, the median “dot” for the fed funds rate remained stuck at zero through to end-2023. The bond market, in contrast, expects the Fed to start raising rates next year. Why is there a gap between the Fed and market expectations? Part of the answer is that the “dots” and market expectations measure different things. Whereas the dots reflect a modal, or “most likely” estimate of where short-term rates will be over the next few years, market expectations reflect a probability-weighted average. The fact that rates cannot fall deeply into negative territory – but can potentially rise a lot in a high-inflation scenario – has skewed market rate expectations to the upside. That said, there is another, more fundamental, reason at work: The Fed simply does not think that a negative output gap will lead to materially higher inflation. The “dots” assume that core PCE inflation will barely rise above 2% over the next two years, even though, by the Fed’s own admission, the unemployment rate will fall firmly below NAIRU in 2023 (Chart 12). Chart 12The Fed Sees Faster Recovery, Same Rate Path
Second Quarter 2021 Strategy Outlook: Inflation Cometh?
Second Quarter 2021 Strategy Outlook: Inflation Cometh?
Chart 13Just Like It Did In 2011, The Fed Will Disregard What It Sees As Transitory Price Shocks
Just Like It Did In 2011, The Fed Will Disregard What It Sees As Transitory Price Shocks
Just Like It Did In 2011, The Fed Will Disregard What It Sees As Transitory Price Shocks
Is the Federal Reserve’s relaxed view towards inflation risk justified? The Fed knows full well that headline inflation could temporarily reach 4% over the next two months due to base effects from last year’s deflationary shock, lingering supply chain disruptions, the rebound in gasoline prices, and the lagged effect from dollar weakness. However, as it did in late 2011, when headline inflation nearly hit 4% and producer price inflation briefly topped 10%, the Fed is inclined to regard these price shocks as transitory (Chart 13). The Fed believes that PCE inflation will tick up to 2.4% this year but then settle back down to 2% by the end of next year as supply disruptions dissipate and most fiscal stimulus measures roll off. Our bet is that the Fed will be right about inflation in the near term, but wrong in the long term. That is to say, we think that core inflation will probably remain subdued for the next two years, as the Fed expects. However, inflation is poised to rise significantly towards the middle of the decade, an outcome that is likely to surprise both the Fed and market participants. War-Time Inflation, But Which War? In some respects, the Fed sees the current environment as resembling a war, except this time the battle is against an invisible enemy: Covid-19. Chart 14 shows what happened to US inflation during WWI, WWII, the Korean War, and the Vietnam War. In the first three of those four wars, inflation rose but then fell back down after the war had concluded. That is what the Fed is counting on. What about the possibility that the coming years could resemble the period around the Vietnam War, where inflation continued to rise even though the number of US military personnel engaged in the conflict peaked in 1968? Chart 14Inflation During Wartime: Which War Is Most Relevant For Today?
Inflation During Wartime: Which War Is Most Relevant For Today?
Inflation During Wartime: Which War Is Most Relevant For Today?
Chart 15Inflation Started Accelerating Quickly Only When Unemployment Reached Very Low Levels In The 1960s
Inflation Started Accelerating Quickly Only When Unemployment Reached Very Low Levels In The 1960s
Inflation Started Accelerating Quickly Only When Unemployment Reached Very Low Levels In The 1960s
In the near term, this does not appear to be a major risk. In 1966, when the war effort was ramping up, the US unemployment rate was two percentage points below NAIRU (Chart 15). As of February, US employment was still more than 5% below pre-pandemic levels. Chart 16Employment Has Been Weak And Edging Lower At The Bottom Quartile Of The Wage Distribution
Second Quarter 2021 Strategy Outlook: Inflation Cometh?
Second Quarter 2021 Strategy Outlook: Inflation Cometh?
We estimate that the US output gap currently stands at around 5%-to-6% of GDP. Among the bottom quartile of the wage distribution, employment is 20% below pre-pandemic levels, and has been edging lower, not higher, since last October (Chart 16). Thus, for now, hyperbolic talk of how fiscal stimulus is crowding out private-sector spending is unwarranted. Inflation Nation Looking further out, the parallels between today and the late sixties are more striking. As we discussed in a report titled 1970s-Style Inflation: Yes, It Could Happen Again, much of what investors believe about how inflation emerged during the late 1960s is either based on myths, or at best, half-truths. To the extent that there are differences between today and that era, they don’t necessarily point to lower inflation in the coming years. For example, in the late sixties, the baby boomers were entering the labour force, supplying the economy with a steady stream of new workers. This helped to temper wage pressures. Today, baby boomers are leaving the labour force. They accumulated a lot of wealth over the past 50 years – so much so that they now control more than half of all US wealth (Chart 17). Over the coming two decades, they will run down that wealth, implying that household savings rates could drop. By definition, a lower savings rate implies more spending in relation to output, which is inflationary. Chart 17Baby Boomers Have Accumulated A Lot Of Wealth
Second Quarter 2021 Strategy Outlook: Inflation Cometh?
Second Quarter 2021 Strategy Outlook: Inflation Cometh?
III. Financial Markets A. Portfolio Strategy Overweight Stocks Versus Bonds Stocks usually outperform bonds when economic growth is strong and money is cheap (Chart 18). The end of the pandemic and ongoing fiscal stimulus should support growth over the next 12-to-18 months, allowing the bull market in equities to continue. With inflation slow to rise, monetary policy will remain accommodative over this period. Chart 18AStocks Usually Outperform Bonds When Economic Growth Is Strong...
Stocks Usually Outperform Bonds When Economic Growth Is Strong...
Stocks Usually Outperform Bonds When Economic Growth Is Strong...
Chart 18B... And Money Is Cheap
... And Money Is Cheap
... And Money Is Cheap
The recent back-up in long-term bond yields could destabilize stocks for a month or two. However, our research has shown that as long as bond yields do not rise enough to trigger a recession, stocks will shrug off the effect of higher yields (Chart 19 and Table 1). Indeed, there is a self-limiting aspect to how high bond yields can rise, and stocks can fall, in a setting where inflation remains subdued. Higher bond yields lead to tighter financial conditions. Tighter financial conditions, in turn, lead to weaker growth, which justifies an even longer period of low rates. It is only when inflation rises to a level that central banks find uncomfortable that tighter financial conditions become desirable. We are far from that level today. Chart 19What Happens To Equities When Treasury Yields Rise?
What Happens To Equities When Treasury Yields Rise?
What Happens To Equities When Treasury Yields Rise?
Table 1As Long As Bond Yields Don’t Rise Into Restrictive Territory, Stocks Will Recover
Second Quarter 2021 Strategy Outlook: Inflation Cometh?
Second Quarter 2021 Strategy Outlook: Inflation Cometh?
It’s Not 2000 In recent months, many analysts have drawn comparisons between the year 2000 and the present day. While there are plenty of similarities, ranging from euphoric retail participation to the proliferation of dubious SPACs and IPOs, there is one critical difference: The forward earnings yield today is above the real bond yield, whereas in 2000 the earnings yield was below the bond yield (Chart 20). The US yield curve inverted in February 2000, with the 10-year Treasury yield peaking a month earlier at 6.79%. An inverted yield curve is one of the most reliable recession predictors. We are a far cry from such a predicament today. By the same token, the S&P 500 dividend yield was well below the bond yield in 2000. Today, they are roughly the same. Even if one were to pessimistically assume that US companies are unable to raise nominal dividend payments at all for the next decade, the S&P 500 would need to fall by 20% in real terms for equities to underperform bonds. Many other stock markets would have to decline by an even greater magnitude (Chart 21). Chart 20Relative To Bonds, Stocks Are More Favorably Valued Now Than In 2000
Relative To Bonds, Stocks Are More Favorably Valued Now Than In 2000
Relative To Bonds, Stocks Are More Favorably Valued Now Than In 2000
Chart 21Stocks Would Need To Fall A Lot For Equities To Underperform Bonds
Stocks Would Need To Fall A Lot For Equities To Underperform Bonds
Stocks Would Need To Fall A Lot For Equities To Underperform Bonds
Protecting Against Long-Term Inflation Risk The bull market in stocks will end when central banks begin to fret over rising inflation. In the past, central banks have used forecasts of inflation to decide when to raise rates. The Federal Reserve’s revised monetary policy framework, which focuses on actual rather than forecasted inflation, almost guarantees that inflation will overshoot the Fed’s target. This is because monetary policy fully affects the economy with a lag of 12-to-18 months. By the time the Fed decides to clamp down on inflation, it will have already gotten too high. Investors looking to hedge long-term inflation risk should reduce duration exposure in fixed-income portfolios, favor inflation-protected securities over nominal bonds, and own more “real assets” such as property. In fact, one of the best inflation hedges is simply to buy a nice house financed with a high loan-to-value fixed-rate mortgage. In a few decades, you will still own the nice house, but the value of the mortgage will be greatly reduced in real terms. Gold Versus Cryptos Historically, gold has offered protection against inflation. Increasingly, many investors have come to believe that cryptocurrencies are a better choice. We disagree. As we recently discussed in a report titled Bitcoin: A Solution In Search Of A Problem, not only are cryptocurrencies such as Bitcoin highly inefficient mediums of exchange, they are also likely to turn out to be poor stores of value. Bitcoin’s annual electricity consumption now exceeds that of Pakistan and its 217 million inhabitants (Chart 22). About 70% of Bitcoin mining currently takes place in China, mainly using electricity generated by burning coal. Much of the rest of the mining takes place in countries such as Russia and Belarus with dubious governance records. Bitcoin and ESG are heading for a clash. We suspect ESG will win out. Chart 22Bitcoin Is Not Your Eco-Currency
Second Quarter 2021 Strategy Outlook: Inflation Cometh?
Second Quarter 2021 Strategy Outlook: Inflation Cometh?
B. Equities Favor Cyclicals, Value, And Non-US Stocks Chart 23Cyclicals And Ex-US Stocks Do Best When Global Growth Is On The Upswing
Cyclicals And Ex-US Stocks Do Best When Global Growth Is On The Upswing
Cyclicals And Ex-US Stocks Do Best When Global Growth Is On The Upswing
The vast majority of stock market capitalization today is concentrated in large multinational companies that are more leveraged to global growth rather than to the growth rate of countries in which they happen to be domiciled. Thus, while country-specific factors are not irrelevant, regional equity allocation often boils down to figuring out which stock markets will gain or lose from various global trends. The end of the pandemic will prop up global growth. In general, cyclical sectors outperform when global growth is on the upswing (Chart 23). As Table 2 illustrates, stock markets outside the US have more exposure to classically cyclical sectors such as industrials, energy, materials, and consumer discretionary that usually shine coming out of a downturn. This leads us to favor Europe, Japan, and emerging markets. We place banks in the cyclical category because faster economic growth tends to reduce bad loans, while also placing upward pressure on bond yields. Chart 24 shows that there is a very close correlation between the relative performance of bank shares and long-term bond yields. As government yields trend higher, banks will benefit. Table 2Financials Are Overrepresented In Ex-US Indices, While Tech Dominates The US Market
Second Quarter 2021 Strategy Outlook: Inflation Cometh?
Second Quarter 2021 Strategy Outlook: Inflation Cometh?
Chart 24Close Correlation Between Relative Performance Of Banks And Long-Term Bond Yields
Close Correlation Between Relative Performance Of Banks And Long-Term Bond Yields
Close Correlation Between Relative Performance Of Banks And Long-Term Bond Yields
Banks and most other cyclical sectors dominate value indices (Table 3). Not only is value still exceptionally cheap in relation to growth, but traditional value sectors have seen stronger upward earnings revisions than tech stocks since the start of the year (Chart 25). The likelihood that global bond yields put in a secular bottom last year, coupled with the emergence of a new bull market in commodities, makes us think that the nascent outperformance of value stocks has years to run. Table 3Breaking Down Growth And Value By Sector
Second Quarter 2021 Strategy Outlook: Inflation Cometh?
Second Quarter 2021 Strategy Outlook: Inflation Cometh?
Chart 25AValue Is Attractive On Multiple Levels (I)
Value Is Attractive On Multiple Levels (I)
Value Is Attractive On Multiple Levels (I)
Chart 25BValue Is Attractive On Multiple Levels (II)
Value Is Attractive On Multiple Levels (II)
Value Is Attractive On Multiple Levels (II)
US Corporate Tax Hikes Coming Finally, there is one country-specific factor worth mentioning, which reinforces our view of favoring non-US, cyclical, and value stocks: US corporate taxes are heading higher. BCA’s geopolitical strategists expect the Biden Administration and the Democrat-controlled Congress to raise the statutory corporate tax rate from 21% to as high as 28% later this year in order to fund, among other things, a major infrastructure investment program. Capital gains taxes will also rise. While tax hikes are unlikely to bring down the whole US stock market, they will detract from the relative performance of US stocks compared with their international peers. Cyclical sectors will benefit from the infrastructure spending. To the extent that such spending boosts growth and leads to a steeper yield curve, it should also benefit banks. In contrast, tech companies outside the clean energy sector will lag, especially if the bill introduces a minimum corporate tax on book income and raises taxes on overseas profits, as President Biden pledged to do during his campaign. C. Fixed Income Expect More US Curve Steepening As discussed above, inflation in the US and elsewhere will be slow to take off. However, when inflation does rise later this decade, it could do so significantly. Investors currently expect the Fed to start raising rates in December 2022, bringing the funds rate to 1.5% by the end of 2024 (Chart 26). In contrast, we think that a liftoff in the second half of 2023, preceded by a 6-to-12 month period of asset purchase tapering, is more likely. This implies a modest downside for short-dated US bond yields. Chart 26The Market Sees The Fed Rate Hike Cycle Kicking Off In Late 2022
The Market Sees The Fed Rate Hike Cycle Kicking Off In Late 2022
The Market Sees The Fed Rate Hike Cycle Kicking Off In Late 2022
Chart 27Long-Term US Real Yield Expectations Have Recovered But Remain Below Pre-Pandemic Levels
Long-Term US Real Yield Expectations Have Recovered But Remain Below Pre-Pandemic Levels
Long-Term US Real Yield Expectations Have Recovered But Remain Below Pre-Pandemic Levels
In contrast, long-term yields will face upward pressure first from strong growth, and later from higher inflation. The 5-year/5-year forward TIPS yield currently stands at 0.35%, which is still below pre-pandemic levels (Chart 27). Given structurally looser fiscal policy, the 5-year/5-year forward TIPS yield should be at least 50 basis points higher, which would translate into a 10-year Treasury yield of a bit over 2%. Regional Bond Allocation While the Fed will be slow out of the gate to raise rates, most other central banks will be even slower. The sole exception among developed market central banks is the Norges bank, which has indicated its intention to hike rates in the second half of this year. Conceivably, Canada could start tightening monetary policy fairly soon, given strong jobs growth and a bubbly housing market. While the Bank of Canada is eager to begin tapering asset purchases later this year, our global fixed-income strategists suspect that the BoC will wait for the Fed to raise rates first. An early start to rate hikes by the Bank of Canada could significantly push up the value of the loonie, which is something the BoC wants to avoid. New Zealand will also hike rates shortly after the Fed, followed by Australia. Bank of England governor Andrew Bailey has downplayed the recent rise in gilt yields. Nevertheless, the desire to maintain currency competitiveness in the post-Brexit era will prevent the BoE from hiking rates until 2024. Among the major central banks, the ECB and the BoJ will be the last major central banks to raise rates. Putting it all together, our fixed-income strategists advocate maintaining a below-benchmark stance on overall duration. Comparing the likely path for rate hikes with market pricing region by region, they recommend overweighting the Euro area and Japan, assigning a neutral allocation to the UK, Canada, Australia, and New Zealand, and an underweight on the US. Credit: Stick With US High Yield Corporates Corporate spreads have narrowed substantially since last March. Nevertheless, in an environment of strong economic growth, it still makes sense to favor riskier corporate credit over safe government bonds. Within corporate credit, we favor high yield over investment grade. Geographically, we prefer US corporate bonds over Euro area bonds. The former trade with a higher yield and spread than the latter (Chart 28). CHART 28Favor High-Yield Bonds Over Investment-Grade And US Corporates Over Euro Area (I)
Favor High-Yield Bonds Over Investment-Grade And US Corporates Over Euro Area (I)
Favor High-Yield Bonds Over Investment-Grade And US Corporates Over Euro Area (I)
Chart 28Favor High-Yield Bonds Over Investment-Grade And US Corporates Over Euro Area (II)
Favor High-Yield Bonds Over Investment-Grade And US Corporates Over Euro Area (II)
Favor High-Yield Bonds Over Investment-Grade And US Corporates Over Euro Area (II)
One way to gauge the attractiveness of credit is to look at the percentile rankings of 12-month breakeven spreads. The 12-month breakeven spread is the amount of credit spread widening that can occur before a credit-sensitive asset starts to underperform a duration-matched, risk-free government bond over a one-year horizon. For US investment-grade corporates, the breakeven spread is currently in the bottom decile of its historic range, which is rather unattractive from a risk-adjusted perspective. In contrast, the US high-yield breakeven spread is currently in the middle of the distribution. In the UK, high-yield debt is more appealing than investment grade, although not quite to the same extent as in the US. In the Euro area, both high-yield and investment-grade credit are fairly unattractive (Chart 29). Chart 29US High-Yield Stands Out The Most
Second Quarter 2021 Strategy Outlook: Inflation Cometh?
Second Quarter 2021 Strategy Outlook: Inflation Cometh?
D. Currencies Faster US Growth Should Support The Dollar In The Near Term… Chart 30US Has A Smaller Share Of Manufacturing Than Most Other Developed Economies
US Has A Smaller Share Of Manufacturing Than Most Other Developed Economies
US Has A Smaller Share Of Manufacturing Than Most Other Developed Economies
The US has a “low beta” economy. Compared to most other economies, the US has a bigger service sector and a smaller manufacturing base (Chart 30). The US economy is also highly diversified on both a regional and sectoral level. This tends to make US growth less volatile than growth abroad. The relatively low cyclicality of the US economy has important implications for the US dollar. While the US benefits from stronger global growth, the rest of the world usually benefits even more. Thus, when global growth accelerates, capital tends to flow from the US to other economies, dragging down the value of the dollar. This relationship broke down this year. Rather than lagging other economies, the US economy has led the charge thanks to bountiful fiscal stimulus and a successful vaccination campaign. As growth estimates for the US have been marked up, the dollar has caught a temporary bid (Chart 31). Chart 31US Growth Outperformance Could Be A Near-Term Tailwind For The Dollar
US Growth Outperformance Could Be A Near-Term Tailwind For The Dollar
US Growth Outperformance Could Be A Near-Term Tailwind For The Dollar
… But Underlying Fundamentals Are Dollar Bearish As discussed earlier in the report, growth momentum should swing back towards the rest of the world later this year. This should weigh on the dollar in the second half of the year. To make matters worse for the greenback, the US trade deficit has ballooned in recent quarters. The current account deficit, a broad measure of net foreign income flows, rose by nearly 35% to $647 billion in 2020. At 3.1% of GDP, it was the largest shortfall in 12 years (Chart 32). Consistent with the weak balance of payments picture, the dollar remains overvalued by about 10% on a purchasing power parity basis (Chart 33). Chart 32The Widening US External Gap
The Widening US External Gap
The Widening US External Gap
Chart 33The Dollar Is Expensive Based On Its PPP Fair Value
The Dollar Is Expensive Based On Its PPP Fair Value
The Dollar Is Expensive Based On Its PPP Fair Value
Historically, the dollar has weakened whenever fiscal policy has been eased in excess of what is needed to close the output gap (Chart 34). Foreigners have been net sellers of Treasurys this year. It is equity inflows that have supported the dollar (Chart 35). However, if non-US stock markets begin to outperform, foreign flows into US stocks could reverse. Chart 34The Greenback Tends To Weaken When Fiscal Policy Is Eased Relative To What The Economy Needs
The Greenback Tends To Weaken When Fiscal Policy Is Eased Relative To What The Economy Needs
The Greenback Tends To Weaken When Fiscal Policy Is Eased Relative To What The Economy Needs
Chart 35Equity Inflows Supported The Dollar This Year (I)
Equity Inflows Supported The Dollar This Year (I)
Equity Inflows Supported The Dollar This Year (I)
Chart 35Equity Inflows Supported The Dollar This Year (II)
Equity Inflows Supported The Dollar This Year (II)
Equity Inflows Supported The Dollar This Year (II)
Meanwhile, stronger US growth has pushed long-term real interest rate differentials only modestly in favor of the US. At the short end of the curve, real rate differentials have actually widened against the US since the start of the year, reflecting rising US inflation expectations and the Fed’s determination to keep rates near zero for an extended period of time (Chart 36). Chart 36Real Rate Differentials Have Moved In Favor Of The Dollar At The Long End Of The Curve, But Not At The Short End (I)
Real Rate Differentials Have Moved In Favor Of The Dollar At The Long End Of The Curve, But Not At The Short End (I)
Real Rate Differentials Have Moved In Favor Of The Dollar At The Long End Of The Curve, But Not At The Short End (I)
Chart 36Real Rate Differentials Have Moved In Favor Of The Dollar At The Long End Of The Curve, But Not At The Short End (II)
Real Rate Differentials Have Moved In Favor Of The Dollar At The Long End Of The Curve, But Not At The Short End (II)
Real Rate Differentials Have Moved In Favor Of The Dollar At The Long End Of The Curve, But Not At The Short End (II)
On balance, while the dollar could strengthen a bit more over the next month or so, the greenback will weaken over a 12-month horizon. Chester Ntonifor, BCA’s chief currency strategist, expects the dollar to fall the most against the Norwegian krone, Swedish krona, Australian dollar, and British pound over a 12-month horizon. In the EM space, stronger global growth will disproportionately benefit the Mexican peso, Chilean peso, Colombian peso, South African rand, Czech koruna, Indonesian rupiah, Korean won, and Singapore dollar. Chart 37Weak Dollar Is Usually A Tailwind For Cyclicals, Non-US Stocks, And Value Stocks (I)
Weak Dollar Is Usually A Tailwind For Cyclicals, Non-US Stocks, And Value Stocks (I)
Weak Dollar Is Usually A Tailwind For Cyclicals, Non-US Stocks, And Value Stocks (I)
Chart 37Weak Dollar Is Usually A Tailwind For Cyclicals, Non-US Stocks, And Value Stocks (II)
Weak Dollar Is Usually A Tailwind For Cyclicals, Non-US Stocks, And Value Stocks (II)
Weak Dollar Is Usually A Tailwind For Cyclicals, Non-US Stocks, And Value Stocks (II)
Consistent with our equity views, a weaker dollar would be good news for cyclical equity sectors, non-US stock markets, and value stocks (Chart 37). E. Commodities Favorable Outlook For Commodities Strong global growth against a backdrop of tight supply should sustain momentum in the commodity complex over the next 12-to-18 months. Capital investment in the oil and gas sector has fallen by more than 50% since 2014 (Chart 38). BCA’s Commodity & Energy Strategy service, led by Robert Ryan, expects annual growth in crude oil demand to outstrip supply over the remainder of this year (Chart 39). Chart 38Oil & Gas Capex Collapses In COVID-19’s Wake
Second Quarter 2021 Strategy Outlook: Inflation Cometh?
Second Quarter 2021 Strategy Outlook: Inflation Cometh?
Chart 39Crude Oil Demand Growth To Outstrip Supply Over The Remainder Of This Year
Crude Oil Demand Growth To Outstrip Supply Over The Remainder Of This Year
Crude Oil Demand Growth To Outstrip Supply Over The Remainder Of This Year
A physical deficit in the metals markets – particularly for copper and aluminum – should also persist this year (Chart 40). While the boom in electric vehicle (EV) production represents a long-term threat to oil, it is manna from heaven for many metals. A battery-powered EV can contain more than 180 pounds of copper compared with 50 pounds for conventional autos. By 2030, the demand from EVs alone should amount to close to 4mm tonnes of copper per year, representing about 15% of annual copper production. Chart 40ACopper Will Be In Physical Deficit...
Copper Will Be In Physical Deficit...
Copper Will Be In Physical Deficit...
Chart 40B...As Will Aluminum
...As Will Aluminum
...As Will Aluminum
China’s Commodity Demand Will Remain Strong Chart 41China Keeps Buying More And More Commodities
China Keeps Buying More And More Commodities
China Keeps Buying More And More Commodities
Strong demand for metals from China should also buoy metals prices. While trend GDP growth in China has slowed, the economy is much bigger in absolute terms than it was in the 2000s. China’s annual aggregate consumption of metals is five times as high as it was back then. The incremental increase in China’s metal consumption, as measured by the volume of commodities consumed, is also double what it was 20 years ago (Chart 41). As we discussed in our report To Deleverage Its Economy, China Needs MORE Debt, the Chinese government has no choice but to continue to recycle persistently elevated household savings into commodity-intensive capital investment. This will ensure ample commodity demand from China for years to come. Peter Berezin Chief Global Strategist pberezin@bcaresearch.com Global Investment Strategy View Matrix
Second Quarter 2021 Strategy Outlook: Inflation Cometh?
Second Quarter 2021 Strategy Outlook: Inflation Cometh?
Special Trade Recommendations
Second Quarter 2021 Strategy Outlook: Inflation Cometh?
Second Quarter 2021 Strategy Outlook: Inflation Cometh?
Current MacroQuant Model Scores
Second Quarter 2021 Strategy Outlook: Inflation Cometh?
Second Quarter 2021 Strategy Outlook: Inflation Cometh?
Highlights Biden’s policy on China is hawkish so far, as expected, but temporary improvement is possible. We are cyclically bearish on the dollar but are taking a neutral tactical stance as the greenback’s bounce could go higher than expected if US-China relations take another downward dive. US-Iran tensions are on track to escalate in the second quarter as the pressure builds toward what we think will be a third quarter restoration of the 2015 nuclear deal. Oil price volatility is the takeaway. The anticipated US-Russia conflict has emerged and will bring negative surprises, especially for Russian and emerging European markets. Europe still enjoys relative political stability. A German election upset would bring upside risk to the euro and bund yields, while Scottish independence risk is contained for now. In this report we are launching the first in a new series of regular quarterly outlook reports that will supplement our annual Geopolitical Strategy strategic outlook. Feature The decline in global policy uncertainty and geopolitical risk that attended the US election and COVID-19 vaccine discovery has largely played out. Global investors have witnessed successful vaccine rollouts in the US and UK and can look forward to other countries, namely the EU-27, catching up. They have witnessed a splurge of US fiscal spending – $2.8 trillion since December – unprecedented in peacetime. And they have seen the Chinese government offer assurances that monetary tightening will not undermine the economic recovery. The risk of the US doubling down on belligerent trade protectionism has fallen by the wayside along with the Trump presidency. Going forward, there are signs that policy uncertainty and geopolitical risk will revive. First, as the global semiconductor shortage and Suez Canal blockage highlight, the world economy will sputter and strain at the sudden eruption of economic activity as the pandemic subsides and vast government spending takes effect. Financial instability is a likely consequence of the sudden, simultaneous adoption of debt monetization across a range of economies combined with a global high-tech race and energy overhaul. Second, the defeat of the Trump presidency does not reverse the secular increase in geopolitical tensions arising from America’s internal divisions and weakening hand relative to China, Russia, and others. On the contrary, large monetary and fiscal stimulus lowers the economic costs of conflict and encourages autarkic, self-sufficiency policies that make governments more likely to struggle with each other to secure their supply chains. Chart 1AThe Return Of Geopolitical Risk
The Return Of Geopolitical Risk
The Return Of Geopolitical Risk
Chart 1BThe Return Of Geopolitical Risk
The Return Of Geopolitical Risk
The Return Of Geopolitical Risk
If we look at simple, crude measures of geopolitical risk we can see the market awakening to the new wall of worry for this business cycle – Great Power struggle, the persistence of “America First” with a different figurehead, China policy tightening, and a vacuum of European leadership. The US dollar is rising, developed market equities are outperforming emerging markets, safe-haven currencies are ticking up against commodity currencies, and gold is perking back up (Charts 1A & 1B). The cyclical upswing should reverse most of these trends over the medium term but investors should be cautious in the short term. US Stimulus, Chinese Tightening, And The Greenback The US remains the world’s preponderant power despite its political dysfunction and economic decline relative to emerging markets. The US has struggled to formulate a coherent way to deal with declining influence, as shown by dramatic policy reversals toward Iraq, Iran, China, and Russia. The pattern of unpredictability will continue. The Biden administration’s longevity is unknown so foreign states will be cautious of making firm commitments, implementing deals, or taking irrevocable actions. This does not mean the Biden administration will have a small impact – far from it. Biden’s national policy seeks to fire up the American economy, refurbish alliances, export liberal democratic ideology, and compete with China and Russia. The firing up is largely already accomplished – the American Rescue Plan Act (ARPA) and Biden’s forthcoming “Build Back Better” proposals will ultimately rank with Johnson’s Great Society. The Fed estimates that US GDP growth will hit 6.5% this year, higher than the consensus of economic forecasts estimates 5.5%, driven by giant government pump-priming (Chart 2). The US, which is already an insulated economy, is virtually inured to foreign shocks for the time being. Chart 2US Injects Steroids
Second Quarter Outlook 2021: Geopolitics Upsets The "Return To Normalcy"
Second Quarter Outlook 2021: Geopolitics Upsets The "Return To Normalcy"
Next comes the courting of allies to form a united democratic front against the world’s ambitious dictatorships. This process will be very difficult as the allies are averse to taking risks, especially on behalf of an erratic America. Chart 3US Stimulus Briefly Halts Decline In Global Economic Share
Second Quarter Outlook 2021: Geopolitics Upsets The "Return To Normalcy"
Second Quarter Outlook 2021: Geopolitics Upsets The "Return To Normalcy"
The Obama administration spent six full years creating a coalition to pressure an economically miniscule Iran into signing the 2015 nuclear deal. Imagine how long it will take Biden to convince the EU-27 and small Asian states to stick their necks out against Xi Jinping’s China. Especially if they suspect that the US’s purpose is to force China to open its doors primarily for the Americans. If the US grows at the rate of consensus forecasts then its share of global GDP will be 17.6% by 2025 (Chart 3). However, the US’s decline should not be exaggerated. Consider the lesson of the past year, in which the US seemed to flounder in the face of the pandemic. The US’s death count, on a population basis, was in line with other developed markets and yet its citizens exercised a greater degree of individual freedom. It maintained the rule of law despite extreme polarization, social unrest, and a controversial election. Its development of mRNA vaccines highlighted its ongoing innovation edge. And it has rolled out the vaccines rapidly. Internal divisions are still extreme and likely to produce social instability (we are still in the zone of “peak polarization”). But the US economic foundation is now fundamentally supported – political collapse is improbable. Chart 4US Vs China: The Stimulus Impulse
US Vs China: The Stimulus Impulse
US Vs China: The Stimulus Impulse
In short, the US saw the “Civil War Lite” and has moved onto “Reconstruction Lite,” with a big expansion of the social safety net and infrastructure as well as taxes already being drafted. Meanwhile General Secretary Xi has managed to steer China into a good position for the much-ballyhooed 100th anniversary of the Communist Party on July 1. His administration is tightening monetary and fiscal policy marginally to resume the fight against systemic financial risk. China faces vast socioeconomic imbalances that, if left unattended, could eventually overturn the Communist Party’s rule. So far the tightening of policy is modest but the risk of a policy mistake is non-negligible and something global financial markets will have to grapple with in the second quarter. Comparing the US and China reveals an impending divergence in relative monetary and fiscal stimulus (Chart 4). China’s money and credit impulse is peaking – some signs of economic deceleration are popping up – even as the US lets loose a deluge of liquidity and pump-priming. The result is that the world is likely to experience waning Chinese demand and waxing US demand in the second half of the year. It is almost the mirror image of 2009-10, when China’s economy skyrocketed on a stimulus splurge while the US recovered more slowly with less policy support. The medium-to-long-run implication is that the US will have a bumpy downhill ride over the coming decade whereas China will recover more smoothly. Yet the analogy only goes so far. The structural transition facing China’s society and economy is severe and US-led international pressure on its economy will make it more severe. The short-run implication – for Q2 2021 – is that the US dollar’s bounce could run longer than consensus expects. Commodity prices, commodity currencies, and emerging market assets face a correction from very toppy levels. The global cyclical upswing will continue as long as China avoids a policy mistake of overtightening as we expect but the near-term is fraught with downside risk. Bottom Line: We are neutral on the dollar from a tactical point of view. While our bias is to expect the dollar to relapse, in line with the BCA House View and our Foreign Exchange Strategy, we are loathe to bet against the greenback given US stimulus and Chinese tightening. This is not to mention geopolitical tensions highlighted below that would reinforce the dollar. Biden’s China Policy And The Semiconductor Shortage Any spike in US-China strategic tensions in Q2 would exacerbate the above reasoning on the dollar. It would also lead to a deeper selloff in Chinese and EM Asian currencies and risk assets. A spike in tensions is not guaranteed but investors should plan for the worst. One of our core views for many years has been that any Democratic administration taking office in 2020 would remain hawkish on China, albeit less so than the Trump administration. So far this view is holding up. It may not have been the cause of the drop in Chinese and emerging Asian equities but it has not helped. However, the jury is still out on Biden’s China policy and the second quarter will likely see major actions that crystallize the relative hawkish or dovish change in policy. The acrimonious US-China meeting in Alaska meeting does not necessarily mean anything. The Biden administration has a full China policy review underway that will not be completed until around early June. The first bilateral summit between Biden and Xi could occur on Earth Day, April 22, or sometime thereafter, as the countries are looking to restart strategic dialogue and engage on nuclear non-proliferation and carbon emission reductions. Specifically China wants to swap its help on North Korea – which restarted ballistic missile launches as we go to press – for easier US policies on trade and tech. Only if and when a new attempt at engagement breaks down will the Biden administration conclude that it has a basis for pursuing a more offensive policy toward China. The problem is that new engagement probably will break down, sooner or later, for reasons we outlined last week: the areas of cooperation are limited – obviously so on health and cybersecurity, but even on climate change. Engagement on Iran and North Korea may have more success but the bigger conflicts over tech and Taiwan will persist. Ultimately China is fixated on strategic self-sufficiency and rapid tech acquisition in the national interest, leaving little room for US market access or removal of high-tech export controls. The threat that Biden will ultimately adopt and expand on Trump’s punitive measures will hang over Beijing’s head. The risk of a Republican victory in 2024 will also discourage China from implementing any deep structural concessions. The crux of the conflict remains the tech sector and specifically semiconductors.1 China is rapidly gaining market share but the US is using its immense leverage over chip design and equipment to cut off China’s access to chips and industry development. The ongoing threat of an American chip blockade is now being exacerbated by a global shortage of semiconductors as the economy recovers (Chart 5), exposing China’s long-term economic vulnerability. Chart 5Global Semiconductor Shortage
Global Semiconductor Shortage
Global Semiconductor Shortage
There is room for some de-escalation but not much – and it is not to be counted on. The Biden administration, like the Obama administration, subscribes to the view that the US should prioritize maintaining its lead in tech innovation rather than trying to compete with China’s high-subsidy model, which is gobbling up the lower end of the computer chip market. Biden’s policy will at first be defensive rather than offensive – focused on improving US supply chain security rather than curtailing Chinese supply. Biden’s proposal for domestic infrastructure program will include funds for the semiconductor industry and research. While the Biden administration likely prizes leadership and innovation over the on-shoring of US chip production, the US government must also look to supply security, specifically for the military, so some on-shoring of production is inevitable.2 Ultimately the Biden administration can continue using export controls to slow China’s semiconductor development or it can pare these controls back. If it does nothing then China’s state-backed tech program will lead to a rapid increase in Chinese capabilities and market share as has occurred in other industries. If it maintains restrictions then it will delay China’s development, especially on the highest end of chips, but not prevent China from gaining the technology through circumventing export controls, subsidizing its domestic industry, and poaching from Taiwan and South Korea. Given that technological supremacy will lead to military supremacy the US is likely to maintain restrictions. But a full chip blockade on China would require expanding controls and enforcing them on third parties, and massively increases strategic tensions, should Biden ever decide to go this ultra-hawkish route. The Biden administration can adjust the pace and intensity of export controls but cannot give China free rein. Biden will want to block China’s access to the US market, or funds, or parts when these feed its military-industrial complex but relax pressure on China’s commercial trade. This is only a temporary fix. The commercial/military distinction is hard to draw when Beijing continually pursues “civil-military fusion” to maximize its industrial and strategic capabilities. Therefore US-China strategic tensions over tech will worsen over the long run even if Biden pursues engagement in the short run. Bottom Line: Biden’s China policy has started out hawkish as expected but the real policy remains unknown. The second quarter will reveal key details. Biden could pursue engagement, leading to a reduction in tensions. Investors should wait and see rather than bet on de-escalation, given that tensions will escalate anew over the medium and long term and therefore may never really decline. Iran And Oil Price Volatility Biden’s other foreign policy challenges in the second quarter hinge on Iran and Russia. The Biden administration aims to restore the 2015 Iranian nuclear deal and is likely to move quickly. This is not merely a matter of intention but of national capability since US grand strategy is pushing the US to shift focus to Asia Pacific, and an Iranian nuclear crisis divides US attention and resources. Biden has the ability to return to the 2015 deal with a flick of his wrist. The Iranians also have that ability, at least until lame duck President Hassan Rouhani leaves office in August – beyond that, a much longer negotiation would be necessary. US-Iran talks will lead to demonstrations of credible military threats, which means that geopolitical attacks and tensions in the Middle East will likely go higher before they fall on any deal. The past several years have already seen a series of displays of military force by the Iranians and the US and its allies and this process may escalate all summer (Map 1). Map 1Military Incidents In Persian Gulf Since Abqaiq Refinery Attack, 2019
Second Quarter Outlook 2021: Geopolitics Upsets The "Return To Normalcy"
Second Quarter Outlook 2021: Geopolitics Upsets The "Return To Normalcy"
It is too soon to draw conclusions regarding the Israeli election on March 23 but it is possible that Prime Minister Benjamin Netanyahu will remain in power (Chart 6). If this is the case then Israel will oppose the American effort to rejoin the Iranian nuclear deal, culminating in a crisis sometime in the summer (or fall) in which the Israelis make a major show of force against Iran. Even if Netanyahu falls from power, the new Israeli government will still have to show Iran that it cannot be pushed around. Fundamentally, however, a change in leadership in Israel would bring the US and Israel into alignment and thus smooth the process for a deal that seeks to contain Iran’s nuclear program at least through 2025. Any better deal would require an entirely new diplomatic effort. Chart 6Israeli Ruling Coalition Share Of Knesset Shares In Recent Elections
Second Quarter Outlook 2021: Geopolitics Upsets The "Return To Normalcy"
Second Quarter Outlook 2021: Geopolitics Upsets The "Return To Normalcy"
The Russians or Saudi Arabians might reduce their oil production discipline once a deal becomes inevitable, so as not to lose market share to Iranian oil that will come back onto global markets. Thus oil markets could face unexpected oil supply outages due to conflict followed by OPEC or Iranian supply increases, implying that prices will be volatile. Our Commodity & Energy Strategy expects prices to average $65/barrel in 2021, $70/barrel in 2022, and $60-$80/barrel through 2025. Bottom Line: Oil prices will be volatile in the second quarter as they may be affected by the twists and turns of US-Iran negotiations, which may not reach a new equilibrium until July or August at earliest. Otherwise a multi-year diplomatic process will be required, which will suck away the Biden administration’s foreign policy capital, resulting either in precipitous reduction in Middle East focus or a neglect of greater long-term challenges from China and Russia. Russian Risks, Germany Elections, And Scottish Independence European politics are more stable than elsewhere in the world – marked by Italy’s sudden formation of a technocratic unity government under Prime Minister Mario Draghi. Draghi is focused on using EU recovery funds to boost Italian productivity and growth. Europe’s economic growth has underperformed that of the US so far this year. The EU is not witnessing the same degree of fiscal stimulus as the US (Chart 7). The core member states all face a fiscal drag in the coming two years and meanwhile the bloc has struggled to roll out COVID-19 vaccines efficiently. However, the vaccines are proven to be effective and will eventually be rolled out, so investors should buy into the discount in the euro and European stocks as a result of the various mishaps. Global and European industrial production and economic sentiment are bouncing back and German yields are rising albeit not as rapidly as American (Chart 8). Chart 7EU Stimulus Lags But Targets Productivity
Second Quarter Outlook 2021: Geopolitics Upsets The "Return To Normalcy"
Second Quarter Outlook 2021: Geopolitics Upsets The "Return To Normalcy"
Chart 8Global And Euro Area Production To Accelerate
Global And Euro Area Production To Accelerate
Global And Euro Area Production To Accelerate
Chart 9German Conservatives Waver in Polls
German Conservatives Waver in Polls
German Conservatives Waver in Polls
The main exceptions to Europe’s relative political stability come from Germany and Scotland. German Chancellor Angela Merkel is a lame duck and her party is falling in opinion polls with only six months to go before the general election on September 26 (Chart 9). Merkel even faced the threat of a no-confidence motion in the Bundestag this week due to her attempt to extend COVID lockdowns over Easter and sudden retreat in the face of a public backlash. Merkel apologized but her party is looking extremely shaky after recent election losses on the state level. The rise of a new left-wing German governing coalition is much more likely than the market expects. The second quarter will see the selection of a chancellor-candidate for her Christian Democratic Union and its Bavarian sister party the Christian Social Union. Table 1 highlights the likeliest chancellor-candidates of all the parties and their policy stances, from the point of view of whether they have a “hawkish,” hard-line policy stance or “dovish,” easy policy stance on the major issues. What stands out is that the entire German political spectrum is now effectively centrist or dovish on monetary and fiscal policy following the lessons of the 13 years since the global financial crisis. Table 1German Chancellor Candidates, 2021
Second Quarter Outlook 2021: Geopolitics Upsets The "Return To Normalcy"
Second Quarter Outlook 2021: Geopolitics Upsets The "Return To Normalcy"
In other words, while Germany’s conservatives will seek an earlier normalization of policy in the wake of the crisis, none of them are as hawkish as in the past, and an election upset would bring even more dovish leaders into power. Thus the German election is a political risk but not a global market risk. It should not fundamentally alter the trajectory of German equities or bond yields – which is up amid global and European recovery – and if anything it would boost the euro. The potential German chancellor candidates show more variation when it comes to immigration, the environment, and foreign policy. Germany has been leading the charge for renewable energy and will continue on that trajectory (Chart 10). However it has simultaneously pursued the NordStream II natural gas pipeline with Russia, which would bring 55 billion cubic meters of natural gas straight into Germany, bypassing eastern Europe and its fraught geopolitics. This pipeline, which could be completed as early as August, would improve Germany’s energy security and Russia’s economic security, which remain closely intertwined despite animosity in other areas (Chart 11). But the pipeline would come at the expense of eastern Europe’s leverage – and American interests – and therefore opposition is rising, including among the ascendant German Green Party. Chart 10Germany’s Switch To Renewables
Second Quarter Outlook 2021: Geopolitics Upsets The "Return To Normalcy"
Second Quarter Outlook 2021: Geopolitics Upsets The "Return To Normalcy"
Chart 11Germany Puts Multilateralism To The Test
Second Quarter Outlook 2021: Geopolitics Upsets The "Return To Normalcy"
Second Quarter Outlook 2021: Geopolitics Upsets The "Return To Normalcy"
Chart 12UK-EU Trade Deal Dampens Scots Nationalism
UK-EU Trade Deal Dampens Scots Nationalism
UK-EU Trade Deal Dampens Scots Nationalism
While Merkel and the Christian Democrats are dead-set on completing the pipeline, global investors are underrating the possibility of a major incident in which the US uses diplomacy and sanctions to halt the project. This is not intuitive because Biden is focused on restoring the US alliance with Europe, particularly Germany. But he is doing so in order to counter Russian and Chinese authoritarianism. Therefore the pipeline could mark the first real test of Biden’s – and Germany’s – understanding of multilateralism. Importantly the US is not pursuing a diplomatic “reset” with Russia at the outset of Biden’s term. This has now been confirmed with Biden’s accusation that Russian President Vladimir Putin is a “killer” and the ensuing, highly symbolic Russian withdrawal of its ambassador to the United States, unseen even in the Cold War. The Americans are imposing sanctions in retaliation for Russia’s alleged interference in the 2016 and 2020 elections. Russia is largely inured to US sanctions at this point but if the US wanted to make a difference it would insist on a stop to NordStream by cutting off access to the US market to the various European engineering and insurance companies critical to construction.3 Yet German leaders would have to be cajoled and it may be more realistic for the US to demand other concessions from Germany, particularly on countering China. The US-German arrangement will go a long way toward defining Germany’s and the EU’s risk appetite in the context of Biden’s proposal to build a more robust democratic alliance to counter revisionist authoritarian states. The Russians say they want to avoid a permanent deterioration in relations with the US, which they warn is on the verge of occurring. There is some space for engagement, such as on restoring the Iran deal, which Russia ostensibly supports. Biden may want to keep Russia pacified until he has an Iranian deal in hand. Ultimately, however, US-Russian relations are headed to new lows as the Biden administration brings counter-pressure on the Russians in retribution for the past decade of actions to undermine the United States. Germany’s place in this conflict will determine its own level of geopolitical risk. Clearly we would favor German assets over those of emerging Europe or Russian in this environment. One final risk from Europe is worth mentioning for the second quarter: the UK and Scotland. Scottish elections on May 6 could enable the Scottish National Party to push for a second independence referendum. So far our assessment is correct that Scottish independence will lose momentum after Prime Minister Boris Johnson’s post-Brexit trade deal with the European Union. Scottish nationalists are falling (Chart 12) and support for independence has dropped back toward the 45% level where the 2014 referendum ended up. Nevertheless elections can bring surprises and this narrative bears vigilance as a threat to the pound’s sharp rebound. Bottom Line: Europe’s relative political stability is challenged by US-Russia geopolitical tensions, the higher-than-expected risk of a German election upset, and the tail risk of Scottish independence. Of these only a US-Russia blowup, over NordStream or other issues, poses a major downside risk to global investors. We continue to underweight EM Europe and Russian currency and financial assets. Investment Takeaways Our three key views for 2021, in addition to coordinated monetary and fiscal stimulus, are largely on track for the year so far: China’s Headwinds: China’s renminbi and stock market are indeed suffering due to policy tightening and US geopolitical pressure. Risk to our view: if Biden and Xi make major compromises to reengage, and Xi eases monetary and fiscal policy anew, then the global reflation trade and Chinese equities will receive another boost. US-Iran Triggered Oil Volatility: The US and Iran are still in stalemate and the window of opportunity for a quick restoration of the 2015 deal is rapidly narrowing. Tensions are indeed escalating prior to any resolution, which would come in the third quarter, thus producing first upside then downside pressures for oil prices. Risk to our view: the Biden administration has no need for a new Iran deal and tensions escalate in a major way that causes a major risk premium in oil prices and forces the US to downgrade its pressure campaign against China. Europe’s Outperformance: So far this year the dollar has rallied and the EU has botched its vaccine rollout, challenging our optimistic assessment of Europe. But as highlighted in this report, we anticipated the main risks – government change in Germany, a Scots referendum – and the former is positive for the euro while the downside risk to the pound is contained. The major geopolitical problem is Russia, where we always expected substantial market-negative risks to materialize after Biden’s election. Risk to our view: A US-Russian reset that lowers geopolitical tensions across eastern Europe or a German status quo election followed by a tightening of fiscal policy sooner than the market expects. Matt Gertken Vice President Geopolitical Strategy mattg@bcaresearch.com Footnotes 1 For an excellent recent review of the issues see Danny Crichton, Chris Miller, and Jordan Schneider, "Labs Over Fabs: How The U.S. Should Invest In The Future Of Semiconductors," Foreign Policy Research Institute, March 2021, issuu.com. 2 Alex Fang, "US Congress pushes $100bn research blitz to outcompete China," Nikkei Asia, March 23, 2021, asia.nikkei.com. In anticipation of the Biden administration’s dual attempt to promote, on one hand, innovation, and on the other hand, semiconductor supply security, the US semiconductor giant Intel has announced that it will build a $20 billion chip fabrication plant in Arizona. This is in addition to TSMC’s plans to build a plant in Arizona manufacturing chips that are necessary for the US Air Force’s F-35 jets. See Kif Leswing, "Intel is spending $20 billion to build two new chip plants in Arizona," CNBC, March 23, 2021, cnbc.com. 3 See Margarita Assenova, "Clouds Darkening Over Nord Stream Two Pipeline," Eurasia Daily Monitor 18:17 (2021), Jamestown Foundation, February 1, 2021, Jamestown.org. Appendix: GeoRisk Indicator China
China: GeoRisk Indicator
China: GeoRisk Indicator
Russia
Russia: GeoRisk Indicator
Russia: GeoRisk Indicator
UK
UK: GeoRisk Indicator
UK: GeoRisk Indicator
Germany
Germany: GeoRisk Indicator
Germany: GeoRisk Indicator
France
France: GeoRisk Indicator
France: GeoRisk Indicator
Italy
Italy: GeoRisk Indicator
Italy: GeoRisk Indicator
Canada
Canada: GeoRisk Indicator
Canada: GeoRisk Indicator
Spain
Spain: GeoRisk Indicator
Spain: GeoRisk Indicator
Taiwan
Taiwan: GeoRisk Indicator
Taiwan: GeoRisk Indicator
Korea
Korea: GeoRisk Indicator
Korea: GeoRisk Indicator
Turkey
Turkey: GeoRisk Indicator
Turkey: GeoRisk Indicator
Brazil
Brazil: GeoRisk Indicator
Brazil: GeoRisk Indicator
Section III: Geopolitical Calendar
Highlights Fiscal stimulus is no longer a free lunch. US mortgage applications are down by 20 percent since the start of February. With rising bond yields now starting to choke private sector borrowing, bond yields are nearing an upper-limit, and even a reversal point. In which case, the tide out of defensives into cyclicals, and growth into value, will be a tide that reverses. New 6-month recommendation: underweight US banks (XLF) versus consumer staples (XLP). Fractal trade shortlist: US banks, bitcoin, ether, and GBP/JPY. Feature Chart of the WeekMortgage Applications Are Down 20 Percent
Mortgage Applications Are Down 20 Percent
Mortgage Applications Are Down 20 Percent
Why would anybody not get excited about trillions of dollars of fiscal stimulus? The two word answer is: crowding out. If a dollar that is borrowed and spent by the government (or even forecast to be borrowed and spent by the government) pushes up the bond yield, it makes it more expensive for the private sector to borrow and spend. If, as a result, the private sector scales back its borrowing by a dollar, the dollar of government spending has crowded out a dollar of private sector spending. In this case, fiscal stimulus will have no impact on GDP. The fiscal multiplier will be zero. Under some circumstances though, fiscal stimulus does not crowd out the private sector and the fiscal multiplier is extremely high. 2020 was the perfect case in point. As the pandemic gripped the world, much of the private sector was on its knees. Or to be more precise, in lockdown at home, doing nothing, receiving no income, and unwilling and unable to borrow. In such a crisis, the government became the ‘borrower of last resort’. It could, and had to, borrow at will to replace the private sector’s lost income and thereby to stabilise the collapse in demand. With no competition from private sector borrowers for the glut of excess savings, bond yields stayed depressed. Meaning that fiscal stimulus was a free lunch: it had lots of benefit with little cost (Chart I-2). Chart I-2Fiscal Stimulus Was A Free Lunch In 2020, But Not In 2021
Fiscal Stimulus Was A Free Lunch In 2020, But Not In 2021
Fiscal Stimulus Was A Free Lunch In 2020, But Not In 2021
Fiscal Stimulus Is No Longer A Free Lunch Covid-19 is still with us, and could be with us forever. Yet the economy will adapt and even thrive with structural changes, such as decentralisation, hybrid office/home working, a shift to online shopping, and less international travel. In fact, all these structural changes were underway long before Covid-19. Meaning that the pandemic was the accelerant rather than the cause of what was happening to the economy anyway. As the private sector now gets back on its feet to restructure, spend, and invest accordingly, fiscal stimulus is no longer a free lunch. Fiscal stimulus is most effective when it is not pushing up the bond yield. To repeat, last year’s massive fiscal stimulus was highly effective because it had little impact on the bond yield, so there was no crowding out of private sector borrowing. The markets have fully priced the 2021 stimulus, but not the crowding out. However, the most recent stimulus package has pushed up the bond yield or, at least, is a major culprit for the recent spike in yields. Hence, there will be some crowding out of private sector borrowing. Worryingly, US mortgage applications, for both purchasing and refinancing, are down by 20 percent since the start of February (Chart of the Week and Chart I-3). Chart I-3Mortgage Applications For Refi Are Down 20 Percent
Mortgage Applications For Refi Are Down 20 Percent
Mortgage Applications For Refi Are Down 20 Percent
The resulting choke on private sector borrowing and investment will at least partly negate any putative boost from this fiscal stimulus. The concern is that the markets have fully priced the stimulus, but not the crowding out. Time To Rotate Back In our February 18 report, The Rational Bubble Is Turning Irrational, we warned that high-flying tech stocks were at a point of vulnerability. Specifically, since 2009, the technology sector earnings yield had always maintained a minimum 2.5 percent premium over the 10-year T-bond yield, defining the envelope of a ‘rational bubble.’ In February, this envelope was breached, indicating that tech stock valuations were in a new and irrational phase (Chart I-4). Chart I-4The Rational Bubble Turned Irrational
The Rational Bubble Turned Irrational
The Rational Bubble Turned Irrational
The warning proved to be prescient. In the second half of February, tech stocks did sell off sharply and entered a technical correction.1 As a result, tech-dominated stock markets such as China and the Netherlands also suffered sharp declines. Proving once again that regional and country stock market performance is nothing more than an extension of sector performance (Chart I-5). Chart I-5As Tech Corrected, So Did Tech-Heavy Markets
As Tech Corrected, So Did Tech-Heavy Markets
As Tech Corrected, So Did Tech-Heavy Markets
But the aggregate stock market has remained more resilient than we expected, and is only modestly down versus its mid-February peak. The reason is that while highly-valued growth stocks suffered the anticipated correction, value stocks continued to advance (Chart I-6). Chart I-6Time To Rotate Back
Time To Rotate Back
Time To Rotate Back
We can explain this divergence in terms of the three components of stock market valuation: The bond yield. The additional return or ‘risk premium’ for owning stocks. The expected growth of earnings. Tech and other growth stocks are ‘long-duration’ assets meaning that their earnings are weighted into the distant future. Hence, for growth stocks the relevant valuation comparison is a long-duration bond yield, say the 10-year yield. Whereas for ‘shorter-duration’ value stocks the relevant valuation comparison is a shorter-duration bond yield, say the 2-year yield. Given that the 10-year yield has risen much more than the 2-year yield, the pain has been much more pronounced for growth stock valuations. Turning to the ‘risk premium’ for owning stocks, at ultra-low bond yields the risk premium just moves in tandem with the bond yield. Hence, as the 10-year yield has spiked, the combination of a rising yield plus a rising risk premium has doubled the pain for growth stock valuations. For a detailed explanation of this dynamic please see our February 18 report. Regarding the expected growth of earnings, the market believes that stimulus is much more beneficial for economically sensitive value stocks than for economically insensitive growth stocks. But now that we are at the point where rising bond yields are starting to choke private demand, the rise in bond yields is nearing a limit, and even a reversal point. In which case, the strong tide out of defensives into cyclicals will also be a tide that reverses. On this basis, and supported by the strong technical arguments in the next section, we are opening a new 6-month position: Underweight US banks versus US consumer staples, expressed as underweight XLF versus XLP. US Banks, Bitcoin, Ether, And The Pound This week we have identified susceptibilities to countertrend moves in three areas. The bullish groupthink in US banks is at an extreme. First, based on its fragile fractal structure, the (bullish) groupthink in US banks versus consumer staples is at an extreme approaching February 2016 (bearish), December 2016 (bullish), and March 2020 (bearish). All these previous extremes in fragility proved to be turning points in relative performance. If this proves true again, the next six months could see a reversal of US bank outperformance (Chart I-7). Chart I-7The Groupthink In US Banks Is At An Extreme
The Groupthink In US Banks Is At An Extreme
The Groupthink In US Banks Is At An Extreme
Second, we are extremely bullish on the structural prospects for cryptocurrencies, and are preparing a report detailing the compelling investment case. Look out for it. That said, the composite fractal structures of both bitcoin and ethereum indicate that they are technically very overbought (Chart I-8 and Chart I-9). Accordingly, we are hoping for pullbacks that provide better strategic entry points for bitcoin at $40,000, and for ethereum at $1300. Chart I-8Bitcoin Is Technically Overbought
Bitcoin Is Technically Overbought
Bitcoin Is Technically Overbought
Chart I-9Ethereum Is Technically Overbought
Ethereum Is Technically Overbought
Ethereum Is Technically Overbought
Third, the UK’s Covid-19 vaccination program was one of the fastest out of the blocks. As the vaccination rate quickly rose to over half the adult population (based on at least one vaccination dose), the pound was a major beneficiary. But now, the UK vaccination program is facing the hurdle of reduced supplies. Additionally, there is the danger that the third wave of infections in Continental Europe washes onto the shores of Britain. Hence, the recent strong rally in the pound is susceptible to a countertrend reversal (Chart 10). This week’s recommended trade is short GBP/JPY setting the profit target and symmetrical stop-loss at 2.2 percent. Chart I-10The Pound Is Susceptible To A Reversal
The Pound Is Susceptible To A Reversal
The Pound Is Susceptible To A Reversal
Dhaval Joshi Chief Strategist dhaval@bcaresearch.com Footnotes 1 A technical correction is defined as a 10 percent price decline. Fractal Trading System
Fiscal Stimulus Is Hurting
Fiscal Stimulus Is Hurting
Structural Recommendations
Fiscal Stimulus Is Hurting
Fiscal Stimulus Is Hurting
Closed Fractal Trades
Fiscal Stimulus Is Hurting
Fiscal Stimulus Is Hurting
Fiscal Stimulus Is Hurting
Fiscal Stimulus Is Hurting
Fiscal Stimulus Is Hurting
Fiscal Stimulus Is Hurting
Asset Performance
Fiscal Stimulus Is Hurting
Fiscal Stimulus Is Hurting
Equity Market Performance
Fiscal Stimulus Is Hurting
Fiscal Stimulus Is Hurting
Indicators Bond Yields Chart II-1Euro Area
Indicators To Watch - Bond Yields - Euro Area
Indicators To Watch - Bond Yields - Euro Area
Chart II-2Europe Ex Euro Area
Indicators To Watch - Bond Yields - Europe Ex Euro Area
Indicators To Watch - Bond Yields - Europe Ex Euro Area
Chart II-3Asia
Indicators To Watch - Bond Yields - Asia
Indicators To Watch - Bond Yields - Asia
Chart II-4Other Developed
Indicators To Watch - Bond Yields - Other Developed
Indicators To Watch - Bond Yields - Other Developed
Interest Rate Chart II-5Expectations
Indicators To Watch - Interest Rate Expectations
Indicators To Watch - Interest Rate Expectations
Chart II-6Expectations
Indicators To Watch - Interest Rate Expectations
Indicators To Watch - Interest Rate Expectations
Chart II-7Expectations
Indicators To Watch - Interest Rate Expectations
Indicators To Watch - Interest Rate Expectations
Chart II-8Expectations
Indicators To Watch - Interest Rate Expectations
Indicators To Watch - Interest Rate Expectations
Beware The Greenback's Coiled Spring Potential
Beware The Greenback's Coiled Spring Potential
The mighty USA remains the world’s growth locomotive that tugs the global economy higher. In fact, in a recent Strategy Report we highlighted how US growth expectations outpace the EMU (see Chart 17 here) by a hefty margin. Even the Fed has now thrown in the towel and expects 6.5% real GDP growth for calendar 2021. Such dominance also comes at a small cost as foreigners begin to accumulate US financial assets that, at the margin, drains US dollar-based liquidity. Similarly, chip and other shortages the world over along with transportation bottlenecks also slow down global trade that in turn further mops up USD liquidity. The knock-on effect of an appreciating US dollar is well-known: it effectively tightens global monetary conditions. In more detail, it deals a blow to emerging markets (EM) especially twin deficit countries, and also eats into 40% of SPX sales that are foreign sourced. As a reminder, we recently downgraded the cyclicals/defensives portfolio tilt from overweight to neutral in anticipation of EM-driven headwinds in general, and China’s looming slowdown in particular. Bottom Line: Near-term caution is warranted, and we reiterate our recent downside protection trigger, where our portfolio went long June VIX futures as a hedge.
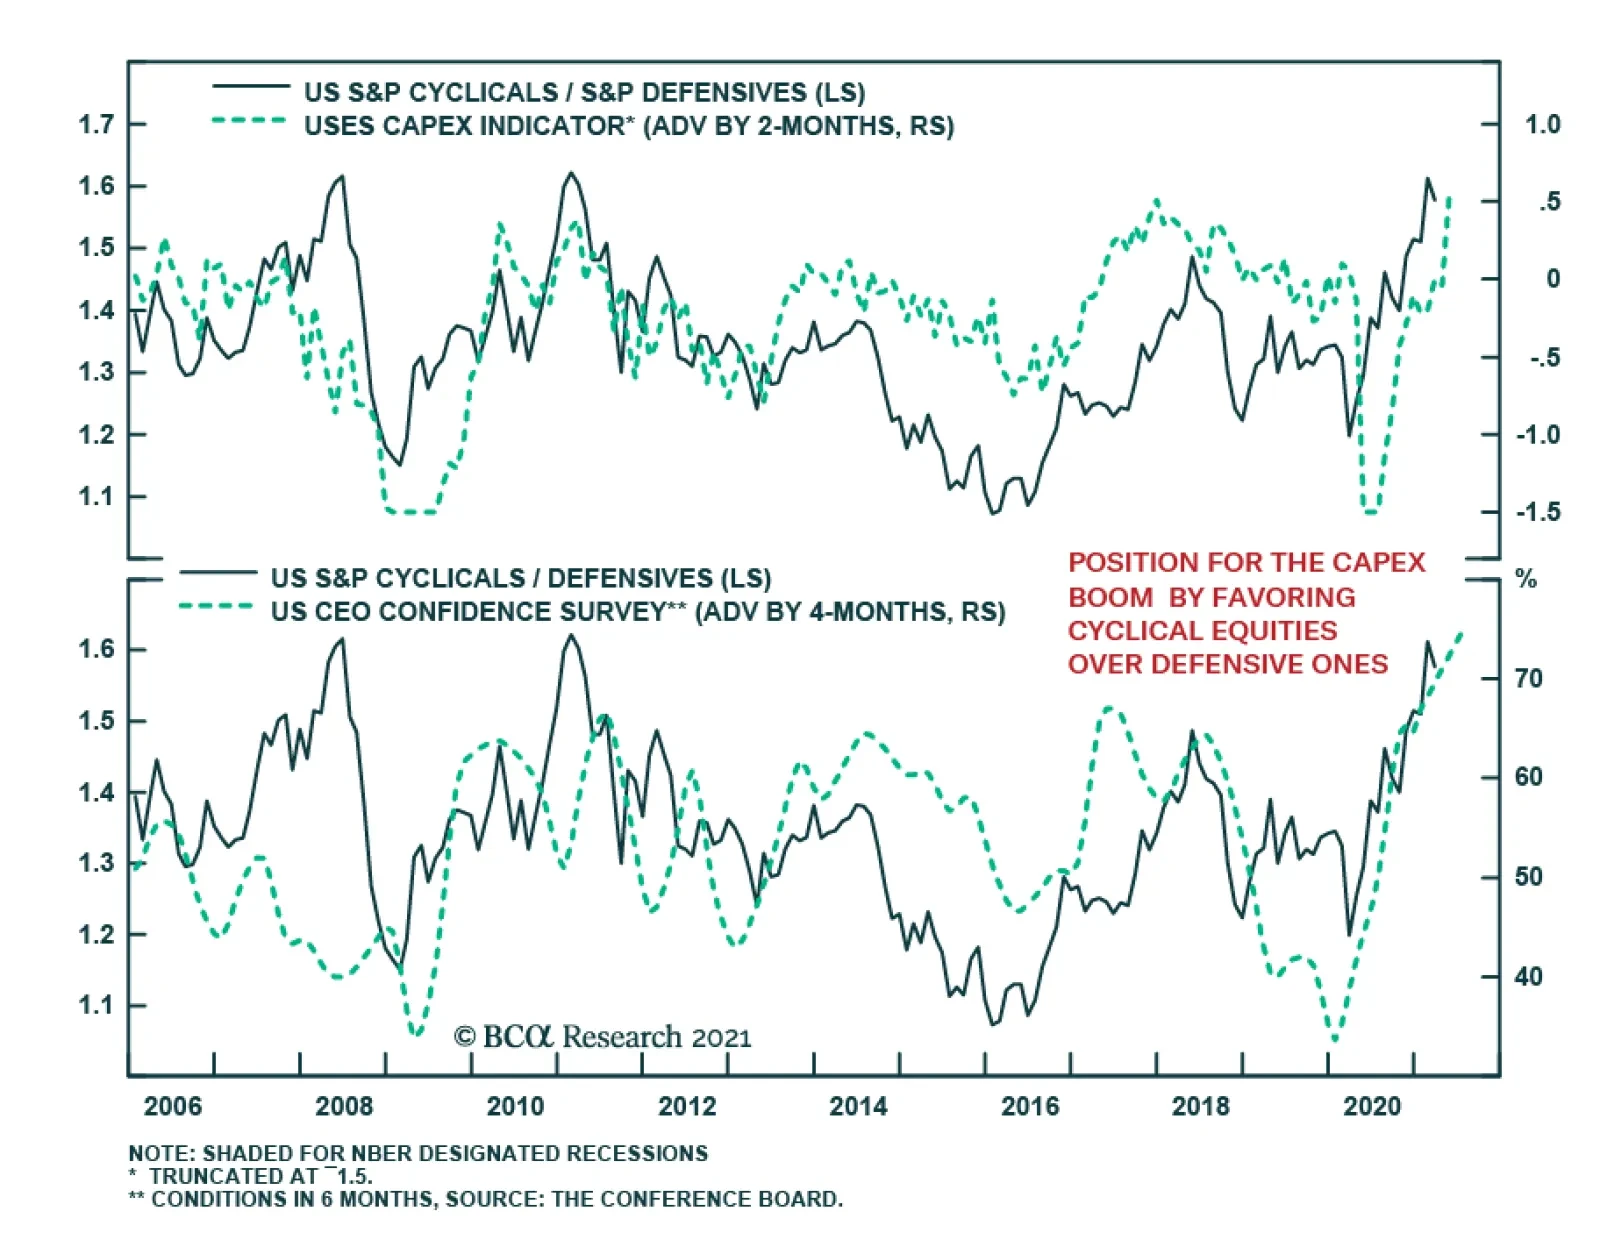
On Tuesday, Intel unveiled a massive manufacturing expansion plan, including a $20 billion investment towards two new semiconductor fabrication facilities in Arizona. Does this massive outlay reflects an idiosyncratic response to the global chip shortage or…
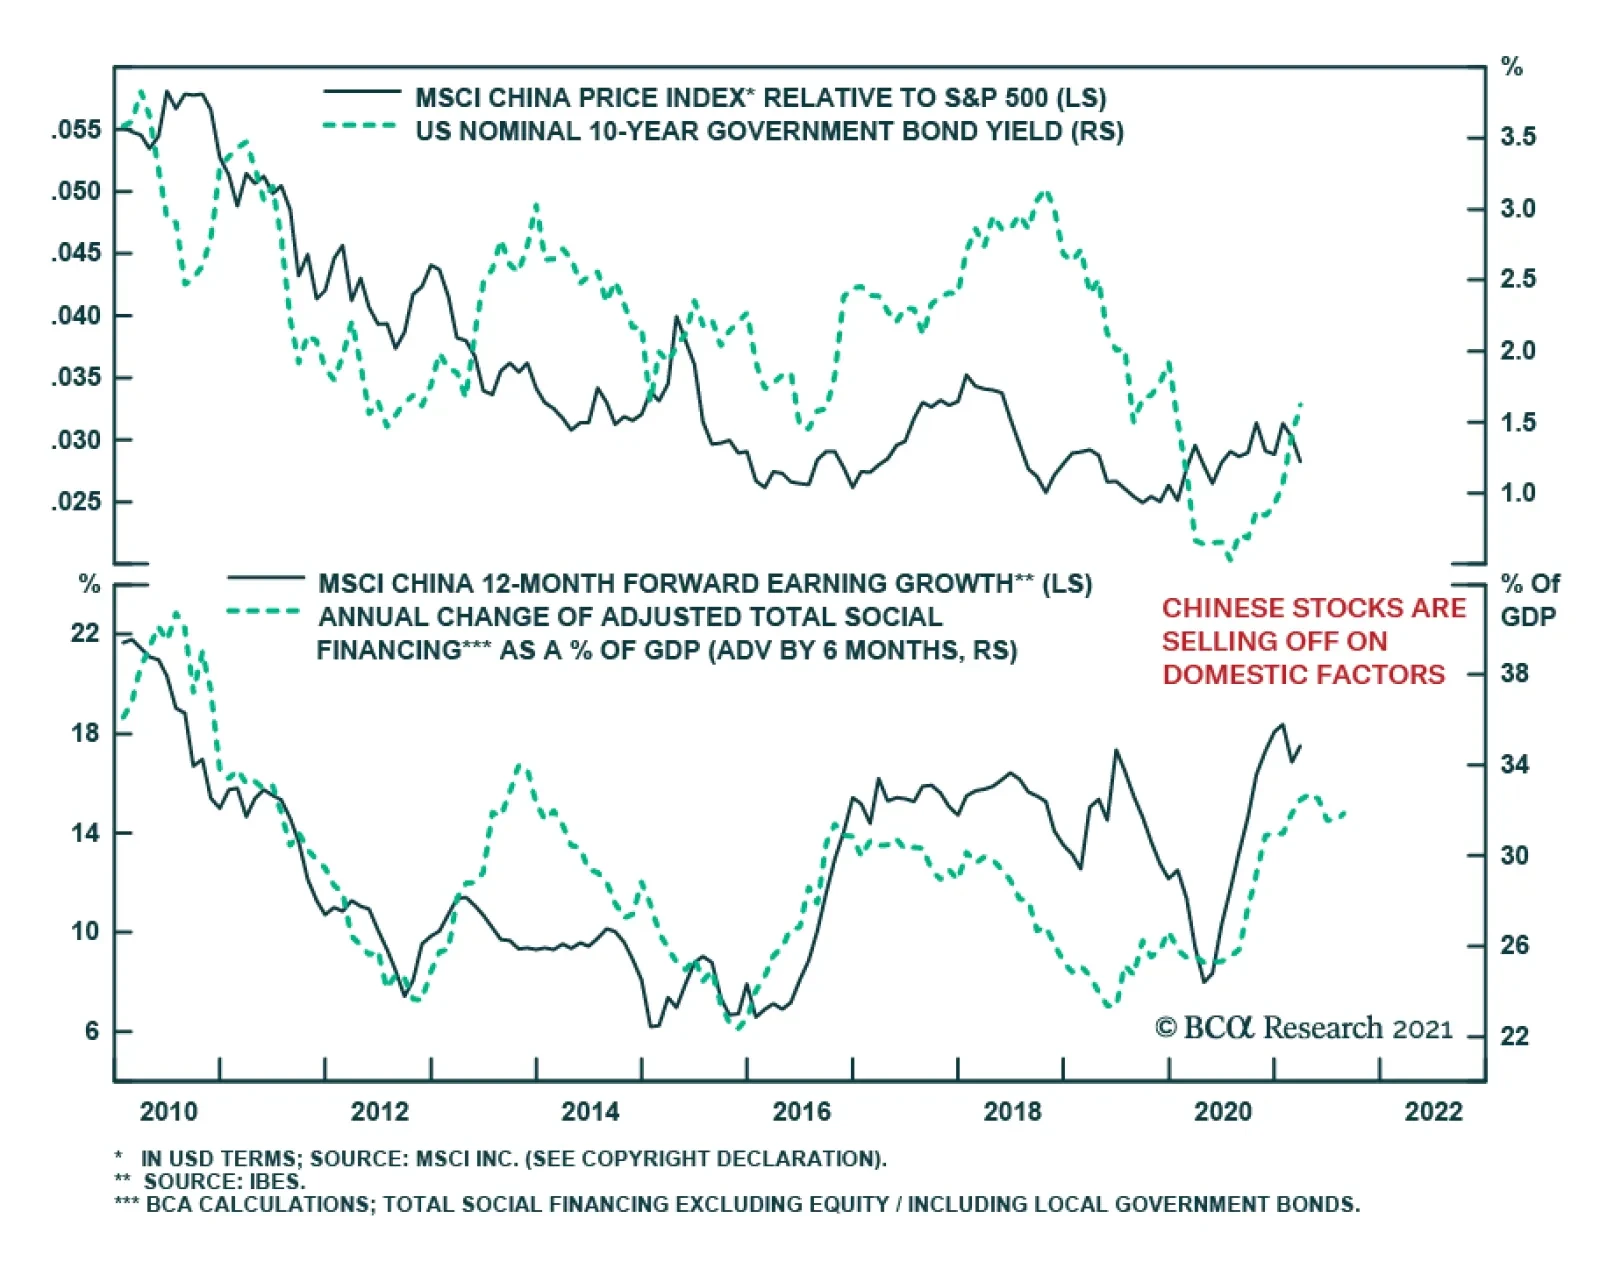
Chinese stocks peaked in mid-February, with the selloff extending well through March. Market participants fear that escalating US Treasury yields will have a sustained negative impact on Chinese risk assets. And while BCA Research’s China Investment Strategy…
Reinstating Long VIX Futures Hedge
Reinstating Long VIX Futures Hedge
Last December in our “2021 High-Conviction Calls” Strategy Report we instituted a long VIX futures trade (for a second time) as a hedge to our cyclical exposure, and earlier this year we crystallized handsome gains just shy of 20% from this hedge. Subsequently, we put on a stop buy order at 25 on the June 2021 VIX futures and that was triggered intraday on Monday. We are obeying our stop buy and have reinstated our hedge. Over the past month, we highlighted how Chinese data softening (see here and here), coupled with the lack of an SPX valuation cushion could spell some short-term trouble for the broad equity market. The chart on the right further underpins the point: the VIX’s term structure indicates that stress has built up beneath the surface. Tack on the fact that the SPX sits near our end-2021 4,000 target, and short-term cautiousness is warranted anew. Bottom Line: Intraday on Monday we obeyed our stop buy order and initiated a long June 2021 VIX futures position at 25 as a near-term hedge to our high-conviction calls.
Today marks the one year anniversary of last year’s SPX lows and we are compelled to reprint the “20 Reasons To Buy Equities” part of our report that Monday “as is” that was titled “The Darkest Hour Is Just Before The Dawn”. The appendix below shows the updates to the charts, and as we reflect how far the stock market expansion has come in the past year, this unique recovery remains quite astounding and with no close historical parallel. Bottom Line: While the SPX is getting close to our 4,000 yearend target and some near-term caution is warranted the equity bull market (and business cycle) is in its infancy and we reiterate our cyclical and structural sanguine views. 20 Reasons To Buy Equities Below are the 20 reasons to start buying equities. We are already in recession. Markets trough in recessions and historically offer enticing risk/reward return profiles. China’s manufacturing PMI and other hard data fell below the GFC lows. As a general rule of thumb investors should buy stocks when the global PMI is well below 50 (Chart 1). Cupboards are bare. A drawdown in inventories is usually followed by a jump in production. Consumers will benefit from the oil market carnage and the super low mortgage refinancing rates. The Fed cut rates to zero, did QE5, and brought back the alphabet soup of programs like CPFF, PDCF and MMLF from the GFC, more will likely follow (Chart 2). The DXY has gone from 95 on March 9 to 103 on Friday. King dollar will soon have to reverse course and provide some much-needed relief globally as the Fed’s US dollar swap lines aim to alleviate the shortage of US dollars (Chart 3). Keep in mind what Dr. Bernanke told Scott Pelley in a 60 Minutes interview with regard to money creation: “PELLEY: Is that tax money that the Fed is spending?
Chart 1
Chart 1
Chart 2
Chart 2
BERNANKE: It's not tax money. The banks have accounts with the Fed, much the same way that you have an account in a commercial bank. So, to lend to a bank, we simply use the computer to mark up the size of the account that they have with the Fed (emphasis ours). So it's much more akin to printing money than it is to borrowing.”1
Chart 3
Chart 3
Chart 4
Chart 4
Other global Central Banks are cutting rates and doing QE. Beyond Christine Lagarde’s recent €750bn bazooka, the ECB has the OMT ready from previous crises. Already last week the ECB intervened in Italian BTPs via Banca d’Italia. Germany has hinted that it would not be opposed to a “Covid-bond.” A mega US fiscal package looms near the $1tn mark.2 The recession-related automatic stabilizers and government spending will soar. China’s fiscal response will likely be as large as in late 2008 (as a reminder in Q4/2008 the Chinese fiscal spending announcement equated “to 12.5% of China’s GDP in 2008, to be spent over 27 months”3). Germany and a slew of other countries have already pledged fiscal spending. Spain has announced a 20% of GDP package. Countries will bid-up the size of the bailout. IMF announced a $1tn bailout package. Nibbling at stocks when the VIX is at 85 makes sense versus when the VIX is at 12 (Chart 4). The yield curve slope is steepening (Chart 5). The 10-year real Treasury yield hit a low of -50bps that indicator has also priced in recession (Chart 4). Equity market internals have fully priced recession, small caps and weak balance sheet stocks in particular (Chart 6). Sentiment is washed out as per our Capitulation, Sentiment and Complacency-Anxiety Indicators (Chart 6). Bernie Sanders has lost his bid to become the nominee of the Democratic Party. Buffett will either bailout a company or two or buyout a company he likes. Jamie Dimon and/or other prominent CEOs (insiders) will start buying their own company stock. Social-distancing measures in the West will ultimately break the Epidemic Curve first derivative and arrest the panic. Even if COVID-19 comes back in force, the fact is that most of the patients who succumb to it are elderly. In Italy, the average age of death is 80 years old. As such, the final circuit-breaker ahead of a GFC would be desensitization by the population, as selective quarantines – targeting the elderly cohorts – get implemented in order to allow other people to return to work. Furthermore, two “silver bullet” solutions remain as tail risks to the bearish narrative. First, a biotech or pharmaceutical company may make a break-through in the fight against COVID-19. Not necessarily a vaccine, but a treatment. Finally, upcoming warm weather in the northern hemisphere may also help the fight against the virus. Bottom Line: Investors with higher risk tolerance should continue to layer in slowly and put cash to work with a cyclical 9-12 month time horizon. Please refer to yesterday’s Weekly Report for more details.
Chart 5
Chart 5
Chart 6
Chart 6
Appendix Chart A1
Chart 1
Chart 1
Chart A2
Chart 2
Chart 2
Chart A3
Chart 3
Chart 3
Chart A4
Chart 4
Chart 4
Chart A5
Chart 5
Chart 5
Chart A6
Chart 6
Chart 6
Footnotes 1 https://www.cbsnews.com/news/ben-bernankes-greatest-challenge/2/ 2 Please see BCA US Equity Strategy Daily Report, "Don’t Be A Hero" dated March 11, 2020, available at uses.bcaresearch.com. 3 https://www.oecd.org/gov/budgeting/Public%20Governance%20Issues%20in%20China.pdf
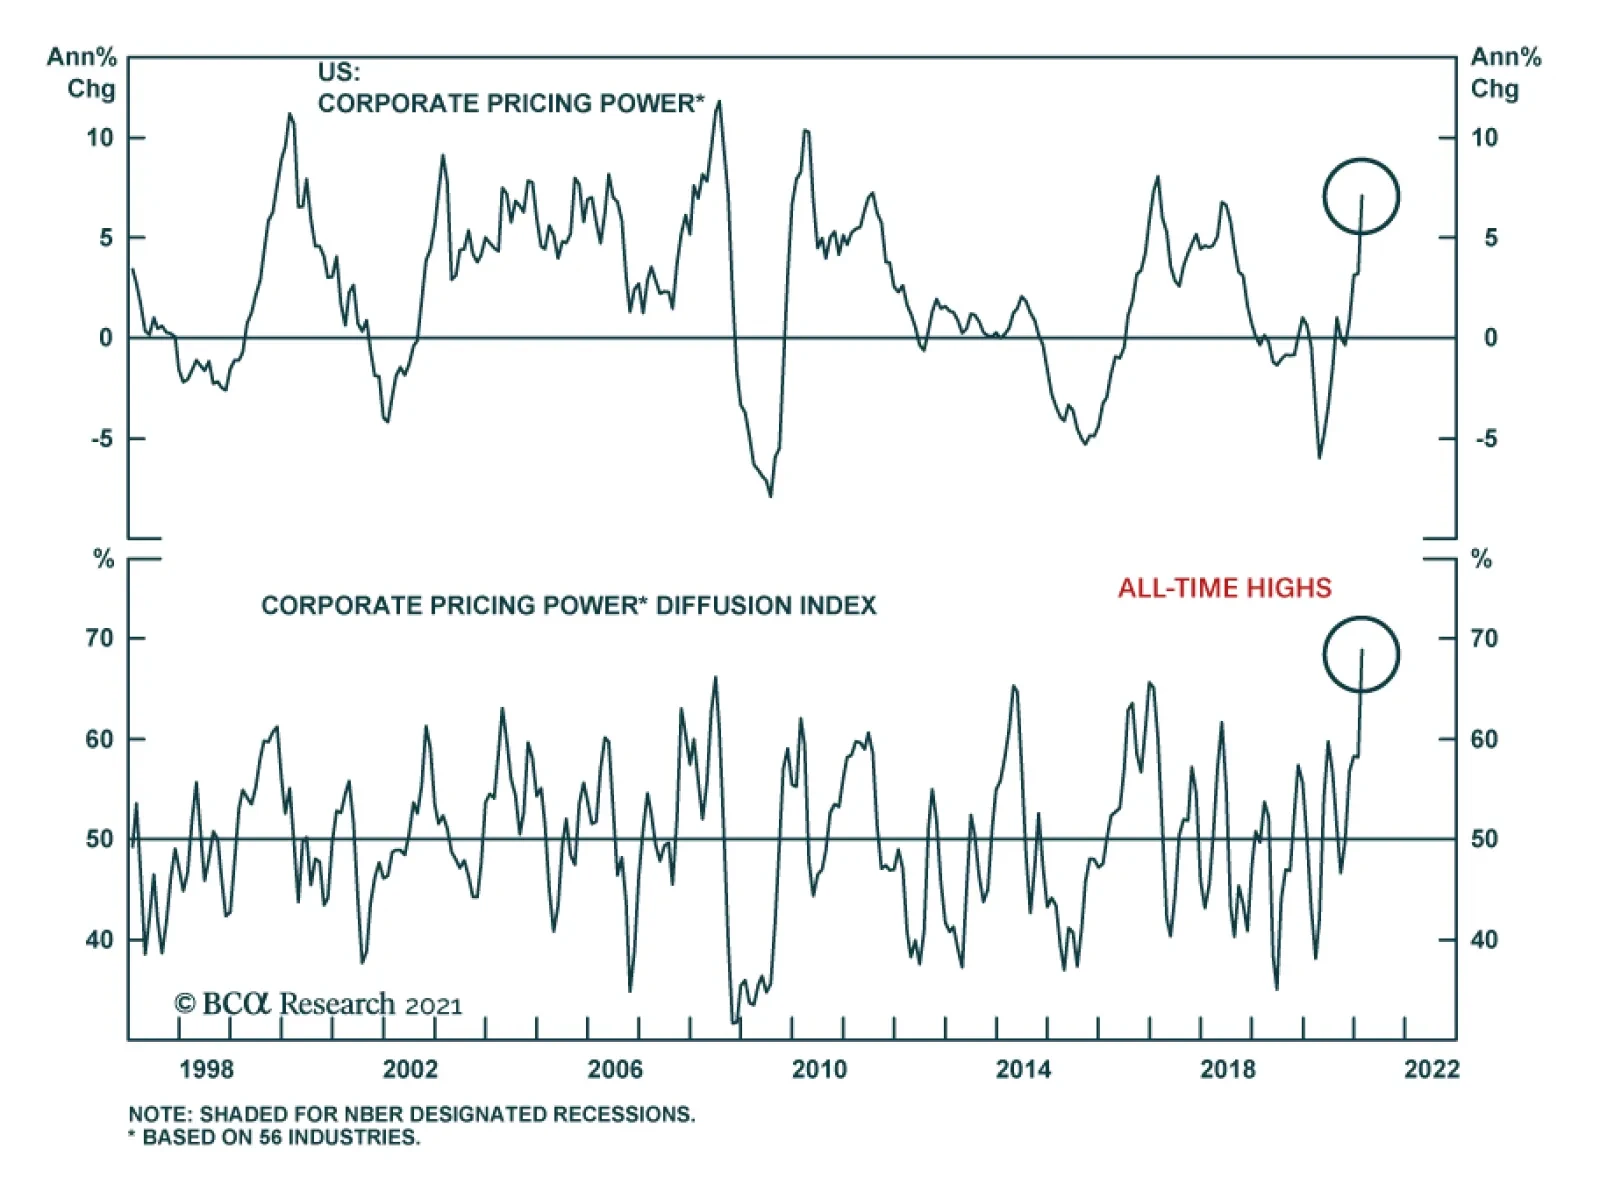
Yesterday, US Equity Strategy updated their Corporate Pricing Power Indicator (CPPI). It has swung over 10 percentage points from the recent trough, accelerating north of 5%/annum pace. Their diffusion index of the 60 selling price categories they track has…