Equities

Highlights We continue to believe that the distribution of Goldilocks economic and market outcomes is quite wide, … : Financial markets and the economy are in a good spot, supported by a combination of above-trend growth and easy monetary policy that will remain in place for at least the next year. … though an unwelcome COVID turn could put the US in the left-hand tail, … : Growth could fall short of expectations in the event of a negative pandemic surprise. As long as vaccinations occur at a pace that confers herd immunity by the end of September, the left-tail scenario is highly unlikely. … and a consumption tidal wave could bring the right tail into play: An explosive release of pent-up consumer demand could push US growth beyond the top of the sanguine consensus range. Too-strong growth would eventually become self-limiting because it would pull the Fed off the sidelines. Our recommendations are unchanged: Goldilocks is just right for risk assets, and we continue to favor equities over bonds and spread product over Treasuries. Feature The potential outcomes for financial markets and the US economy broadly align with Goldilocks’ porridge choices at the three bears’ house: one is too hot, one is too cold and one is just right. The just-right outcome is where we are positioned now: thanks to enormous infusions of emergency aid that have morphed into consumption pump-priming, above-trend growth appears to be assured. That would be plenty favorable for equities and credit on its own, but they also benefit from the Fed’s promise to maintain accommodative monetary policy longer than it previously would have. As our Chief Global Fixed Income Strategist Rob Robis puts it, emergency COVID monetary and fiscal policy will persist well beyond the COVID emergency. That’s an awfully good combination for risk assets and investors have taken note of it, driving equity multiples up and credit spreads down. It is entirely possible that they could spoil things by bidding prices too high, but so far the growth impacts – in the form of knockout earnings surprises and better-than-expected credit performance – have been able to keep the party going. It is our view that they will continue to do so this year, as the range of good-enough growth outcomes is so wide that a Goldilocks outcome is considerably more probable than not. Figure 1 doesn’t quite do it justice, because the area under the tails had to be large enough to accommodate lengthy words like “resurgent” and “consumption,” but we think the tails begin at least one standard deviation away from the middle of the distribution. Figure 1This One Is Just Right
Goldilocks And The Two Tails
Goldilocks And The Two Tails
How Did We Get Here? It is too soon for humanity to declare victory over COVID-19 but we do appear to have gained the upper hand as new case counts have plummeted from their January peaks in the US and the rest of the developed world (Chart 1). Much of Europe re-imposed stringent restrictions on activity for much of November and December, but US officials applied a loose patchwork of local measures, stepping in mostly when hospital capacity was strained (Chart 2). The good news going forward is that increased vigilance, and the cumulative infections that have already occurred, were apparently enough to slow the virus’ spread even during the northern hemisphere winter. The pandemic news can apparently be kept trending in the right direction without cutting off the economy’s oxygen. Chart 1The Tide Has Turned ...
The Tide Has Turned ...
The Tide Has Turned ...
Chart 2... Relieving Pressure On Local Health Care Systems
... Relieving Pressure On Local Health Care Systems
... Relieving Pressure On Local Health Care Systems
Lavish fiscal support has been the other critical element. The CARES Act swiftly rushed a great deal of aid to vulnerable households in two bursts spanning spring and early summer, with the first arriving mainly in April and May via economic impact payments of $1,200 per adult and $500 per child (Chart 3, top panel). The second burst came in the form of a weekly $600 federal unemployment insurance (UI) benefit supplement available through the end of July (though processing delays spread some of the flows into August) (Chart 3, middle panel). The transfers boosted aggregate household income above its pre-pandemic level despite a drop in compensation (Chart 3, bottom panel). Chart 3As Fiscal Transfers Wax And Wane, ...
Goldilocks And The Two Tails
Goldilocks And The Two Tails
Chart 4... So Does The Economy
... So Does The Economy
... So Does The Economy
By the end of the third quarter, however, the transfer flow had slowed to a trickle, with only the pandemic unemployment assistance (PUA) program, which expanded UI benefits to several categories of otherwise ineligible workers, still operating. President Trump’s executive order reallocating some FEMA funds briefly revived supplemental federal UI benefits, but the maximum $400 weekly bump only lasted for a handful of weeks in September and October. Once the fiscal transfers faded, signs of fraying rapidly emerged, with hiring flat-lining and retail sales falling sequentially in all three months of the fourth quarter (Chart 4). A New Paradigm No sooner had the economy begun to show signs of wear than the second round of economic impact payments, provided for in December’s compromise spending bill, arrived in two-thirds1 of American households and the federal government resumed topping up UI benefits. Both the direct payments ($600 per qualifying adult and $600 per child) and the supplemental UI benefits ($300 per week) were smaller than in the spring but we take the snapback in January retail sales as evidence that high marginal-propensity-to-consume households immediately put them to work. Households’ ability to satisfy their obligations to creditors (Chart 5) and landlords slipped as the year wore on as well. We expect that February rent collections and leading 30-day consumer delinquency rates will also show improvement (Chart 6), albeit not as dramatically as the retail series. Chart 560-Day Delinquency Rates Have Stopped Falling …
Goldilocks And The Two Tails
Goldilocks And The Two Tails
Chart 6... And Leading 30-Day Delinquencies Had Been Ticking Higher
Goldilocks And The Two Tails
Goldilocks And The Two Tails
With another, larger round of stimulus coming down the pike, the US economy will cease fraying around the edges. The immediate catalyst for the passage of the $1.9 trillion American Rescue Act was Georgia’s Senate run-off elections, but there were two longer-term developments at play. First, the mainstream economic consensus has come full circle since the global financial crisis and a chorus of expert voices is now warning governments of the perils of cutting off aid too quickly. Fed Chair Powell and Treasury Secretary Yellen have avidly taken up this theme, along with their central bank and finance ministry peers around the world. Second, and more lastingly and influentially, US voters have lost their taste for fiscal austerity. As we wrote with our US Political Strategy colleagues in last week’s Special Report, Democrats are actively renouncing Reaganite budget discipline and Republicans have quietly retired it. Now that the Fed has determined that Volcker-era inflation vigilance is no longer relevant, the stage is being set for a reversal of the investment-friendly inflation and interest rate trends that have been in place for four decades. That will weigh on financial market returns over the long run, but it should prop them up in the near term. Staying Out Of The Left Tail Central bankers are as prone as generals to fight the last war. Corrosively high inflation was every Fed official’s bête noire since the seventies, but a decade of missed inflation targets and tepid, plodding recoveries around the world has shifted central bankers’ focus to hysteresis and the specter of secular stagnation. Once the pandemic arrived, threatening self-reinforcing waves of defaults and bankruptcies, the Fed effectively declared that providing too much accommodation was a lesser evil than prematurely tightening to counter inflation fears that may prove to be unfounded. With fiscal policy makers also at pains to err on the side of doing too much, the near-term growth picture looks awfully good. Chart 7The Vaccination Effort Is Picking Up Steam
The Vaccination Effort Is Picking Up Steam
The Vaccination Effort Is Picking Up Steam
Against that policy backdrop, it will be hard for the US economy to slide into the left-hand tail of the distribution in the absence of a negative virus surprise. We cannot rule out the possibility of virus-resistant mutations or new rounds of outbreaks among a weary populace that lets its guard down, but a failure to vaccinate at a pace consistent with achieving herd immunity by the end of September looks to be the most likely route to disappointment. To that end, we are monitoring vaccination progress against the pace required to get enough of the population inoculated to effect herd immunity by the end of the third quarter (Chart 7). The US got off to a slow start, but we are confident that it will catch up by early spring under an administration that has made crushing the virus its top priority and a Congress that is providing the resources to enable local health authorities to get the job done. Overheating Is Not Inevitable The case for an upside near-term surprise stems from the notion that Congress has provided households with considerably more aid than they need. As we have previously noted, the number of households receiving economic impact payments is multiples of the number of households that have had to grapple with unemployment. Thanks to the first two rounds of fiscal transfers, we estimate that aggregate household income from March through January was nearly $600 billion greater than it would have been in the absence of COVID-19 (Table 1). The looming third round of direct payments could put incremental pandemic income in the neighborhood of $1 trillion. Table 1Households' Excess Pandemic Savings Keep Growing
Goldilocks And The Two Tails
Goldilocks And The Two Tails
Coupled with foregone consumption that already sums to $1.1 trillion, households’ excess pandemic savings is on course to top $2 trillion. That’s a lot of dry powder, even in a $21 trillion economy, and it underpins our view that the probability-adjusted distribution of Goldilocks outcomes is very wide. Without another major virus shock, it is hard to see a scenario where growth doesn’t comfortably exceed its 2% trend level. The question is whether or not enough of the savings will be spent in 2021 and 2022 to push the economy into the right-hand tail and potentially overheat. No one can say with much conviction, as the current backdrop is without precedent. Mount Rushmore-level economists David Ricardo and Milton Friedman would advise investors to temper their enthusiasm. Ricardian equivalence suggests that households will be reluctant to spend distributions they may be taxed to pay for later, and Friedman’s permanent income hypothesis posits that one-off windfalls have little effect on consumption decisions. The multiplier effect of the direct payments to households may not be all it’s cracked up to be, but the lion’s share of the savings stash has come from reduced consumption. How much of that reduced consumption was merely deferred rather than destroyed will determine how much growth can rise. Despite the vast household spending shortfall, consumption of goods has actually tracked above the level that would have been expected if the pandemic had not occurred; the spending gap has entirely been a function of diminished services spending, especially in pandemic-stricken categories like food service, recreation and transportation (Table 2). People surely have an appetite to resume that spending, and will flock to their favorite places once they can again enjoy them fully, but there’s a hitch. Last year’s forgone spending cannot be caught up by eating multiple restaurant dinners in a day, going back in time to attend last season’s sports and entertainment events, or flying on two planes2 and staying in two hotel rooms. Table 2The Spending Gap Is Almost Entirely On The Services Side
Goldilocks And The Two Tails
Goldilocks And The Two Tails
As a result, it seems that a fair amount of forgone services consumption is likely to turn into demand destroyed. Some demand for services could be diverted to demand for goods – one might build out a home theater instead of going to ballgames, movies and concerts; one might buy home exercise equipment in place of a gym membership – but much of that substitution has already taken place and may not persist going forward. The bottom line is that some goods demand appears to have been pulled forward by the pandemic while some services demand has likely been destroyed. There is surely pent-up consumer demand, but only some of the accumulated savings will be directed to satisfying it and we do not think they’ll push the economy to overheat. Investment Implications Our base case has the Goldilocks backdrop of solid growth and ample monetary accommodation remaining in place for at least the rest of the year. Markets have fully discounted that scenario but earnings growth has surprised to the upside by a remarkable margin over the last three quarters (Chart 8) and we expect that the fundamental backdrop will support mid- to high-single-digit equity returns. That will allow stocks to easily surpass bonds and we continue to overweight the former and underweight the latter. If some of the excess savings fuels multiple expansion, equity returns could be even better. Chart 8Earnings Have Been Beating Expectations By A Remarkable Margin
Goldilocks And The Two Tails
Goldilocks And The Two Tails
Although we are not worried that inflation is about to break out to uncomfortably high levels, we do expect further yield curve steepening from the combination of accelerating growth and an inflation-tolerant Fed. We continue to recommend that fixed income investors keep duration below benchmark levels. We expect an ongoing rotation from COVID winners to COVID losers as the virus is increasingly contained and look for value to outperform growth. Doug Peta, CFA Chief US Investment Strategist dougp@bcaresearch.com Footnotes 1 Every single adult taxpayer with adjusted gross income (AGI) of $75,000 or less (and every married filing jointly taxpayer with AGI of $150,000 or less) was eligible for the full payments. 2 Even GE’s CEO doesn’t have this option anymore.
BCA Research’s Global Investment Strategy service concludes that the recent increase in real yields could put further downward pressure on equity prices in the near term. Bond yields have jumped in recent weeks. After bottoming at 0.52% in August, the US…
Dear Client, In addition to this week’s abbreviated report, we are sending you a Special Report on Bitcoin. I don’t recommend you buy it. Best regards, Peter Berezin Highlights Real government bond yields have increased in recent weeks, which could put further downward pressure on equity prices in the near term. Nevertheless, we continue to advocate overweighting equities over a 12-month horizon. Historically, rising real yields have been most toxic for stocks when yields have increased in response to hawkish central bank rhetoric. This is manifestly not the case today. The Fed’s accommodative stance should limit any near-term upward pressure on the US dollar. Investors should favor cyclical and value-oriented stocks over defensive and growth-geared plays. Higher Real Yields: A Near-Term Risk For Stocks Chart 1Government Bond Yields Have Increased Since Bottoming Last Year
Government Bond Yields Have Increased Since Bottoming Last Year
Government Bond Yields Have Increased Since Bottoming Last Year
Bond yields have jumped in recent weeks. After bottoming at 0.52% in August, the US 10-year Treasury yield has climbed to 1.54%, up from 0.93% at the beginning of the year. Government bond yields in the other major economies have also risen (Chart 1). While inflation expectations have bounced, the most recent increase in yields has been concentrated in the real component of bond yields (Chart 2). Optimism about a vaccine-led global growth recovery, reinforced by continued fiscal stimulus – especially in the US – has prompted investors to move forward their expectations of how soon and how high policy rates will rise (Chart 3). Chart 2AThe Real Component Has Fueled The Most Recent Rise In Bond Yields (I)
The Real Component Has Fueled The Most Recent Rise In Bond Yields (I)
The Real Component Has Fueled The Most Recent Rise In Bond Yields (I)
Chart 2BThe Real Component Has Fueled The Most Recent Rise In Bond Yields (II)
The Real Component Has Fueled The Most Recent Rise In Bond Yields (II)
The Real Component Has Fueled The Most Recent Rise In Bond Yields (II)
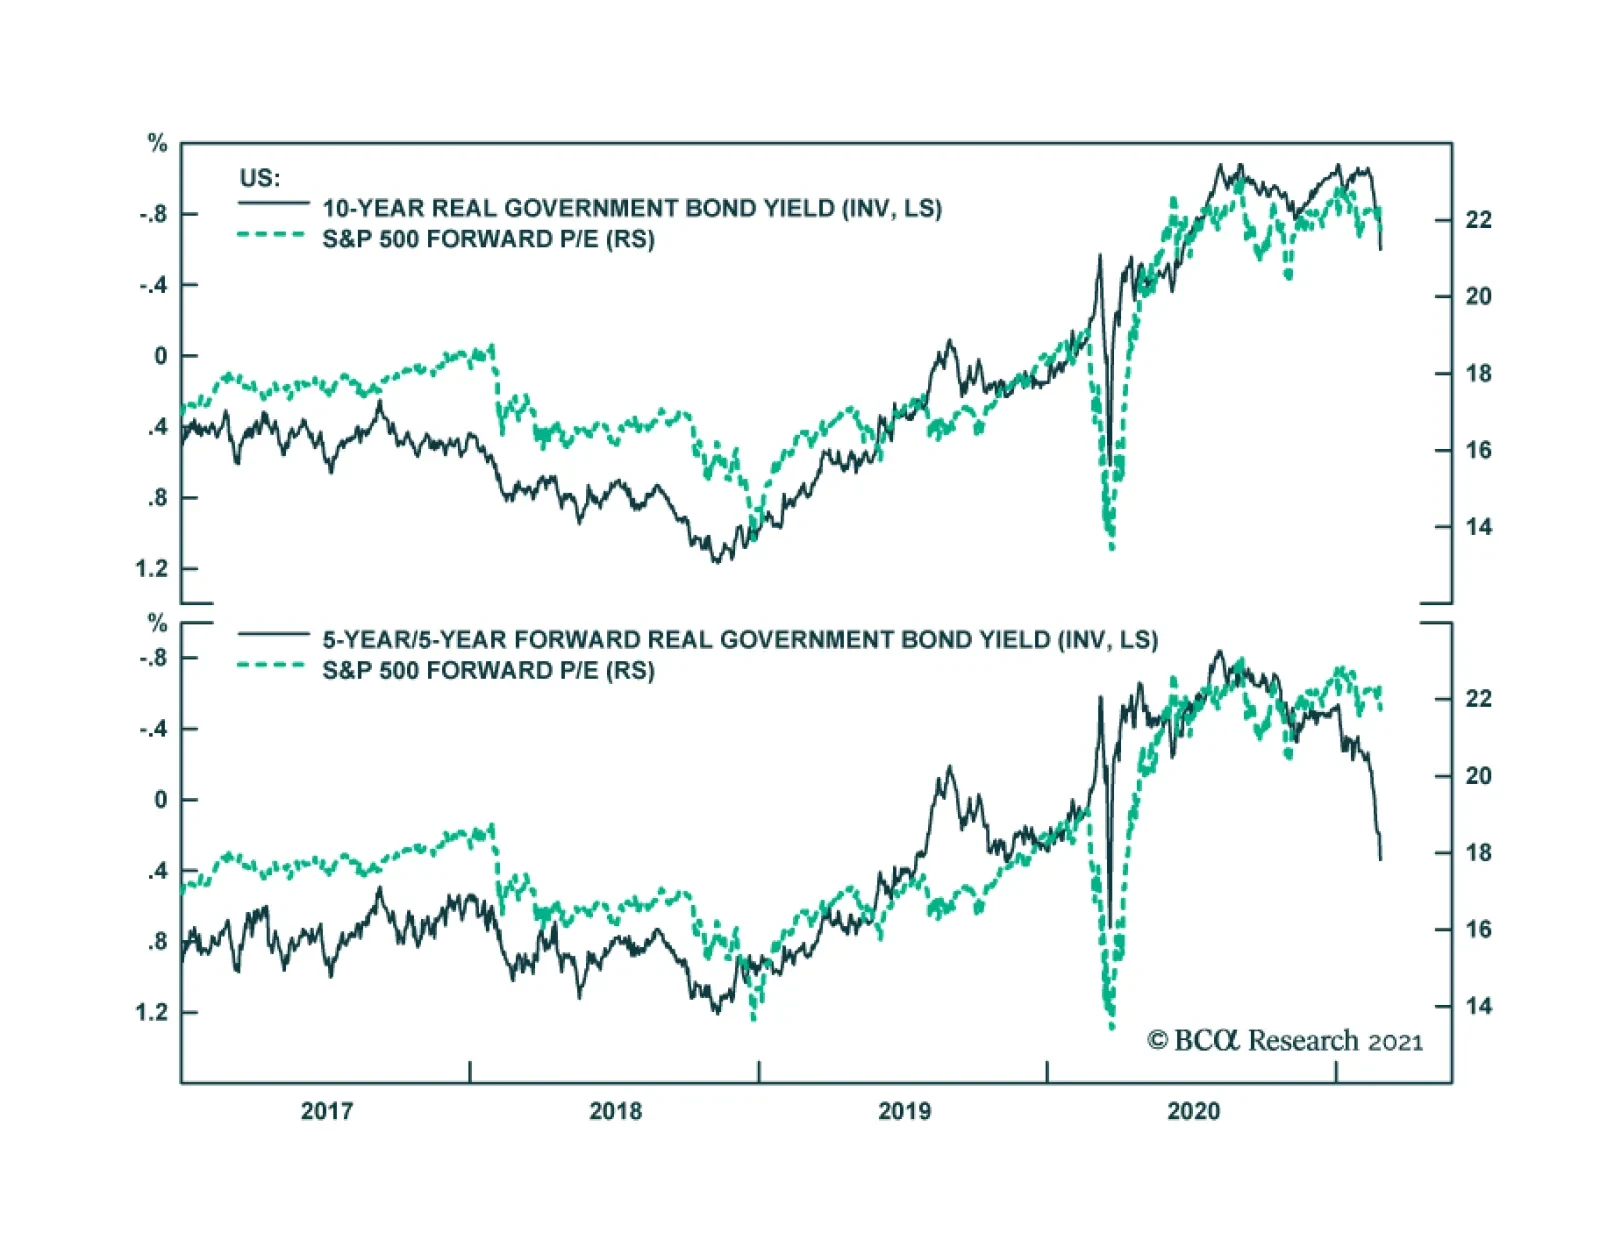
How menacing is the increase in bond yields to stock market investors? Chart 4 shows that there has been a close correlation between real yields and the forward P/E ratio at which the S&P 500 trades. The 5-year/5-year forward real yield, in particular, has moved up sharply, which could put further downward pressure on stocks in the near term. Chart 3Path Of Expected Policy Rates Being Revised Upwards
Path Of Expected Policy Rates Being Revised Upwards
Path Of Expected Policy Rates Being Revised Upwards
Chart 4Rise In Real Rates Is A Headwind For Equity Valuations
Rise In Real Rates Is A Headwind For Equity Valuations
Rise In Real Rates Is A Headwind For Equity Valuations
Nevertheless, we continue to advocate overweighting equities over a 12-month horizon. As we pointed out two weeks ago, rising real yields have historically been most toxic for stocks when yields have increased in response to hawkish central bank rhetoric. This is manifestly not the case today. In his testimony to Congress this week, Jay Powell downplayed inflation risks, stressing that the US economy was “a long way” from the Fed’s goals. He pledged to tread “carefully and patiently” and give “a lot of advance warning” before beginning the process of normalizing monetary policy. We expect the 10-year Treasury yield to stabilize in the 1.6%-to-1.7% range, still well below the level that would threaten the health of the economy. Favor Cyclical And Value-Oriented Stocks In A Weaker Dollar Environment The Fed’s accommodative stance should limit any near-term upward pressure on the US dollar. Whereas stocks are most sensitive to absolute changes in long-term real bond yields, the dollar is more sensitive to changes in short-term real rate differentials with US trading partners (Chart 5). Since the Fed is unlikely to tighten monetary policy anytime soon, US short-term real rates could fall further as inflation rises. Chart 5The Dollar Is Sensitive To Changes In Short-Term Real Rate Differentials
The Dollar Is Sensitive To Changes In Short-Term Real Rate Differentials
The Dollar Is Sensitive To Changes In Short-Term Real Rate Differentials
Chart 6Cyclical Stocks Tend To Benefit The Most From Stronger Global Growth And A Weaker Dollar
Cyclical Stocks Tend To Benefit The Most From Stronger Global Growth And A Weaker Dollar
Cyclical Stocks Tend To Benefit The Most From Stronger Global Growth And A Weaker Dollar
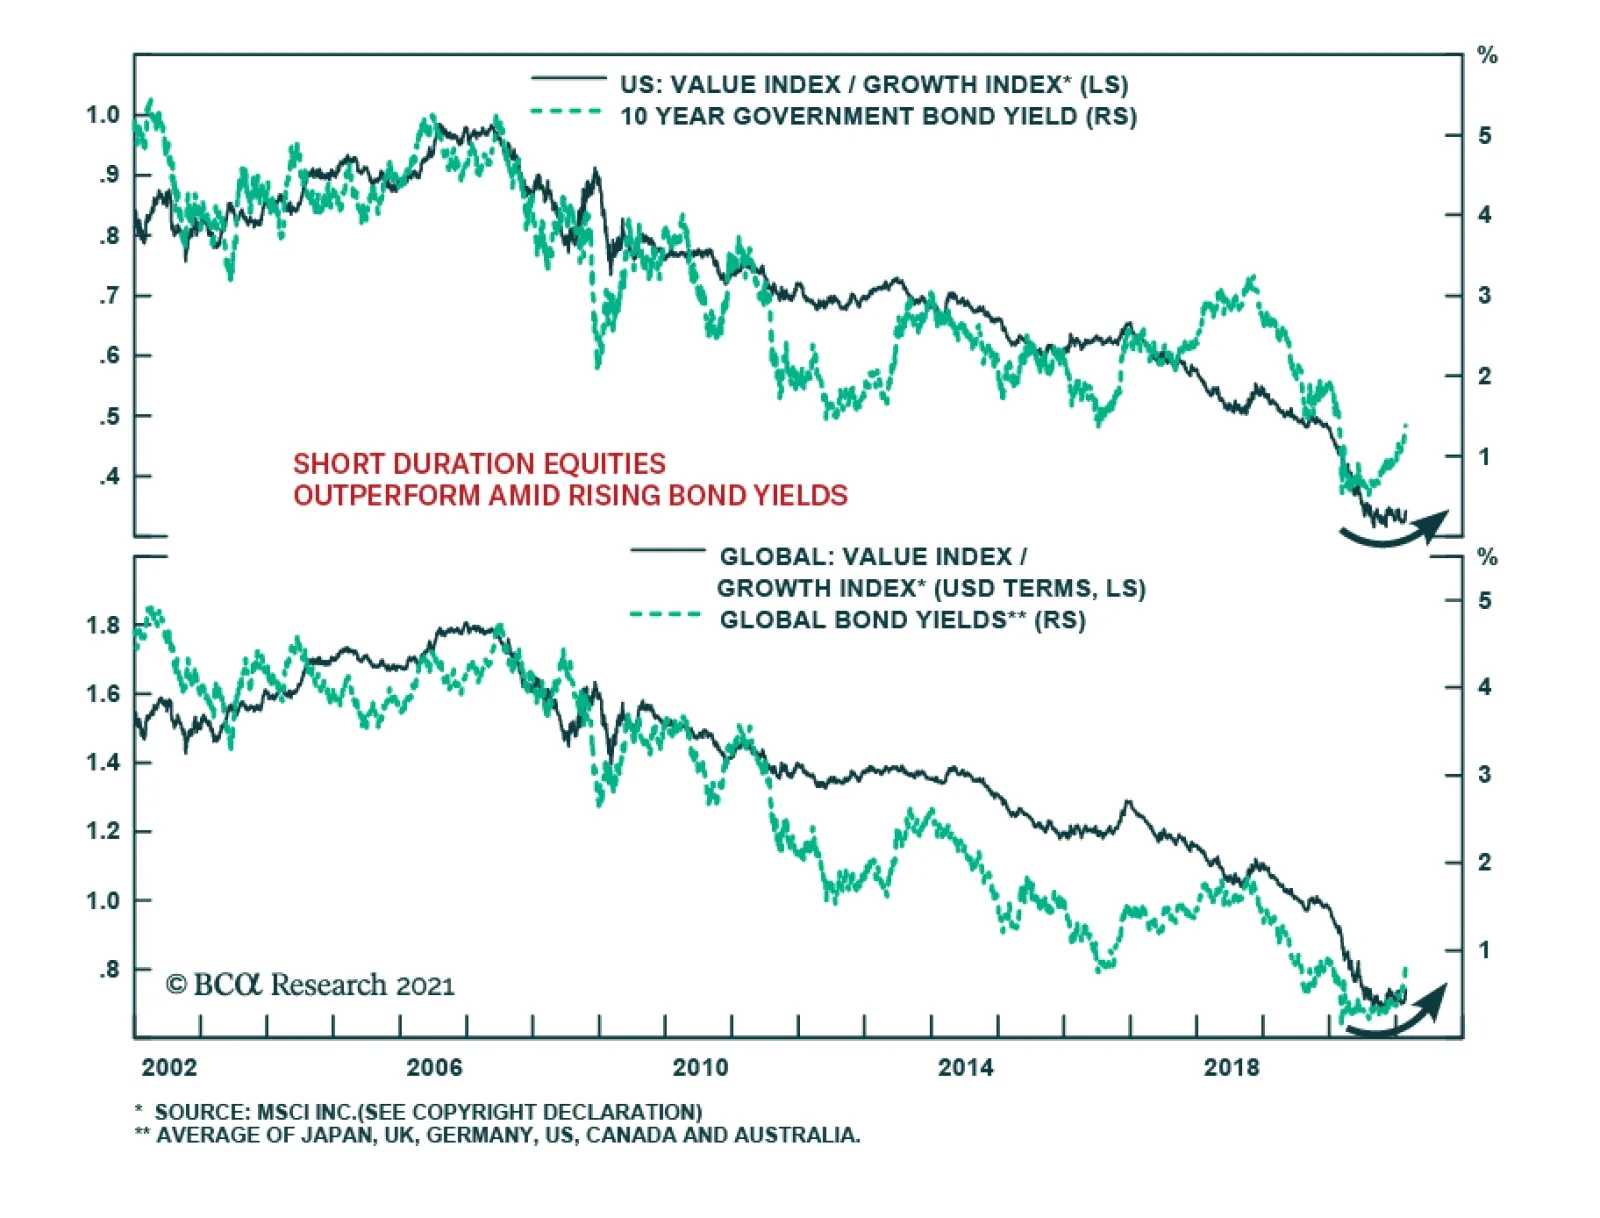
Cyclical stocks, which are overrepresented outside the US, tend to benefit the most from strengthening global growth and a weakening dollar (Chart 6). Value stocks also generally do well in a weak dollar-strong growth environment (Chart 7). Moreover, bank shares – which are concentrated in value indices – typically outperform when long-term bond yields are rising (Chart 8). Chart 7AA Weaker US Dollar And Stronger Global Growth Should Help Value Stocks (I)
A Weaker US Dollar And Stronger Global Growth Should Help Value Stocks (I)
A Weaker US Dollar And Stronger Global Growth Should Help Value Stocks (I)
Chart 7BA Weaker US Dollar And Stronger Global Growth Should Help Value Stocks (II)
A Weaker US Dollar And Stronger Global Growth Should Help Value Stocks (II)
A Weaker US Dollar And Stronger Global Growth Should Help Value Stocks (II)
Chart 8Bank Shares Typically Excel When Long-Term Bond Yields Are Rising
Bank Shares Typically Excel When Long-Term Bond Yields Are Rising
Bank Shares Typically Excel When Long-Term Bond Yields Are Rising
In contrast, as relatively long-duration assets, growth stocks often struggle when bond yields go up. The same is true for more speculative plays such as cryptocurrencies. In this week’s Special Report, we discuss the fate of Bitcoin, arguing that investors should resist buying it. Peter Berezin Chief Global Strategist pberezin@bcaresearch.com Global Investment Strategy View Matrix
When Good News Is Bad News
When Good News Is Bad News
Special Trade Recommendations
When Good News Is Bad News
When Good News Is Bad News
Current MacroQuant Model Scores
When Good News Is Bad News
When Good News Is Bad News
Highlights Market-based geopolitical analysis is about identifying upside as well as downside risk. So far this year upside risks include vaccine efficacy, coordinated monetary and fiscal stimulus, China’s avoidance of over-tightening policy, and Europe’s stable political dynamics. Downside risks include vaccine rollout problems, excessive US stimulus, a Chinese policy mistake, and traditional geopolitical risks in the Taiwan Strait and Persian Gulf. Financial markets may see more turmoil in the near-term over rising bond yields and the dollar bounce. But the macro backdrop is still supportive for this year. We are initiating and reinitiating a handful of trades: EM currencies ex-Brazil/Turkey/Philippines, the BCA rare earth basket, DM-ex-US, and the Trans-Pacific Partnership markets, and global value plays. Feature Chart 1Bond Yield Spike Threatens Markets In Near Term
Bond Yield Spike Threatens Markets In Near Term
Bond Yield Spike Threatens Markets In Near Term
Investors hear a lot about geopolitical risk but the implication is always “downside risk.” What about upside risks? Where are politics and geopolitics creating buying opportunities? So far this year, on the positive side, the US fiscal stimulus is overshooting, China is likely to avoid overtightening policy, and Europe’s political dynamics are positive. However, global equity markets are euphoric and much of the good news is priced in. On the negative side, the US stimulus is probably too large. The output gap will be more than closed by the Biden administration’s $1.9 trillion American Rescue Plan yet the Democrats will likely pass a second major bill later this year with a similar amount of net spending, albeit over a longer period of time and including tax hikes. The countertrend bounce in the dollar and rising government bond yields threaten the US and global equity market with a near-term correction. The global stock-to-bond ratio has gone vertical (Chart 1). Meanwhile Biden faces immediate foreign policy tests in the Taiwan Strait and Persian Gulf. These two are traditional geopolitical risks that are once again underrated by investors. The near term is likely to be difficult for investors to navigate. Sentiment is ebullient and likely to suffer some disappointments. In this report we highlight a handful of geopolitical opportunities and offer some new investment recommendations to capitalize on them. Go Long Japan And Stay Long South Korea China’s stimulus and recovery matched by global stimulus and recovery have led to an explosive rise in industrial metals and other China-sensitive assets such as Swedish stocks and the Australian dollar that go into our “China Play Index” (Chart 2). Chart 2China Plays Looking Stretched (For Now)
China Plays Looking Stretched (For Now)
China Plays Looking Stretched (For Now)
While a near-term pullback in these assets looks likely, tight global supplies will keep prices well-bid. Moreover long-term strategic investment plans by China and the EU to accelerate the technology race and renewable energy are now being joined by American investment plans, a cornerstone of Joe Biden’s emerging national policy program. We are long silver and would buy metals on the dips. Chinese President Xi Jinping’s “new era” policies will be further entrenched at the March National People’s Congress with the fourteenth five-year plan for 2021-25 and Xi’s longer vision for 2035. These policies aim to guide the country through its economic transition from export-manufacturing to domestic demand. They fundamentally favor state-owned enterprises, which are an increasingly necessary tool for the state to control aggregate demand as potential GDP growth declines, while punishing large state-run commercial banks, which are required to serve quasi-fiscal functions and swallow the costs of the transition (Chart 3). Xi Jinping’s decision to promote “dual circulation,” which is fundamentally a turn away from Deng Xiaoping’s opening up and liberal reform to a more self-sufficient policy of import substitution and indigenous innovation, will clash with the Biden administration, which has already flagged China as the US’s “most serious competitor” and is simultaneously seeking to move its supply chains out of China for critical technological, defense, and health goods. Chart 3Xi Jinping Leans On The Banks To Save The SOEs
Xi Jinping Leans On The Banks To Save The SOEs
Xi Jinping Leans On The Banks To Save The SOEs
Chinese political and geopolitical risks are almost entirely priced out of the market, according to our GeoRisk Indicator, leaving Chinese equities exposed to further downside (Chart 4). Hong Kong equities have traded in line with GeoRisk Indicator for China, which suggests that they also have downside as the market prices in a rising risk premium due to the US’s attempt to galvanize its allies in a great circumvention of China’s economy in the name of democracy versus autocracy. Chart 4China/HK Political Risk Priced Out Of Market
China/HK Political Risk Priced Out Of Market
China/HK Political Risk Priced Out Of Market
China has hinted that it will curtail rare earth element exports to the US if the US goes forward with a technological blockade. Biden’s approach, however, is more defensive rather than offensive – focusing on building up domestic and allied semiconductor and supply chain capacity rather than de-sourcing China. President Trump’s restrictions can be rolled back for US designed or manufactured tech goods that are outdated or strictly commercial. Biden will draw the line against American parts going into the People’s Liberation Army. Biden has a chance in March to ease the Commerce Department’s rules implementing Trump’s strictures on Chinese software apps in US markets as a gesture of engagement. Supply constraints and shortages cannot be solved quickly in either semiconductors or rare earths. But both China and the US can circumvent export controls by importing through third parties. The problem for China is that it is easier for the US to start pulling rare earths from the ground than it is for China to make a great leap forward in semiconductor production. Given the US’s reawakening to the need for a domestic industrial policy, strategic public investments, and secure supply chains, we are reinitiating our long rare earth trade, using the BCA rare earth basket, which features producers based outside of China (Chart 5). The renminbi is starting to rolling over, having reached near to the ceiling that it touched in 2017 after Trump’s arrival. There are various factors that drive the currency and there are good macro reasons for the currency to have appreciated in 2016-17 and 2020-21 due to strong government fiscal and monetary reflation. Nevertheless the People’s Bank allowed the currency to appreciate extensively at the beginning of both Trump’s and Biden’s terms and the currency’s momentum is slowing as it nears the 2017 ceiling. We are reluctant to believe the renminbi will go higher as China will not want to overtighten domestic policy but will want to build some leverage against Biden for the forthcoming strategic and economic dialogues. For mainland-dedicated investors we recommend holding Chinese bonds but for international investors we would highlight the likelihood that the renminbi has peaked and geopolitical risk will escalate. There is no substantial change on geopolitical risk in the Taiwan Strait since we wrote about it recently. A full-scale war is a low-probability risk. Much more likely is a diplomatic crisis – a showdown between the US and China over Taiwan’s ability to export tech to the mainland and the level of American support for Taiwan – and potentially a testing of Biden’s will on the cybersecurity, economic security, or maritime security of Taiwan. While it would make sense to stay long emerging markets excluding Taiwan, there is not an attractive profile for staying long emerging markets excluding all of Greater China. Therefore investors who are forced to choose should overweight China relative to Taiwan (Chart 6). Chart 5Rare Earth Miners Outside China Can Go Higher
Rare Earth Miners Outside China Can Go Higher
Rare Earth Miners Outside China Can Go Higher
Market forces have only begun to register the fact that Taiwan is the epicenter of geopolitical risk in the twenty-first century. The bottleneck for semiconductors and Taiwan’s role as middleman in the trade war have supported Taiwanese stocks. It will take a long time for China, the US, and Europe to develop alternative suppliers for chips. But geopolitical pressures will occasionally spike and when they do Taiwanese equities will plunge (Chart 7). Chart 6EM Investors Need Either China Or Taiwan ... Taiwan Most At Risk
EM Investors Need Either China Or Taiwan ... Taiwan Most At Risk
EM Investors Need Either China Or Taiwan ... Taiwan Most At Risk
South Korean geopolitical risk is also beneath the radar, though stocks have corrected recently and emerging market investors should generally favor Korea, especially over Taiwan. The first risk to Korea is that the US will apply more pressure on Seoul to join allied supply chains and exclude shipments of sensitive goods to China. The second risk is that North Korea – which Biden is deliberately ignoring in his opening speeches – will demand America’s attention through a new series of provocations that will have to be rebuked with credible threats of military force. Chart 7Markets Starting To Price Taiwan Strait Geopolitical Risk
Markets Starting To Price Taiwan Strait Geopolitical Risk
Markets Starting To Price Taiwan Strait Geopolitical Risk
Chart 8South Korea Favored In EM But Still Faces Risks Over Chips, The North
South Korea Favored In EM But Still Faces Risks Over Chips, The North
South Korea Favored In EM But Still Faces Risks Over Chips, The North
Chart 9Don't Worry About Japan's Revolving Door
Don't Worry About Japan's Revolving Door
Don't Worry About Japan's Revolving Door
The North Korean risk is usually very fleeting for financial markets. The tech risk is more serious but the Biden administration is not seeking to force South Korea to stop trading with China, at least not yet. The US would need to launch a robust, multi-year diplomatic effort to strong-arm its allies and partners into enforcing a chip and tech ban on China. Such an effort would generate a lot of light and heat – shuttle diplomacy, leaks to the press, and public disagreements and posturing. Until this starts to occur, US export controls will be a concern but not an existential threat to South Korea (Chart 8). Japan is the geopolitical winner in Asia Pacific. Japan is militarily secure, has a mutual defense treaty with the US, and stands to benefit from the recovery in global trade and growth. Japan is a beneficiary of a US-driven tech shift away from excess dependency on China and is heavily invested in Southeast Asia, which stands to pick up manufacturing share. Higher bond yields and inflation expectations will detract from growth stocks more than value stocks, and value stocks have a larger market-cap weight in European and Japanese equity markets. Japanese politics are not a significant risk despite a looming election. While Prime Minister Yoshihide Suga is unpopular and likely to revive the long tradition of a “revolving door” of short-lived prime ministers, and while the Liberal Democratic Party will lose the super-majorities it held under Shinzo Abe, nevertheless the party remains dominant and the national policy consensus is behind Abe’s platform of pro-growth reforms, coordinated dovish monetary and fiscal policy, and greater openness to trade and immigration (Chart 9). Favor EU And UK Over Russia And Eastern Europe Russian geopolitical risk appears to be rolling over according to our indicator but we disagree with the market’s assessment and expect it to escalate again soon (Chart 10). Not only will Russian social unrest continue to escalate but also the Biden administration will put greater pressure on Russia that will keep foreign investors wary. Chart 10Russia Geopolitical Risk Will Not Roll Over
Russia Geopolitical Risk Will Not Roll Over
Russia Geopolitical Risk Will Not Roll Over
While geopolitics thus poses a risk to Russian equities – which are fairly well correlated (inversely) with our GeoRisk indicator – nevertheless they are already cheap and stand to benefit from the rise in global commodity prices and liquidity. Russia is also easing fiscal policy to try to quiet domestic unrest. The pound and the euro today are higher against the ruble than at any time since the invasion of Ukraine. It is possible that Russia will opt for outward aggressiveness amidst domestic discontent, a weak and relapsing approval rating for Vladimir Putin and his government, and the Biden administration’s avowed intention to prioritize democracy promotion, including in Ukraine and Belarus (Chart 11). The ruble will fall on US punitive actions but ultimately there is limited downside, at least as long as the commodity upcycle continues. Chart 11Ruble Can Fall But Probably Not Far
Ruble Can Fall But Probably Not Far
Ruble Can Fall But Probably Not Far
Biden stated in his second major foreign policy speech, “we will not hesitate to raise the cost on Russia.” There are two areas where the Biden administration could surprise financial markets: pipelines and Russian bonds. Biden could suddenly adopt a hard line on the Nordstream 2 pipeline between Russia and Germany, preventing it from completion. This would require Biden to ask the Germans to put their money where their mouths are when it comes to trans-Atlantic solidarity. Biden is keen to restore relations with Germany, and is halting the withdrawal of US troops from there, but pressuring Germany on Russia is possible given that it lies in the US interest and Biden has vowed to push back against Russia’s aggressive regional actions and interference in American affairs. The US imposed sanctions on Russian “Eurobonds” under the Chemical and Biological Weapons Control and Warfare Elimination Act of 1991 (CBW Act) in the wake of Russia’s poisoning of secret agent Sergei Skripal in the UK in 2018. Non-ruble bank loans and non-ruble-denominated Russian bonds in primary markets were penalized, which at the time accounted for about 23% of Russian sovereign bonds. This left ruble-denominated sovereign bonds to be sold along with non-ruble bonds in secondary markets. The Biden administration views Russia’s poisoning of opposition leader Alexei Navalny as a similar infraction and will likely retaliate. The Defending American Security from Kremlin Aggression Act is not yet law but passed through a Senate committee vote in 2019 and proposed to halt most purchases of Russian sovereign debt and broaden sanctions on energy projects and Kremlin officials. Biden is also eager to retaliate for the large SolarWinds hack that Russia is accused of conducting throughout 2020. Cybersecurity stocks are an obvious geopolitical trade in contemporary times. Authoritarian nations have benefited from the use of cyber attacks, disinformation, and other asymmetric warfare tactics. The US has shown that it does not have the appetite to fight small wars, like over Ukraine or the South China Sea, whereas the US remains untested on the question of major wars. This incentivize incremental aggression and actions with plausible deniability like cyber. Therefore the huge run-up in cyber stocks is well-supported and will continue. The world’s growing dependency on technology during the pandemic lockdowns heightened the need for cybersecurity measures but the COVID winners are giving way to COVID losers as the pandemic subsides and normal economic activity resumes. Traditional defense stocks stand to benefit relative to cyber stocks as the secular trend of struggle among the Great Powers continues (Chart 12). Specifically a new cycle of territorial competition will revive military tensions as commodity prices rise. Chart 12Back To Work' Trade: Long Defense Versus Cyber
Back To Work' Trade: Long Defense Versus Cyber
Back To Work' Trade: Long Defense Versus Cyber
By contrast with Russia, western Europe is a prime beneficiary of the current environment. Like Japan, Europe is an industrial, trade-surplus economy that benefits from global trade and growth. It benefits as the geopolitical middleman between the US and its rivals, China and Russia, especially as long as the Biden administration pursues consultation and multilateralism and hesitates to force the Europeans into confrontational postures against these powers. Chart 13Political Risk Still Subsiding In Continental Europe
Political Risk Still Subsiding In Continental Europe
Political Risk Still Subsiding In Continental Europe
Meanwhile Russia and especially China need to court Europe now that the Biden administration is using diplomacy to try to galvanize a western bloc. China looks to substitute European goods for American goods and open up its market to European investors to reduce European complaints of protectionism. European domestic politics will become more interesting over the coming year, with German and French elections, but the risks are low. The rise of a centrist coalition in Italy under Mario Draghi highlights how overstated European political risk really is. In the Netherlands, Mark Rutte’s center-right party is expected to remain in power in March elections based on opinion polling, despite serious corruption scandals and COVID blowback. In Germany, Angela Merkel’s center-right party is also favored, and yet an upset would energize financial markets because it would result in a more fiscally accommodative and pro-EU policy (Chart 13). The takeaway is that there is limit to how far emerging European countries can outperform developed Europe, given the immediate geopolitical risk emanating from Russia that can spill over into eastern Europe (Chart 14). Developed European stocks are at peak levels, comparable to the period of Ukraine’s election, but Ukraine is about to heat up again as a battleground between Russia and the West, as will other peripheral states. Chart 14Favor DM Europe Over EM Europe
Favor DM Europe Over EM Europe
Favor DM Europe Over EM Europe
Chart 15GBP: Watch For Scottish Risk Revival In May
GBP: Watch For Scottish Risk Revival In May
GBP: Watch For Scottish Risk Revival In May
Finally, in the UK, the pound continues to surge in the wake of the settlement of a post-Brexit trade deal, notwithstanding lingering disagreements over vaccines, financial services, and other technicalities. British equities are a value play that can make up lost ground from the tumultuous Brexit years. There is potentially one more episode of instability, however, arising from the unfinished business in Scotland, where the Scottish National Party wants to convert any victory in parliamentary elections in May into a second push for a referendum on national independence. At the moment public opinion polls suggest that Prime Minister Boris Johnson’s achievement of an EU trade deal has taken the wind out of the sails of the independence movement but only the election will tell whether this political risk will continue to fall in the near term (Chart 15). Hence the pound’s rally could be curtailed in the near term but unless Scottish opinion changes direction the pound and UK domestic-oriented stocks will perform well. Short EM Strongmen Throughout the emerging world the rise of the “Misery Index” – unemployment combined with inflation – poses a persistent danger of social and political instability that will rise, not fall, in the coming years. The aftermath of the COVID crisis will be rocky once stimulus measures wane. South Africa, Turkey, and Brazil look the worst on these measures but India and Russia are also vulnerable (Chart 16). Brazilian geopolitical risk under the turbulent administration of President Jair Bolsonaro has returned to the 2015-16 peaks witnessed during the impeachment of President Dilma Rousseff amid the harsh recession of the middle of the last decade. Brazilian equities are nearing a triple bottom, which could present a buying opportunity but not before the current political crisis over fiscal policy exacts a toll on the currency and stock market (Chart 17). Chart 16EM Political Risk Will Bring Bad Surprises
EM Political Risk Will Bring Bad Surprises
EM Political Risk Will Bring Bad Surprises
Chart 17Brazil Risk Hits Impeachment Peaks On Bolso Fiscal Populism
Brazil Risk Hits Impeachment Peaks On Bolso Fiscal Populism
Brazil Risk Hits Impeachment Peaks On Bolso Fiscal Populism
Bolsonaro’s signature pension reform was an unpopular measure whose benefits were devastated by the pandemic. The return to fiscal largesse in the face of the crisis boosted Bolsonaro’s support and convinced him to abandon the pretense of austere reformer in favor of traditional Brazilian fiscal populist as the 2022 election approaches. His attempt to violate the country’s fiscal rule – a constitutional provision passed in December 2016 that imposes a 20-year cap on public spending growth – that limits budget deficits is precipitating a shakeup within the ruling coalition. Our Emerging Market Strategists believe the Central Bank of Brazil will hike interest rates to offset the inflationary impact of breaking the fiscal cap but that the hikes will likely fall short, prompting a bond selloff and renewed fears of a public debt crisis. The country’s political crisis will escalate in the lead up to elections, not unlike what occurred in the US, raising the odds of other negative political surprises. Chart 18Reinitiate Long Mexico / Short Brazil
Reinitiate Long Mexico / Short Brazil
Reinitiate Long Mexico / Short Brazil
While Latin America as a whole is a shambles, the global cyclical upturn and shift in American policy creates investment opportunities – particularly for Mexico, at least within the region. Investors should continue to prefer Mexican equities over Brazilian given Mexico’s fundamentally more stable economic policy backdrop and its proximity to the American economy, which will be supercharged with stimulus and eager to find ways to use its new trade deal with Mexico to diversify its manufacturing suppliers away from China (Chart 18). In addition to Brazil, Turkey and the Philippines are also markets where “strongman leaders” and populism have undercut economic orthodoxy and currency stability. A basket of emerging market currencies that excludes these three witnessed a major bottom in 2014-16, when Turkish and Brazilian political instability erupted and when President Rodrigo Duterte stormed the stage in the Philippines. These three currencies look to continue underperforming given that political dynamics will worsen ahead of elections in 2022 (possibly 2023 for Turkey) (Chart 19). Chart 19Keep Shorting The Strongmen
Keep Shorting The Strongmen
Keep Shorting The Strongmen
Investment Takeaways We closed out some “risk-on” trades at the end of January – admittedly too soon – and since then have hedged our pro-cyclical strategic portfolio with safe-haven assets, while continuing to add risk-on trades where appropriate. The Biden administration still faces one or more major foreign policy tests that can prove disruptive, particularly to Taiwanese, Chinese, Russian, and Saudi stocks. Biden’s foreign policy doctrine will be established in the crucible of experience but his preferences are known to favor diplomacy, democracy over autocracy, and to pursue alliances as a means of diversifying supply chains away from China. We will therefore look favorably upon the members of the Comprehensive and Progressive Trans-Pacific Partnership (CPTPP) and recommend investors reinitiate the long CPTPP equities basket. These countries, which include emerging markets with decent governance as well as Japan, Australia, New Zealand, and Canada all stand to benefit from the global upswing and US foreign policy (Chart 20). Chart 20Reinitiate Long Trans-Pacific Partnership
Reinitiate Long Trans-Pacific Partnership
Reinitiate Long Trans-Pacific Partnership
Chart 21Reinitiate Long Global Value Over Growth
Reinitiate Long Global Value Over Growth
Reinitiate Long Global Value Over Growth
The Biden administration will likely try to rejoin the CPTPP but even if it fails to do so it will privilege relations with these countries as it strives to counter China and Russia. The UK, South Korea, Thailand and others could join the CPTPP over time – though an attempt to recruit Taiwan would exacerbate the geopolitical risks highlighted above centered on Taiwan. The dollar is perking up, adding a near-term headwind to global equities, but the cyclical trend for the dollar is still down due to extreme monetary and fiscal dovishness. Tactically, go long Mexican equities over Brazilian equities. From a strategic point of view we still favor value stocks over growth stocks and recommend investors reinitiate this global trade (Chart 21). Strategically, wait to overweight UK stocks in a global portfolio until the result of the May local elections is known and the risk of Scottish independence can be reassessed. Strategically, favor developed Europe over emerging Europe stocks as a result of Russian geopolitical risks that are set to escalate. Strategically go long global defense stocks versus cyber security stocks as a geopolitical “back to work” trade for a time when economic activity resumes and resource-oriented territorial, kinetic, military risks reawaken. Strategically, favor EM currencies other than Brazil, Turkey, and the Philippines to minimize exposure to economic populism, poor macro fundamentals, and election risk. Strategically, go long the BCA Rare Earths Basket to capture persistent US-China tensions under Biden and the search for alternatives to China. Matt Gertken Vice President Geopolitical Strategy mattg@bcaresearch.com We Read (And Liked) … Supply-Side Structural Reform Supply-Side Structural Reform, a compilation of Chinese economic and policy research, discusses several aspects of Chinese economic reform as it is practiced under the Xi Jinping administration, spanning the meaning and importance of supply-side structural reform in China as well as five major tasks.1 The book consists of contributions by Chinese scholars, financial analysts, and opinion makers in 2015, so we have learned a lot since it was published, even as it sheds light on Beijing’s interpretation of reform. 2015 was a year of financial turmoil that saw a dramatic setback for China’s 2013 liberal reform blueprint. It also saw the launch of a new round of reforms under the thirteenth Five Year Plan (2016-20), which aimed to push China further down the transition from export-manufacturing to domestic and consumer-led growth. Beijing’s renewed reform push in 2017, which included a now infamous “deleveraging campaign,” ultimately led to a global slowdown in 2018-19 that was fatefully exacerbated by the trade war with the United States – only to be eclipsed by the COVID-19 pandemic in 2020. Built on fundamental economic theory and the social background of China, the book’s authors examine the impact of supply-side reform on the Chinese financial sector, industrial sector, and macroeconomic development. The comprehensive analysis covers short-term, mid-term and long-term effects. From the perspective of economic theory, there is consensus that China's supply-side structural reform framework did not forsake government support for the demand side of the economy, nor was it synonymous with traditional, liberal supply-side economics in the Western world. In contrast to Say’s Law, Reaganomics, and the UK’s Thatcherite privatization reforms, China's supply-side reform was concentrated on five tasks specific to its contemporary situation: cutting excessive industrial capacity, de-stocking, deleveraging, cutting corporate costs, and improving various structural “weaknesses.” The motives behind the new framework were to enhance the mobility and efficiency of productive factors, eliminate excess capacity, and balance effective supply with effective demand. Basically, if China cannot improve efficiencies, capital will be misallocated, corporations will operate at a loss, and the economy’s potential will worsen over the long run. The debt buildup will accelerate and productivity will suffer. Regarding implementation, the book sets forth several related policies, including deepening the reform of land use and the household registration (hukou) system, and accelerating urbanization, which are effective measures to increase the liquidity of productive factors. Others promote the transformation from a factor-driven economy to efficiency and innovation-driven economy, including improving the property rights system, transferring corporate and local government debt to the central government, and encouraging investment in human capital and in technological innovation. The book also analyzes and predicts the potential costs of reform on the economy in the short and long term. In the short run, authors generally anticipated that deleveraging and cutting excessive industrial capacity would put more pressure on the government’s fiscal budget. The rise in the unemployment rate, cases of bankruptcy, and the negative sentiment of investors would slow China’s economic growth. In the medium and long run, this structural reform was seen as necessary for a sustainable medium-speed economic growth, leading to more positive expectations for households and corporates. The improved efficiency in capital allocation would provide investors with more confidence in the Chinese economy and asset market. Authors argued that overall credit risk was still controllable in near-term, as the corresponding policies such as tax reduction and urbanization would boost private investment and consumption in the short run. These policies increased demand in the labor market and created working positions to counteract adverse impacts. Employment in industries where excessive capacity was most severe only accounted for about 3% of total urban employment in 2013. Regarding the rise in credit risk during de-capacity, the asset quality of banks had improved since the 1990s and the level of bad debt was said to be within a controllable range, given government support. Moreover, in the long run, the merger and reorganization of enterprises would increase the efficient supply and have a positive effect on economic innovation-driven transformation. We know from experience that much of the optimism about reform would confront harsh realities in the 2016-21 period. The reforms proceeded in a halting fashion as the US trade war interrupted their implementation, prompting the government to resort to traditional stimulus measures in mid-2018, only to be followed by another massive fiscal-and-credit splurge in 2020 in the face of the pandemic. Yet investors could be surprised to find that the Politburo meeting on April 17, 2020 proclaimed that China would continue to focus on supply-side structural reform even amid efforts to normalize the economy and maintain epidemic prevention and control. Leaders also pledged to maintain the supply-side reform while emphasizing demand-side management during annual Central Economic Work Conference in December 2020. In other words, Xi administration’s policy preferences remain set, and compromises forced by exogenous events will soon give way to renewed reform initiatives. This is a risk to the global reflation trade in 2021-22. There has not been a total abandonment of supply-side reform. The main idea of demand-side reform – shifts in the way China’s government stimulates the economy – is to fully tap the potential of the domestic market and call for an expansion of consumption and effective investment. Combined with the new concept of “dual circulation,” which emphasizes domestic production and supply chains (effectively import substitution), the current demand-side reforms fall in line with the supply-side goal of building a more independent and controllable supply chain and produce higher technology products. These combined efforts will provide “New China” sectors with more policy support, less regulatory constraint, and lead to better economic and financial market performance. Despite the fluctuations in domestic growth and the pressure from external demand, China will maintain the focus on reform in its long-term planning. The fundamental motivation is to enhance efficiency and innovation that is essential for China’s productivity and competitiveness in the future. Thus, investors should not become complacent over the vast wave of fiscal and credit stimulus that is peaking today as we go to press. Instead they should recognize that China’s leaders are committed to restructuring. This means that the economic upside of stimulus has a cap on it– a cap that will eventually be put in place by policymakers, if not by China’s lower capacity for debt itself. It would be a colossal policy mistake for China to overtighten monetary and fiscal policy in 2021 but any government attempts to tighten, the financial market will become vulnerable. A final thought: it is unclear whether there is potential for an improvement in China’s foreign relations contained in this conclusion. What the western world is demanding is for China to rebalance its economy, open up its markets, cut back on the pace of technological acquisition, reduce government subsidies for state-owned companies, and conform better to US and EU trade rules. There is zero chance that China will provide all of these things. But its own reform program calls for greater intellectual property protections, greater competition in non-strategic sectors (which the US and EU should be able to access under recent trade deals), and targeted stimulus for sustainable energy, where the US and EU see trade and investment opportunities. Thus there is a basis for an improvement in cooperation. What remains to be seen is how protectionist dual circulation will be in practice and how aggressively the US will pursue international enforcement of technological restrictions on China under the Biden administration. Jingnan Liu Research Associate JingnanL@bcaresearch.com Footnotes 1 Yifu L, et al. Supply-Side Structural Reform (Beijing: Democracy & Construction Publishing House, 2016). 351 pages. Appendix: GeoRisk Indicator China
China: GeoRisk Indicator
China: GeoRisk Indicator
Russia
Russia: GeoRisk Indicator
Russia: GeoRisk Indicator
UK
UK: GeoRisk Indicator
UK: GeoRisk Indicator
Germany
Germany: GeoRisk Indicator
Germany: GeoRisk Indicator
France
France: GeoRisk Indicator
France: GeoRisk Indicator
Italy
Italy: GeoRisk Indicator
Italy: GeoRisk Indicator
Canada
Canada: GeoRisk Indicator
Canada: GeoRisk Indicator
Spain
Spain: GeoRisk Indicator
Spain: GeoRisk Indicator
Taiwan
Taiwan: GeoRisk Indicator
Taiwan: GeoRisk Indicator
Korea
Korea: GeoRisk Indicator
Korea: GeoRisk Indicator
Turkey
Turkey: GeoRisk Indicator
Turkey: GeoRisk Indicator
Brazil
Brazil: GeoRisk Indicator
Brazil: GeoRisk Indicator
Section III: Geopolitical Calendar
BCA Research’s Emerging Markets Strategy service concludes that there are many similarities between the current US macro picture and the late 1960s. In the late 1960s, US inflation was subdued, and interest rates were very low in the preceding two-three…
Global government bond markets are selling off in unison on greater optimism about the economic outlook, with yields at the long end of the curve increasing faster than yields on the short end. This bear steepening suggests that while investors are taking…
Looking To Re-establish Small Cap Bias
Looking To Re-establish Small Cap Bias
Upgrade Alert Small cap indexes regained their footing late last year and recovered two years of losses relative to the SPX in a mere quarter. During that uprising in mid-January we monetized sizable gains both on a cyclical and tactical (high-conviction) time horizon, and subsequently added the small cap bias back to our upgrade watch list. Following a drubbing in absolute and relative valuations, small caps have regained their luster and are now trading at a near 15% premium on a 10-year Cyclically Adjusted P/E (CAPE) basis. Given BCA’s view that the sell-off in the bond market has staying power, we are monitoring this ratio closely for a better entry point. Bottom Line: Small cap stock indexes remain on our upgrade alert list, awaiting a more compelling level to re-establish a small cap size portfolio bias.
Highlights The multiple paid for oil sector profits is collapsing because the market fears that the profits slump will not be short-lived. The fear is not just of a lasting hit to aviation and a slower recovery in road mobility, but an existential fear for fossil-fuelled road transportation in the post-pandemic world. Stay structurally underweight oil and gas. Within the cyclical and value segments of the equity market, overweight metals and miners versus oil and gas. Structurally underweight the stock markets of Norway and the UK which are oil and gas heavy. Structurally overweight the stock markets of Germany, Switzerland, and Denmark which have zero exposure to oil and gas or basic resources. Fractal trade: tin’s near-vertical rally is at high risk of correction. Feature Chart of the WeekOil Production Has Gone Nowhere
Oil Production Has Gone Nowhere
Oil Production Has Gone Nowhere
The Brent crude oil price recently hit $65, not far below its pre-pandemic level of $69. Yet in the stock market, oil and gas equities remain the dogs, languishing 32 percent below their pre-pandemic price level. Relative to the market, the oil and gas sector has underperformed by 42 percent, and the underperformance has been almost a straight line down. Moreover, since last June when the crude oil price has risen by 50 percent, oil and gas equity prices have gone nowhere. This massive divergence of a surging crude oil price from slumping oil and gas equities raises the obvious question, what can explain this dichotomy? (Chart I-2 and Chart I-3) Chart I-2Oil And Gas Equities Have Slumped In Absolute Terms...
Oil And Gas Equities Have Slumped In Absolute Terms...
Oil And Gas Equities Have Slumped In Absolute Terms...
Chart I-3...And In Relative ##br##Terms
...And In Relative Terms
...And In Relative Terms
One apparent puzzle is that the oil sector’s profits have underperformed their established relationship with the crude oil price. In fact, there is no puzzle. The oil sector’s profits might appear to track the oil price, but the reality is that profits track the value of oil production, meaning the product of oil production and the oil price. Clearly though, if output is flat, then profits will appear to track the oil price. But as it took a massive cut in oil output to support the oil price, the value of oil production and therefore, the oil sector’s profits, have significantly underperformed the oil price. Put another way, if you need to cut output to boost the commodity price it might help the commodity price, but it doesn’t much help the equity sector’s profits! (Chart I-4 and Chart I-5). Chart I-4Oil And Gas Profits Appear To Track The Oil Price
Oil And Gas Profits Appear To Track The Oil Price
Oil And Gas Profits Appear To Track The Oil Price
Chart I-5In Reality, Oil And Gas Profits Track The Value Of Oil Output
In Reality, Oil And Gas Profits Track The Value Of Oil Output
In Reality, Oil And Gas Profits Track The Value Of Oil Output
Will Fossil-Fuelled Road Transportation Be Driven To Extinction? We can now explain the 42 percent underperformance of oil equities, and perhaps more importantly, forecast what will happen next. When the pandemic took hold, and economic mobility ground to a halt, the oil sector’s 12-month forward profits slumped. Bear in mind that aviation accounts for 8 percent of oil consumption but, more crucially, road transportation accounts for half of all oil consumption. However, as the pandemic’s impact was expected to be short-lived, the multiple paid for those depressed 12-month forward profits rose. This partly compensated for the profit slump, but still left oil equity prices much lower. The multiple paid for oil sector profits is collapsing because the market fears that the profit slump will not be short-lived. When profits started to recover – albeit, as just discussed, by much less than the oil price rise – it should have boosted oil equity prices. The problem was that the multiple paid for those profits fell by much more than the recovery in profits, with the result that oil equities continued to underperform. Begging the question, why is the multiple paid for oil sector profits collapsing? (Chart I-6) Chart I-6Why Is The Multiple Paid For Oil Sector Profits Collapsing?
Why Is The Multiple Paid For Oil Sector Profits Collapsing?
Why Is The Multiple Paid For Oil Sector Profits Collapsing?
The multiple paid for oil sector profits is collapsing because the market fears that the profit slump will not be short-lived. The fear is not just of a lasting hit to aviation and a slower recovery in road mobility. The fear has become existential. Governments’ plans for pandemic stimulus and recovery have put green energy at front and centre stage. Thereby the recovery has fast-tracked the ultimate nemesis of the oil industry – the extinction of fossil-fuelled road transportation. Are the fears for oil consumption justified? Yes. Aviation is not likely to reach its pre-pandemic level of oil consumption for many years, and long-haul aviation may never get there. But the much bigger threat is fossil-fuelled road transportation. From October 2021, London will extend its Ultra Low Emission Zone (ULEZ) to an 8 mile radius from the city centre.1 The effect will be to banish from London all diesel-fuelled vehicles made before 2015 as well as some older petrol-fuelled vehicles. We expect other major cities to follow London’s example. In most cases, this initiative will happen regardless of the success (or not) of electric vehicles (EVs). Combined with other green initiatives around the world, policymakers’ unashamed aim is to drive fossil-fuelled road transportation to extinction. To repeat, road transportation accounts for half of all oil consumption. The upshot is that the structural downtrend in oil consumption will persist unless the shift away from fossil-fuelled road transportation hits a brick wall, or at least a bottleneck. We do not see such a brick wall or a bottleneck in the foreseeable future. We conclude that though the sector may offer occasional countertrend tactical buying opportunities, long-term equity investors should underweight oil and gas. Structurally Prefer Metals And Miners To Oil And Gas The preceding analysis of the oil sector can be extended to other commodity equities, like the metals and miners. To reiterate, it is the total value of commodity output – the product of commodity production and the commodity price – that drives the profits of commodity equities. On this basis, the long-term prospects for the metals and miners appear somewhat brighter than for oil and gas equities (Chart I-7). Chart I-7Commodity Sector Profits Track The Value Of Commodity Output
Commodity Sector Profits Track The Value Of Commodity Output
Commodity Sector Profits Track The Value Of Commodity Output
Looking at the production of copper, it has increased by around 25 percent over the past decade, albeit this is just in line with world real GDP. By comparison, the production of oil has gone nowhere (Chart of the Week). It is the total value of commodity output that drives the profits of commodity equities. Turning to price, relative to the 2011 high the copper price is around 15 percent lower, whereas the oil price is 50 percent lower (Chart I-8). Chart I-8The Copper Price Has Outperformed The Oil Price
The Copper Price Has Outperformed The Oil Price
The Copper Price Has Outperformed The Oil Price
Hence, on the all-important value of output, copper has moved in a sideways channel over the past decade while oil has been in an unmistakeable structural downtrend, with lower highs and lower lows (Chart I-9). Chart I-9The Value Of Output Is Trending Sideways For Copper, But Downwards For Oil
The Value Of Output Is Trending Sideways For Copper, But Downwards For Oil
The Value Of Output Is Trending Sideways For Copper, But Downwards For Oil
This relative trend is likely to continue as the shift from fossil-fuelled road transportation to EVs will weigh on oil demand, while supporting copper (and other metal) demand. We do not recommend an outright overweight in metals and miners given that their profits are just moving in a sideways channel. However, within the cyclical and value segments of the equity market, a good structural position is to overweight metals and miners versus oil and gas. When Oil And Gas Underperforms, So Does Norway’s OBX And The UK’s FTSE 100 Regional and country equity market performances is driven by the dominant sectors within each stock market. In relative terms, it is also driven by the sectors that are missing. If the oil and gas sector is a structural underperformer, then oil and gas heavy stock markets such as Norway and the UK will be structural underperformers too. If the oil and gas sector is a structural underperformer, it inevitably means that oil and gas heavy stock markets such as Norway and the UK will be structural underperformers too (Chart I-10 and Chart I-11). Chart I-10When Oil And Gas Underperforms, Norway's OBX Underperforms...
When Oil And Gas Underperforms, Norway's OBX Underperforms...
When Oil And Gas Underperforms, Norway's OBX Underperforms...
Chart I-11...And The UK's FTSE 100 ##br##Underperforms
...And The UK's FTSE 100 Underperforms
...And The UK's FTSE 100 Underperforms
The corollary is that stock markets which are under-exposed to the structurally underperforming sector will be at a relative advantage. This supports our structural overweighting to the stock markets of Germany, Switzerland, and Denmark, which all have zero exposure to oil and gas and basic resources. Fractal Trading System* Tin’s near-vertical rally is at high risk of correction based on fragility on all three fractal structures: 65-day, 130-day, and 260-day. A good trade is to short tin versus lead, setting a profit target and symmetrical stop-loss at 13 percent. In other trades, the underweights to China and Korea surged, but short AUD/JPY and short copper/gold reached their stop-losses. The rolling 12-month win ratio stands at 57 percent. Chart I-12Tin Vs. Lead
Tin Vs. Lead
Tin Vs. Lead
When the fractal dimension approaches the lower limit after an investment has been in an established trend it is a potential trigger for a liquidity-triggered trend reversal. Therefore, open a countertrend position. The profit target is a one-third reversal of the preceding 13-week move. Apply a symmetrical stop-loss. Close the position at the profit target or stop-loss. Otherwise close the position after 13 weeks. * For more details please see the European Investment Strategy Special Report “Fractals, Liquidity & A Trading Model,” dated December 11, 2014, available at eis.bcaresearch.com. Dhaval Joshi Chief European Investment Strategist dhaval@bcaresearch.com Footnotes 1 ULEZ will be the zone inside London’s North Circular and South Circular Roads. Fractal Trading System Cyclical Recommendations Structural Recommendations Closed Fractal Trades Trades Closed Trades Asset Performance Currency & Bond Equity Sector Country Equity Indicators Bond Yields Chart II-1Indicators To Watch - Bond Yields - Euro Area
Indicators To Watch - Bond Yields - Euro Area
Indicators To Watch - Bond Yields - Euro Area
Chart II-2Indicators To Watch - Bond Yields - Europe Ex Euro Area
Indicators To Watch - Bond Yields - Europe Ex Euro Area
Indicators To Watch - Bond Yields - Europe Ex Euro Area
Chart II-3Indicators To Watch - Bond Yields - Asia
Indicators To Watch - Bond Yields - Asia
Indicators To Watch - Bond Yields - Asia
Chart II-4Indicators To Watch - Bond Yields - Other Developed
Indicators To Watch - Bond Yields - Other Developed
Indicators To Watch - Bond Yields - Other Developed
Interest Rate Chart II-5Indicators To Watch - Interest Rate Expectations
Indicators To Watch - Interest Rate Expectations
Indicators To Watch - Interest Rate Expectations
Chart II-6Indicators To Watch - Interest Rate Expectations
Indicators To Watch - Interest Rate Expectations
Indicators To Watch - Interest Rate Expectations
Chart II-7Indicators To Watch - Interest Rate Expectations
Indicators To Watch - Interest Rate Expectations
Indicators To Watch - Interest Rate Expectations
Chart II-8Indicators To Watch - Interest Rate Expectations
Indicators To Watch - Interest Rate Expectations
Indicators To Watch - Interest Rate Expectations
For this month’s Special Report, we are sending you a collaboration between our US Investment Strategy and US Political Strategy teams. US Political Strategy is our newest strategy service and it extends the proprietary framework of our Geopolitical Strategy service to provide analysis of political developments that is relevant for US-focused investors. Please contact your relationship manager if you would like more information or to begin trialing the service. Highlights Ronald Reagan cast a long shadow over the elected officials who followed him … :The influence of the economic policies associated with Ronald Reagan held such persistent sway that even the Clinton and Obama administrations had to follow their broad outlines. … just as Paul Volcker did over central bankers at home and abroad … : The Volcker Fed’s uncompromising resistance to the 1970s’ runaway inflation established the Fed’s credibility and enshrined a new global central banking orthodoxy. … but it appears their enduring influence may have finally run its course … : The pandemic overrode everything else in real time, but investors may ultimately view 2020 as the year in which Democrats broke away from post-Reagan orthodoxy and the Fed decided Volcker’s vigilance was no longer relevant. … to investors’ potential chagrin: If inflation, big government and organized labor come back from the dead, globalization loses ground, regulation expands, anti-trust enforcement regains some bite and tax rates rise and become more progressive, then the four-decade investment golden age that Reagan and Volcker helped launch may be on its last legs. Feature The pandemic dominated everything in real time in 2020, as investors scrambled to keep up with its disruptions and the countermeasures policymakers deployed to shelter the economy from them. With some distance, however, investors may come to view it as a year of two critical policy inflection points: the end of the Reagan fiscal era and the end of the Volcker monetary era. The shifts could mark a watershed because Reagan’s and Volcker’s enduring influence helped power an investment golden age that has lasted for nearly 40 years. What comes next may not be so supportive for financial markets. Political history often unfolds in cycles even if their starting and ending dates are never as clear cut in real life as they are in dissertations. Broadly, the FDR administration kicked off the New Deal era, a 48-year period of increased government involvement in daily life via the introduction and steady expansion of the social safety net, broadened regulatory powers and sweeping worker protections. It was followed by the 40-year Reagan era, with a continuous soundtrack of limited government rhetoric made manifest in policies that sought to curtail the spread of social welfare programs, deregulate commercial activity, devolve power to state and local government units and the private sector and push back against unions. The Obama and Trump administrations challenged different aspects of Reaganism, but the 2020 election cycle finally toppled it. Ordinarily, that might only matter to historians and political scientists, but the Reagan era coincided with a fantastic run in financial markets. So, too, did the inflation vigilance that lasted long after Paul Volcker’s 1979-1987 tenure at the helm of the Federal Reserve, which drove an extended period of disinflation, falling interest rates and rising central bank credibility. Our focus here is on fiscal policy, and we touch on monetary policy only to note that last summer’s revision of the Fed’s statement of long-run monetary policy goals shut the door on the Volcker era. The end of both eras could mark an inflection point in the trajectory of asset returns. The Happy Warrior The nine most terrifying words in the English language are, “I’m from the government, and I’m here to help.”1 Chart II-1After The Recession, Reagan Was A Hit
After The Recession, Reagan Was A Hit
After The Recession, Reagan Was A Hit
Ronald Reagan held his conservative views with the zeal of the convert that he was.2 Those views were probably to the right of much of the electorate, but his personal appeal was strong enough to make them palatable to a sizable majority (Chart II-1). Substitute “left” for “right” and the sentiment just as easily sums up FDR’s ability to get the New Deal off the ground. Personal magnetism played a big role in each era’s rise, with both men radiating relatability and optimism that imbued their sagging fellow citizens with a sense of comfort and security that made them willing to try something very different. 1980 was hardly 1932 on the distress scale, but America was in a funk after the upheaval of the sixties, the humiliating end to Vietnam, Watergate, stagflation and a term and a half of uninspiring and ineffectual presidential leadership. Enter the Great Communicator, whose initial weekly radio address evoked the FDR of the Fireside Chats – jovial, resolute and confident, with palpable can-do energy – buffed to a shine by a professional actor and broadcaster whose vocal inflections hit every mark.3 The Gipper,4 with his avuncular bearing, physical robustness and ever-present twinkle in his eye, was just what the country needed to feel better about itself. Reaganomics 101 Government does not tax to get the money it needs; government always finds a need for the money it gets.5 President Reagan’s economic plan had three simple goals: cut taxes, tame government spending and reduce regulation. From the start of his entry into politics in the mid-sixties, Reagan cast himself as a defender of hard-working Americans’ right to keep more of the fruits of their labor from a grasping federal government seeking funding for wasteful, poorly designed programs. He harbored an intense animus for LBJ’s Great Society, which extended the reach of the federal government in ways that he characterized as a drag on initiative, accomplishment and freedom, no matter how well intentioned it may have been. That message hung a historic loss on Barry Goldwater in 1964 when inflation was somnolent but it proved to be far more persuasive after the runaway inflation of the seventies exposed the perils of excessive government (Chart II-2). Chart II-2Inflation Rises When The Labor Market Heats Up
Inflation Rises When The Labor Market Heats Up
Inflation Rises When The Labor Market Heats Up
As the Reagan Foundation website describes the impact of his presidency’s economic policies, “Millions … were able to keep more of the money for which they worked so hard. Families could reliably plan a budget and pay their bills. The seemingly insatiable Federal government was on a much-needed diet. And businesses and individual entrepreneurs were no longer hassled by their government, or paralyzed by burdensome and unnecessary regulations every time they wanted to expand.” “In a phrase, the American dream had been restored.” The Enduring Reach Of Reaganomics I’m not in favor of abolishing the government. I just want to shrink it down to the size where we can drown it in the bathtub. – Grover Norquist Though President-Elect Clinton bridled at limited government’s inherent restrictions, bursting out during a transition briefing, “You mean to tell me that the success of the economic program and my re-election hinges on the Federal Reserve and a bunch of f***ing bond traders?” his administration largely observed them. This was especially true after the drubbing Democrats endured in the 1994 midterms, when the Republicans captured their first House majority in four decades behind the Contract with America, a skillfully packaged legislative agenda explicitly founded on Reagan principles. Humbled in the face of Republican majorities in both houses of Congress, and hemmed in by roving bands of bond vigilantes, Clinton was forced to tack to the center. James Carville, a leading architect of Clinton’s 1992 victory, captured the moment, saying, “I used to think that if there was reincarnation, I wanted to come back as the president or the pope or … a .400 … hitter. But now I would like to come back as the bond market. You can intimidate everybody.” Reagan’s legacy informed the Bush administration’s sweeping tax cuts (and its push to privatize social security), and forced the Obama administration to tread carefully with the stimulus package it devised to combat the Great Recession. Although the administration’s economic advisors considered the $787 billion (5%-of-peak-GDP) bill insufficient, political staffers carried the day and the price tag was kept below $800 billion to appease the three Republican senators whose votes were required to pass it. Even with the economy in its worst state since the Depression, the Obama administration had to acquiesce to Reaganite budget pieties if it wanted any stimulus bill at all. Its leash got shorter after it agreed with House Republicans to “sequester” excess spending under the Budget Control Act of 2011. On the Republican side of the aisle, Grover Norquist, who claims to have founded Americans for Tax Reform (ATR) at Reagan’s request, enforced legislative fealty to the no-new-tax mantra. ATR, which opposes all tax increases as a matter of principle, corrals legislators with the Taxpayer Protection Pledge, “commit[ting] them to oppose any effort to increase income taxes on individuals and businesses.” ATR’s influence has waned since its 2012 peak, when 95% of Republicans in Congress had signed the pledge, and Norquist no longer strikes fear in the hearts of Republicans inclined to waver on taxes. His declining influence is testament to Reaganism’s success on the one hand (the tax burden has already been reduced) and the fading appeal of its signature fiscal restraint on the other. Did Government Really Shrink? When the legend becomes fact, print the legend. – The Man Who Shot Liberty Valance For all of its denunciations of government spending, the Reagan administration ran up the largest expansionary budget deficits (as a share of GDP) of any postwar administration until the global financial crisis (Chart II-3). Although it aggressively slashed non-defense discretionary spending, it couldn’t cut enough to offset the Pentagon’s voracious appetite. The Reagan deficits were not all bad: increased defense spending hastened the end of the Cold War, so they were in a sense an investment that paid off in the form of the ‘90s peace dividend and the budget surpluses it engendered. Chart II-3Cutting The Federal Deficit Is Harder Than It Seems
Cutting The Federal Deficit Is Harder Than It Seems
Cutting The Federal Deficit Is Harder Than It Seems
Nonetheless, the Reagan experience reveals the uncomfortable truth that there is little scope for any administration or Congressional session to cut federal spending. Mandatory entitlement spending on social security, Medicare and Medicaid constitutes the bulk of federal expenditures (Chart II-4) and they are very popular with the electorate, as the Trump campaign shrewdly recognized in the 2016 Republican primaries (Table II-1). Discretionary spending, especially ex-defense, is a drop in the bucket, thanks largely to a Reagan administration that already cut it to the bone (Chart II-5). Chart II-4The Relentless Rise In Mandatory Spending ...
The Relentless Rise In Mandatory Spending ...
The Relentless Rise In Mandatory Spending ...
Chart II-5Overwhlems Any Plausible Discretionary Cuts
Overwhlems Any Plausible Discretionary Cuts
Overwhlems Any Plausible Discretionary Cuts
Table II-1How Trump Broke Republican Orthodoxy On Entitlement Spending
March 2021
March 2021
The Reagan tax cuts therefore accomplished the easy part of the “starve the beast” strategy but his administration failed to make commensurate cuts in outlays (Chart II-6). If overall spending wasn’t cut amidst oppressive inflation, while the Great Communicator was in the Oval Office to make the case for it to a considerably more fiscally conservative electorate, there is no chance that it will be cut this decade. As our Geopolitical Strategy service has flagged for several years, the median US voter has moved to the left on economic policy. Reagan-era fiscal conservatism has gone the way of iconic eighties features like synthesizers, leg warmers and big hair, even if it had one last gasp in the form of the post-crisis “Tea Party” and Obama’s compromise on budget controls. Chart II-6Grover Norquist Is Going To Need A Bigger Bathtub
Grover Norquist Is Going To Need A Bigger Bathtub
Grover Norquist Is Going To Need A Bigger Bathtub
Do Republicans Still Want The Reagan Mantle? Chart II-7“Limited Government” Falling Out Of Fashion
March 2021
March 2021
Reaganism is dead, killed by a decided shift in broad American public opinion, and within the Republican and Democratic parties themselves. Americans are just as divided today as they were in Reagan’s era about the size of the government but the trend since the late 1990s is plainly in favor of bigger government (Chart II-7). Recent developments, including the 2020 election, reinforce our conviction that trend will not reverse any time soon. The Republicans are the natural heirs of Reagan’s legacy. Much of President Trump’s appeal to conservatives lay in his successful self-branding as the new Reagan. Though he lacked the Gipper’s charisma and affability, his unapologetic assertion of American exceptionalism rekindled some of the glow of Morning-in-America confidence. Following the outsider trail blazed by Reagan, he lambasted the Washington establishment and promised to slash bureaucracy, deregulate the economy and shake things up. Trump’s signature legislative accomplishment was the largest tax reform since Reagan’s in 1986. He oversaw defense spending increases to take on China, which he all but named the new “evil empire.”6 Like Reagan, he was willing to weather criticism for face-to-face meetings with rival nations’ dictators. Even his trade protectionism had more in common with the Reagan administration than is widely recognized.7 Chart II-8Reagan’s Amnesty On Immigration
March 2021
March 2021
But major differences in the two presidents’ policy portfolios underline the erosion of the Reagan legacy’s hold. President Trump outflanked his Republican competitors for the 2016 nomination by running against cutting government spending – he was the only candidate who opposed entitlement reform. His signature proposal was to stem immigration by means of a Mexican border wall. While Reagan had sought to crack down on illegal immigration, he pursued a compromise approach and granted amnesty to 2.9 million illegal immigrants living in America to pass the Immigration Reform and Control Act of 1986, sparing businesses from having to scramble to replace them (Chart II-8). While Reagan curtailed non-defense spending, Trump signed budget-busting bills with relish, even before the COVID pandemic necessitated emergency deficit spending. Trump tried to use the power of government to intervene in the economy and alienated the business community, which revered Reagan, with his scattershot trade war. Trump’s greater hawkishness on immigration and trade and his permissiveness on fiscal spending differentiated him from Reagan orthodoxy and signaled a more populist Republican Party. Chart II-9Trump Could Start Third Party, Give Democrats A Decade-Plus Ascendancy
March 2021
March 2021
More fundamentally, Trump represents a new strain of Republican that is at odds with the party’s traditional support for big business and disdain for big government. If he leads that strain to take on the party establishment by challenging moderate Republicans in primary elections and insisting on running as the party’s next presidential candidate, the GOP will be swimming upstream in the 2022 and 2024 elections. It is too soon to make predictions about either of these elections other than to say that Trump is capable of splitting the party in a way not seen since Ross Perot in the 1990s or Theodore Roosevelt in the early 1900s (Chart II-9).8 If he does so, the Democrats will remain firmly in charge and lingering Reaganist policies will be actively dismantled. Even if the party manages to preserve its fragile Trumpist/traditionalist coalition, it is hard to imagine it will recover its appetite for shrinking entitlements, siding against labor or following a laissez-faire approach to corporate conduct and combinations. Republicans will pay lip service to fiscal restraint but Trump’s demonstration that austerity does not win votes will lead them to downplay spending cuts and entitlement reform as policy priorities – at least until inflation again becomes a popular grievance (Chart II-10). Republicans will also fail to gain traction with voters if they campaign merely on restoring the Trump tax cuts after Biden’s likely partial repeal of them. Support for the Tax Cut and Jobs Act hardly reached 40% for the general public and 30% for independents and it is well known that the tax reform did little to help Republicans in the 2018 midterm elections, when Democrats took the House (Chart II-11). Chart II-10Republicans Have Many Priorities Above Budget Deficits
March 2021
March 2021
Chart II-11Trump Tax Cuts Were Never Very Popular
March 2021
March 2021
On immigration the Republican Party will follow Trump and refuse amnesty. Immigration levels are elevated and Biden’s lax approach to the border, combined with a looming growth disparity with Latin America, will generate new waves of incomers and provoke a Republican backlash. On trade and foreign policy, Republicans will follow a synthesis of Reagan and Trump in pursuing a cold war with China. The Chinese economy is set to surpass the American economy by the year 2028 and is already bigger in purchasing power parity terms (Chart II-12). The Chinese administration is becoming more oppressive at home, more closed to liberal and western ideas, more focused on import substitution, and more technologically ambitious. The Chinese threat will escalate in the coming decade and the Republican Party will present itself as the anti-communist party by proposing a major military-industrial build-up. Yet it is far from assured that the Democrats will be soft on China, which is to say that they will not be able to cut defense spending substantially. Chart II-12China Is the New "Evil Empire" For GOP
China Is the New "Evil Empire" For GOP
China Is the New "Evil Empire" For GOP
Will Biden Take Up The Cause? One might ask if the Biden administration might seek to adopt some elements of the Reagan program. President Biden is among the last of the pro-market Democrats who emerged in the wake of the Reagan revolution. Those “third-way” Democrats thrived in the 1990s by accommodating themselves to Reagan’s free-market message while maintaining there was a place for a larger federal role in certain aspects of the economy and society. The 2020 election demonstrated that the Democrats’ political base is larger than the Republicans’ and third-way policies could be a way to make further inroads with affluent suburbanites who helped deliver Georgia and Virginia. Alas, the answer appears to be no. The Democrats’ base increasingly abhors Reagan-era economic and social policies, and the country’s future demographic changes reinforce the party’s current, progressive trajectory. That means fiery younger Democrats don’t have to compromise their principles with third-way policies when they can just wait for Texas to turn blue. Chart II-13Democrats Look To New Deal, Eschew ‘Third Way’
March 2021
March 2021
Biden has only been in office for one month but a rule of thumb is that his party will pull him further to the left the longer Republicans remain divided and ineffective. His cabinet appointments have been center-left, not far-left, though his executive orders have catered to the far-left, particularly on immigration. In order to pass his two major legislative proposals through an evenly split Senate he must appeal to Democratic moderates, as every vote in the party will be needed to get the FY2021 and FY2022 budget reconciliation bills across the line, with Vice President Kamala Harris acting as the Senate tie breaker. Nevertheless his agenda still highlights that the twenty-first century Democrats are taking a page out of the FDR playbook and unabashedly promoting big government solutions (Chart II-13). Biden’s $1.9 trillion American Rescue Plan is not only directed at emergency pandemic relief but also aims to shore up state and local finances, education, subsidized housing, and child care. His health care proposals include a government-provided insurance option (originally struck from the Affordable Care Act to secure its passage in 2010) and a role for Medicare in negotiating drug prices. And his infrastructure plan is likely to provide cover for a more ambitious set of green energy projects that will initiate the Democratic Party’s next big policy pursuit after health care: environmentalism. The takeaway is not that Biden’s administration is necessarily radical – he eschews government-administered health care and is only proposing a partial reversal of Trump’s tax cuts – but rather that his party has taken a decisive turn away from the “third-way” pragmatism that defined his generation of Democrats in favor of a return to the “Old-Left” and pro-labor policies of the New Deal era (Chart II-14). The party has veered to the left in reaction to the Iraq War, the financial crisis, and Trumpism. Vice President Harris, Biden’s presumptive heir, had the second-most progressive voting record during her time in the Senate and would undoubtedly install a more progressive cabinet. Table II-2 shows her voting record alongside other senators who ran against Biden in the Democratic primary election. All of them except perhaps Senator Amy Klobuchar stood to his left on the policy spectrum. Chart II-14Democrats Eschew Budget Constraints
March 2021
March 2021
Fundamentally the American electorate is becoming more open to a larger role for the government in the economy and society. While voters almost always prioritize the economy and jobs, policy preferences have changed. The morass of excessive inflation, deficits, taxation, regulation, strikes and business inefficiencies that gave rise to the Reagan movement is not remembered as ancient history – it is not even remembered. The problems of slow growth, inadequate health and education, racial injustice, creaky public services, and stagnant wages are by far the more prevalent concerns – and they require more, not less, spending and government involvement (Chart II-15). Insofar as voters worry about foreign threats they focus on the China challenge, where Biden will be forced to adopt some of Trump’s approach. Table II-2Harris Stood To The Left Of Democratic Senators
March 2021
March 2021
Chart II-15Public Concern For Economy Means Greater Government Help
March 2021
March 2021
When inflation picks up in the coming years, voters will not reflexively ask for government to be pared back so that the economy becomes more efficient, as they did once they had a taste of Reagan’s medicine in the early 1980s. Rather, they will ask the government to step in to provide higher wages, indexation schemes, price caps, and assistance for labor, as is increasingly the case. The ruling party will be offering these options and the opposition Republicans will render themselves obsolete if they focus single-mindedly on austerity measures. Americans will have to experience a recession caused by inflation – i.e. stagflation – before they call for anything resembling Reagan again. The Post-Reagan Market Landscape Many investors and conservative economists were shocked9 that the Bernanke Fed’s mix of zero interest rates and massive securities purchases did not foster runaway inflation and destroy the dollar. They failed to anticipate that widespread private-sector deleveraging would put a lid on money creation (and that other major central banks would follow in the Fed’s ZIRP and QE footsteps). But a longer view of four decades of disinflation suggests another conclusion: Taking away the monetary punch bowl when the labor party gets going and pursuing limited-government fiscal policy can keep inflation pressures from gaining traction. Globalization, technology-enabled elimination of many lower-skilled white-collar functions and the hollowing out of the organized labor movement all helped as well, though they helped foment a revolt among a meaningful segment of the Republican rank-and-file against Reagan-style policies. The Volcker Fed set the tone for pre-emptive monetary tightening and subsequent FOMCs have reliably intervened to cool off the economy when the labor market begins heating up. The Phillips Curve may be out of favor with investors, but wage inflation only gathers steam when the unemployment rate falls below its natural level (Chart II-16), and the Fed did not allow negative unemployment gaps to persist for very long in the Volcker era. Without wage inflation putting more money in the hands of a broad cross-section of households with a fairly high marginal propensity to consume, it’s hard to get inflation in consumer prices. Chart II-16Taking The Punch Bowl Away From The Union Hall
Taking The Punch Bowl Away From The Union Hall
Taking The Punch Bowl Away From The Union Hall
The Fed took the cyclical wind from the labor market’s sails but the Reagan administration introduced a stiff secular headwind when it crushed PATCO, the air traffic controllers’ union, in 1981, marking an inflection point in the relationship between management and labor. That watershed event opened the door for employers to deploy much rougher tactics against unions than they had since before the New Deal.10 Reagan’s championing of free markets helped establish globalization as an economic policy that the third-way Clinton administration eagerly embraced with NAFTA and a campaign to admit China to the WTO. The latter coincided with a sharp decline in labor’s share of income (Chart II-17). Chart II-17Outsourcing Has Not Been Good For US Labor
Outsourcing Has Not Been Good For US Labor
Outsourcing Has Not Been Good For US Labor
The core Reagan tenets – limited government, favoring management over labor, globalization, sleepy anti-trust enforcement, reduced regulation and less progressive tax systems with lower rates – are all at risk of Biden administration rollbacks. While the easy monetary/tight fiscal combination promoted a rise in asset prices rather than consumer prices ever since the end of the global financial crisis, today’s easy monetary/easy fiscal could promote consumer price inflation and asset price deflation. We do not think inflation will be an issue in 2021 but we expect it will in the later years of Biden’s term. Ultimately, we expect massive fiscal accommodation will stoke inflation pressures and those pressures, abetted by a Fed which has pledged not to pre-emptively remove accommodation when the labor market tightens, will eventually bring about the end of the bull market in risk assets and the expansion. Investment Implications Business revered the Reagan administration and investors rightfully associate it with the four-decade bull market that began early in its first term. Biden is no wild-eyed liberal, but rolling back core Reagan-era tenets has the potential to roll back juicy Reagan-era returns. Only equities have the lengthy data series to allow a full comparison of Reagan-era returns with postwar New Deal-era returns (Table II-3), but the path of Treasury bond yields in the three-decade bear market that preceded the current four-decade bull market suggests that bonds generated little, if any, real returns in the pre-Reagan postwar period (Chart II-18). Stagnant precious metal returns point to tame Reagan-era inflation and downward pressure on input costs. Table II-3Annualized Real Market Returns Before And After Reagan
March 2021
March 2021
Chart II-18Bond Investors Loved Volcker And The Gipper
Bond Investors Loved Volcker And The Gipper
Bond Investors Loved Volcker And The Gipper
Owning the market is not likely to be as rewarding going forward as it was in the Reagan era. Active management may again have its day in the sun as the end of the Reagan tailwinds open up disparities between sectors, sub-industries and individual companies. Even short-sellers may experience a renaissance. We recommend that multi-asset investors underweight bonds, especially Treasuries. We expect the clamor for bigger government will contribute to a secular bear market that could rival the one that persisted from the fifties to the eighties. Within Treasury portfolios, we would maintain below-benchmark duration and favor TIPS over nominal bonds at least until the Fed signals that its campaign to re-anchor inflation expectations higher has achieved its goal. Gold and/or other precious metals merit a place in portfolios as a hedge against rising inflation and other real assets, from land to buildings to other resources, are worthy of consideration as well. BCA has been cautioning of a downward inflection in long-run financial asset returns for a few years, based on demanding valuations and a steadily shrinking scope for ongoing declines in inflation and interest rates. Mean reversion has been part of the thesis as well; trees simply don’t grow to the sky. Now that the curtain has fallen on the Volcker and Reagan eras, the inevitable downward inflection has received a catalyst. We remain constructive on risk assets over the next twelve months, but we expect that intermediate- and long-term returns will fall well short of their post-1982 pace going forward. Doug Peta, CFA Chief US Investment Strategist dougp@bcaresearch.com Matt Gertken Vice President Geopolitical Strategy mattg@bcaresearch.com Footnotes 1 August 12, 1986 Press Conference News Conference | The Ronald Reagan Presidential Foundation & Institute (reaganfoundation.org), accessed February 4, 2021. Reagan makes the quip in his prepared opening remarks. 2 Reagan was a Democrat until he entered politics in his fifties. He claimed to have voted for FDR four times. 3 April 3, 1982 Radio Address President Reagan's Radio Address to the Nation on the Program for Economic Recovery - 4/3/82 - YouTube, accessed February 4, 2021. 4 As an actor, Reagan was perhaps best known for his portrayal of Notre Dame football legend George Gipp, who is immortalized in popular culture as the subject of the “win one for the Gipper” halftime speech. 5 July 22, 1981 White House Remarks to Visiting Editors and Broadcasters reaganfoundation.org, accessed February 8, 2021. 6 Reagan famously urged his followers, in reference to the USSR, “I urge you to beware the temptation of pride—the temptation of blithely declaring yourselves above it all and label both sides equally at fault, to ignore the facts of history and the aggressive impulses of an evil empire.” See his “Address to the National Association of Evangelicals,” March 8, 1983, voicesofdemocracy.umd.edu. 7 Robert Lighthizer, the Trump administration trade representative who directed its tariff battles, was a veteran of Reagan’s trade wars against Japan in the 1980s. 8 “Exclusive: The Trump Party? He still holds the loyalty of GOP voters,” USA Today, February 21, 2021, usatoday.com. 9 Open Letter to Ben Bernanke,” November 15, 2010. Open Letter to Ben Bernanke | Hoover Institution Accessed February 23, 2021. 10 Please see the following US Investment Strategy Special Reports, “Labor Strikes Back, Parts 1, 2 and 3,” dated January 13, January 20 and February 3, 2020, available at usis.bcaresearch.com.
Highlights The pandemic is not yet over, but it appears that infections have peaked in the developed world and in most of the major developing economies. Economic growth will reaccelerate as social distancing abates and vaccination programs gather momentum. The current policy orthodoxy is night-and-day different from the orthodoxy that prevailed in the wake of the global financial crisis, as deficit shaming has given way to deficit positivity. Rapid expansion is more likely than a repeat of last decade’s tepid, plodding recovery and inflation will eventually supplant hysteresis as policymakers’ biggest worry. The impending passage of the $1.9 trillion American Rescue Act will vault the US ahead of its major economy counterparts in terms of pandemic spending. Washington’s massive fiscal commitment speeds up the timetable for closing the output gap in the US. Although inflation has become a hot topic among US investors, we do not see it materializing until next year at the earliest. Our base case has the Goldilocks backdrop of solid growth and ample monetary accommodation remaining in place for at least the rest of the year. Markets have fully discounted that scenario but investors should be aware that both downside and upside surprises are possible; bad virus news could drive a growth shortfall while households’ enormous excess savings could power a consumption breakout. The broad take-up of the Goldilocks scenario among equity investors will make it hard for stocks to dazzle in 2021. Nonetheless, we think conditions support mid-to-high single-digit returns, which will allow equities to outperform bonds. The combination of accelerating growth and quiescent central banks is catnip for equities but not so much for bonds, especially investment-grade sovereigns. Fixed-income investors should maintain below-benchmark duration as yield curves steepen. Steepening yield curves have given Financials a shot in the arm while weighing on the high-flying Tech sector. Reopening in the wake of COVID’s retreat should also redound to recent laggards’ benefit and we continue to expect value stocks will outperform their growth counterparts over the rest of the year. The US dollar will resume its downtrend as the virus is beaten back, albeit at a gentler pace than in 2020. Humanity Retakes The Lead Humankind cannot yet declare victory over COVID-19 but it does appear to have gained the upper hand as new case counts have plummeted from their January peak (Chart I-1). Restrictions helped turn the tide in Europe, albeit at the cost of cutting off oxygen to the economy (Chart I-2), but even in Sweden and the US, which eschewed EU-style restrictions, the virus has lost momentum. Increased vigilance apparently trumped fears that the coronavirus would flourish in the northern hemisphere winter. The potential for vaccine-resistant variants is a concern, but the pandemic news is clearly trending in the right direction. Chart I-1The Fever Has Broken
The Fever Has Broken
The Fever Has Broken
Chart I-2Throwing The Merchants Out With The Bathwater
Throwing The Merchants Out With The Bathwater
Throwing The Merchants Out With The Bathwater
As infections fall, so too does the strain on public health care systems. Plunging hospitalizations (Chart I-3) indicate that health care systems have recovered capacity. Hospitalizations are an important metric for tracking COVID’s impact on the economy because they lead restrictions on activity; when they are high and rising, officials are prone to limit person-to-person interaction, and when they are low and falling, officials roll back emergency limits. For services-heavy developed economies, easier restrictions are the key to a return to something more closely resembling normal activity until vaccinations confer herd immunity (Chart I-4). Chart I-3Restrictions Can Be Lifted As Health Care Systems Regain Capacity
Restrictions Can Be Lifted As Health Care Systems Regain Capacity
Restrictions Can Be Lifted As Health Care Systems Regain Capacity
In the meantime, those who continue to be displaced by the pandemic and the distancing measures taken to combat it will fall back on fiscal support. Fourth-quarter deceleration in the United States highlighted the important role that fiscal transfers have played in keeping vulnerable households, businesses and communities afloat. The bulk of the transfers authorized under the CARES Act were distributed in two bursts. The first arrived in April and May via economic impact payments of $1,200 per adult and $500 per child that were paid in full to about two-thirds of American households1 (Chart I-5, top panel). Chart I-4Lockdowns Are A Drag
Lockdowns Are A Drag
Lockdowns Are A Drag
Chart I-5Transfers Slowed To A Trickle In The Fall
March 2021
March 2021
Chart I-6Fewer Transfers, Fewer Sales, ...
Fewer Transfers, Fewer Sales, ...
Fewer Transfers, Fewer Sales, ...
The second burst came in the form of a weekly $600 federal unemployment insurance (UI) benefit supplement in April, May, June and July (Chart I-5, middle panel). Additional aid was provided by the pandemic unemployment assistance (PUA) program, which expanded UI benefits to independent contractors, self-employed individuals and other workers who would not otherwise qualify to receive them. The PUA program was the smallest of the three major transfer plans and the only one that ran until the end of the year, and as the arrival of the direct payment checks and final UI benefit supplements receded further into the past, the US economy began to show some signs of wear. Retail sales fell sequentially in all three months of the fourth quarter (Chart I-6) as total employment hit a wall (Chart I-7) and the economic surprise index swooned (Chart I-8). Chart I-7... Fewer Jobs ...
... Fewer Jobs ...
... Fewer Jobs ...
Chart I-8... And Fewer Positive Surprises
... And Fewer Positive Surprises
... And Fewer Positive Surprises
Households’ ability to satisfy their obligations to creditors and landlords slipped as the year wore on as well. Fiscal transfers and forbearance programs have limited credit distress far more effectively than one would have expected when the COVID meteor hit the earth (Table I-1), but leading 30-day delinquency rates reveal a modest erosion since late summer (Chart I-9). The share of apartment renters paying at least some of their rent fell by more than one-and-a-half percentage points from year-ago levels in October, November, December and January, a first since the CARES Act transfers began to flow in time to help with the May rent (Chart I-10). It seems clear that lower-income households who relied most heavily on aid felt its absence as the year wore on. Table I-160- And 90-Day Consumer Delinquencies Are Down Year-Over-Year, ...
March 2021
March 2021
Chart I-9... But Leading 30-Day Delinquencies Are On The Rise ...
March 2021
March 2021
Chart I-10... And Apartment Rent Collections Have Been Slipping
March 2021
March 2021
We take the snapback in January retail sales as evidence that high marginal-propensity-to-consume households needed the second round of transfers provided for in December’s compromise spending bill. Both the economic impact payments ($600 per qualifying adult and $600 per child) and the supplemental UI benefits ($300 per week) were smaller, but the most vulnerable households put them to immediate use. We expect that February rent collections and consumer loan delinquencies will also show improvement, albeit not as dramatically as the retail sales series. With another, larger round of stimulus coming down the pike, it appears that the US economy will avoid a repeat of its fourth quarter fraying around the edges but slumps remain a possibility in economies that allow transfer schemes to lapse before COVID-19 can be tamed. And Now For Something Completely Different The global economy has confronted two significant crises in the space of a dozen years. The events that precipitated them could hardly have been more different: the global financial crisis (GFC) was an endogenous event with enough avarice, hubris, folly and villainy to support a cottage industry of books, movies and TV shows revisiting it, while the pandemic, for all of the official complacency and bumbling it laid bare, was simply an exogenous occurrence of great misfortune. The monetary policy response to both events has been substantially identical; the Fed swiftly took the fed funds rate back to zero, bought copious quantities of Treasury and agency securities, and launched a mix of old and new emergency measures. Other major central banks, which were largely unable to make any moves toward normalization between crises, simply maintained zero or negative interest rate policy and ramped up the pace and/or scope of their own asset purchase programs. The fiscal response has been dramatically different, however, in line with a 180-degree turn in budget orthodoxy. Chastened, perhaps, by Europe’s double-dip recession, or the protractedly tepid US expansion, economic mandarins have experienced a road-to-Damascus conversion. Whereas the OECD and the IMF began wagging their fingers at prodigal legislators while the global economy was still submerged under the GFC rubble, today they counsel that there is no rush to pull back on spending. As the OECD’s chief economist said in a January interview, “The first lesson [from the aftermath of the GFC] is to make sure governments are not tightening in the one to two years following the trough of GDP.2” The IMF has declared that “the near-term priority is to avoid premature withdrawal of fiscal support. Support should persist, at least into 2021, to sustain the recovery and to limit long-term scarring.3” Chart I-11What Goes Up Must ... Go Up Again
What Goes Up Must ... Go Up Again
What Goes Up Must ... Go Up Again
The about-face in terms of fiscal deficits could have a profound effect on the character of the post-pandemic expansions. The plodding and protracted post-GFC recovery/expansion might be viewed as an object lesson in monetary policy’s limits. There is no gainsaying that central banks acted boldly to counter the GFC, cutting policy rates to zero and beyond, purchasing vast quantities of sovereign bonds, government agency securities and even debt and equity issued by private entities. The purchases caused central bank balance sheets to swell (Chart I-11), but the money creation impact was stunted by an offsetting wave of defaults and a general reluctance on the part of lenders and would-be borrowers to add to the stock of debt. Chart I-12GFC Stimulus Was Fleeting
March 2021
March 2021
GFC fiscal spending was modest and largely limited to automatic stabilizers once emergency measures ran their course. Even the most celebrated efforts, like the United States’ 2009 Recovery Act, were intentionally modest in scope and limited in duration. Following the prevailing wisdom, national governments quickly moved to withdraw assistance and reduce their budget deficits once the worst of the crisis had passed (Chart I-12). Tepid investment, sluggish employment gains and fiscal drag all weighed on growth, defying the typical bigger-the-decline, bigger-the-bounce business cycle pattern. The picture is quite different today as central banks have gained a powerful and willing partner in their efforts to combat the damage wrought by a sudden shock. Pandemic fiscal stimulus initiatives have dwarfed GFC efforts across the major economies (Chart I-13). Once Congress passes the $1.9 trillion American Rescue Act, the US will have doubled down on its 2020 initiatives, committing to aid equivalent to an extraordinary 25% of its annual output. The ultimate effect on inflation, interest rates and exchange rates remains to be seen, but it is clear that the post-pandemic expansion will not unfold at the plodding pace of the post-GFC expansion. Chart I-13The COVID Fiscal Response Has Dwarfed The GFC's
March 2021
March 2021
Goldilocks And The Two Tails Narrowing our focus to the US, which comprises nearly 60% of the market cap of the benchmark MSCI All-Country World Index, our base case is the Goldilocks scenario that markets appear to be discounting. That scenario would entail the just-right outcome of solid growth and continued monetary accommodation (Figure I-1). Since the Fed will only dial back accommodation if the economy appears to be at risk of overheating, it will take a growth disappointment, most likely from a negative virus surprise, for the US economy to tumble into the left-hand tail of the distribution. Figure I-1Goldilocks And The Two Tails
March 2021
March 2021
Chart I-14Making Up For Lost Time
Making Up For Lost Time
Making Up For Lost Time
We cannot rule out the possibility of virus-resistant mutations or new rounds of outbreaks from a weary populace that lets its guard down, but a failure to vaccinate at a pace consistent with achieving herd immunity by the end of September looks to be the most likely route to disappointment. To that end, we are monitoring vaccination progress against the pace required to get 50-80% of the population inoculated by the end of the third quarter (Chart I-14). The US got off to a slow start, but we are confident that it will catch up by early spring under an administration that has made crushing the virus its top priority and a Congress that is providing the resources to enable local health authorities to get the job done. The case for an upside near-term surprise stems from the notion that America’s solons have provided considerably more aid to households than was strictly necessary. As Chart I-7 showed, total employment fell by 25 million at the trough in April and close to 9 million fewer people are employed now than at the pre-pandemic peak. They can surely use a lifeline, along with the many Americans who are involuntarily working part time and those who are barely holding on even if they are fully employed. But they number far less than the 100 million households4 (two-thirds of all taxpayers) that received the full $1,800-per-adult economic impact payments ($1,200 last spring and $600 in January), and will be in line for another $1,400, as soon as March, under the terms of the new bill. Households who did not need the largesse have presumably saved the distributions, helping contribute to the $1.5 trillion of excess savings accumulated during the pandemic. Thanks to the transfers provided for by the CARES Act, our US Investment Strategy service estimates that aggregate household income from March through December was $450 billion greater than it would have been in the absence of COVID-19 (Table I-2). With the second round of direct payments amounting to about $150 billion and the third round likely to be more than double the second, household incomes will be boosted by another $500 billion and the excess savings horde will be on its way to $2 trillion and beyond. Even in a $21 trillion economy, that much dry powder has the potential to move the needle. Table I-2Households' Excess Pandemic Savings
March 2021
March 2021
In the absence of even a somewhat related antecedent, no one can say for sure how much of the excess savings will be spent. Ricardian equivalence, which posits that households will be reluctant to spend fiscal windfalls if they anticipate that they will have to pay for them with higher future taxes, and Milton Friedman’s permanent income hypothesis, which posits that consumption decisions are based on lifetime earnings, both suggest that the multiplier effect of the direct payments to households may not be all it's cracked up to be. Empirical evidence does not definitively support either model, but increased income has only accounted for a third of households’ mountain of savings in any event. The remaining two-thirds, amounting to over a trillion dollars, came from reduced consumption. Even if Ricardo’s and Friedman’s hypotheses are mostly on the mark, if much of the $1 trillion of 2020’s reduced consumption was merely deferred rather than destroyed (Box I-1), pent-up consumer demand could be significant. The range of potential outcomes is wide: on the one hand, money has tended to burn a hole in US households’ pockets; on the other, Ricardo and Friedman aren’t exactly Larry Kudlow or Peter Navarro. It is hard to assert with any conviction how much of the savings cache will be spent, or how quickly, but we highlight its presence to point out that near-term US growth could surprise to the upside. BOX I-1 Demand Deferral Or Demand Destruction? February’s Bank Credit Analyst presented a table with simple estimates of the US pandemic spending gap. It showed that spending on goods is tracking above the level that would have been expected if the pandemic had not occurred but that spending on services is down sharply, with an enormous gap in categories like food service, recreation and transportation. The fate of US households’ massive excess savings might come down to what happens to the forgone consumption. Consumption that is not deferred to some later period will simply disappear. Given that the consumption shortfall is entirely confined to services, the key question becomes: Is forgone services consumption more likely to turn into demand destroyed than forgone goods consumption? We suspect the answer is yes. Considering it from the perspective of the categories that suffered the biggest shortfalls, one cannot catch up by eating multiple restaurant dinners in a day, going back in time to attend last season’s sports and entertainment events, or taking more than one flight and staying in more than one hotel room. Services demand may also incorporate more of a discretionary component: one might want to go to a ballgame or a concert, or get out of town over a long weekend, but one eventually has to replace a sputtering car or refrigerator. Some forgone services demand likely turned into accelerated goods demand as white-collar workers redirected workday spending to building out office capabilities at home. Even more may have been diverted to home theater and exercise equipment, or to making one’s outdoor space into a more inviting place to while away the pandemic. The bottom line is that some goods demand appears to have been pulled forward by the pandemic while some services demand has likely been destroyed. There is surely pent-up consumer demand, and it will begin to be released once the pandemic has been subdued, but only some of the accumulated savings will be directed to satisfying it. Conclusions And Investment Recommendations For investors focused on the coming 6-12 months, the key takeaways from our analysis are as follows: Provided that official measures and personal vigilance continue to curtail COVID-19 until vaccinations can stifle it, the growth outlook should steadily improve. In the United States, where the federal government is determined to err on the side of providing too much fiscal support, growth could pick up a lot of steam. If enough pandemic-weary people fail to maintain their vigilance and observe social distancing measures, vaccine distribution efforts become snagged or vaccine-resistant strains emerge, growth could fall short of the consensus expectation embedded in financial market prices. Based on its plans to double down on its initial infusion of fiscal support, the US is the major economy most likely to exceed expectations, perhaps even to the point of overheating. After drilling into the increased income/foregone consumption components of the mountain of savings American households have amassed during the pandemic, however, we reiterate our conclusion that all of the savings will not be spent. The US economy will accelerate smartly this year but overheating is a low-probability event. Chart I-15The Coming Regional And Style Rotation
The Coming Regional And Style Rotation
The Coming Regional And Style Rotation
Given these conclusions, we recommend the following investment stance over the next 6-12 months: Overweight equities, which will generate excess returns over sovereign bonds and cash in the absence of a negative COVID surprise, and underweight fixed income. Maintain below-benchmark duration in fixed income portfolios. Underweight US stocks and overweight global ex-US stocks, which will benefit from the reopening of the global economy, and value over growth stocks, which will benefit from reopening and a steeper yield curve. The former broke out in January and held their lead last month (Chart I-15, top panel) while value is testing resistance at its 200-day moving average (Chart I-15, bottom panel). Underweight the US dollar versus the euro in particular and other more cyclical currencies in general. We do not expect the greenback to fall as sharply as it did last year from May through December but we do expect it will resume declining over the rest of the year. Doug Peta, CFA Chief US Investment Strategist dougp@bcaresearch.com February 25, 2021 Next Report: March 31, 2021 II. Requiem For Volcker And The Gipper For this month’s Special Report, we are sending you a collaboration between our US Investment Strategy and US Political Strategy teams. US Political Strategy is our newest strategy service and it extends the proprietary framework of our Geopolitical Strategy service to provide analysis of political developments that is relevant for US-focused investors. Please contact your relationship manager if you would like more information or to begin trialing the service. Ronald Reagan cast a long shadow over the elected officials who followed him … :The influence of the economic policies associated with Ronald Reagan held such persistent sway that even the Clinton and Obama administrations had to follow their broad outlines. … just as Paul Volcker did over central bankers at home and abroad … : The Volcker Fed’s uncompromising resistance to the 1970s’ runaway inflation established the Fed’s credibility and enshrined a new global central banking orthodoxy. … but it appears their enduring influence may have finally run its course … : The pandemic overrode everything else in real time, but investors may ultimately view 2020 as the year in which Democrats broke away from post-Reagan orthodoxy and the Fed decided Volcker’s vigilance was no longer relevant. … to investors’ potential chagrin: If inflation, big government and organized labor come back from the dead, globalization loses ground, regulation expands, anti-trust enforcement regains some bite and tax rates rise and become more progressive, then the four-decade investment golden age that Reagan and Volcker helped launch may be on its last legs. The pandemic dominated everything in real time in 2020, as investors scrambled to keep up with its disruptions and the countermeasures policymakers deployed to shelter the economy from them. With some distance, however, investors may come to view it as a year of two critical policy inflection points: the end of the Reagan fiscal era and the end of the Volcker monetary era. The shifts could mark a watershed because Reagan’s and Volcker’s enduring influence helped power an investment golden age that has lasted for nearly 40 years. What comes next may not be so supportive for financial markets. Political history often unfolds in cycles even if their starting and ending dates are never as clear cut in real life as they are in dissertations. Broadly, the FDR administration kicked off the New Deal era, a 48-year period of increased government involvement in daily life via the introduction and steady expansion of the social safety net, broadened regulatory powers and sweeping worker protections. It was followed by the 40-year Reagan era, with a continuous soundtrack of limited government rhetoric made manifest in policies that sought to curtail the spread of social welfare programs, deregulate commercial activity, devolve power to state and local government units and the private sector and push back against unions. The Obama and Trump administrations challenged different aspects of Reaganism, but the 2020 election cycle finally toppled it. Ordinarily, that might only matter to historians and political scientists, but the Reagan era coincided with a fantastic run in financial markets. So, too, did the inflation vigilance that lasted long after Paul Volcker’s 1979-1987 tenure at the helm of the Federal Reserve, which drove an extended period of disinflation, falling interest rates and rising central bank credibility. Our focus here is on fiscal policy, and we touch on monetary policy only to note that last summer’s revision of the Fed’s statement of long-run monetary policy goals shut the door on the Volcker era. The end of both eras could mark an inflection point in the trajectory of asset returns. The Happy Warrior The nine most terrifying words in the English language are, “I’m from the government, and I’m here to help.”5 Chart II-1After The Recession, Reagan Was A Hit
After The Recession, Reagan Was A Hit
After The Recession, Reagan Was A Hit
Ronald Reagan held his conservative views with the zeal of the convert that he was.6 Those views were probably to the right of much of the electorate, but his personal appeal was strong enough to make them palatable to a sizable majority (Chart II-1). Substitute “left” for “right” and the sentiment just as easily sums up FDR’s ability to get the New Deal off the ground. Personal magnetism played a big role in each era’s rise, with both men radiating relatability and optimism that imbued their sagging fellow citizens with a sense of comfort and security that made them willing to try something very different. 1980 was hardly 1932 on the distress scale, but America was in a funk after the upheaval of the sixties, the humiliating end to Vietnam, Watergate, stagflation and a term and a half of uninspiring and ineffectual presidential leadership. Enter the Great Communicator, whose initial weekly radio address evoked the FDR of the Fireside Chats – jovial, resolute and confident, with palpable can-do energy – buffed to a shine by a professional actor and broadcaster whose vocal inflections hit every mark.7 The Gipper,8 with his avuncular bearing, physical robustness and ever-present twinkle in his eye, was just what the country needed to feel better about itself. Reaganomics 101 Government does not tax to get the money it needs; government always finds a need for the money it gets.9 President Reagan’s economic plan had three simple goals: cut taxes, tame government spending and reduce regulation. From the start of his entry into politics in the mid-sixties, Reagan cast himself as a defender of hard-working Americans’ right to keep more of the fruits of their labor from a grasping federal government seeking funding for wasteful, poorly designed programs. He harbored an intense animus for LBJ’s Great Society, which extended the reach of the federal government in ways that he characterized as a drag on initiative, accomplishment and freedom, no matter how well intentioned it may have been. That message hung a historic loss on Barry Goldwater in 1964 when inflation was somnolent but it proved to be far more persuasive after the runaway inflation of the seventies exposed the perils of excessive government (Chart II-2). Chart II-2Inflation Rises When The Labor Market Heats Up
Inflation Rises When The Labor Market Heats Up
Inflation Rises When The Labor Market Heats Up
As the Reagan Foundation website describes the impact of his presidency’s economic policies, “Millions … were able to keep more of the money for which they worked so hard. Families could reliably plan a budget and pay their bills. The seemingly insatiable Federal government was on a much-needed diet. And businesses and individual entrepreneurs were no longer hassled by their government, or paralyzed by burdensome and unnecessary regulations every time they wanted to expand.” “In a phrase, the American dream had been restored.” The Enduring Reach Of Reaganomics I’m not in favor of abolishing the government. I just want to shrink it down to the size where we can drown it in the bathtub. – Grover Norquist Though President-Elect Clinton bridled at limited government’s inherent restrictions, bursting out during a transition briefing, “You mean to tell me that the success of the economic program and my re-election hinges on the Federal Reserve and a bunch of f***ing bond traders?” his administration largely observed them. This was especially true after the drubbing Democrats endured in the 1994 midterms, when the Republicans captured their first House majority in four decades behind the Contract with America, a skillfully packaged legislative agenda explicitly founded on Reagan principles. Humbled in the face of Republican majorities in both houses of Congress, and hemmed in by roving bands of bond vigilantes, Clinton was forced to tack to the center. James Carville, a leading architect of Clinton’s 1992 victory, captured the moment, saying, “I used to think that if there was reincarnation, I wanted to come back as the president or the pope or … a .400 … hitter. But now I would like to come back as the bond market. You can intimidate everybody.” Reagan’s legacy informed the Bush administration’s sweeping tax cuts (and its push to privatize social security), and forced the Obama administration to tread carefully with the stimulus package it devised to combat the Great Recession. Although the administration’s economic advisors considered the $787 billion (5%-of-peak-GDP) bill insufficient, political staffers carried the day and the price tag was kept below $800 billion to appease the three Republican senators whose votes were required to pass it. Even with the economy in its worst state since the Depression, the Obama administration had to acquiesce to Reaganite budget pieties if it wanted any stimulus bill at all. Its leash got shorter after it agreed with House Republicans to “sequester” excess spending under the Budget Control Act of 2011. On the Republican side of the aisle, Grover Norquist, who claims to have founded Americans for Tax Reform (ATR) at Reagan’s request, enforced legislative fealty to the no-new-tax mantra. ATR, which opposes all tax increases as a matter of principle, corrals legislators with the Taxpayer Protection Pledge, “commit[ting] them to oppose any effort to increase income taxes on individuals and businesses.” ATR’s influence has waned since its 2012 peak, when 95% of Republicans in Congress had signed the pledge, and Norquist no longer strikes fear in the hearts of Republicans inclined to waver on taxes. His declining influence is testament to Reaganism’s success on the one hand (the tax burden has already been reduced) and the fading appeal of its signature fiscal restraint on the other. Did Government Really Shrink? When the legend becomes fact, print the legend. – The Man Who Shot Liberty Valance For all of its denunciations of government spending, the Reagan administration ran up the largest expansionary budget deficits (as a share of GDP) of any postwar administration until the global financial crisis (Chart II-3). Although it aggressively slashed non-defense discretionary spending, it couldn’t cut enough to offset the Pentagon’s voracious appetite. The Reagan deficits were not all bad: increased defense spending hastened the end of the Cold War, so they were in a sense an investment that paid off in the form of the ‘90s peace dividend and the budget surpluses it engendered. Chart II-3Cutting The Federal Deficit Is Harder Than It Seems
Cutting The Federal Deficit Is Harder Than It Seems
Cutting The Federal Deficit Is Harder Than It Seems
Nonetheless, the Reagan experience reveals the uncomfortable truth that there is little scope for any administration or Congressional session to cut federal spending. Mandatory entitlement spending on social security, Medicare and Medicaid constitutes the bulk of federal expenditures (Chart II-4) and they are very popular with the electorate, as the Trump campaign shrewdly recognized in the 2016 Republican primaries (Table II-1). Discretionary spending, especially ex-defense, is a drop in the bucket, thanks largely to a Reagan administration that already cut it to the bone (Chart II-5). Chart II-4The Relentless Rise In Mandatory Spending ...
The Relentless Rise In Mandatory Spending ...
The Relentless Rise In Mandatory Spending ...
Chart II-5Overwhlems Any Plausible Discretionary Cuts
Overwhlems Any Plausible Discretionary Cuts
Overwhlems Any Plausible Discretionary Cuts
Table II-1How Trump Broke Republican Orthodoxy On Entitlement Spending
March 2021
March 2021
The Reagan tax cuts therefore accomplished the easy part of the “starve the beast” strategy but his administration failed to make commensurate cuts in outlays (Chart II-6). If overall spending wasn’t cut amidst oppressive inflation, while the Great Communicator was in the Oval Office to make the case for it to a considerably more fiscally conservative electorate, there is no chance that it will be cut this decade. As our Geopolitical Strategy service has flagged for several years, the median US voter has moved to the left on economic policy. Reagan-era fiscal conservatism has gone the way of iconic eighties features like synthesizers, leg warmers and big hair, even if it had one last gasp in the form of the post-crisis “Tea Party” and Obama’s compromise on budget controls. Chart II-6Grover Norquist Is Going To Need A Bigger Bathtub
Grover Norquist Is Going To Need A Bigger Bathtub
Grover Norquist Is Going To Need A Bigger Bathtub
Do Republicans Still Want The Reagan Mantle? Chart II-7“Limited Government” Falling Out Of Fashion
March 2021
March 2021
Reaganism is dead, killed by a decided shift in broad American public opinion, and within the Republican and Democratic parties themselves. Americans are just as divided today as they were in Reagan’s era about the size of the government but the trend since the late 1990s is plainly in favor of bigger government (Chart II-7). Recent developments, including the 2020 election, reinforce our conviction that trend will not reverse any time soon. The Republicans are the natural heirs of Reagan’s legacy. Much of President Trump’s appeal to conservatives lay in his successful self-branding as the new Reagan. Though he lacked the Gipper’s charisma and affability, his unapologetic assertion of American exceptionalism rekindled some of the glow of Morning-in-America confidence. Following the outsider trail blazed by Reagan, he lambasted the Washington establishment and promised to slash bureaucracy, deregulate the economy and shake things up. Trump’s signature legislative accomplishment was the largest tax reform since Reagan’s in 1986. He oversaw defense spending increases to take on China, which he all but named the new “evil empire.”10 Like Reagan, he was willing to weather criticism for face-to-face meetings with rival nations’ dictators. Even his trade protectionism had more in common with the Reagan administration than is widely recognized.11 Chart II-8Reagan’s Amnesty On Immigration
March 2021
March 2021
But major differences in the two presidents’ policy portfolios underline the erosion of the Reagan legacy’s hold. President Trump outflanked his Republican competitors for the 2016 nomination by running against cutting government spending – he was the only candidate who opposed entitlement reform. His signature proposal was to stem immigration by means of a Mexican border wall. While Reagan had sought to crack down on illegal immigration, he pursued a compromise approach and granted amnesty to 2.9 million illegal immigrants living in America to pass the Immigration Reform and Control Act of 1986, sparing businesses from having to scramble to replace them (Chart II-8). While Reagan curtailed non-defense spending, Trump signed budget-busting bills with relish, even before the COVID pandemic necessitated emergency deficit spending. Trump tried to use the power of government to intervene in the economy and alienated the business community, which revered Reagan, with his scattershot trade war. Trump’s greater hawkishness on immigration and trade and his permissiveness on fiscal spending differentiated him from Reagan orthodoxy and signaled a more populist Republican Party. Chart II-9Trump Could Start Third Party, Give Democrats A Decade-Plus Ascendancy
March 2021
March 2021
More fundamentally, Trump represents a new strain of Republican that is at odds with the party’s traditional support for big business and disdain for big government. If he leads that strain to take on the party establishment by challenging moderate Republicans in primary elections and insisting on running as the party’s next presidential candidate, the GOP will be swimming upstream in the 2022 and 2024 elections. It is too soon to make predictions about either of these elections other than to say that Trump is capable of splitting the party in a way not seen since Ross Perot in the 1990s or Theodore Roosevelt in the early 1900s (Chart II-9).12 If he does so, the Democrats will remain firmly in charge and lingering Reaganist policies will be actively dismantled. Even if the party manages to preserve its fragile Trumpist/traditionalist coalition, it is hard to imagine it will recover its appetite for shrinking entitlements, siding against labor or following a laissez-faire approach to corporate conduct and combinations. Republicans will pay lip service to fiscal restraint but Trump’s demonstration that austerity does not win votes will lead them to downplay spending cuts and entitlement reform as policy priorities – at least until inflation again becomes a popular grievance (Chart II-10). Republicans will also fail to gain traction with voters if they campaign merely on restoring the Trump tax cuts after Biden’s likely partial repeal of them. Support for the Tax Cut and Jobs Act hardly reached 40% for the general public and 30% for independents and it is well known that the tax reform did little to help Republicans in the 2018 midterm elections, when Democrats took the House (Chart II-11). Chart II-10Republicans Have Many Priorities Above Budget Deficits
March 2021
March 2021
Chart II-11Trump Tax Cuts Were Never Very Popular
March 2021
March 2021
On immigration the Republican Party will follow Trump and refuse amnesty. Immigration levels are elevated and Biden’s lax approach to the border, combined with a looming growth disparity with Latin America, will generate new waves of incomers and provoke a Republican backlash. On trade and foreign policy, Republicans will follow a synthesis of Reagan and Trump in pursuing a cold war with China. The Chinese economy is set to surpass the American economy by the year 2028 and is already bigger in purchasing power parity terms (Chart II-12). The Chinese administration is becoming more oppressive at home, more closed to liberal and western ideas, more focused on import substitution, and more technologically ambitious. The Chinese threat will escalate in the coming decade and the Republican Party will present itself as the anti-communist party by proposing a major military-industrial build-up. Yet it is far from assured that the Democrats will be soft on China, which is to say that they will not be able to cut defense spending substantially. Chart II-12China Is the New "Evil Empire" For GOP
China Is the New "Evil Empire" For GOP
China Is the New "Evil Empire" For GOP
Will Biden Take Up The Cause? One might ask if the Biden administration might seek to adopt some elements of the Reagan program. President Biden is among the last of the pro-market Democrats who emerged in the wake of the Reagan revolution. Those “third-way” Democrats thrived in the 1990s by accommodating themselves to Reagan’s free-market message while maintaining there was a place for a larger federal role in certain aspects of the economy and society. The 2020 election demonstrated that the Democrats’ political base is larger than the Republicans’ and third-way policies could be a way to make further inroads with affluent suburbanites who helped deliver Georgia and Virginia. Alas, the answer appears to be no. The Democrats’ base increasingly abhors Reagan-era economic and social policies, and the country’s future demographic changes reinforce the party’s current, progressive trajectory. That means fiery younger Democrats don’t have to compromise their principles with third-way policies when they can just wait for Texas to turn blue. Chart II-13Democrats Look To New Deal, Eschew ‘Third Way’
March 2021
March 2021
Biden has only been in office for one month but a rule of thumb is that his party will pull him further to the left the longer Republicans remain divided and ineffective. His cabinet appointments have been center-left, not far-left, though his executive orders have catered to the far-left, particularly on immigration. In order to pass his two major legislative proposals through an evenly split Senate he must appeal to Democratic moderates, as every vote in the party will be needed to get the FY2021 and FY2022 budget reconciliation bills across the line, with Vice President Kamala Harris acting as the Senate tie breaker. Nevertheless his agenda still highlights that the twenty-first century Democrats are taking a page out of the FDR playbook and unabashedly promoting big government solutions (Chart II-13). Biden’s $1.9 trillion American Rescue Plan is not only directed at emergency pandemic relief but also aims to shore up state and local finances, education, subsidized housing, and child care. His health care proposals include a government-provided insurance option (originally struck from the Affordable Care Act to secure its passage in 2010) and a role for Medicare in negotiating drug prices. And his infrastructure plan is likely to provide cover for a more ambitious set of green energy projects that will initiate the Democratic Party’s next big policy pursuit after health care: environmentalism. The takeaway is not that Biden’s administration is necessarily radical – he eschews government-administered health care and is only proposing a partial reversal of Trump’s tax cuts – but rather that his party has taken a decisive turn away from the “third-way” pragmatism that defined his generation of Democrats in favor of a return to the “Old-Left” and pro-labor policies of the New Deal era (Chart II-14). The party has veered to the left in reaction to the Iraq War, the financial crisis, and Trumpism. Vice President Harris, Biden’s presumptive heir, had the second-most progressive voting record during her time in the Senate and would undoubtedly install a more progressive cabinet. Table II-2 shows her voting record alongside other senators who ran against Biden in the Democratic primary election. All of them except perhaps Senator Amy Klobuchar stood to his left on the policy spectrum. Chart II-14Democrats Eschew Budget Constraints
March 2021
March 2021
Fundamentally the American electorate is becoming more open to a larger role for the government in the economy and society. While voters almost always prioritize the economy and jobs, policy preferences have changed. The morass of excessive inflation, deficits, taxation, regulation, strikes and business inefficiencies that gave rise to the Reagan movement is not remembered as ancient history – it is not even remembered. The problems of slow growth, inadequate health and education, racial injustice, creaky public services, and stagnant wages are by far the more prevalent concerns – and they require more, not less, spending and government involvement (Chart II-15). Insofar as voters worry about foreign threats they focus on the China challenge, where Biden will be forced to adopt some of Trump’s approach. Table II-2Harris Stood To The Left Of Democratic Senators
March 2021
March 2021
Chart II-15Public Concern For Economy Means Greater Government Help
March 2021
March 2021
When inflation picks up in the coming years, voters will not reflexively ask for government to be pared back so that the economy becomes more efficient, as they did once they had a taste of Reagan’s medicine in the early 1980s. Rather, they will ask the government to step in to provide higher wages, indexation schemes, price caps, and assistance for labor, as is increasingly the case. The ruling party will be offering these options and the opposition Republicans will render themselves obsolete if they focus single-mindedly on austerity measures. Americans will have to experience a recession caused by inflation – i.e. stagflation – before they call for anything resembling Reagan again. The Post-Reagan Market Landscape Many investors and conservative economists were shocked13 that the Bernanke Fed’s mix of zero interest rates and massive securities purchases did not foster runaway inflation and destroy the dollar. They failed to anticipate that widespread private-sector deleveraging would put a lid on money creation (and that other major central banks would follow in the Fed’s ZIRP and QE footsteps). But a longer view of four decades of disinflation suggests another conclusion: Taking away the monetary punch bowl when the labor party gets going and pursuing limited-government fiscal policy can keep inflation pressures from gaining traction. Globalization, technology-enabled elimination of many lower-skilled white-collar functions and the hollowing out of the organized labor movement all helped as well, though they helped foment a revolt among a meaningful segment of the Republican rank-and-file against Reagan-style policies. The Volcker Fed set the tone for pre-emptive monetary tightening and subsequent FOMCs have reliably intervened to cool off the economy when the labor market begins heating up. The Phillips Curve may be out of favor with investors, but wage inflation only gathers steam when the unemployment rate falls below its natural level (Chart II-16), and the Fed did not allow negative unemployment gaps to persist for very long in the Volcker era. Without wage inflation putting more money in the hands of a broad cross-section of households with a fairly high marginal propensity to consume, it’s hard to get inflation in consumer prices. Chart II-16Taking The Punch Bowl Away From The Union Hall
Taking The Punch Bowl Away From The Union Hall
Taking The Punch Bowl Away From The Union Hall
The Fed took the cyclical wind from the labor market’s sails but the Reagan administration introduced a stiff secular headwind when it crushed PATCO, the air traffic controllers’ union, in 1981, marking an inflection point in the relationship between management and labor. That watershed event opened the door for employers to deploy much rougher tactics against unions than they had since before the New Deal.14 Reagan’s championing of free markets helped establish globalization as an economic policy that the third-way Clinton administration eagerly embraced with NAFTA and a campaign to admit China to the WTO. The latter coincided with a sharp decline in labor’s share of income (Chart II-17). Chart II-17Outsourcing Has Not Been Good For US Labor
Outsourcing Has Not Been Good For US Labor
Outsourcing Has Not Been Good For US Labor
The core Reagan tenets – limited government, favoring management over labor, globalization, sleepy anti-trust enforcement, reduced regulation and less progressive tax systems with lower rates – are all at risk of Biden administration rollbacks. While the easy monetary/tight fiscal combination promoted a rise in asset prices rather than consumer prices ever since the end of the global financial crisis, today’s easy monetary/easy fiscal could promote consumer price inflation and asset price deflation. We do not think inflation will be an issue in 2021 but we expect it will in the later years of Biden’s term. Ultimately, we expect massive fiscal accommodation will stoke inflation pressures and those pressures, abetted by a Fed which has pledged not to pre-emptively remove accommodation when the labor market tightens, will eventually bring about the end of the bull market in risk assets and the expansion. Investment Implications Business revered the Reagan administration and investors rightfully associate it with the four-decade bull market that began early in its first term. Biden is no wild-eyed liberal, but rolling back core Reagan-era tenets has the potential to roll back juicy Reagan-era returns. Only equities have the lengthy data series to allow a full comparison of Reagan-era returns with postwar New Deal-era returns (Table II-3), but the path of Treasury bond yields in the three-decade bear market that preceded the current four-decade bull market suggests that bonds generated little, if any, real returns in the pre-Reagan postwar period (Chart II-18). Stagnant precious metal returns point to tame Reagan-era inflation and downward pressure on input costs. Table II-3Annualized Real Market Returns Before And After Reagan
March 2021
March 2021
Chart II-18Bond Investors Loved Volcker And The Gipper
Bond Investors Loved Volcker And The Gipper
Bond Investors Loved Volcker And The Gipper
Owning the market is not likely to be as rewarding going forward as it was in the Reagan era. Active management may again have its day in the sun as the end of the Reagan tailwinds open up disparities between sectors, sub-industries and individual companies. Even short-sellers may experience a renaissance. We recommend that multi-asset investors underweight bonds, especially Treasuries. We expect the clamor for bigger government will contribute to a secular bear market that could rival the one that persisted from the fifties to the eighties. Within Treasury portfolios, we would maintain below-benchmark duration and favor TIPS over nominal bonds at least until the Fed signals that its campaign to re-anchor inflation expectations higher has achieved its goal. Gold and/or other precious metals merit a place in portfolios as a hedge against rising inflation and other real assets, from land to buildings to other resources, are worthy of consideration as well. BCA has been cautioning of a downward inflection in long-run financial asset returns for a few years, based on demanding valuations and a steadily shrinking scope for ongoing declines in inflation and interest rates. Mean reversion has been part of the thesis as well; trees simply don’t grow to the sky. Now that the curtain has fallen on the Volcker and Reagan eras, the inevitable downward inflection has received a catalyst. We remain constructive on risk assets over the next twelve months, but we expect that intermediate- and long-term returns will fall well short of their post-1982 pace going forward. Doug Peta, CFA Chief US Investment Strategist dougp@bcaresearch.com Matt Gertken Vice President Geopolitical Strategy mattg@bcaresearch.com III. Indicators And Reference Charts BCA’s equity indicators continue to demonstrate that US stocks are running hot. Our technical, valuation, and speculation indicators are very extended, and margin debt has soared since the S&P 500 bottomed last spring. With so little room for error, a near-term pullback in stock prices remains a significant risk. Our monetary indicator extended its downtrend, reflecting a diminished intensity of monetary support, but it remains above the boom/bust line. The upshot is that while the marginal stimulus provided by monetary policy is falling, the level of stimulus from easy monetary conditions remains significant. Forward equity earnings are pricing in a remarkably swift earnings recovery, but after a third consecutive quarter of double-digit earnings beats, the 2021 earnings outlook continues to gather momentum. Net revisions and positive earnings surprises remain near multi-decade highs. Among global equities, the US extended its modest underperformance after a decade of leading the pack. China continues to outperform, though at a slower rate since it became the first country to escape COVID-19’s grip, while emerging markets and Australia have also outperformed. Euro area stocks continue to lag, but we expect they will eventually take their place among the cyclical winners later this year. The US 10-Year Treasury yield surged in February, following through on January’s convincing break above its 200-day moving average. Our technical indicator shows that long-dated bonds are firmly in oversold territory, though they remain extremely expensive. Our valuation index points to higher yields over the cyclical investment horizon even if the rate of ascent eventually slows. The technical and valuation profile is similar for the US dollar. The greenback is technically oversold, even after its modest rally, but it remains expensive according to our models. If our base-case Goldilocks scenario unfolds globally this year, the counter-cyclical dollar should encounter a mild headwind. As with Treasuries, we expect valuation to trump technicals and see the USD continuing to trend lower over the full year. Commodity prices are surging across the board, ex-gold. Sentiment is bullish and speculative positioning in the CFTC’s 17-commodity aggregate grouping is at its post-GFC high, although it may have peaked for the time being. The move in commodities underscores the risk-on profile across financial markets and aligns with EM, Chinese and Australian equity outperformance. US and global LEIs remain in a solid uptrend. A peak in our global LEI (GLEI) diffusion index suggests that the pace of advance in the GLEI will moderate, but the diffusion index has not yet fallen to a level that would herald a meaningful decline in the LEI. EQUITIES: Chart III-1US Equity Indicators
US Equity Indicators
US Equity Indicators
Chart III-2Willingness To Pay For Risk
Willingness To Pay For Risk
Willingness To Pay For Risk
Chart III-3US Equity Sentiment Indicators
US Equity Sentiment Indicators
US Equity Sentiment Indicators
Chart III-4Revealed Preference Indicator
Revealed Preference Indicator
Revealed Preference Indicator
Chart III-5US Stock Market Valuation
US Stock Market Valuation
US Stock Market Valuation
Chart III-6US Earnings
US Earnings
US Earnings
Chart III-7Global Stock Market And Earnings: Relative Performance
Global Stock Market And Earnings: Relative Performance
Global Stock Market And Earnings: Relative Performance
Chart III-8Global Stock Market And Earnings: Relative Performance
Global Stock Market And Earnings: Relative Performance
Global Stock Market And Earnings: Relative Performance
FIXED INCOME: Chart III-9US Treasurys And Valuations
US Treasurys And Valuations
US Treasurys And Valuations
Chart III-10Yield Curve Slopes
Yield Curve Slopes
Yield Curve Slopes
Chart III-11Selected US Bond Yields
Selected US Bond Yields
Selected US Bond Yields
Chart III-1210-Year Treasury Yield Components
10-Year Treasury Yield Components
10-Year Treasury Yield Components
Chart III-13US Corporate Bonds And Health Monitor
US Corporate Bonds And Health Monitor
US Corporate Bonds And Health Monitor
Chart III-14Global Bonds: Developed Markets
Global Bonds: Developed Markets
Global Bonds: Developed Markets
Chart III-15Global Bonds: Emerging Markets
Global Bonds: Emerging Markets
Global Bonds: Emerging Markets
CURRENCIES: Chart III-16US Dollar And PPP
US Dollar And PPP
US Dollar And PPP
Chart III-17US Dollar And Indicator
US Dollar And Indicator
US Dollar And Indicator
Chart III-18US Dollar Fundamentals
US Dollar Fundamentals
US Dollar Fundamentals
Chart III-19Japanese Yen Technicals
Japanese Yen Technicals
Japanese Yen Technicals
Chart III-20Euro Technicals
Euro Technicals
Euro Technicals
Chart III-21Euro/Yen Technicals
Euro/Yen Technicals
Euro/Yen Technicals
Chart III-22Euro/Pound Technicals
Euro/Pound Technicals
Euro/Pound Technicals
COMMODITIES: Chart III-23Broad Commodity Indicators
Broad Commodity Indicators
Broad Commodity Indicators
Chart III-24Commodity Prices
Commodity Prices
Commodity Prices
Chart III-25Commodity Prices
Commodity Prices
Commodity Prices
Chart III-26Commodity Sentiment
Commodity Sentiment
Commodity Sentiment
Chart III-27Speculative Positioning
Speculative Positioning
Speculative Positioning
ECONOMY: Chart III-28US And Global Macro Backdrop
US And Global Macro Backdrop
US And Global Macro Backdrop
Chart III-29US Macro Snapshot
US Macro Snapshot
US Macro Snapshot
Chart III-30US Growth Outlook
US Growth Outlook
US Growth Outlook
Chart III-31US Cyclical Spending
US Cyclical Spending
US Cyclical Spending
Chart III-32US Labor Market
US Labor Market
US Labor Market
Chart III-33US Consumption
US Consumption
US Consumption
Chart III-34US Housing
US Housing
US Housing
Chart III-35US Debt And Deleveraging
US Debt And Deleveraging
US Debt And Deleveraging
Chart III-36US Financial Conditions
US Financial Conditions
US Financial Conditions
Chart III-37Global Economic Snapshot: Europe
Global Economic Snapshot: Europe
Global Economic Snapshot: Europe
Chart III-38Global Economic Snapshot: China
Global Economic Snapshot: China
Global Economic Snapshot: China
Doug Peta, CFA Chief US Investment Strategist Footnotes 1 Every single adult taxpayer with adjusted gross income (AGI) of $75,000 or less (and every married filing jointly taxpayer with AGI of $150,000 or less) was eligible for the full payments, and taxpayers with AGIs below $99,000 and $198,000, respectively, were eligible for partial payments. 2 Giles, Chris. “OECD warns governments to rethink constraints on public spending,” Financial Times, January 4, 2021. OECD warns governments to rethink constraints on public spending | Financial Times (ft.com) Accessed February 20, 2021. 3 International Monetary Fund (IMF). 2020. Fiscal Monitor: Policies for the Recovery. Washington, October. p. ix. 4 An additional 20 million households have received partial payments. 5 August 12, 1986 Press Conference News Conference | The Ronald Reagan Presidential Foundation & Institute (reaganfoundation.org), accessed February 4, 2021. Reagan makes the quip in his prepared opening remarks. 6 Reagan was a Democrat until he entered politics in his fifties. He claimed to have voted for FDR four times. 7 April 3, 1982 Radio Address President Reagan's Radio Address to the Nation on the Program for Economic Recovery - 4/3/82 - YouTube, accessed February 4, 2021. 8 As an actor, Reagan was perhaps best known for his portrayal of Notre Dame football legend George Gipp, who is immortalized in popular culture as the subject of the “win one for the Gipper” halftime speech. 9 July 22, 1981 White House Remarks to Visiting Editors and Broadcasters reaganfoundation.org, accessed February 8, 2021. 10 Reagan famously urged his followers, in reference to the USSR, “I urge you to beware the temptation of pride—the temptation of blithely declaring yourselves above it all and label both sides equally at fault, to ignore the facts of history and the aggressive impulses of an evil empire.” See his “Address to the National Association of Evangelicals,” March 8, 1983, voicesofdemocracy.umd.edu. 11 Robert Lighthizer, the Trump administration trade representative who directed its tariff battles, was a veteran of Reagan’s trade wars against Japan in the 1980s. 12 “Exclusive: The Trump Party? He still holds the loyalty of GOP voters,” USA Today, February 21, 2021, usatoday.com. 13 Open Letter to Ben Bernanke,” November 15, 2010. Open Letter to Ben Bernanke | Hoover Institution Accessed February 23, 2021. 14 Please see the following US Investment Strategy Special Reports, “Labor Strikes Back, Parts 1, 2 and 3,” dated January 13, January 20 and February 3, 2020, available at usis.bcaresearch.com.