Equities

Highlights Ronald Reagan cast a long shadow over the elected officials who followed him … : The influence of the economic policies associated with Ronald Reagan held such persistent sway that even the Clinton and Obama administrations had to follow their broad outlines. … just as Paul Volcker did over central bankers at home and abroad … : The Volcker Fed’s uncompromising resistance to the 1970s’ runaway inflation established the Fed’s credibility and enshrined a new global central banking orthodoxy. … but it appears their enduring influence may have finally run its course … : The pandemic overrode everything else in real time, but investors may ultimately view 2020 as the year in which Democrats broke away from post-Reagan orthodoxy and the Fed decided Volcker’s vigilance was no longer relevant. … to investors’ potential chagrin: If inflation, big government and organized labor come back from the dead, globalization loses ground, regulation expands, anti-trust enforcement regains some bite and tax rates rise and become more progressive, then the four-decade investment golden age that Reagan and Volcker helped launch may be on its last legs. Feature The pandemic dominated everything in real time in 2020, as investors scrambled to keep up with its disruptions and the countermeasures policymakers deployed to shelter the economy from them. With some distance, however, investors may come to view it as a year of two critical policy inflection points: the end of the Reagan fiscal era and the end of the Volcker monetary era. The shifts could mark a watershed because Reagan’s and Volcker’s enduring influence helped power an investment golden age that has lasted for nearly 40 years. What comes next may not be so supportive for financial markets. Political history often unfolds in cycles even if their starting and ending dates are never as clear cut in real life as they are in dissertations. Broadly, the FDR administration kicked off the New Deal era, a 48-year period of increased government involvement in daily life via the introduction and steady expansion of the social safety net, broadened regulatory powers and sweeping worker protections. It was followed by the 40-year Reagan era, with a continuous soundtrack of limited government rhetoric made manifest in policies that sought to curtail the spread of social welfare programs, deregulate commercial activity, devolve power to state and local government units and the private sector and push back against unions. The Obama and Trump administrations challenged different aspects of Reaganism, but the 2020 election cycle finally toppled it. Ordinarily, that might only matter to historians and political scientists, but the Reagan era coincided with a fantastic run in financial markets. So, too, did the inflation vigilance that lasted long after Paul Volcker’s 1979-1987 tenure at the helm of the Federal Reserve, which drove an extended period of disinflation, falling interest rates and rising central bank credibility. Our focus here is on fiscal policy, and we touch on monetary policy only to note that last summer’s revision of the Fed’s statement of long-run monetary policy goals shut the door on the Volcker era. The end of both eras could mark an inflection point in the trajectory of asset returns. The Happy Warrior The nine most terrifying words in the English language are, “I’m from the government, and I’m here to help.”1 Ronald Reagan held his conservative views with the zeal of the convert that he was.2 Those views were probably to the right of much of the electorate, but his personal appeal was strong enough to make them palatable to a sizable majority (Chart 1). Substitute “left” for “right” and the sentiment just as easily sums up FDR’s ability to get the New Deal off the ground. Personal magnetism played a big role in each era’s rise, with both men radiating relatability and optimism that imbued their sagging fellow citizens with a sense of comfort and security that made them willing to try something very different. Chart 1After The Recession, Reagan Was A Hit
After The Recession, Reagan Was A Hit
After The Recession, Reagan Was A Hit
1980 was hardly 1932 on the distress scale, but America was in a funk after the upheaval of the sixties, the humiliating end to Vietnam, Watergate, stagflation and a term and a half of uninspiring and ineffectual presidential leadership. Enter the Great Communicator, whose initial weekly radio address evoked the FDR of the Fireside Chats – jovial, resolute and confident, with palpable can-do energy – buffed to a shine by a professional actor and broadcaster whose vocal inflections hit every mark.3 The Gipper,4 with his avuncular bearing, physical robustness and ever-present twinkle in his eye, was just what the country needed to feel better about itself. Reaganomics 101 Government does not tax to get the money it needs; government always finds a need for the money it gets.5 President Reagan’s economic plan had three simple goals: cut taxes, tame government spending and reduce regulation. From the start of his entry into politics in the mid-sixties, Reagan cast himself as a defender of hard-working Americans’ right to keep more of the fruits of their labor from a grasping federal government seeking funding for wasteful, poorly designed programs. He harbored an intense animus for LBJ’s Great Society, which extended the reach of the federal government in ways that he characterized as a drag on initiative, accomplishment and freedom, no matter how well intentioned it may have been. That message hung a historic loss on Barry Goldwater in 1964 when inflation was somnolent but it proved to be far more persuasive after the runaway inflation of the seventies exposed the perils of excessive government (Chart 2). Chart 2Inflation Rises When The Labor Market Heats Up
Inflation Rises When The Labor Market Heats Up
Inflation Rises When The Labor Market Heats Up
As the Reagan Foundation website describes the impact of his presidency’s economic policies, “Millions … were able to keep more of the money for which they worked so hard. Families could reliably plan a budget and pay their bills. The seemingly insatiable Federal government was on a much-needed diet. And businesses and individual entrepreneurs were no longer hassled by their government, or paralyzed by burdensome and unnecessary regulations every time they wanted to expand.” “In a phrase, the American dream had been restored.” The Enduring Reach Of Reaganomics I’m not in favor of abolishing the government. I just want to shrink it down to the size where we can drown it in the bathtub. – Grover Norquist Though President-Elect Clinton bridled at limited government’s inherent restrictions, bursting out during a transition briefing, “You mean to tell me that the success of the economic program and my re-election hinges on the Federal Reserve and a bunch of f***ing bond traders?” his administration largely observed them. This was especially true after the drubbing Democrats endured in the 1994 midterms, when the Republicans captured their first House majority in four decades behind the Contract with America, a skillfully packaged legislative agenda explicitly founded on Reagan principles. Humbled in the face of Republican majorities in both houses of Congress, and hemmed in by roving bands of bond vigilantes, Clinton was forced to tack to the center. James Carville, a leading architect of Clinton’s 1992 victory, captured the moment, saying, “I used to think that if there was reincarnation, I wanted to come back as the president or the pope or … a .400 … hitter. But now I would like to come back as the bond market. You can intimidate everybody.” Reagan’s legacy informed the Bush administration’s sweeping tax cuts (and its push to privatize social security), and forced the Obama administration to tread carefully with the stimulus package it devised to combat the Great Recession. Although the administration’s economic advisors considered the $787 billion (5%-of-peak-GDP) bill insufficient, political staffers carried the day and the price tag was kept below $800 billion to appease the three Republican senators whose votes were required to pass it. Even with the economy in its worst state since the Depression, the Obama administration had to acquiesce to Reaganite budget pieties if it wanted any stimulus bill at all. Its leash got shorter after it agreed with House Republicans to “sequester” excess spending under the Budget Control Act of 2011. On the Republican side of the aisle, Grover Norquist, who claims to have founded Americans for Tax Reform (ATR) at Reagan’s request, enforced legislative fealty to the no-new-tax mantra. ATR, which opposes all tax increases as a matter of principle, corrals legislators with the Taxpayer Protection Pledge, “commit[ting] them to oppose any effort to increase income taxes on individuals and businesses.” ATR’s influence has waned since its 2012 peak, when 95% of Republicans in Congress had signed the pledge, and Norquist no longer strikes fear in the hearts of Republicans inclined to waver on taxes. His declining influence is testament to Reaganism’s success on the one hand (the tax burden has already been reduced) and the fading appeal of its signature fiscal restraint on the other. Did Government Really Shrink? When the legend becomes fact, print the legend. – The Man Who Shot Liberty Valance For all of its denunciations of government spending, the Reagan administration ran up the largest expansionary budget deficits (as a share of GDP) of any postwar administration until the global financial crisis (Chart 3). Although it aggressively slashed non-defense discretionary spending, it couldn’t cut enough to offset the Pentagon’s voracious appetite. The Reagan deficits were not all bad: increased defense spending hastened the end of the Cold War, so they were in a sense an investment that paid off in the form of the ‘90s peace dividend and the budget surpluses it engendered. Chart 3Cutting The Federal Deficit Is Harder Than It Seems
Cutting The Federal Deficit Is Harder Than It Seems
Cutting The Federal Deficit Is Harder Than It Seems
Nonetheless, the Reagan experience reveals the uncomfortable truth that there is little scope for any administration or Congressional session to cut federal spending. Mandatory entitlement spending on social security, Medicare and Medicaid constitutes the bulk of federal expenditures (Chart 4) and they are very popular with the electorate, as the Trump campaign shrewdly recognized in the 2016 Republican primaries (Table 1). Discretionary spending, especially ex-defense, is a drop in the bucket, thanks largely to a Reagan administration that already cut it to the bone (Chart 5). Chart 4The Relentless Rise In Mandatory Spending ...
The Relentless Rise In Mandatory Spending ...
The Relentless Rise In Mandatory Spending ...
Chart 5Overwhlems Any Plausible Discretionary Cuts
Overwhlems Any Plausible Discretionary Cuts
Overwhlems Any Plausible Discretionary Cuts
Table 1How Trump Broke Republican Orthodoxy On Entitlement Spending
Requiem For Volcker And The Gipper
Requiem For Volcker And The Gipper
The Reagan tax cuts therefore accomplished the easy part of the “starve the beast” strategy but his administration failed to make commensurate cuts in outlays (Chart 6). If overall spending wasn’t cut amidst oppressive inflation, while the Great Communicator was in the Oval Office to make the case for it to a considerably more fiscally conservative electorate, there is no chance that it will be cut this decade. As our Geopolitical Strategy service has flagged for several years, the median US voter has moved to the left on economic policy. Reagan-era fiscal conservatism has gone the way of iconic eighties features like synthesizers, leg warmers and big hair, even if it had one last gasp in the form of the post-crisis “Tea Party” and Obama’s compromise on budget controls. Chart 6Grover Norquist Is Going To Need A Bigger Bathtub
Grover Norquist Is Going To Need A Bigger Bathtub
Grover Norquist Is Going To Need A Bigger Bathtub
Do Republicans Still Want The Reagan Mantle? Reaganism is dead, killed by a decided shift in broad American public opinion, and within the Republican and Democratic parties themselves. Americans are just as divided today as they were in Reagan’s era about the size of the government but the trend since the late 1990s is plainly in favor of bigger government (Chart 7). Recent developments, including the 2020 election, reinforce our conviction that that trend will not reverse any time soon. The Republicans are the natural heirs of Reagan’s legacy. Much of President Trump’s appeal to conservatives lay in his successful self-branding as the new Reagan. Though he lacked the Gipper’s charisma and affability, his unapologetic assertion of American exceptionalism rekindled some of the glow of Morning-in-America confidence. Following the outsider trail blazed by Reagan, he lambasted the Washington establishment and promised to slash bureaucracy, deregulate the economy and shake things up. Chart 7"Limited Government" Falling Out Of Fashion
Requiem For Volcker And The Gipper
Requiem For Volcker And The Gipper
Trump’s signature legislative accomplishment was the largest tax reform since Reagan’s in 1986. He oversaw defense spending increases to take on China, which he all but named the new “evil empire.”6 Like Reagan, he was willing to weather criticism for face-to-face meetings with rival nations’ dictators. Even his trade protectionism had more in common with the Reagan administration than is widely recognized.7 But major differences in the two presidents’ policy portfolios underline the erosion of the Reagan legacy’s hold. President Trump outflanked his Republican competitors for the 2016 nomination by running against cutting government spending – he was the only candidate who opposed entitlement reform. His signature proposal was to stem immigration by means of a Mexican border wall. While Reagan had sought to crack down on illegal immigration, he pursued a compromise approach and granted amnesty to 2.9 million illegal immigrants living in America to pass the Immigration Reform and Control Act of 1986, sparing businesses from having to scramble to replace them (Chart 8). While Reagan curtailed non-defense spending, Trump signed budget-busting bills with relish, even before the COVID pandemic necessitated emergency deficit spending. Trump tried to use the power of government to intervene in the economy and alienated the business community, which revered Reagan, with his scattershot trade war. Trump’s greater hawkishness on immigration and trade and his permissiveness on fiscal spending differentiated him from Reagan orthodoxy and signaled a more populist Republican Party. More fundamentally, Trump represents a new strain of Republican that is at odds with the party’s traditional support for big business and disdain for big government. If he leads that strain to take on the party establishment by challenging moderate Republicans in primary elections and insisting on running as the party’s next presidential candidate, the GOP will be swimming upstream in the 2022 and 2024 elections. It is too soon to make predictions about either of these elections other than to say that Trump is capable of splitting the party in a way not seen since Ross Perot in the 1990s or Theodore Roosevelt in the early 1900s (Chart 9).8 If he does so, the Democrats will remain firmly in charge and lingering Reaganist policies will be actively dismantled. Chart 8Reagan’s Amnesty On Immigration
Requiem For Volcker And The Gipper
Requiem For Volcker And The Gipper
Chart 9Trump Could Start Third Party, Give Democrats A Decade-Plus Ascendancy
Requiem For Volcker And The Gipper
Requiem For Volcker And The Gipper
Even if the party manages to preserve its fragile Trumpist/traditionalist coalition, it is hard to imagine it will recover its appetite for shrinking entitlements, siding against labor or following a laissez-faire approach to corporate conduct and combinations. Republicans will pay lip service to fiscal restraint but Trump’s demonstration that austerity does not win votes will lead them to downplay spending cuts and entitlement reform as policy priorities – at least until inflation again becomes a popular grievance (Chart 10). Republicans will also fail to gain traction with voters if they campaign merely on restoring the Trump tax cuts after Biden’s likely partial repeal of them. Support for the Tax Cut and Jobs Act hardly reached 40% for the general public and 30% for independents and it is well known that the tax reform did little to help Republicans in the 2018 midterm elections, when Democrats took the House (Chart 11). Chart 10Republicans Have Many Priorities Above Budget Deficits
Requiem For Volcker And The Gipper
Requiem For Volcker And The Gipper
On immigration the Republican Party will follow Trump and refuse amnesty. Immigration levels are elevated and Biden’s lax approach to the border, combined with a looming growth disparity with Latin America, will generate new waves of incomers and provoke a Republican backlash. Chart 11Trump Tax Cuts Were Never Very Popular
Requiem For Volcker And The Gipper
Requiem For Volcker And The Gipper
On trade and foreign policy, Republicans will follow a synthesis of Reagan and Trump in pursuing a cold war with China. The Chinese economy is set to surpass the American economy by the year 2028 and is already bigger in purchasing power parity terms (Chart 12). The Chinese administration is becoming more oppressive at home, more closed to liberal and western ideas, more focused on import substitution, and more technologically ambitious. The Chinese threat will escalate in the coming decade and the Republican Party will present itself as the anti-communist party by proposing a major military-industrial build-up. Yet it is far from assured that the Democrats will be soft on China, which is to say that they will not be able to cut defense spending substantially. Chart 12China Is the New "Evil Empire" For GOP
China Is the New "Evil Empire" For GOP
China Is the New "Evil Empire" For GOP
Will Biden Take Up The Cause? One might ask if the Biden administration might seek to adopt some elements of the Reagan program. President Biden is among the last of the pro-market Democrats who emerged in the wake of the Reagan revolution. Those “third-way” Democrats thrived in the 1990s by accommodating themselves to Reagan’s free-market message while maintaining there was a place for a larger federal role in certain aspects of the economy and society. The 2020 election demonstrated that the Democrats’ political base is larger than the Republicans’ and third-way policies could be a way to make further inroads with affluent suburbanites who helped deliver Georgia and Virginia. Alas, the answer appears to be no. The Democrats’ base increasingly abhors Reagan-era economic and social policies, and the country’s future demographic changes reinforce the party’s current, progressive trajectory. That means fiery younger Democrats don’t have to compromise their principles with third-way policies when they can just wait for Texas to turn blue. Biden has only been in office for one month but a rule of thumb is that his party will pull him further to the left the longer Republicans remain divided and ineffective. His cabinet appointments have been center-left, not far-left, though his executive orders have catered to the far-left, particularly on immigration. In order to pass his two major legislative proposals through an evenly split Senate he must appeal to Democratic moderates, as every vote in the party will be needed to get the FY2021 and FY2022 budget reconciliation bills across the line, with Vice President Kamala Harris acting as the Senate tie breaker. Nevertheless his agenda still highlights that the twenty-first century Democrats are taking a page out of the FDR playbook and unabashedly promoting big government solutions (Chart 13). Chart 13Democrats Look To New Deal, Eschew 'Third Way'
Requiem For Volcker And The Gipper
Requiem For Volcker And The Gipper
Biden’s $1.9 trillion American Rescue Plan is not only directed at emergency pandemic relief but also aims to shore up state and local finances, education, subsidized housing, and child care. His health care proposals include a government-provided insurance option (originally struck from the Affordable Care Act to secure its passage in 2010) and a role for Medicare in negotiating drug prices. And his infrastructure plan is likely to provide cover for a more ambitious set of green energy projects that will initiate the Democratic Party’s next big policy pursuit after health care: environmentalism. The takeaway is not that Biden’s administration is necessarily radical – he eschews government-administered health care and is only proposing a partial reversal of Trump’s tax cuts – but rather that his party has taken a decisive turn away from the “third-way” pragmatism that defined his generation of Democrats in favor of a return to the “Old-Left” and pro-labor policies of the New Deal era (Chart 14). The party has veered to the left in reaction to the Iraq War, the financial crisis, and Trumpism. Vice President Harris, Biden’s presumptive heir, had the second-most progressive voting record during her time in the Senate and would undoubtedly install a more progressive cabinet. Table 2 shows her voting record alongside other senators who ran against Biden in the Democratic primary election. All of them except perhaps Senator Amy Klobuchar stood to his left on the policy spectrum. Chart 14Democrats Eschew Budget Constraints
Requiem For Volcker And The Gipper
Requiem For Volcker And The Gipper
Fundamentally the American electorate is becoming more open to a larger role for the government in the economy and society. While voters almost always prioritize the economy and jobs, policy preferences have changed. The morass of excessive inflation, deficits, taxation, regulation, strikes and business inefficiencies that gave rise to the Reagan movement is not remembered as ancient history – it is not even remembered. The problems of slow growth, inadequate health and education, racial injustice, creaky public services, and stagnant wages are by far the more prevalent concerns – and they require more, not less, spending and government involvement (Chart 15). Insofar as voters worry about foreign threats they focus on the China challenge, where Biden will be forced to adopt some of Trump’s approach. Table 2Harris Stood To The Left Of Democratic Senators
Requiem For Volcker And The Gipper
Requiem For Volcker And The Gipper
Chart 15Public Concern For Economy Means Greater Government Help
Requiem For Volcker And The Gipper
Requiem For Volcker And The Gipper
When inflation picks up in the coming years, voters will not reflexively ask for government to be pared back so that the economy becomes more efficient, as they did once they had a taste of Reagan’s medicine in the early 1980s. Rather, they will ask the government to step in to provide higher wages, indexation schemes, price caps, and assistance for labor, as is increasingly the case. The ruling party will be offering these options and the opposition Republicans will render themselves obsolete if they focus single-mindedly on austerity measures. Americans will have to experience a recession caused by inflation – i.e. stagflation – before they call for anything resembling Reagan again. The Post-Reagan Market Landscape Many investors and conservative economists were shocked9 that the Bernanke Fed’s mix of zero interest rates and massive securities purchases did not foster runaway inflation and destroy the dollar. They failed to anticipate that widespread private-sector deleveraging would put a lid on money creation (and that other major central banks would follow in the Fed’s ZIRP and QE footsteps). But a longer view of four decades of disinflation suggests another conclusion: Taking away the monetary punch bowl when the labor party gets going and pursuing limited-government fiscal policy can keep inflation pressures from gaining traction. Globalization, technology-enabled elimination of many lower-skilled white-collar functions and the hollowing out of the organized labor movement all helped as well, though they helped foment a revolt among a meaningful segment of the Republican rank-and-file against Reagan-style policies. The Volcker Fed set the tone for pre-emptive monetary tightening and subsequent FOMCs have reliably intervened to cool off the economy when the labor market begins heating up. The Phillips Curve may be out of favor with investors, but wage inflation only gathers steam when the unemployment rate falls below its natural level (Chart 16), and the Fed did not allow negative unemployment gaps to persist for very long in the Volcker era. Without wage inflation putting more money in the hands of a broad cross-section of households with a fairly high marginal propensity to consume, it’s hard to get inflation in consumer prices. Chart 16Taking The Punch Bowl Away From The Union Hall
Taking The Punch Bowl Away From The Union Hall
Taking The Punch Bowl Away From The Union Hall
The Fed took the cyclical wind from the labor market’s sails but the Reagan administration introduced a stiff secular headwind when it crushed PATCO, the air traffic controllers’ union, in 1981, marking an inflection point in the relationship between management and labor. That watershed event opened the door for employers to deploy much rougher tactics against unions than they had since before the New Deal.10 Reagan’s championing of free markets helped establish globalization as an economic policy that the third-way Clinton administration eagerly embraced with NAFTA and a campaign to admit China to the WTO. The latter coincided with a sharp decline in labor’s share of income (Chart 17). Chart 17Outsourcing Has Not Been Good For US Labor
Outsourcing Has Not Been Good For US Labor
Outsourcing Has Not Been Good For US Labor
The core Reagan tenets – limited government, favoring management over labor, globalization, sleepy anti-trust enforcement, reduced regulation and less progressive tax systems with lower rates – are all at risk of Biden administration rollbacks. While the easy monetary/tight fiscal combination promoted a rise in asset prices rather than consumer prices ever since the end of the global financial crisis, today’s easy monetary/easy fiscal could promote consumer price inflation and asset price deflation. We do not think inflation will be an issue in 2021 but we expect it will in the later years of Biden’s term. Ultimately, we expect massive fiscal accommodation will stoke inflation pressures and those pressures, abetted by a Fed which has pledged not to pre-emptively remove accommodation when the labor market tightens, will eventually bring about the end of the bull market in risk assets and the expansion. Investment Implications Business revered the Reagan administration and investors rightfully associate it with the four-decade bull market that began early in its first term. Biden is no wild-eyed liberal, but rolling back core Reagan-era tenets has the potential to roll back juicy Reagan-era returns. Only equities have the lengthy data series to allow a full comparison of Reagan-era returns with postwar New Deal-era returns (Table 3), but the path of Treasury bond yields in the three-decade bear market that preceded the current four-decade bull market suggests that bonds generated little, if any, real returns in the pre-Reagan postwar period (Chart 18). Stagnant precious metal returns point to tame Reagan-era inflation and downward pressure on input costs. Chart 18Bond Investors Loved Volcker And The Gipper
Bond Investors Loved Volcker And The Gipper
Bond Investors Loved Volcker And The Gipper
Table 3Annualized Real Market Returns Before And After Reagan
Requiem For Volcker And The Gipper
Requiem For Volcker And The Gipper
Owning the market is not likely to be as rewarding going forward as it was in the Reagan era. Active management may again have its day in the sun as the end of the Reagan tailwinds open up disparities between sectors, sub-industries and individual companies. Even short-sellers may experience a renaissance. We recommend that multi-asset investors underweight bonds, especially Treasuries. We expect the clamor for bigger government will contribute to a secular bear market that could rival the one that persisted from the fifties to the eighties. Within Treasury portfolios, we would maintain below-benchmark duration and favor TIPS over nominal bonds at least until the Fed signals that its campaign to re-anchor inflation expectations higher has achieved its goal. Gold and/or other precious metals merit a place in portfolios as a hedge against rising inflation and other real assets, from land to buildings to other resources, are worthy of consideration as well. BCA has been cautioning of a downward inflection in long-run financial asset returns for a few years, based on demanding valuations and a steadily shrinking scope for ongoing declines in inflation and interest rates. Mean reversion has been part of the thesis as well; trees simply don’t grow to the sky. Now that the curtain has fallen on the Volcker and Reagan eras, the inevitable downward inflection has received a catalyst. We remain constructive on risk assets over the next twelve months, but we expect that intermediate- and long-term returns will fall well short of their post-1982 pace going forward. Doug Peta, CFA Chief US Investment Strategist dougp@bcaresearch.com Matt Gertken Vice President Geopolitical Strategy mattg@bcaresearch.com Appendix Table A1APolitical Capital: White House And Congress
Requiem For Volcker And The Gipper
Requiem For Volcker And The Gipper
Table A1BPolitical Capital: Household And Business Sentiment
Requiem For Volcker And The Gipper
Requiem For Volcker And The Gipper
Table A1CPolitical Capital: The Economy And Markets
Requiem For Volcker And The Gipper
Requiem For Volcker And The Gipper
Table A2Political Risk Matrix
Requiem For Volcker And The Gipper
Requiem For Volcker And The Gipper
Table A3Political Capital Index
Requiem For Volcker And The Gipper
Requiem For Volcker And The Gipper
Table A4Biden’s Cabinet Position Appointments
Requiem For Volcker And The Gipper
Requiem For Volcker And The Gipper
Footnotes 1 August 12, 1986 Press Conference News Conference | The Ronald Reagan Presidential Foundation & Institute (reaganfoundation.org), accessed February 4, 2021. Reagan makes the quip in his prepared opening remarks. 2 Reagan was a Democrat until he entered politics in his fifties. He claimed to have voted for FDR four times. 3 April 3, 1982 Radio Address President Reagan's Radio Address to the Nation on the Program for Economic Recovery - 4/3/82 - YouTube, accessed February 4, 2021. 4 As an actor, Reagan was perhaps best known for his portrayal of Notre Dame football legend George Gipp, who is immortalized in popular culture as the subject of the “win one for the Gipper” halftime speech. 5 July 22, 1981 White House Remarks to Visiting Editors and Broadcasters reaganfoundation.org, accessed February 8, 2021. 6 Reagan famously urged his followers, in reference to the USSR, “I urge you to beware the temptation of pride—the temptation of blithely declaring yourselves above it all and label both sides equally at fault, to ignore the facts of history and the aggressive impulses of an evil empire.” See his “Address to the National Association of Evangelicals,” March 8, 1983, voicesofdemocracy.umd.edu. 7 Robert Lighthizer, the Trump administration trade representative who directed its tariff battles, was a veteran of Reagan’s trade wars against Japan in the 1980s. 8 “Exclusive: The Trump Party? He still holds the loyalty of GOP voters,” USA Today, February 21, 2021, usatoday.com. 9 Open Letter to Ben Bernanke,” November 15, 2010. Open Letter to Ben Bernanke | Hoover Institution Accessed February 23, 2021. 10 Please see the following US Investment Strategy Special Reports, “Labor Strikes Back, Parts 1, 2 and 3,” dated January 13, January 20 and February 3, 2020, available at usis.bcaresearch.com.
US Treasury yields are rising on both higher inflation expectations and climbing real rates. This is causing some indigestion in equity markets, especially the tech heavy NASDAQ. Jerome Powell’s continued resolve to maintain the Fed’s accommodative forward…
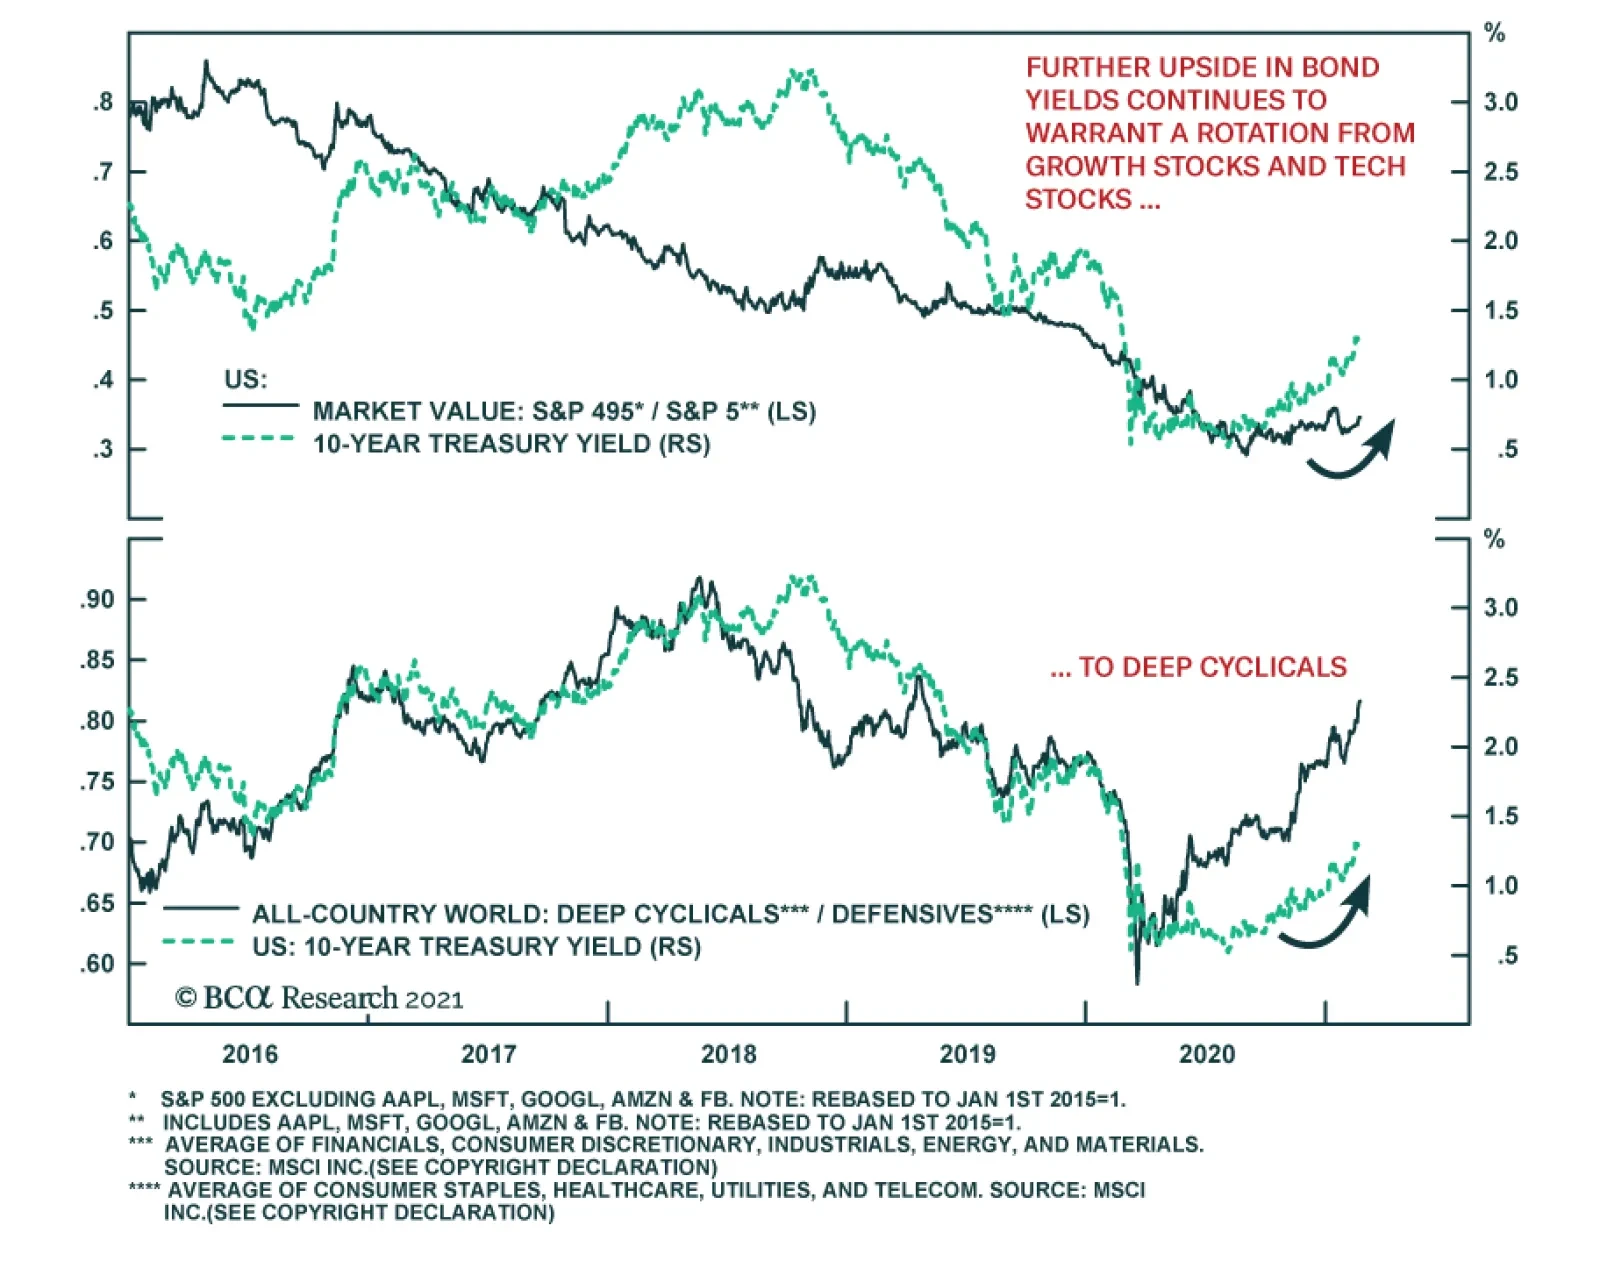
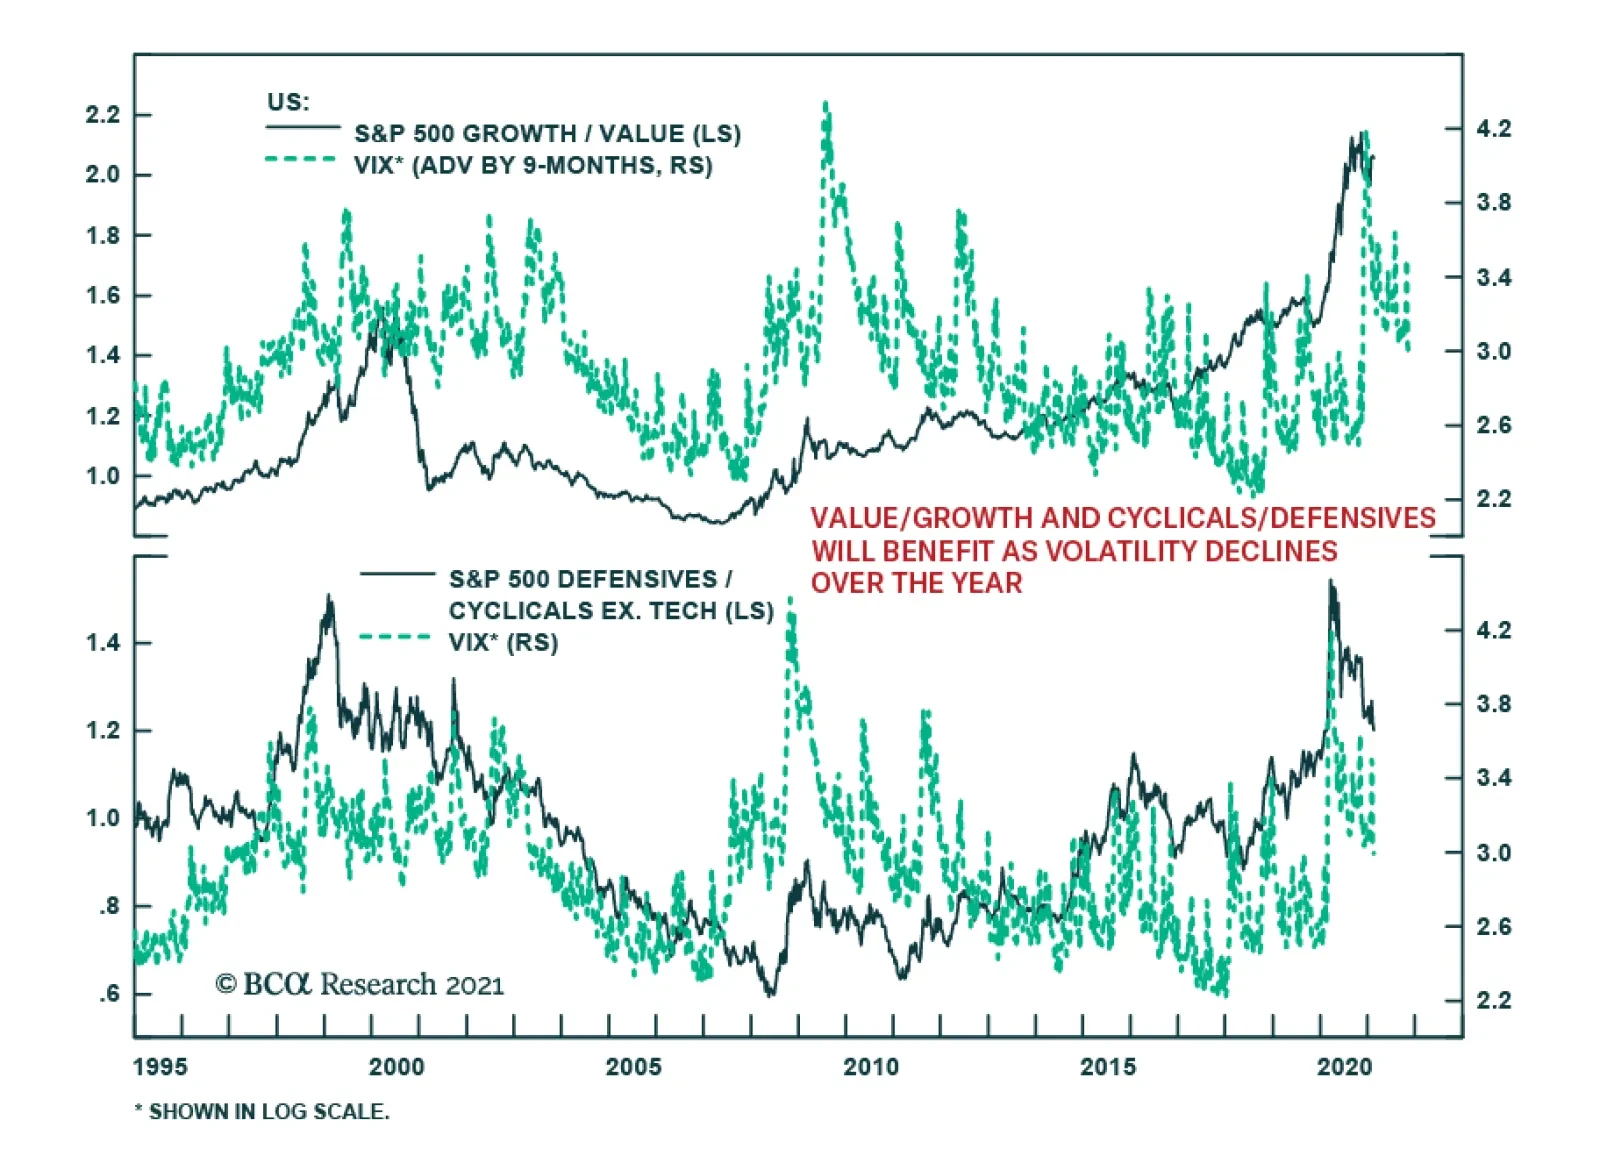
Crystalize Handsome Gains In The Deep Cyclicals/Defensives Portfolio Bent And Move To The Sidelines
Crystalize Handsome Gains In The Deep Cyclicals/Defensives Portfolio Bent And Move To The Sidelines
Yesterday our 2.5% rolling stop on the cyclicals vs. defensives ratio was triggered intraday and we are obeying this risk management metric we recently instituted to our portfolio, capitalizing 17% in gains since the July 27 2020 inception. This move pushes the ratio back down to neutral from previously overweight. To be clear, we do not recommend to flip positions i.e. to buy defensives at the expense of deep cyclicals, but given the plethora of warning signs from China that we highlighted in a recent Strategy Report on top of the relentless bond market sell off, the risk/reward trade-off of maintaining a cyclicals/defensives portfolio bent is no longer compelling. We will also be looking to reinstate a deep cyclical preference to our portfolio once the market offers a better entry point. Bottom Line: Obey the trailing stop and crystalize 17% in gains since last summer’s inception in the cyclicals vs. defensives portfolio bent, and downgrade it from overweight to neutral. Stay tuned.
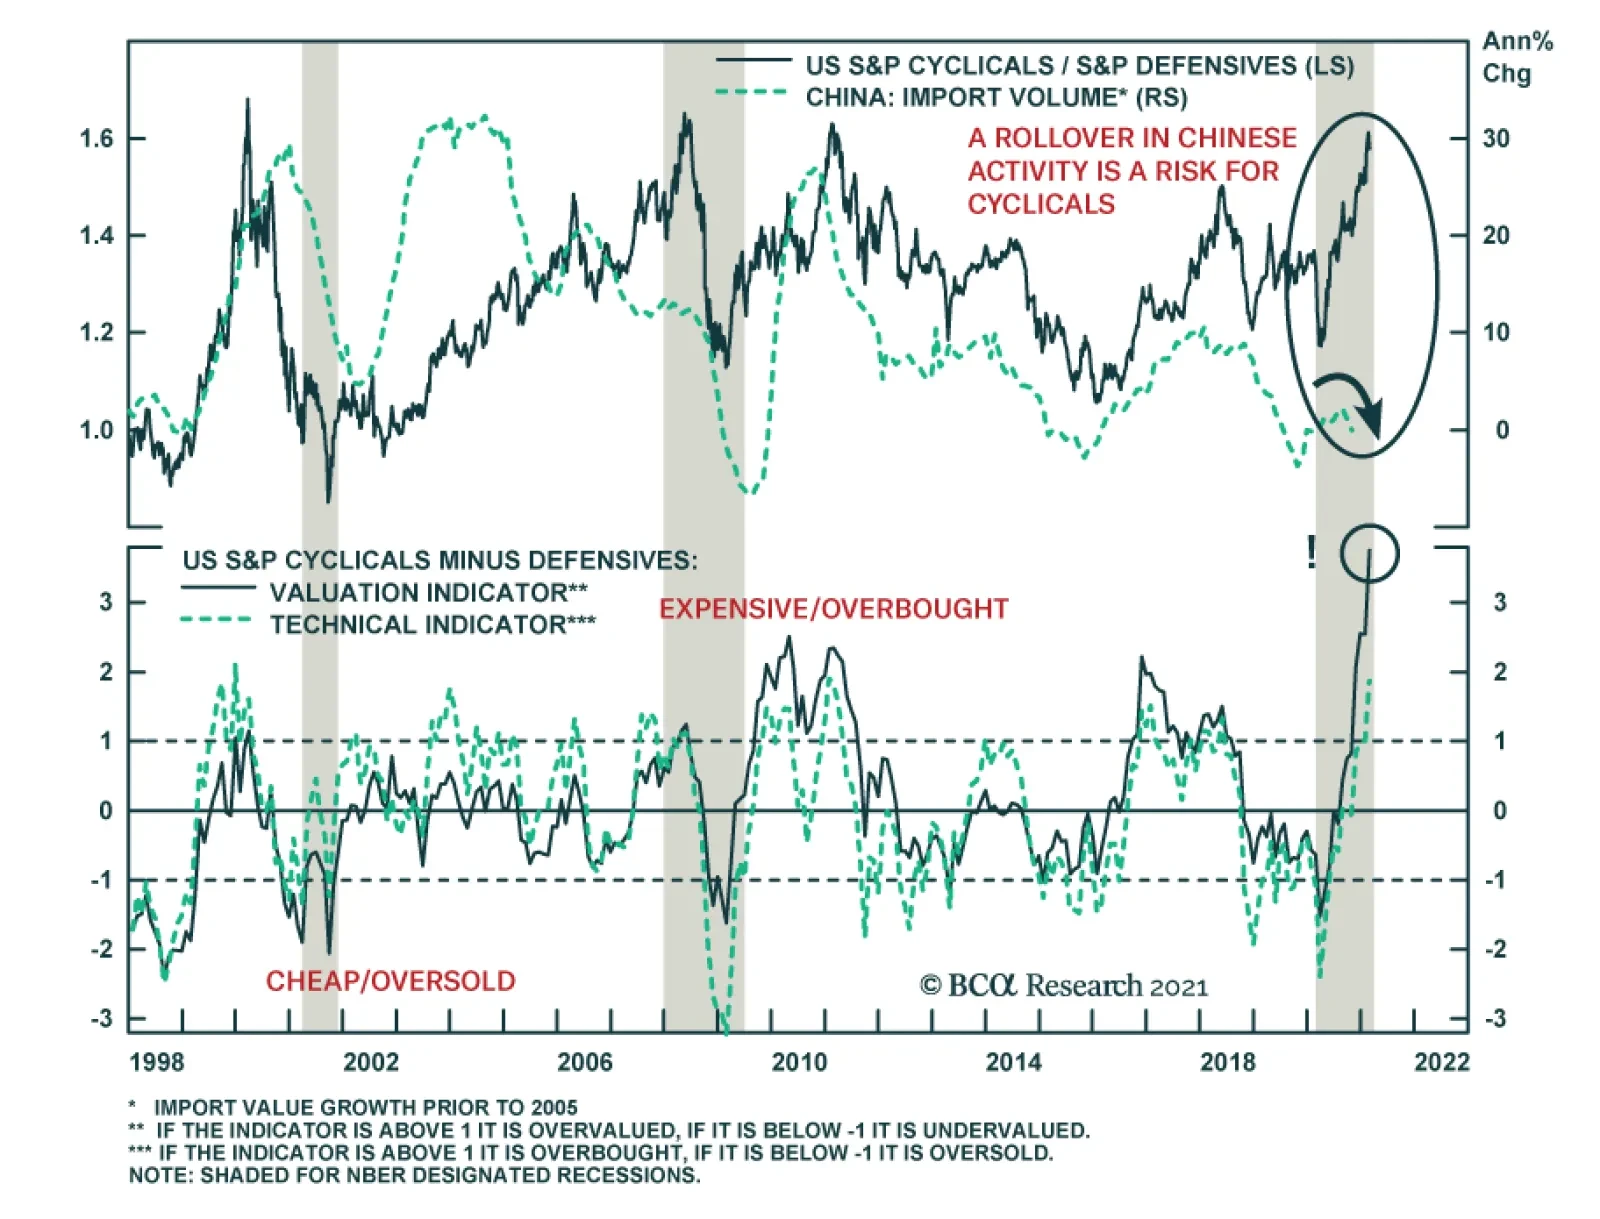
Since the onset of the recession, cyclical stocks have thwarted defensive ones. However, the performance of cyclicals relative to defensives is highly mean reverting, and now, it stands towards the top of its historical distribution, begging the question…
In an Insight late last week, we mentioned our rule of thumb that stocks cannot stomach more than 100-125bps tightening via a selloff in the 10-year US Treasury bond within a year. Applying this rule to the present-day suggests that equities will become turbulent should the 10-year US Treasury yield surpass 1.55% by March, 2.05% by June, and 1.75% by August. Today, we provide more color on this 100-125bps rule by looking at historical SPX drawdowns once yields sprint higher (please see chart on the next page). While the exact timing and the size of the drawdown varies from episode to episode, it is generally consistent with a roughly 10% pullback in the S&P 500 albeit with a 1-2 month lag following the trigger in our rule. We chose to examine data from 2009 onward thus only covering the QE era, which would increase the applicability of our analysis. Speaking of applicability, the 2009-2011 iterations provide the closest parallels as to what will likely take root this cycle as those iterations occurred in a post recessionary environment, which is similar to today. (We have drawn a number of parallels between circa 2010 and today in previous Insights, please see here, here and here). The 2009-2011 period also best aligns with the main reason for having this rule of thumb in the first place: to gauge the risk of interest rates undermining the market by weighing on the forward multiple component of price and/or via an economic slowdown because of tightening in monetary conditions. Before we conclude, a quick note on the taper tantrum and the 2016 iterations. During those periods the S&P 500 actually fell at the same time as yields rose (not after the rule was triggered), so technically we should not have counted that as a valid iteration on our chart. Bottom Line: Were the 10-year US Treasury yield to surpass 1.55% by March, 2.05% by June, and 1.75% by August, then the equity market will likely suffer a pullback especially given the absence of a valuation cushion.
The 100bps-125bps Rule Of Thumb
The 100bps-125bps Rule Of Thumb
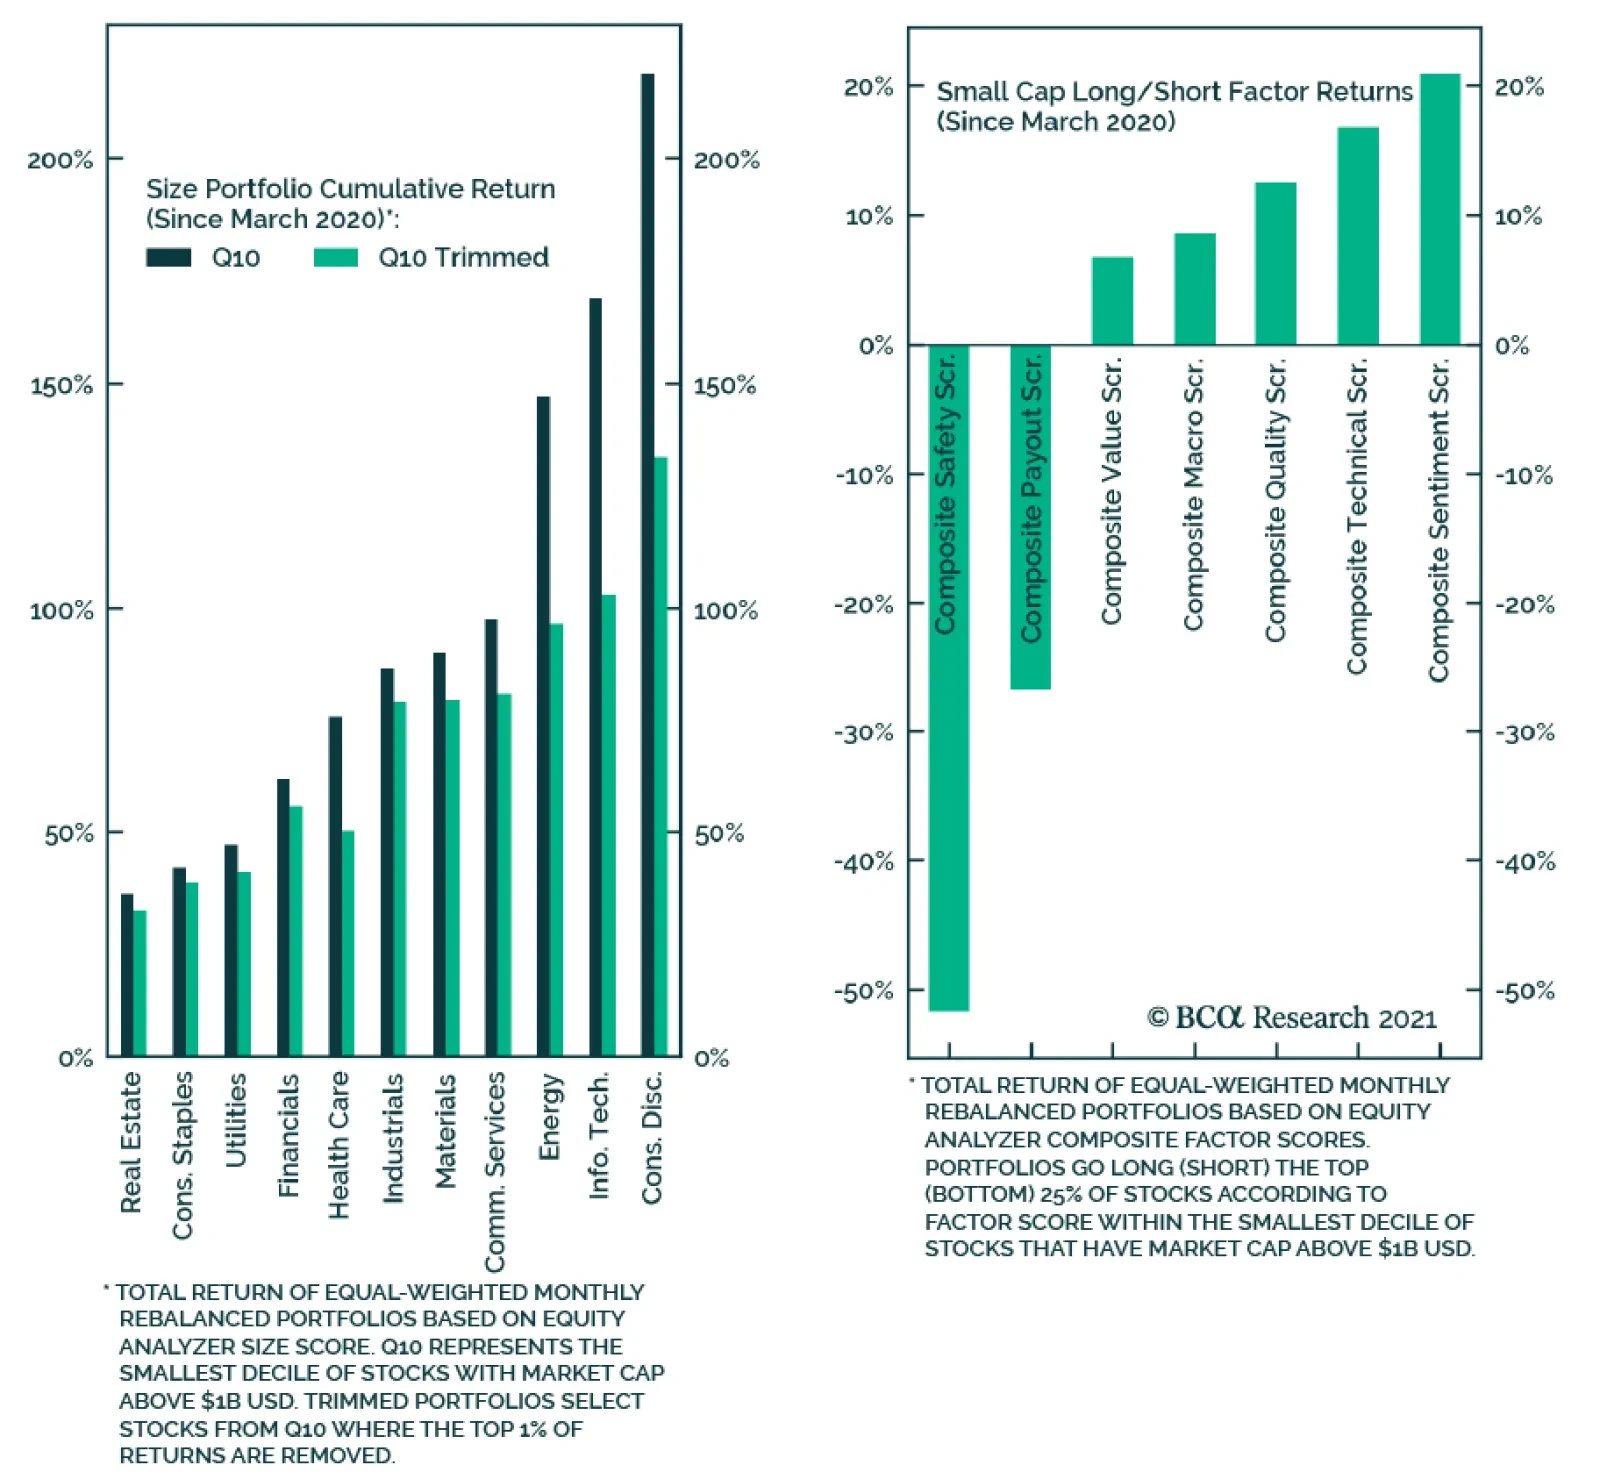
Since the end of September, the performance of small-cap equities has been stunning, with the Russell 2000 surging 53%, generating a more than 20% beat of the S&P 500. The over-representation of cyclical stocks within the small-cap benchmark only partly…
The Fed has telegraphed that they will not be backing down from QE and their ZIRP policy. The FOMC is not even thinking about thinking about tapering asset purchases despite a looming inflation spike in the coming months due to base effects that they vehemently deem transitory. Importantly, Charts 1 & 2 show that both the ISM’s manufacturing prices paid index and a sideways move in retail gasoline prices predict a surge in headline CPI in the April/May time frame as we first showed in a recent Special Report. Tack on a plethora of anecdotes regarding shortages and price hikes in a slew of industries and an inflationary spurt is already here. This week’s retail sales report also caused a jump in the Atlanta Fed’s GDPNow forecast for Q1 near double digit real GDP growth. More blow out output quarters are in the offing courtesy of the inoculation of the population and reopening of the economy and persistent government largesse. Thus, trust in the Fed’s ultra dovishness represents the biggest equity market risk in the coming months and there are high odds that the bond market will really test the Fed’s resolve. Chart 1
Litmus Test Looms
Litmus Test Looms
Chart 2
Litmus Test Looms
Litmus Test Looms
Our sense is that the Fed will initially ignore the spike in inflation at least until the summer, thus refraining from removing the proverbial “punch bowl”. However, if the market detects any signs of a “less dovish” Fed, especially if high inflation prints persist for whatever reason, risk premia will get repriced a lot higher. Finally, staying on the topic of interest rates, we have a long-held rule of thumb that stocks cannot stomach more than 100-125bps tightening via a selloff in the 10-year US Treasury bond on a year-over-year basis. In other words, were the 10-year US Treasury yield to surpass 1.55% by March, 2.05% by June, and 1.75% by August, then the equity market will likely suffer a pullback especially given the absence of a valuation cushion. Bottom Line: A marginally less dovish Fed represents a key risk for the broad equity market as inflation rears its ugly head in the coming months.
Highlights A rise in global bond yields has rarely been a reliable precursor of a stronger dollar. This is because the dollar reacts to interest-rate differentials, rather than the level of global yields. Changes in the dollar correlate with both the level and the rate of change in relative yields. A definitive shift to a bullish dollar stance will require a rise in relative US real rates in the order of 50-to-75 bps. Meanwhile, negative/low interest rates could have caused a swing in the currency/yield correlation, especially at the short end of the curve. In aggregate, the dollar responds to relative rates of return. This includes not only fixed income flows, but equity flows as well. As such, the US equity market also needs to outperform foreign bourses to make the case for a stronger dollar. The dollar is oversold and remains ripe for a countertrend bounce. This noise could be confused for a durable bullish signal. Feature Chart I-1No Rise In Real Yields
No Rise In Real Yields
No Rise In Real Yields
Global bond yields are on the rise, driven by the long end of the curve. This has included US yields, where the 10-year rate has bounced from a low of 36 bps last March to 130 bps today. Rising yields have important ramifications for equity prices (through the discount rate) and exchange rates. A rise in yields can be driven by prospects of either better growth, higher inflation expectations, or a combination of the two. This could bring forward expectations that the central bank will tighten monetary policy faster. In the case of the US and Eurozone, the culprit behind higher yields has been higher inflation expectations (Chart I-1). What does this mean for exchange rates? Are rising yields positive or negative for the dollar? Also, does it matter which component is driving yields higher – growth or inflation expectations? Finally, which currencies have historically benefited the most from an uptick in global yields? Correlation Between Yields And Exchange Rates Chart I-2Bond Yields And Currencies Often Diverge
Bond Yields And Currencies Often Diverge
Bond Yields And Currencies Often Diverge
The historical evidence is that there is little correlation between the dollar and the level or direction of global bond yields. Since the end of the Bretton Woods system in the 1970s, the trade-weighted dollar has appreciated while global bond yields have collapsed (Chart I-2). More important has been the path of relative interest rates. For example, the ebb and flow of EUR/USD has tracked the yield differential between Bund and Treasury yields since the 1970s (bottom panel Chart I-2). Currencies react more to the path of relative real rates than nominal rates. In theory, rising inflation is negative for a currency since its purchasing power is reduced. In a globally competitive system, the currency adjusts lower to equalize prices across borders. However, rising growth expectations allow policy rates to catch up with a higher neutral rate. This improves the relative rate of return for bond investors, allowing for capital inflows. Across the G10, there has been a longstanding relationship between real interest rate differentials and the path of the currency (Chart I-3A and Chart I-3B). Chart I-3ACurrencies Move With Relative Real Rates
Currencies Move With Relative Real Rates
Currencies Move With Relative Real Rates
Chart I-3BCurrencies Move With Relative Real Rates
Currencies Move With Relative Real Rates
Currencies Move With Relative Real Rates
Importantly, US real rates have not risen much against the rest of the world with the latest uptick in global bond yields. In fact, compared to countries such as Australia, the UK, Switzerland, and New Zealand, they have declined. This is negative for the dollar on the margin. While the direction of relative real rates is important, the absolute level of real yield spreads also matters for currency and bond investors. Chart I-4 shows that the dollar tends to respond to the level of real rates in the US, compared to the rest of the world. When US real rate differentials are positive, the dollar tends to appreciate on a year-over-year basis. Looking at a snapshot of global real yields, the US sits below the median (Chart I-5). Commodity-producing countries fare much better. So do Japan and Switzerland. Based on the historical precedent, US real rates will have to improve by about 50-to-100 bps to set the dollar up for structural upside. Chart I-4US Real Rates Are ##br##Still Low
US Real Rates Are Still Low
US Real Rates Are Still Low
Chart I-5US Real Rates Need 50-75 Bps Upside To Make Them Attractive
US Real Rates Need 50-75 Bps Upside To Make Them Attract
US Real Rates Need 50-75 Bps Upside To Make Them Attract
Bonds Versus Equities There are multiple drivers of exchange rates. Bond yields are just one of them. Equity flows also matter. One way to square the circle on whether the level of US real rates makes a difference for the dollar is through flow data. Foreign inflows into US Treasuries remain negative. This suggests that despite the rise in US nominal rates since March of last year, foreign investors are still not convinced they are sufficiently high to compensate for the rising US twin deficits. Rather, inflows into equities have been rather strong. This raises the prospect that the equity market has become an important driver of currency returns and will become the dominant driver going forward (Chart I-6). Importantly, the correlation between bond yields and exchange rates at very low rates is not straightforward. Bond investors span the duration spectrum, and 1-year, 2-year and even 5-year yield differentials are not meaningfully different across countries (Chart I-7). This is particularly the case if hedging costs are taken into consideration. It explains why currencies have not moved much in light of the violent moves at the long end of the yield curve, as shown in Chart I-3A and Chart I-3B. At times, the moves have been opposite to what economic theory would suggest. Chart I-6Foreign Investors Like US Equities, ##br##Not Bonds
Foreign Investors Like US Equities, Not Bonds
Foreign Investors Like US Equities, Not Bonds
Chart I-7A Regime Shift For Interest Rates And Currencies?
A Regime Shift For Interest Rates And Currencies?
A Regime Shift For Interest Rates And Currencies?
Chart I-8The CAD Is Not Driven By Relative Interest Rates, But Terms Of Trade
The CAD Is Not Driven By Relative Interest Rates, But Terms Of Trade
The CAD Is Not Driven By Relative Interest Rates, But Terms Of Trade
If a central bank explicitly targets a bond yield, that makes it difficult for that same yield to send a reliable signal about the economy. That is why at very low rates, markets start to gravitate to other indicators of growth. These include, but are not limited to, differences in PMI surveys or even commodity prices. For example, the performance of the Canadian dollar can be perfectly explained by the rise in Canadian terms of trade, even though real interest rate differentials between Canada and the US have not done much (Chart I-8). Rising oil prices are usually bullish for Canadian national income, on a relative basis. They are also bullish for Canadian equities that are more resource based. Inflows into these sectors tend to be positive for the currency. In the case of Europe, the euro has rolled over on the drop in relative real rates, but the gap in economic data surprises with the US has provided a far better explanation of euro underperformance in recent weeks. With domestic European economies in various lockdowns, economic data is becoming relatively weaker (Chart I-9). This is curbing growth, inflation, and interest rate expectations. Chart I-9Economic Divergences Explain EUR/USD, Rather Than Real Interest Rates
Economic Divergences Explain EUR/USD, Rather Than Real Interest Rates
Economic Divergences Explain EUR/USD, Rather Than Real Interest Rates
This brings up a bigger point. Flows tend to gravitate to capital markets with the highest expected returns, and this is certainly the case when cyclical versus defensive style tilts are concerned. This is important for currency strategy, since sector composition can drive a country’s equity returns. Higher yields tend to be beneficial for cyclical stocks, especially banks. In the case of Europe, the bourses are heavily weighted toward banks, industrials, and consumer discretionary sectors. Not only do these sectors need to do well for the equity market to outperform, they are also strongly tied to the performance of the domestic economy. That is why for the most part, both equity and currency relative performances tend to be in sync (Chart I-10). The bottom line is, to get the USD call right, investors should broaden their scope from relative bond yields to other drivers of currency returns. With most developed market interest rates near zero at the short end, relative bond yields matter less. More importantly, flows will be dictated by investors’ perceptions of where to find higher relative rates of return. This, in turn, will be based on relative growth fundamentals. Our bias is as follows: The US equity market has become very tech-heavy. Rising interest rates tend to hurt higher duration sectors such as tech and health care. At the margin, this hurts the relative performance of US equities. As such, rising rates will negatively impact the US equity market more, and will not derail our bearish dollar view (Chart I-11). Chart I-10The Dollar And Relative Stock Markets
The Dollar And Relative Stock Markets
The Dollar And Relative Stock Markets
Chart I-11Global Defensives And Interest Rates
Global Defensives And Interest Rates
Global Defensives And Interest Rates
The Signal And The Noise Chart I-12The Dollar Could Be Seasonally Strong
The Dollar Could Be Seasonally Strong
The Dollar Could Be Seasonally Strong
There are a few conclusions from the insights made above. First, US real interest rates have not meaningfully improved relative to the rest of the world. Second, a rise in US real rates of 50bps above the rest of the world would be required in order to seriously question our bearish dollar view, from a fixed income angle. Finally, sector performance matters a great deal, which means that the current rise in global bond yields is bearish for US stocks compared to non-US bourses. This places the US dollar at a very critical juncture. On the one hand, the dollar is still very oversold. Every time the dollar bounces from these oversold levels, the bulls rage forward, taking it as vindication that the uptrend has resumed. As we have highlighted, the DXY could hit 94 before working off oversold conditions. February and March tend to be excellent months for a rise in the DXY (Chart I-12). On the other hand, a rise in the dollar could be genuine confirmation that the US is leading the recovery both in terms of rates and equity performance. Weakness in the euro will not be particularly surprising, given the lopsided level of optimism. We remain bullish until the euro hits 1.35. The reality is that no one knows the trajectory of global growth in 2021, let alone how the relative growth profile between countries will play out. The euro area is heavily levered to global growth, hence we remain bullish EUR/USD. However, this view will change if the facts change. Meanwhile, in a higher inflationary environment, the outperformers tend to be the Norwegian krone and commodity currencies. This makes sense since commodity prices (and ultimately producer prices) tend to outperform in a period of rising inflation. It dovetails nicely with our high-conviction view to heavily overweight the Scandinavian currencies (Chart I-13). Chart I-13Rising Inflation Is Bullish For The NOK
Are Rising Bond Yields Bullish For The Dollar?
Are Rising Bond Yields Bullish For The Dollar?
Chester Ntonifor Foreign Exchange Strategist chestern@bcaresearch.com Currencies U.S. Dollar Chart II-1USD Technicals 1
USD Technicals 1
USD Technicals 1
Chart II-2USD Technicals 2
USD Technicals 2
USD Technicals 2
Recent data in the US have been rather robust: Inflation expectations are well anchored. The February 5-10 year survey from the University of Michigan pinned inflation expectations at 2.7% year-on-year. Core PPI came in at 2% year-on-year in January, blowing out expectations of a 1.1% rise. Retail sales galloped above expectations. The control group printed 6% month-on-month in January compared to expectations of a 1% rise. Housing starts declined month-on-month in January, but building permits rose so it’s a wash if rising rates are affecting cyclical spending in the US. The DXY index rose by around 30 bps this week. There is a clear tug-of-war in markets, with the Fed signaling that policy will remain easy as far as the eye can see, but bond markets pushing up longer-term rates. Our bias is that any pickup in inflation will prove transitory, vindicating Fed policy in 2021. Report Links: Are Rising Bond Yields Bullish For The Dollar? - February 19, 2021 Portfolio And Model Review - February 5, 2021 Sizing A Potential Dollar Bounce - January 15, 2021 The Euro Chart II-3EUR Technicals 1
EUR Technicals 1
EUR Technicals 1
Chart II-4EUR Technicals 2
EUR Technicals 2
EUR Technicals 2
Recent data from the euro area remain weak: The trade surplus widened to €27.5 billion in December. 4Q GDP slowed by 5% year-on-year, in line with expectations. The ZEW survey was a very positive surprise. The expectations component for February jumped from 58.3 to 69.6. The euro fell by 0.4% against the US dollar this week. The markets will keep oscillating between how deep the euro area slowdown will be for now, and the magnitude of any potential rebound. We are bullish on euro area growth, especially given tentative signs of a revival in animal spirits (proxied by the expectations component of the surveys). Report Links: Portfolio And Model Review - February 5, 2021 On Japanese Inflation And The Yen - January 29, 2021 The Dollar Conundrum And Protection - November 6, 2020 The Japanese Yen Chart II-5JPY Technicals 1
JPY Technicals 1
JPY Technicals 1
Chart II-6JPY Technicals 2
JPY Technicals 2
JPY Technicals 2
Recent data from Japan has been positive: 4Q GDP surprised to the upside, rising an annualized 12.7% quarter-on-quarter. Exports are booming, rising 6.4% year-on-year in December. The rise in machinery orders by 11.8% in December corroborated the positive contribution from CAPEX to GDP. The Japanese yen fell by 0.9% against the US dollar this week. As Japanese data surprised to the upside, inflation expectations also rose and depressed real rates. The drop in the yen signals the market might be pricing in that the BoJ will not fight strength in economic data with more tapering. We are long the yen as a portfolio hedge, but that view has been shaken by recent weakness. Report Links: On Japanese Inflation And The Yen - January 29, 2021 The Dollar Conundrum And Protection - November 6, 2020 The Near-Term Bull Case For The Dollar - February 28, 2020 British Pound Chart II-7GBP Technicals 1
GBP Technicals 1
GBP Technicals 1
Chart II-8GBP Technicals 2
GBP Technicals 2
GBP Technicals 2
Recent data out of the UK have been in line: 4Q GDP in the UK was slightly better than expected at 1% quarter-on-quarter. Core CPI for January came in at 1.4%, in line with expectations. House prices are soaring, rising 8.5% in December on a year-on-year basis. The pound was the best performing currency this week, rising about 1%. Our short EUR/GBP trade has benefited from faster vaccination in the UK (that could give way to a faster reopening of the economy) and a nice valuation starting point. We are tightening stops this week to protect profits. Report Links: Portfolio And Model Review - February 5, 2021 The Dollar Conundrum And Protection - November 6, 2020 Revisiting Our High-Conviction Trades - September 11, 2020 Australian Dollar Chart II-9AUD Technicals 1
AUD Technicals 1
AUD Technicals 1
Chart II-10AUD Technicals 2
AUD Technicals 2
AUD Technicals 2
The most important data this week from Australia was the employment report: There were 29.1K new jobs in January, in line with expectations. More importantly, there were 59K new full-time jobs, while part-time jobs fell by 29.8K. The unemployment rate declined from 6.6% to 6.4%. The Aussie was flat this week. When it comes to Covid-19, Australia ranks extremely well on a global scale. The number of new cases are low, the government has secured enough vaccines for the entire population and economic activity has rebounded given very close ties to China. We like the AUD, and are long versus the NZD. However, we expect that any positive surprises in the rest of the world will hurt AUD relative to the Americas. As such, we are short AUD/MXN. Report Links: Portfolio And Model Review - February 5, 2021 Australia: Regime Change For Bond Yields & The Currency? - January 20, 2021 An Update On The Australian Dollar - September 18, 2020 New Zealand Dollar Chart II-11NZD Technicals 1
NZD Technicals 1
NZD Technicals 1
Chart II-12NZD Technicals 2
NZD Technicals 2
NZD Technicals 2
There was scant data out of New Zealand this week: Net migration remained at a very low level of 415 individuals in December. The New Zealand dollar fell by 0.3% against the US dollar this week. The kiwi has catapulted itself to the most expensive currency in our PPP models. According to our attractiveness ranking, it is also the worst. We are already long AUD/NZD but are looking for more opportunities to short the kiwi at the crosses. Stay tuned. Report Links: Portfolio And Model Review - February 5, 2021 Currencies And The Value-Versus-Growth Debate - July 10, 2020 Updating Our Balance Of Payments Monitor - November 29, 2019 Canadian Dollar Chart II-13CAD Technicals 1
CAD Technicals 1
CAD Technicals 1
Chart II-14CAD Technicals 2
CAD Technicals 2
CAD Technicals 2
Recent data from Canada was positive: Housing starts rose by 282.4K, well above expectations for a January level of 228.3 K. Foreigners continued to by C$5 billion of securities in December. CPI was in line with expectations. The core median came in at 1.4% but the core trim was 1.8%, a nudge below the BoC range of 1-3%. The Canadian dollar was flat against the US dollar this week. The path of the CAD will be dictated by two factors – 1) relative economic growth between the US and the rest of the world (CAD benefits more from better US growth); and 2) the path of commodity prices, especially oil. Both remain positive for the CAD, as we alluded to last week. Report Links: Will The Canadian Recovery Lead Or Lag The Global Cycle? - February 12, 2021 Currencies And The Value-Versus-Growth Debate - July 10, 2020 More On Competitive Devaluations, The CAD And The SEK - May 1, 2020 Swiss Franc Chart II-15CHF Technicals 1
CHF Technicals 1
CHF Technicals 1
Chart II-16CHF Technicals 2
CHF Technicals 2
CHF Technicals 2
Recent data out of Switzerland have been flat: Core CPI came in at 0% in January, suggesting Switzerland has tentatively exited deflation (the print was -0.4% in December). January exports rebounded, even as watch sales remained quite weak. The Swiss franc fell by 0.7% against the US dollar this week. Safe-haven currencies were laggards, with only the Swiss franc lagging the Japanese yen. This is clearly a signal that the market remains very much in risk-on mode. We are long EUR/CHF on this basis, but short USD/JPY purely as portfolio insurance. Report Links: Portfolio And Model Review - February 5, 2021 The Dollar Conundrum And Protection - November 6, 2020 On The DXY Breakout, Euro, And Swiss Franc - February 21, 2020 Norwegian Krone Chart II-17NOK Technicals 1
NOK Technicals 1
NOK Technicals 1
Chart II-18NOK Technicals 2
NOK Technicals 2
NOK Technicals 2
The data out of Norway has been robust: 4Q mainland GDP came in at 1.9% quarter-on-quarter. Expectations were for a 1.3% rise. The trade balance exploded to NOK 23.1 billion in January. The Norwegian krone was flat against the US dollar this week, but outperformed the euro. The NOK is the perfect example of a currency on a coiled spring – cheap valuations, a liquidity discount, and primed to benefit from the global economic rebound. We are long the NOK against the euro, loonie, and USD. Report Links: Portfolio And Model Review - February 5, 2021 Revisiting Our High-Conviction Trades - September 11, 2020 A New Paradigm For Petrocurrencies - April 10, 2020 Swedish Krona Chart II-19SEK Technicals 1
SEK Technicals 1
SEK Technicals 1
Chart II-20SEK Technicals 2
SEK Technicals 2
SEK Technicals 2
The most important data from Sweden this week was the CPI: The headline measure for January came in at 1.6%, in line with expectations. The core measure at 1.8% was also in line with expectations. The Swedish krona was flat against the US dollar this week. The Swedish COVID-19 experiment is coming home to roost. On the one hand, much higher cases compared to Norway have dampened economic activity as people voluntarily try to avoid infection. Sweden chose to keep its economy largely open. On the other hand, Sweden is a highly levered play on the global cycle. We think the latter will dominate, and so are positive on the krona. Report Links: Revisiting Our High-Conviction Trades - September 11, 2020 Updating Our Balance Of Payments Monitor - November 29, 2019 Where To Next For The US Dollar? - June 7, 2019 Trades & Forecasts Forecast Summary Core Portfolio Tactical Trades Limit Orders Closed Trades
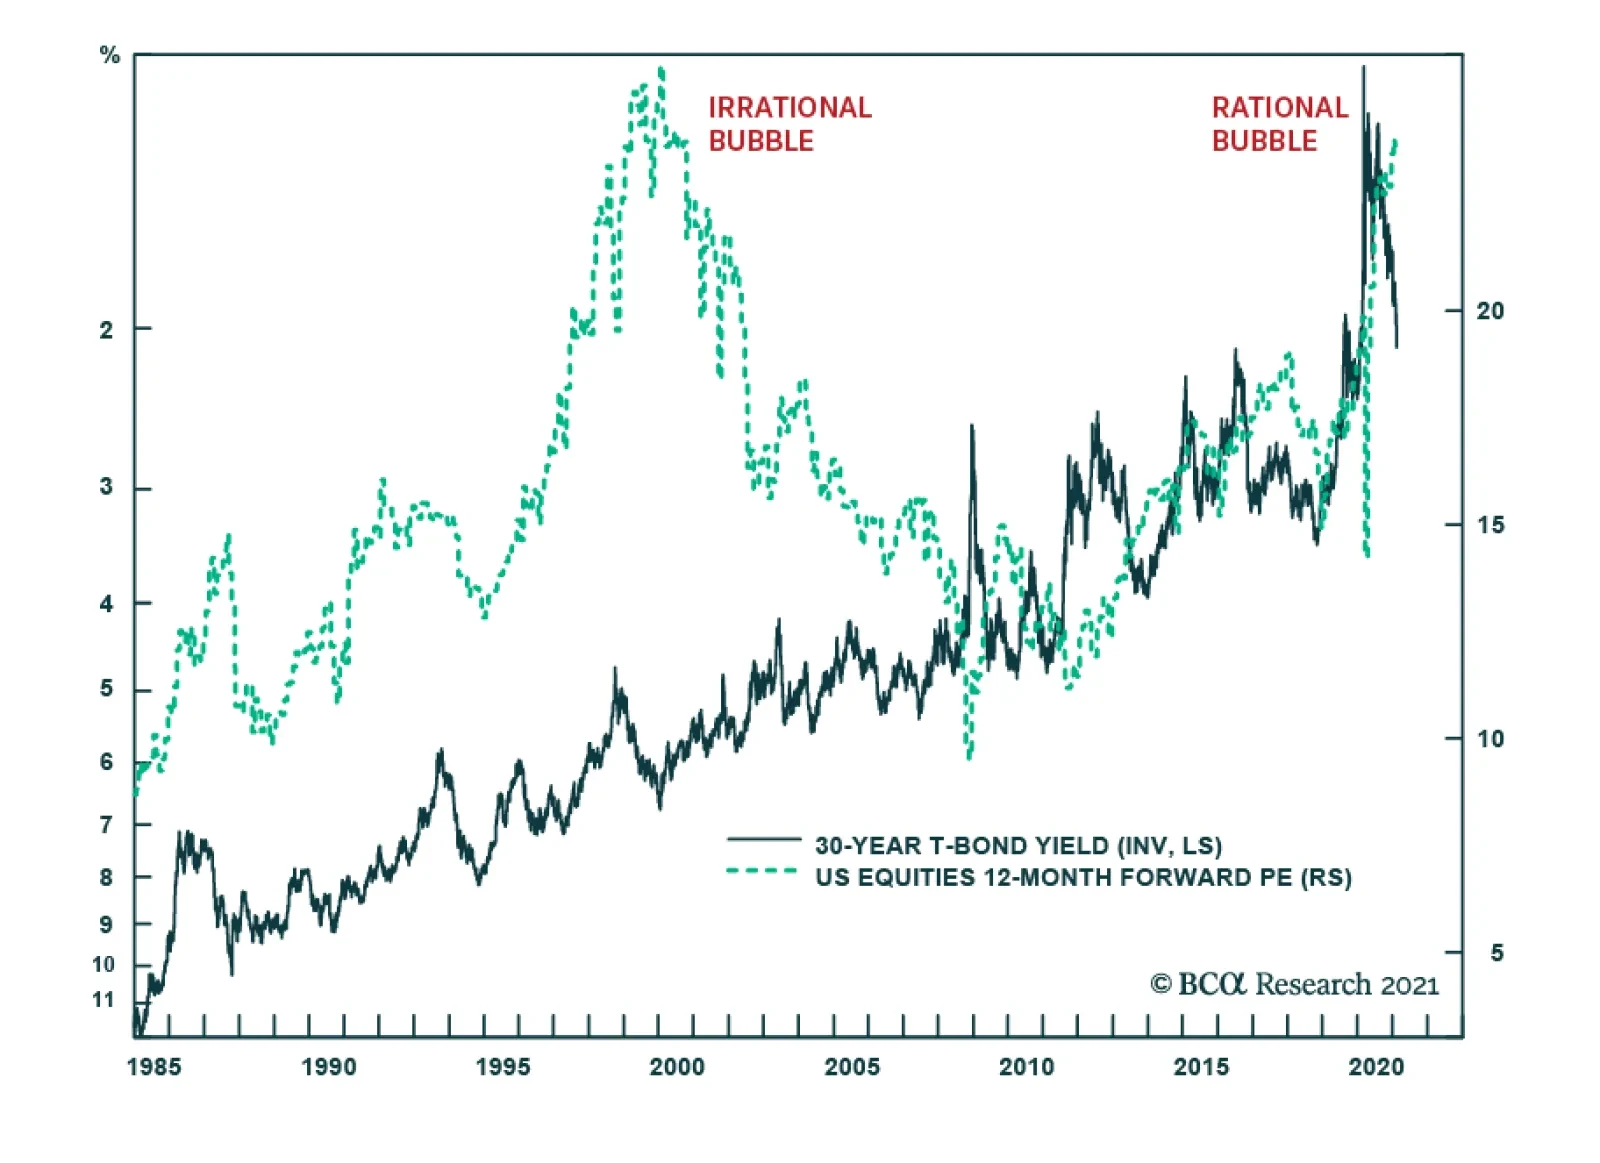
According to BCA Research’s European Investment Strategy service, the post-2008 boom in risk-asset valuations is rational given the exponential relationship with collapsing bond yields. However, over the past few months, the stock market’s forward…
Last Friday, the VIX closed below 20 for the first time since February 2020. Uncertainty abounds regarding the outlook for inflation, central bank reaction functions, and COVID-19 variants, among others. However, ebbing COVID-19 infections and the broadening…