Equities

Global equity valuations are at a level where they are very sensitive to changes in the discount rate. Chart 1 shows that the cyclically-adjusted earnings yield on the S&P 500 is slightly below its 2000 low. Equity investors have thus far taken comfort from the fact that US bond yields have been depressed, and taking into consideration low bond yields the US equity market is not as bubbly as it was in the 2000s. Chart 1Rising US Bond Yields Threatens US Equity Valuations
Rising US Bond Yields Threatens US Equity Valuations
Rising US Bond Yields Threatens US Equity Valuations
However, the fact that the US equity market’s valuations after accounting for the level of interest rates are not as expensive as they were in 2000 does not mean share prices cannot experience a meaningful shakeout. Notably, there is a lot of speculation and euphoria among investors, reminiscent of the late 1990s (please refer to Charts 24-26 below). Critically, when equity multiples are very elevated and bond yields are extremely low, the sensitivity of multiples to interest rates is most pronounced. Hence, rising US Treasury yields could result in a setback in share prices. All in all, our themes for now are as follows: Chart 2A Full-Fledged Mania In Asian TMT Stocks
A Full-Fledged Mania In Asian TMT Stocks
A Full-Fledged Mania In Asian TMT Stocks
Enormous US fiscal and monetary stimulus, strong economic growth and supply bottlenecks will push up the US core inflation rate. As a result, the ongoing sell-off in long-term US bond yields will continue. EM and DM credit spreads are currently very tight and credit spreads might not be able to compress further to offset the rise in US Treasury yields. Hence, rising US Treasury yields will trigger higher corporate and EM sovereign bond yields. In brief, rising EM bond yields is the key risk to EM share prices. Charts 5 and 6 below illustrate these points. Given that the US trade-weighted dollar is extremely oversold, rising US Treasury yields will likely trigger a countertrend rally in the greenback. This will cause a shakeout in EM currencies, fixed-income markets and commodities prices. Historically, the greenback has not had a stable relationship with US Treasury yields – they were both positively and negatively correlated in different periods. In such an environment, DM growth stocks will underperform DM value stocks. We have less conviction in growth/value performance in the EM space. The reason lies in the speculative frenzy taking place in Chinese new economy stocks trading in Hong Kong as well as tech share prices in Korea and Taiwan. As Chart 2 reveals, the Hang Seng Tech index and EM TMT stocks have been rising exponentially. Visibility is very low. The timing of a reversal of this equity euphoria is impossible to predict. Outside these TMT stocks, the relative performance of EM equities has been rather underwhelming, as is illustrated in Charts 71-73. Notably, the economic recovery in EM ex-China, Korea and Taiwan has been much weaker than those in DM and North Asian economies (please refer to Charts 63 and 66). This will continue as many of these nations are lagging in vaccine rollouts and their fiscal and monetary support has been much smaller. In addition, peak stimulus in China means that the mainland’s construction and infrastructure investment will slow meaningfully in H2 2021. This is another risk to EM economies supplying to China. Weighing pros and cons, we continue to recommend a neutral allocation to EM in a global equity portfolio. The same is true for EM credit (sovereign and corporate) within a global credit portfolio. For local bonds, inflation in EM – including China – is still very low and will likely stay depressed. As a result, we continue recommending receiving 10-year swap rates in Mexico, Colombia, Russia, Malaysia, India and China. Investors should use a rebound in the US dollar to transition from receiving rates to being long on cash bonds. Arthur Budaghyan Chief Emerging Markets Strategist arthurb@bcaresearch.com Yellow Flags For Share Prices Rising US corporate bond yields pose a risk to the equity rally. Interestingly, New Zealand’s stock market has begun correcting. Often but not always, this development heralds a pullback in EM share prices (albeit for unknown reasons). Chart 3Yellow Flags For Share Prices
Yellow Flags For Share Prices
Yellow Flags For Share Prices
Chart 4Yellow Flags For Share Prices
Yellow Flags For Share Prices
Yellow Flags For Share Prices
Beware Of Potential Rise In EM Sovereign And Corporate USD Bond Yields Historically, rising EM corporate USD bond yields led to a selloff in EM share prices. If rising US Treasury yields begin pushing up EM sovereign and corporate bonds yields, which is quite likely, the EM equity rally will be jeopardized. Chart 5Beware Of Potential Rise In EM Sovereign And Corporate USD Bond Yields
Beware Of Potential Rise In EM Sovereign And Corporate USD Bond Yields
Beware Of Potential Rise In EM Sovereign And Corporate USD Bond Yields
Chart 6Beware Of Potential Rise In EM Sovereign And Corporate USD Bond Yields
Beware Of Potential Rise In EM Sovereign And Corporate USD Bond Yields
Beware Of Potential Rise In EM Sovereign And Corporate USD Bond Yields
EM Equities Are Ignoring Many Warning Signs Due To Profit Recovery So far, the EM equity index has snubbed the rollover in China’s credit impulse and plummeting gold prices in non-US dollar currencies. The ongoing EM corporate earnings recovery has justified the rally in of share prices. However, much of the good news has already been priced in. Chart 7EM Equities Are Ignoring Many Warning Signs Due To Profit Recovery
EM Equities Are Ignoring Many Warning Signs Due To Profit Recovery
EM Equities Are Ignoring Many Warning Signs Due To Profit Recovery
Chart 8EM Equities Are Ignoring Many Warning Signs Due To Profit Recovery
EM Equities Are Ignoring Many Warning Signs Due To Profit Recovery
EM Equities Are Ignoring Many Warning Signs Due To Profit Recovery
Chart 9EM Equities Are Ignoring Many Warning Signs Due To Profit Recovery
EM Equities Are Ignoring Many Warning Signs Due To Profit Recovery
EM Equities Are Ignoring Many Warning Signs Due To Profit Recovery
Investors Are Super Bullish European investors are very bullish on EM equities and European growth. From a contrarian perspective, this does not always herald a bear market but suggests that odds of a meaningful shakeout are non-trivial. Chart 10Investors Are Super Bullish
Investors Are Super Bullish
Investors Are Super Bullish
Chart 11Investors Are Super Bullish
Investors Are Super Bullish
Investors Are Super Bullish
Investor Growth Expectations Are Super High Our proxy for global growth expectations as well as EM net EPS revisions are elevated. Similarly, analysts’ EM 12-month forward EPS growth differential vs. US are the widest since 2001. Chart 12Investor Growth Expectations Are Super High
Investor Growth Expectations Are Super High
Investor Growth Expectations Are Super High
Chart 13Investor Growth Expectations Are Super High
Investor Growth Expectations Are Super High
Investor Growth Expectations Are Super High
US Inflation And Rates US core goods inflation has been rising due to strong US household demand and supply bottlenecks. When the economy fully reopens, US core service inflation will rise as pent-up demand for services is unleashed. This will push up US bond yields regardless of the Fed’s rhetoric. Chart 14US Inflation And Rates
US Inflation And Rates
US Inflation And Rates
Chart 15US Inflation And Rates
US Inflation And Rates
US Inflation And Rates
Chart 16US Inflation And Rates
US Inflation And Rates
US Inflation And Rates
Look Out For Cracks In EM High-Yield Bond Space A rise in US TIPS and nominal yields will likely send shockwaves through EM risk assets and commodities that have greatly benefited from the plunge in TIPS yields. Watch out for cracks in the EM high-yield bond space. Chart 17Look Out For Cracks In EM High-Yield Bond Space
Look Out For Cracks In EM High-Yield Bond Space
Look Out For Cracks In EM High-Yield Bond Space
Chart 18Look Out For Cracks In EM High-Yield Bond Space
Look Out For Cracks In EM High-Yield Bond Space
Look Out For Cracks In EM High-Yield Bond Space
Chart 19Look Out For Cracks In EM High-Yield Bond Space
Look Out For Cracks In EM High-Yield Bond Space
Look Out For Cracks In EM High-Yield Bond Space
Chart 20Look Out For Cracks In EM High-Yield Bond Space
Look Out For Cracks In EM High-Yield Bond Space
Look Out For Cracks In EM High-Yield Bond Space
EM Currencies Are Not Yet Expensive But Are Overbought Although cyclically and for some countries structurally speaking EM currencies have more upside and their appreciation path will not be without major setbacks. In fact, several key currencies like MXN and ZAR are facing an important technical resistance. Investors should not chase them higher but accumulate them on a relapse. Chart 21EM Currencies Are Not Yet Expensive But Are Overbought
EM Currencies Are Not Yet Expensive But Are Overbought
EM Currencies Are Not Yet Expensive But Are Overbought
Chart 23EM Currencies Are Not Yet Expensive But Are Overbought
EM Currencies Are Not Yet Expensive But Are Overbought
EM Currencies Are Not Yet Expensive But Are Overbought
Chart 22EM Currencies Are Not Yet Expensive But Are Overbought
EM Currencies Are Not Yet Expensive But Are Overbought
EM Currencies Are Not Yet Expensive But Are Overbought
Equity Market Euphoria Is Running Wild Certain measures of stock market activity – like the call-put ratio, trading volumes and margin loans – reveal engulfing speculative behavior not only in the US but also in other markets like Korea. Chart 24Equity Market Euphoria Is Running Wild
Equity Market Euphoria Is Running Wild
Equity Market Euphoria Is Running Wild
Chart 25Equity Market Euphoria Is Running Wild
Equity Market Euphoria Is Running Wild
Equity Market Euphoria Is Running Wild
Chart 26Equity Market Euphoria Is Running Wild
Equity Market Euphoria Is Running Wild
Equity Market Euphoria Is Running Wild
A Mania Can Run Further And Longer Than Rational Analysis Can Envision The IPO boom is not as expansive as it was at its 2000 and 2007 peaks and there is some US dollar cash left to be put to work. Visibility is very low. Chart 27A Mania Can Run Further And Longer Than Rational Analysis Can Envision
A Mania Can Run Further And Longer Than Rational Analysis Can Envision
A Mania Can Run Further And Longer Than Rational Analysis Can Envision
Chart 28A Mania Can Run Further And Longer Than Rational Analysis Can Envision
A Mania Can Run Further And Longer Than Rational Analysis Can Envision
A Mania Can Run Further And Longer Than Rational Analysis Can Envision
Chart 29A Mania Can Run Further And Longer Than Rational Analysis Can Envision
A Mania Can Run Further And Longer Than Rational Analysis Can Envision
A Mania Can Run Further And Longer Than Rational Analysis Can Envision
Steep Equity Volatility Curves A steep equity volatility curve heralds a correction. Chart 30Steep Equity Volatility Curves
Steep Equity Volatility Curves
Steep Equity Volatility Curves
Chart 31Steep Equity Volatility Curves
Steep Equity Volatility Curves
Steep Equity Volatility Curves
Chart 32Steep Equity Volatility Curves
Steep Equity Volatility Curves
Steep Equity Volatility Curves
Chart 33Steep Equity Volatility Curves
Steep Equity Volatility Curves
Steep Equity Volatility Curves
Volatilities Across FX, Bonds And Commodities Oil volatility has been and remains in a bull market – making higher lows. Currency volatility remains elevated while US bond volatility is still very low and is bound to rise. Chart 34Volatilities Across FX, Bonds and Commodities
Volatilities Across FX, Bonds and Commodities
Volatilities Across FX, Bonds and Commodities
Chart 35Volatilities Across FX, Bonds and Commodities
Volatilities Across FX, Bonds and Commodities
Volatilities Across FX, Bonds and Commodities
Chart 36Volatilities Across FX, Bonds and Commodities
Volatilities Across FX, Bonds and Commodities
Volatilities Across FX, Bonds and Commodities
Chart 37Volatilities Across FX, Bonds and Commodities
Volatilities Across FX, Bonds and Commodities
Volatilities Across FX, Bonds and Commodities
Chart 38Volatilities Across FX, Bonds and Commodities
Volatilities Across FX, Bonds and Commodities
Volatilities Across FX, Bonds and Commodities
Chart 39Volatilities Across FX, Bonds and Commodities
Volatilities Across FX, Bonds and Commodities
Volatilities Across FX, Bonds and Commodities
Cyclicals Vs. Defensives And Growth Vs. Value Performance Global cyclical stocks’ relative performance versus defensive stocks might be due for a pause. Growth will underperform value in DM due to rising bond yields. We are less convinced about the growth/value performance in the EM equity space due to the mania occurring in EM TMT stocks. Chart 40Cyclicals Vs. Defensives And Growth Vs. Value Performance
Cyclicals Vs. Defensives And Growth Vs. Value Performance
Cyclicals Vs. Defensives And Growth Vs. Value Performance
Chart 41Cyclicals Vs. Defensives And Growth Vs. Value Performance
Cyclicals Vs. Defensives And Growth Vs. Value Performance
Cyclicals Vs. Defensives And Growth Vs. Value Performance
Chart 42Cyclicals Vs. Defensives And Growth Vs. Value Performance
Cyclicals Vs. Defensives And Growth Vs. Value Performance
Cyclicals Vs. Defensives And Growth Vs. Value Performance
Chart 43Cyclicals Vs. Defensives And Growth Vs. Value Performance
Cyclicals Vs. Defensives And Growth Vs. Value Performance
Cyclicals Vs. Defensives And Growth Vs. Value Performance
Profiles Of Various Global Equity Indexes Many global equity indexes excluding US or TMT have either not broken out or have done so only marginally. Chart 44Profiles Of Various Global Equity Indexes
Profiles Of Various Global Equity Indexes
Profiles Of Various Global Equity Indexes
Chart 45Profiles Of Various Global Equity Indexes
Profiles Of Various Global Equity Indexes
Profiles Of Various Global Equity Indexes
Chart 46Profiles Of Various Global Equity Indexes
Profiles Of Various Global Equity Indexes
Profiles Of Various Global Equity Indexes
Chart 47Profiles Of Various Global Equity Indexes
Profiles Of Various Global Equity Indexes
Profiles Of Various Global Equity Indexes
EM ex-TMT Equity Performance Has Been Unimpressive Excluding TMT stocks, EM equity indexes have not broken above their previous highs. It has been a mania in TMT stocks that has boosted the EM overall equity index. Chart 48EM ex-TMT Equity Performance Has Been Unimpressive
EM ex-TMT Equity Performance Has Been Unimpressive
EM ex-TMT Equity Performance Has Been Unimpressive
Chart 49EM ex-TMT Equity Performance Has Been Unimpressive
EM ex-TMT Equity Performance Has Been Unimpressive
EM ex-TMT Equity Performance Has Been Unimpressive
Chart 50EM ex-TMT Equity Performance Has Been Unimpressive
EM ex-TMT Equity Performance Has Been Unimpressive
EM ex-TMT Equity Performance Has Been Unimpressive
Chart 51EM ex-TMT Equity Performance Has Been Unimpressive
EM ex-TMT Equity Performance Has Been Unimpressive
EM ex-TMT Equity Performance Has Been Unimpressive
A Mania In Chinese Stocks, Especially In TMT Stocks Chinese offshore stocks ex-TMT and onshore equal-weighted and small caps have done rather poorly. The latest euphoria in Hong Kong-listed Chinese stocks has been due to an increased quota for mainland investors to buy offshore stocks. This has led to massive southbound outflows and has propelled Chinese stock trading in Hong Kong. Chart 52A Mania In Chinese Stocks, Especially In TMT Stocks
A Mania In Chinese Stocks, Especially In TMT Stocks
A Mania In Chinese Stocks, Especially In TMT Stocks
Chart 53A Mania In Chinese Stocks, Especially In TMT Stocks
A Mania In Chinese Stocks, Especially In TMT Stocks
A Mania In Chinese Stocks, Especially In TMT Stocks
Chart 54A Mania In Chinese Stocks, Especially In TMT Stocks
A Mania In Chinese Stocks, Especially In TMT Stocks
A Mania In Chinese Stocks, Especially In TMT Stocks
The Chinese Economy: Peak Stimulus = Weak Growth In H2 2021 Rollover in credit and fiscal stimulus in Q4 2020 entails weak growth in H2 2021 in segments leveraged to stimulus. Chart 55The Chinese Economy: Peak Stimulus = Weak Growth In H2 2021
The Chinese Economy: Peak Stimulus = Weak Growth In H2 2021
The Chinese Economy: Peak Stimulus = Weak Growth In H2 2021
Chart 56The Chinese Economy: Peak Stimulus = Weak Growth In H2 2021
The Chinese Economy: Peak Stimulus = Weak Growth In H2 2021
The Chinese Economy: Peak Stimulus = Weak Growth In H2 2021
Chart 57The Chinese Economy: Peak Stimulus = Weak Growth In H2 2021
The Chinese Economy: Peak Stimulus = Weak Growth In H2 2021
The Chinese Economy: Peak Stimulus = Weak Growth In H2 2021
Chart 58The Chinese Economy: Peak Stimulus = Weak Growth In H2 2021
The Chinese Economy: Peak Stimulus = Weak Growth In H2 2021
The Chinese Economy: Peak Stimulus = Weak Growth In H2 2021
Commodity Prices The end of commodities restocking in China, weaker demand from mainland construction in H2 and elevated investor net long positions in commodities constitute the basis for a setback in commodities prices this year. Nevertheless, such a pullback will occur only if the USD rebounds and global equity prices sell off. Chart 59Commodity Prices
Commodity Prices
Commodity Prices
Chart 60Commodity Prices
Commodity Prices
Commodity Prices
Chart 61Commodity Prices
Commodity Prices
Commodity Prices
Chart 62Commodity Prices
Commodity Prices
Commodity Prices
The Recovery In EM ex-North Asia Has Been Very Subdued The economic recovery in EM ex-China, Korea and Taiwan has been much weaker than those in DM and North Asian economies. Chart 63The Recovery In EM ex-North Asia Has Been Very Subdued
The Recovery In EM ex-North Asia Has Been Very Subdued
The Recovery In EM ex-North Asia Has Been Very Subdued
Chart 64The Recovery In EM ex-North Asia Has Been Very Subdued
The Recovery In EM ex-North Asia Has Been Very Subdued
The Recovery In EM ex-North Asia Has Been Very Subdued
Chart 65The Recovery In EM ex-North Asia Has Been Very Subdued
The Recovery In EM ex-North Asia Has Been Very Subdued
The Recovery In EM ex-North Asia Has Been Very Subdued
Chart 66The Recovery In EM ex-North Asia Has Been Very Subdued
The Recovery In EM ex-North Asia Has Been Very Subdued
The Recovery In EM ex-North Asia Has Been Very Subdued
The Recovery In EM ex-North Asia Will Continue To Lag EM ex-North Asia’s economic underperformance will continue as many of these nations are lagging in vaccine rollouts and their fiscal and monetary support has been much smaller. Besides, their banks are reluctant to lend due to high NPLs. Chart 67The Recovery In EM ex-North Asia Will Continue To Lag
The Recovery In EM ex-North Asia Will Continue To Lag
The Recovery In EM ex-North Asia Will Continue To Lag
Chart 68The Recovery In EM ex-North Asia Will Continue To Lag
The Recovery In EM ex-North Asia Will Continue To Lag
The Recovery In EM ex-North Asia Will Continue To Lag
Chart 69The Recovery In EM ex-North Asia Will Continue To Lag
The Recovery In EM ex-North Asia Will Continue To Lag
The Recovery In EM ex-North Asia Will Continue To Lag
Chart 70The Recovery In EM ex-North Asia Will Continue To Lag
The Recovery In EM ex-North Asia Will Continue To Lag
The Recovery In EM ex-North Asia Will Continue To Lag
EM ex-TMT Equity Performance Has Been Underwhelming A slow recovery in EM ex-TMT industries explains why EM equity performance outside TMT stocks has been underwhelming. Chart 71EM ex-TMT Equity Performance Has Been Underwhelming
EM ex-TMT Equity Performance Has Been Underwhelming
EM ex-TMT Equity Performance Has Been Underwhelming
Chart 72EM ex-TMT Equity Performance Has Been Underwhelming
EM ex-TMT Equity Performance Has Been Underwhelming
EM ex-TMT Equity Performance Has Been Underwhelming
Chart 73EM ex-TMT Equity Performance Has Been Underwhelming
EM ex-TMT Equity Performance Has Been Underwhelming
EM ex-TMT Equity Performance Has Been Underwhelming
Footnotes
Highlights The post-2008 boom in stocks, corporate bonds, and real estate is a ‘rational bubble’, because the relationship between risk-asset valuations and falling bond yields is exponential. But the ‘rational bubble’ is turning into an ‘irrational bubble’. Stay tactically neutral to stocks for the next few weeks to see whether valuation can revert to rationality. This means keep existing investments in the market, but hold fire on new deployments of cash. If valuation reverts to rationality, then investors can safely deploy new cash into the market. But if valuation moves into irrationality, then it will require a completely different investment mindset, in which fractal analysis will become crucial in identifying the bursting of the bubble, just as it did in 2000. Fractal trade: the Chinese stock market is vulnerable to correction. Feature Chart of the WeekA 'Rational Bubble' And An 'Irrational Bubble'
A 'Rational Bubble' And An 'Irrational Bubble'
A 'Rational Bubble' And An 'Irrational Bubble'
Regular readers will know that we have characterised the post-2008 boom in stocks, corporate bonds, and real estate as a ‘rational bubble’. Rational, because the nosebleed valuations are justified by a fundamental driver. And not just any fundamental driver, but the most fundamental driver of all – the bond yield. However, the ‘rational bubble’ is turning into an ‘irrational bubble’, akin to the dot com mania in which valuations became totally disconnected from fundamentals (Chart of the Week). What should investors do? The Relationship Between Bond Yields And Risk-Asset Valuation Is Exponential Everyone realises that a lower bond yield justifies a lower prospective return from competing investments, such as stocks, corporate bonds, and real estate. As valuation is just the inverse of prospective return, a lower bond yield justifies a higher valuation for all risk-assets. (Chart I-2). Chart I-2House Prices have Decoupled From Rents Again (And It Didn't End Happily Last Time)
House Prices have Decoupled From Rents Again (And It Didn't End Happily Last Time)
House Prices have Decoupled From Rents Again (And It Didn't End Happily Last Time)
But few people realise that a lower bond yield justifies an exponentially higher valuation for risk-assets. To visualise this exponential relationship, look again at the Chart of the Week. The bond yield is plotted on a logarithmic (and inverted) left scale, while the stock market forward price-to-earnings is plotted on a linear right scale. The inverted log versus linear scales demonstrate that, in the ‘rational bubble’, the lower the bond yield, the greater the impact of a given decline in the bond yield on stock market valuation. Few people realise that a lower bond yield justifies an exponentially higher valuation for risk-assets. Chart I-3 and Chart I-4 also demonstrate the exponential relationship using the earnings yield as a proxy for the prospective return on stocks. A 1.5 percent decline in the bond yield had a smaller impact on the earnings yield when the bond yield started at 4 percent in 2014 than when the bond yield started at 3 percent in 2019. At the higher bond yield, the prospective return on stocks fell by 1 percent, but at the lower bond yield, the prospective return on stocks plunged by 2.5 percent. Chart I-3A 1.5 Percent Decline In The Bond Yield Had A Smaller Impact On The Earnings Yield When The Bond Yield Started At 4 Percent...
A 1.5 Percent Decline In The Bond Yield Had A Smaller Impact On The Earnings Yield When The Bond Yield Started At 4 percent...
A 1.5 Percent Decline In The Bond Yield Had A Smaller Impact On The Earnings Yield When The Bond Yield Started At 4 percent...
Chart I-4…Than When The Bond Yield Started ##br##At 3 Percent
...Than When The Bond Yield Started At 3 Percent
...Than When The Bond Yield Started At 3 Percent
To repeat, the lower the bond yield, the greater the impact of a given move in the bond yield on the prospective return from stocks. The intriguing question is, why? To answer this question, we must venture into a branch of behavioural psychology developed by Nobel Laureate Daniel Kahneman and Amos Tversky, called Prospect Theory. Prospect Theory Explains The ‘Rational Bubble’ Prospect Theory’s key finding is that we consistently overvalue the prospect of a tail-event, both positive and negative. For example, if there is a one in a million chance of winning a million pounds, then the expected value of this prospect is one pound. Yet we will consistently pay more than one pound for this positive tail-event. This willingness to overpay for a positive tail-event is the foundation of the multi-billion pound gambling and lottery industry. Now consider an ‘inverse lottery’, in which there is a one in a million chance of losing a million pounds. In theory, we should take on the risky prospect for one pound. Yet in practice, we will consistently demand more than one pound to take on this negative tail-event. In other words, we will demand a substantial ‘risk premium’. Prospect Theory explains that we overvalue tail-events because we are bad at comprehending small probabilities. Hence, the prospect of winning a million pounds, while in practice a negligible possibility, generates excessive optimism which results in overpayment for the bet. Likewise, the possibility of losing a million pounds, while in practice a negligible possibility, generates excessive pessimism, for which we demand payment of a ‘risk premium’. In the financial markets, stock markets tend to ‘gap down’ much more than they ‘gap up’. Hence, the risk of owning stocks is like the discomfort of the inverse lottery. This explains why investors normally demand a risk premium – an excess prospective return – to own stocks versus bonds. However, the risk relationship between stocks and bonds changes when bond yields approach their lower bound. Now, as bond yields have less scope to move down versus up, bond prices can gap down much more than they can gap up. The upshot is that the risk of owning bonds becomes no different to the risk of owning stocks, and the risk premium to own stocks versus bonds disappears. At ultra-low bond yields, the bond yield and the equity risk premium move up and down in tandem. Given that the prospective return on stocks equals the bond yield plus the risk premium, we can now answer our intriguing question. At ultra-low bond yields, the prospective return on stocks moves by more than the move in the bond yield, because the bond yield and the risk premium are moving up and down in tandem. The result is an exponential relationship between the bond yield and risk-asset valuations. And this explains how the post-2008 collapse in bond yields to unprecedented lows has generated a ‘rational bubble’ in stocks, corporate bonds, and real estate (Chart I-5 and Chart I-6). Chart I-5A Rational Bubble In Risk-Assets...
A Rational Bubble In Risk-Assets...
A Rational Bubble In Risk-Assets...
Chart I-6...Everywhere
...Everywhere
...Everywhere
The Rational Bubble Is Turning Irrational The post-2008 boom in risk-asset valuations is rational given the exponential relationship with a collapsed bond yield. But the rational valuation is turning irrational. Over the past few months, the stock market’s forward price-to-earnings multiple has continued to increase despite a backup in the bond yield. Note that this multiple is calculated on the next 12 months of earnings, so it already incorporates a strong post-pandemic earnings rebound (Chart I-7). Chart I-7The Rational Bubble Is Turning Irrational
The Rational Bubble Is Turning Irrational
The Rational Bubble Is Turning Irrational
Furthermore, since 2009, the bond yield (plus a fixed constant) has defined a reliable lower limit for the technology sector earnings yield, meaning a well-defined upper limit for the technology sector’s valuation. Since 2009, this valuation limit has effectively defined the limit of the rational bubble and hasn’t been breached. That is, until now. The recent breach of the post-2008 valuation limit means that the rational bubble is turning irrational (Chart I-8). Chart I-8The Post-2008 Rational Valuation Limit Has Been Breached
The Post-2008 Rational Valuation Limit Has Been Breached
The Post-2008 Rational Valuation Limit Has Been Breached
There are three ways that an irrational valuation can revert to rationality: Stock prices decline. Bond yields decline. Stock prices and bond yields drift sideways while (forward) earnings gradually rise to improve stock valuations. The Investment Decision The decision to be invested in the stock market is probably the most important decision for all investors, including those in Europe. Furthermore, the direction of the stock market is a global rather than a local phenomenon. Our current recommendation is to stay tactically neutral for the next few weeks to see whether risk-asset valuations can revert to rationality. This means keep existing investments in the market, but hold fire on new deployments of cash. Hold fire on new deployments of cash. If valuation reverts to rationality in any of the three ways listed above, then investors can safely deploy new cash into the market. But if valuation turns into irrationality, then it will require a completely different investment mindset. After all, you cannot analyse an irrational market using rational tools! In this case, technical analysis becomes much more important, and front and centre of these techniques is fractal analysis. Specifically, as investors with longer and longer time horizons join the irrational bubble, there will be well-defined moments of heightened fragility, at which correction risk increases. This is what burst the irrational bubble in 2000 (Chart I-9), and will burst any new irrational bubble. Stay tuned. Chart I-9The Dotcom Bubble Burst When All Investment Time Horizons Had Joined It
The Dotcom Bubble Burst When All Investment Time Horizons Had Joined It
The Dotcom Bubble Burst When All Investment Time Horizons Had Joined It
Fractal Trading System* The recent strong rally and outperformance of the Chinese stock market is fragile on all three fractal structures: 65-day, 130-day, and 260-day. A good trade is to underweight China versus New Zealand (MSCI indexes), setting a profit target and symmetrical stop-loss at 9 percent. In other trades, the continued momentum of reflation plays has weighed on some recent positions as well as stopping out short MSCI World versus the 30-year T-bond. Nevertheless, the rolling 12-month win ratio stands at 54 percent. Chart I-10MSCI: China Vs. New Zealand
MSCI: China Vs. New Zealand
MSCI: China Vs. New Zealand
When the fractal dimension approaches the lower limit after an investment has been in an established trend it is a potential trigger for a liquidity-triggered trend reversal. Therefore, open a countertrend position. The profit target is a one-third reversal of the preceding 13-week move. Apply a symmetrical stop-loss. Close the position at the profit target or stop-loss. Otherwise close the position after 13 weeks. * For more details please see the European Investment Strategy Special Report “Fractals, Liquidity & A Trading Model,” dated December 11, 2014, available at eis.bcaresearch.com. Dhaval Joshi Chief European Investment Strategist dhaval@bcaresearch.com Fractal Trading System Cyclical Recommendations Structural Recommendations Closed Fractal Trades Trades Closed Trades Asset Performance Currency & Bond Equity Sector Country Equity Indicators Bond Yields Chart II-1Indicators To Watch - Bond Yields
Indicators To Watch - Bond Yields
Indicators To Watch - Bond Yields
Chart II-2Indicators To Watch - Bond Yields
Indicators To Watch - Bond Yields
Indicators To Watch - Bond Yields
Chart II-3Indicators To Watch - Bond Yields
Indicators To Watch - Bond Yields
Indicators To Watch - Bond Yields
Chart II-4Indicators To Watch - Bond Yields
Indicators To Watch - Bond Yields
Indicators To Watch - Bond Yields
Interest Rate Chart II-5Indicators To Watch - Interest Rate Expectations
Indicators To Watch - Interest Rate Expectations
Indicators To Watch - Interest Rate Expectations
Chart II-6Indicators To Watch - Interest Rate Expectations
Indicators To Watch - Interest Rate Expectations
Indicators To Watch - Interest Rate Expectations
Chart II-7Indicators To Watch - Interest Rate Expectations
Indicators To Watch - Interest Rate Expectations
Indicators To Watch - Interest Rate Expectations
Chart II-8Indicators To Watch - Interest Rate Expectations
Indicators To Watch - Interest Rate Expectations
Indicators To Watch - Interest Rate Expectations
Highlights Health care remains a top priority of the Democratic Party even though it is flying under the radar at the moment. Health care embodies the shift from small government to big government. While the 2021 budget reconciliation will hit Big Pharma and expand Medicaid, the 2022 reconciliation will seek a public health insurance option and Medicare role in price negotiations. If forced to choose between health care and climate change priorities, Democrats will choose health care. It is a bigger vote-winner. Stay short managed health care relative to the S&P 500. Go long health care facilities and equipment relative to the rest of the health sector. Feature The US Senate acquitted former President Donald Trump on a vote of 57-43 on February 13. No one was hanged.1 The trial was not economically or financially significant except insofar as it underscored peak US political polarization, US distraction from the global stage, and the extent of divisions within the Republican Party. Equity market volatility melted away as stocks surged higher on the generally positive backdrop of COVID vaccines and stimulus. Seven Republicans joined Democrats in voting to convict the former president of “incitement to insurrection.” Trump’s performance was worse than Bill Clinton’s but better than Andrew Johnson’s, though neither Clinton nor Johnson saw defections from their own party (Chart 1). The Republicans’ internal differences are serious enough to hobble them in the 2022 or 2024 elections but it is too soon to draw any hard conclusions. The Democratic agenda is also capable of bringing Republicans back together. Meanwhile the maximum of seven Republican defectors shows that it will be extremely difficult for Democrats to get 10 Republicans to join them in passing any controversial legislation in the Senate (Table 1). Hence the filibuster will remain in jeopardy over the long run if not in the short run. Also, in 2022, the Democrats have a chance to pick up seats in Pennsylvania and North Carolina. Chart 1Trump’s Acquittal And Historic Impeachment Results
Don't Forget Biden's Health Care Policy
Don't Forget Biden's Health Care Policy
Table 1The Seven Senate Republicans Who Defected From Trump
Don't Forget Biden's Health Care Policy
Don't Forget Biden's Health Care Policy
Biden’s Agenda After The American Rescue Plan Democrats are plowing forward with the first of two budget reconciliation bills, which enables them to pass legislation with a simple majority in the Senate. They hope to pass President Biden’s $1.9 trillion American Rescue Plan by mid-March, when unemployment benefits expire under the Consolidated Appropriations Act of 2020. The final sum might be a bit less than this headline number. The second budget reconciliation bill, for fiscal year 2022, will be passed in the autumn or next spring and will contain anywhere from $4 trillion to $8 trillion worth of additional spending on health care, child care, infrastructure, and green projects over a ten-year period (Chart 2). This number will be watered down in negotiation as the pandemic subsides and the aura of crisis dies down, reducing the willingness of moderate Democrats to vote for anything controversial. But investors should not doubt Biden’s agenda at this stage. If there is anything we know about the reconciliation process it is that the ruling party will get what it wants. Investors should plan accordingly: the output gap will be closed sooner than expected and inflationary pressures will build faster than expected, even though it will take a while for the labor market to heal. Chart 2Biden’s Agenda AFTER The American Rescue Plan
Don't Forget Biden's Health Care Policy
Don't Forget Biden's Health Care Policy
This policy combination of “loose fiscal, loose monetary” policy continues to drive stocks higher (and the dollar lower) despite the misgivings we noted about underrated geopolitical risks (Chart 3). A critical question is when the Fed will normalize monetary policy. This is not an apolitical question. Fed chair Jerome Powell’s term ends in February of 2022. He may contemplate tapering asset purchases prior to that date, causing troubles in the equity market, but actual tapering is more likely to occur in 2022, in the view of our US Bond Strategist Ryan Swift. Powell would only taper in 2022 if he is forced to do so by an ironclad policy consensus precipitated by robust inflation and possibly financial instability concerns. This timing gives President Biden an opportunity to nominate an ultra-dovish Fed chair. Rate hikes are entirely possible in 2022 but our political bias implies they are unlikely before 2023 (unless an ironclad consensus develops that they are necessary). Even in 2023, an ultra-dove will be reluctant to hike, depending on the context. And rate hikes are virtually off limits in 2024, at least until after the November election. This political timeline reinforces the view that the Fed will not be hiking anytime soon and investors should prepare for inflation risks to surprise to the upside over the coming years. Chart 3"Easy Fiscal, Easy Monetary" Policy Combination
"Easy Fiscal, Easy Monetary" Policy Combination
"Easy Fiscal, Easy Monetary" Policy Combination
The Senate parliamentarian has not yet ruled whether a federal minimum wage hike to $15 per hour can be included in the bill. Biden has accepted it may be cut but his party will push it through if possible. Last week we found that a higher minimum wage would not have a dramatic macroeconomic impact. Still, wages will rise in the coming years due to the cumulative effect of the Democratic Party’s policies. Higher wages, taxes, and regulatory hurdles will cut into corporate profits. But the passage of a higher minimum wage today would not in itself be a negative catalyst for equities. Rather, we would expect the rally to take a breather once the first reconciliation bill is finished (next week or in the coming weeks), since it will bring wage hikes, rate hikes, and tax hikes more clearly into view on the investment horizon. Unlike minimum wages, there is little controversy over whether budget reconciliation can be used to change the health care system. This was done in 2010 as the second critical part to President Barack Obama’s Affordable Care Act (Obamacare). Hence Biden is highly likely to get his health agenda passed, which is largely an agenda of entrenching and expanding Obamacare. That is, as long as he prioritizes health care above other structural reforms like climate change. We think he will. In the rest of this report we look at Biden’s health care policy and the implications for US financial markets. Biden’s Health Care Policy Health care has been a top priority of the Democrats since 1992 yet they have repeatedly lost control of the agenda due to surprise Republican victories in 2000 and 2016. Republicans expanded Medicare under Bush but then failed to repeal and replace Obamacare under Trump. Now Democrats have only the narrowest of majorities in the House and Senate and will push hard to solidify and build on Obamacare. There is a low chance that they will leave this issue unsettled under the Biden administration. If new obstacles arise, more political capital will be spent to secure health care reform at the expense of other policies on the agenda. COVID-19 reinforces the Democrats’ focus on health care. The US has seen around 1,500 deaths per million people, making it one of the worst performers amid the crisis, comparable to the UK and Italy (Chart 4). Yet COVID is only the latest in a line of US public health failings and it is important to put COVID into perspective. For example, among US adults aged 25-44 years old, all-cause excess mortality from March to July last year was about 11,899 more than expected. By contrast, during the same period in 2018, there were 10,347 unintentional deaths due to opioids (Chart 5).2 In other words, the COVID crisis last year was comparable to the opioid crisis in magnitude, at least for middle-aged people. Obviously COVID has taken a terrible toll and is a more deadly disease for the old and the sick. The point is that the public’s wrath over poor public health and the US government’s ineffectiveness is well established. A pandemic was foreseeable, and foreseen, yet not prepared for, and it came on top of the opioid crisis and the debate about 30 million Americans who lack health insurance. The Biden administration has the intention and the capability to address these issues. Chart 4US Handling Of COVID-19 Left Much To Be Desired
Don't Forget Biden's Health Care Policy
Don't Forget Biden's Health Care Policy
Chart 5Opioid Crisis Versus COVID Crisis
Don't Forget Biden's Health Care Policy
Don't Forget Biden's Health Care Policy
The structural problem is well-known: The US spends more than other countries on health care but achieves worse results (Charts 6A & 6B). When workers get fired they lose health care, as insurance is tied to employment. Those whose employers do not provide health care or who are unemployed count among the ranks of the roughly 30 million uninsured. This number has fallen from its peak at 47 million in 2010 when Obamacare was enacted but has crept upward again since Trump’s attempt to dismantle that law and the lockdowns of 2020 (Chart 7). This is a driver of popular discontent that has proven again and again to generate votes, including in key swing states. Chart 6AThe US Spends More On Health Care …
Don't Forget Biden's Health Care Policy
Don't Forget Biden's Health Care Policy
Chart 6B… But Sees Worse Avoidable Mortality
Don't Forget Biden's Health Care Policy
Don't Forget Biden's Health Care Policy
Chart 7Rising Number Of Uninsured Even Pre-COVID
Don't Forget Biden's Health Care Policy
Don't Forget Biden's Health Care Policy
A range of public opinion polling over many years shows that health care is a close second or third to the economy and jobs in voter priorities. Voters care more about COVID and health care than they do about climate change and the environment (Chart 8, first panel). Chart 8Public Opinion On Biden’s Priorities: Jobs, Health, Then Climate
Don't Forget Biden's Health Care Policy
Don't Forget Biden's Health Care Policy
Another important takeaway from this opinion polling is that voters could not care less about budget deficits. Big spending solutions are all the rage (Chart 8, second panel). The Biden administration is prioritizing economic recovery and the pandemic response but will also pursue its health care reforms. If this policy requires a tradeoff with infrastructure and renewables, we would expect health care to get the greater attention. Over the long run Obamacare can be replaced but not repealed. The law is getting more popular over time and entitlements get harder to repeal over time. Slightly more than half of voters have a favorable view of the law and only 34% have an unfavorable view. Only 29%of voters want to repeal or scale back the law while about 62% want to build on it or keep it as it is (Chart 9). Underscoring this polling is the fact that the law was modeled on a Republican plan and even Trump adopted several of the most popular provisions: requiring insurance coverage for patients with preexisting conditions and slapping caps on pharmaceutical prices through import and pricing schemes. The Supreme Court has ruled Obamacare constitutional and is not expected to change that ruling this spring. It could object to the individual mandate – the most controversial part of Obamacare that required each person to pay a tax penalty if they did not purchase health insurance. But if parts of the law are stricken, Democrats have the votes to patch it up or provide an alternative. Chart 9Obamacare Has Grown On American Public
Don't Forget Biden's Health Care Policy
Don't Forget Biden's Health Care Policy
Biden simultaneously shows that Democrats rejected the most popular alternative to Obamacare – “Medicare for All,” or single-payer government-provided health care – at least for the current presidential cycle. Medicare for All was co-sponsored by Vice President Kamala Harris and is still a long-term goal of the progressive wing of the Democratic Party. However, voters do not like the proposal when asked about its practical consequences (Chart 10). In the Democratic primary, only Senators Bernie Sanders and Elizabeth Warren argued for wholesale revolution in US health care that would see private insurance cease to exist and 176 million voters moved onto a public health system. Sanders’s plan would have cost an estimated $31 trillion, increasing the budget deficit by $13 trillion over 10 years, and would have encouraged the overuse of medical services due to the absence of a co-pay or fixed cost. This idea will not vanish but the Biden administration’s likely success in expanding Obamacare will lead the party to focus on other things (e.g. climate change). Chart 10Insufficient Public Demand For Government-Provided Health Care (For Now)
Don't Forget Biden's Health Care Policy
Don't Forget Biden's Health Care Policy
Biden’s big proposal is to add a public insurance option that would exist alongside current private insurance options. This idea was originally part of Obamacare but was removed during negotiations – precisely because the Democrats eschewed the use of budget reconciliation (again, not a constraint this time).3 The Biden plan is estimated to cost $2.25 trillion over 10 years and includes larger subsidies, the ability of workers to choose whether they want their employer-provided plan or the public option, automatic enrollment, a lower age of eligibility for Medicare (from 65 to 60), drug price caps, and various other provisions (Table 2). Table 2Biden’s Health Care Plan
Don't Forget Biden's Health Care Policy
Don't Forget Biden's Health Care Policy
Medicare, a giant consumer, would be able to negotiate drug prices directly with companies to drive down the price. Tax hikes on high-income earners and capital gains would pay for Biden’s policy. With public backing and full Democratic control of Congress, there is little that can stop Biden from achieving this health care policy, other than a change in direction from his party, which we do not expect. The first budget reconciliation only contains small parts of the Biden agenda, such as incentives for states to expand Medicaid under Obamacare and a reduction in Medicaid rebates for drug manufacturers.4 The second budget reconciliation process will have to cover health care and tax hikes. But the consensus view is that the second reconciliation will focus on infrastructure and green energy. This is a conflict of priorities that will have to be resolved. The research above suggests it will be resolved in favor of health care. This would leave the regular budget process as the means to advance infrastructure and green projects. Macro Impact Of Biden’s Health Care Policy The great health care debate over the past decade reflected the broad post-Cold War debate in the US over the role of government in the economy. It centered on whether government involvement should increase to expand health insurance coverage. Although private US health care spending accounts for 31% of total health care spending, and is thus larger than either Medicare (21%) or Medicaid (16%), the government has control of 44% of spending when all of its functions are added together. This share is set to increase now that the debate has been decided in favor of Big Government (at least for now). Future administrations might carve out more space for private choice and competition in health care but a permanent step-up in government involvement and regulation has occurred given the above points about Obamacare’s irrevocability. What are the macro consequences of such a change? The imposition of Obamacare may have contributed to the sluggish economic recovery in the wake of the Great Recession but the case is hard to examine objectively because the tax penalties only took effect in 2015-16 and then a new administration ceased implementation in 2017. In 2015 the Congressional Budget Office estimated that repealing Obamacare would increase the budget deficit by $353 billion over a ten year period but that it would also increase GDP by an average of 0.7% per year during the latter end of full implementation, thus boosting revenues and producing a net $137 billion increase in the budget deficit over ten years.5 In other words, Obamacare marginally tightened fiscal policy and encouraged some workers to cut their hours or stop working due to expanded subsidies, tax credits, and Medicaid eligibility.6 Repealing it would have reduced the tax burden on corporations and reduced the subsidy benefits to households but possibly with a slight boost to growth (Chart 11). Going forward, Biden’s policies are adjustments rather than a total overhaul but they would ostensibly add $2.25 trillion in spending and $1.4 trillion in revenue, resulting in a negative impact on the budget deficit (fiscal loosening) of $850 billion. The implication is that Biden’s plan would increase rather than decrease aggregate demand, albeit marginally in an era of already gigantic deficits. It would also remove some labor supply and eventually drag on GDP growth. Yet the impact of these effects is still uncertain given the general context of loose fiscal and loose monetary policy, the reduction in the number of uninsured people, and the potentially positive second-order effects of this increase in the social safety net for low-income families with high marginal propensities to consume. The bottom line is that the macro effects of Biden’s health plan will not be known for many years but the headline effect in the short run is an incremental addition to an already extremely loose fiscal policy setting. Chart 11Macro Effects Of Obamacare Repeal
Don't Forget Biden's Health Care Policy
Don't Forget Biden's Health Care Policy
The negative effects will largely fall on high-income earners, capital gains earners, and corporations who will provide the revenue to pay for the plan. The private health insurance industry faced an existential threat from the Sanders plan but it still faces a loss of customers and earnings from the Biden plan. The major difference between Obamacare and Bidencare is that Obamacare forced insurance companies to provide a basic insurance option to the public but did not offer a public option to compete with them. Therefore their customer base increased albeit at a lower profit. Whereas Biden’s plan will create a public competitor that will siphon off customers from private insurance. Biden proposed giving workers this choice anytime but in the presidential debates suggested there would be limits. Either way private insurers stand to lose customers over time. This is not a major political constraint given that Big Insurance gets little sympathy from the public but it will have a negative impact on innovation and productivity in the health sector. Meanwhile Medicare would reimburse hospitals, clinics, and drug providers less for their services and goods. This would weigh on the profitability of small and private medical outfits and favor large and public providers that receive government subsidies and can stomach higher costs. It would also take a toll on Big Pharma and biotech sectors which have operated in a lucrative environment of low taxes, low regulation, and sizable pricing power. The US government has enormous negotiating power in the market, especially over home care, hospitals, nursing homes, and prescription drugs. Private and public investment are roughly evenly split, with public money dominating health care research and private money dominating structures and equipment. The government accounts for about 40% of total drug spending and both political parties believe this influence should be used to keep costs down, as public opinion is increasingly dissatisfied with high drug costs.7 There is a lot more to be said about the US health care system. A risk of Biden’s health reform is that it will increase the demand for health services without arranging for consummate increases in supply. In this sense it is inflationary. Investment Takeaways Health care stocks and each of the health care sub-sectors – pharmaceuticals, biotech, managed health care, facilities, and equipment – underperformed the S&P500 index amid the passage of Obamacare from March 23 to November 20, 2010. Within the sector, managed health care (health insurance) and biotech suffered most when the legislation first hit while facilities and equipment suffered most over the whole legislative episode. Once the law took full effect in 2014-15, equipment and managed health care outperformed, facilities were flat, and pharma and biotech underperformed. A look at the performance of the health care sector relative to the S&P 500 over the past 13 years shows that the sector rallied on President Obama’s victories in 2008, fell during the passage of Obamacare, staged a recovery that continued through the Supreme Court’s decision to uphold the new law in June of 2012, and then dropped off (Chart 12 A). Health stocks benefited from the global macro backdrop from 2011-15. After 2015, when Obamacare took full effect, the business cycle entered its later stage, and populism emerged (with Sanders threatening a government takeover and Trump firing up the cyclical economy), health care stocks underperformed the market. Chart 12AHealth Sector's Response To Obamacare Saga
Health Sector's Response To Obamacare Saga
Health Sector's Response To Obamacare Saga
Subsequent rallies have occurred, notably on the outbreak of COVID-19, but have not been sustainable. When Republicans failed to repeal Obamacare, when various crises gave defensive plays a tailwind, when Biden won the Democratic nomination over Sanders or Warren, and when the pandemic arose, the sector surged, often due to risk aversion in financial markets. In the end the negative trend reasserted itself as the combination of rising risk sentiment and policy headwinds outweighed the underlying demographic tailwind for earnings as society aged. Since the Democratic sweep of government in the 2020 elections the sector is testing new lows in relative performance. Pharmaceuticals charted a similar course to the overall health sector but never regained their pre-Obamacare peak in relative performance. They have underperformed again and again since the rise of Bernie Sanders and are today touching new lows (Chart 12B). Chart 12BBig Pharma's Response To Obamacare Saga
Big Pharma's Response To Obamacare Saga
Big Pharma's Response To Obamacare Saga
A closer look at the sector since the 2020 election and especially the Democratic victory in the Senate shows that it continues to underperform the broad market. Facilities are the most resilient, pharma and biotech are trying to find a bottom, and equipment and managed health care have sold off. Relative to the health care sector, equipment and facilities are the outperformers but, again, pharma and biotech are trying to bottom (Chart 13). These results make sense as Biden’s biggest policy impact will be to stimulate demand for health care facilities and equipment while constraining profits for Big Insurance and Big Pharma via the public insurance option and allowing Medicare to negotiate drug prices. Thus equipment and facilities benefit from the political environment, pharma and biotech should be monitored to see if they break down to new lows on the passage of legislation, and managed health care gets the short end of the stick. Our US Equity Strategy service is neutral on the sector as a whole, overweight equipment, and underweight pharma. Chart 13Health Care Sector Response To Biden's Democratic Sweep
Health Care Sector Response To Biden's Democratic Sweep
Health Care Sector Response To Biden's Democratic Sweep
Putting it all together, health care stocks are good candidates for a short-term, tactical bounce when the exuberant stock rally suffers a correction but they are not yet candidates for strategic investments. They are not likely to find a bottom until Biden’s policies are passed, or the pro-cyclical macro backdrop has changed. Biden’s policies are high priority for his party and face low legislative and political hurdles to passage, yet will have a huge impact on the relevant industries – undercutting the private health insurance customer base and capping the profits of America’s drug makers. These changes will have long-term ramifications so they are not likely to be fully discounted yet. Previously health care firms had huge pricing power – they could charge whatever they wanted while they did not face the full might of the government in setting prices – but going forward that will change. Biotech and pharma have large profit margins that are exposed to this policy shift so they are exposed to further downside – we would not be bottom-feeders. Moreover pharmaceuticals make up 28% of the health sector while biotech makes up 13%, so that these sectors will weigh down the whole sector. One would think that health care would outperform during a global pandemic – and most sectors did see a big bounce during the height of the COVID-19 outbreak. But the pandemic has created the impetus for a stimulus splurge that has fired up the cyclical parts of the economy. It has also underscored the industry’s public role and undercut its profit-making capabilities, not least by producing a Democratic sweep bent on improving US health outcomes – at the expense of US health industry profits. In sum, from a tactical point of view, health care stocks are well-positioned for a near-term rally in relative performance but from a strategic point of view they continue to face policy headwinds and should be underweighted relative to the broad S&P 500. Tactically, stay short the managed health care sub-sector relative to the S&P 500 (Chart 14). Strategically, go long health care facilities and equipment relative to the health care sector. Chart 14Health Stocks Outlook Under Biden Administration
Health Stocks Outlook Under Biden Administration
Health Stocks Outlook Under Biden Administration
Matt Gertken Vice President Geopolitical Strategy mattg@bcaresearch.com Jesse Anak Kuri Associate Editor jesse.Kuri@bcaresearch.com Appendix Table A1APolitical Capital: White House And Congress
Don't Forget Biden's Health Care Policy
Don't Forget Biden's Health Care Policy
Table A1BPolitical Capital: Household And Business Sentiment
Don't Forget Biden's Health Care Policy
Don't Forget Biden's Health Care Policy
Table A1CPolitical Capital: The Economy And Markets
Don't Forget Biden's Health Care Policy
Don't Forget Biden's Health Care Policy
Table A2Political Risk Matrix
Don't Forget Biden's Health Care Policy
Don't Forget Biden's Health Care Policy
Table A3Biden’s Cabinet Position Appointments
Don't Forget Biden's Health Care Policy
Don't Forget Biden's Health Care Policy
Footnotes 1 During the election crisis [of 1876], Kentucky Democrat Henry Watterson urged that “a hundred thousand petitioners” and “ten thousand unarmed Kentuckians” go to Washington to see that justice was done. Years later, when he was sitting next to [Ulysses S.] Grant at a dinner party, Watterson told him, “I have a bone to pick with you.” “Well, what is it?” asked Grant. “You remember in 1876,” said Watterson, “when it was said I was coming to Washington at the head of a regiment, and you said you would hang me if I came.” “Oh, no,” cried Grant, “I never said that.” “I am glad to hear it,” smiled Watterson. “I like you better than ever.” “But,” added Grant drily, “I would, if you had come.” See Paul F. Boller, Jr, Presidential Campaigns: From George Washington To George W. Bush (Oxford: Oxford University Press, 2004 [1984]), p. 141. 2 See Jeremy Samuel Faust, Harlan M. Krumholz, and Chengan Du, “All-Cause Excess Mortality and COVID-19-Related Mortality Among US Adults Aged 25-44 Years, March-July 2020,” Journal of the American Medical Association, December 16, 2020, jamanetwork.com. 3 The death of Senator Edward Kennedy forced the Democrats to use reconciliation for the second part of President Obama’s health care reform, the Healthcare and Education Reconciliation Act of 2010. 4 Currently the Medicaid rebate cap is set at 100% of the cost of making a drug. Other provisions would include a boost for rural health care services (a partial reallocation of headline COVID relief funds) and an expansion of Obamacare tax credits and subsidies for unemployed workers to keep their former employer-provided insurance. These are mainly COVID relief measures rather than aspects of Biden’s long-term health agenda. See Julie Rovner, “KHN’s ‘What the Health?’: All About Budget Reconciliation,” Kaiser Family Foundation, February 11, 2021, khn.org; see also Nick Hut, “A look at some of the healthcare-specific provisions in the pending COVID-19 relief legislation,” Healthcare Financial Management Association, February 10, 2021, hfma.org. 5 For the CBO’s original report on repeal, see “Budgetary and Economic Effects of Repealing the Affordable Care Act,” Congressional Budget Office, June 19, 2015, cbo.gov. More recently see Paul N. Van de Water, “Affordable Care Act Still Reduces Deficits, Despite Tax Repeals,” Center for Budget and Policy Priorities, January 9, 2020, cbpp.org. 6 See BCA Global Investment Strategy, “The Fed’s Dilemma,” May 12, 2017 and “Four Key Questions On The 2018 Global Growth Outlook,” January 5, 2018, bcaresearch.com. Regarding the debate around Obamacare, promoters highlight the recovery in US growth and jobs – including full-time jobs and small-business jobs – by 2015. Critics say the recovery would have been stronger if not for the law. See e.g. Casey B. Mulligan, “Has Obamacare Been Good for the Economy?” Manhattan Institute, Issues Brief, June 27, 2016, manhattan-institute.org; Cathy Schoen, “The Affordable Care Act and the U.S. Economy: A Five-Year Perspective,” Commonwealth Fund, February 2016, commonwealthfund.org. 7 Republican Senator Chuck Grassley co-sponsored a bill with his Democratic counterpart Ron Wyden of Oregon that would penalize drug companies that raised drug prices faster than inflation. In a separate bill with Senator Amy Klobuchar of Minnesota, he also proposed to prevent big name drug companies from paying generic drug-makers to delay the introduction of generics to the market. These bills were not debated on the main floor because then-Senate Majority Leader Mitch McConnell was unenthused about them but they exemplify the bipartisan consensus on government intervention to push down drug prices.
Last year we created two baskets of stocks to capture the economic reopening theme by constructing a long/short pair trade. This year, we crystallized 21.5% in gains from that pair trade and subsequently reopened it. Today, we take a new angle at the economic reopening theme and pit “Back-To-Work” laggards against leaders. First, we filtered for well-behaved cyclical industries among all the sectors and sub-sectors we cover. We define a well-behaved cyclical industry as one that trailed the SPX from February 19, 2020 to March 23, 2020; and then outpaced the broad market from March 23, 2020 to today (all computations are in relative to SPX terms). Chart 1
How To Play The Reopening Trade Now Using US Equity Baskets
How To Play The Reopening Trade Now Using US Equity Baskets
Such filtering excluded all of the defensive & cyclical industries that outperformed the market during the recession, and it also excluded those industries that were too damaged by the pandemic and could not recover above the March 23rd trough level (for example, airlines) always in relative terms. The appendix on page 4 has a stylized depiction of our analysis. In total 27 industries survived the filtering. We then computed what is the minimum percentage increase required in order for each group to recover to its February 19 level, and then calculated the difference between that required increase and the one that actually materialized. A positive value signifies that the sector climbed above its February 19 level, whereas a negative value means that the sector still has not recovered. Chart 1 displays the results. Our rationale is as follows: should the economic recovery and normalization themes continue unabated as we expect, then the risk/reward trade-off of owning the “laggards” is greater than the “overshooters”: the former have ample upside potential left, whereas the latter are already discounting a lot of good news. We deem there is an exploitable opportunity within the reopening theme and today we recommend investors institute a new long reopening industry “laggards”/short “overshooters” pair trade (excluding the GICS1 sectors). Chart 2
How To Play The Reopening Trade Now Using US Equity Baskets
How To Play The Reopening Trade Now Using US Equity Baskets
Chart 2 plots the ratio of the two baskets against the ISM manufacturing prices paid sub-component and the 10-year US Treasury yield and supports our rationale that the “laggards” have a long runway ahead versus the “overshooters”. Finally, as a proxy for this trade we also include tickers for the largest stock in each sub-sector (excluding GICS1). Laggards: V, BLK, HCA, MCD, HON, AXP, JPM, COP, PSX, MAR, SLB. Overshooters: EMR, BLL, LIN, NUE, UNP, HD, DHI, CAT, MS, J, TSLA, AMAT. We are aware of some minor conflicts between the “Overshooters” and the “Back-To-Work” basket and also versus our current recommendations table, but we still recommend investors put on this trade pair trade. Bottom Line: Institute a new long USES “Laggards” basket/short USES “Overshooters” basket pair trade. Appendix
How To Play The Reopening Trade Now Using US Equity Baskets
How To Play The Reopening Trade Now Using US Equity Baskets
A Positive For The Rally
A Positive For The Rally
In the last week’s Strategy Report we highlighted how the often-heavy-lifting tech sector’s profit growth contribution to calendar 2021 SPX earnings is giving way to other GICS1 industries. Historically, the tech sector commanded the lion’s share of profit explanation for the SPX, but not in 2021. In fact, the S&P IT sector is ranked 4th in terms of contribution to overall SPX profits, behind industrials, financials and consumer discretionary (see chart). Additionally, the tech sector no longer sports an earnings weight similar to its market cap weight as it has run ahead of itself. This is also the case because the rest of the sectors are playing catch up this year as the US economy is slated to reopen on the back of the herculean inoculation efforts (profit weight and mkt cap weight columns, Table 1). In fact, the metric of market cap weight minus the sector’s earnings weight is a rough valuation measure highlighting that tech stocks are 5x to 10x more expensive than their deep cyclical peers (industrials, materials and energy, last column, Table 1). Bottom Line: A broader-based participation in the equity rally is a healthy backdrop for the cyclical return prospects of the SPX. Table 1
A Positive For The Rally
A Positive For The Rally
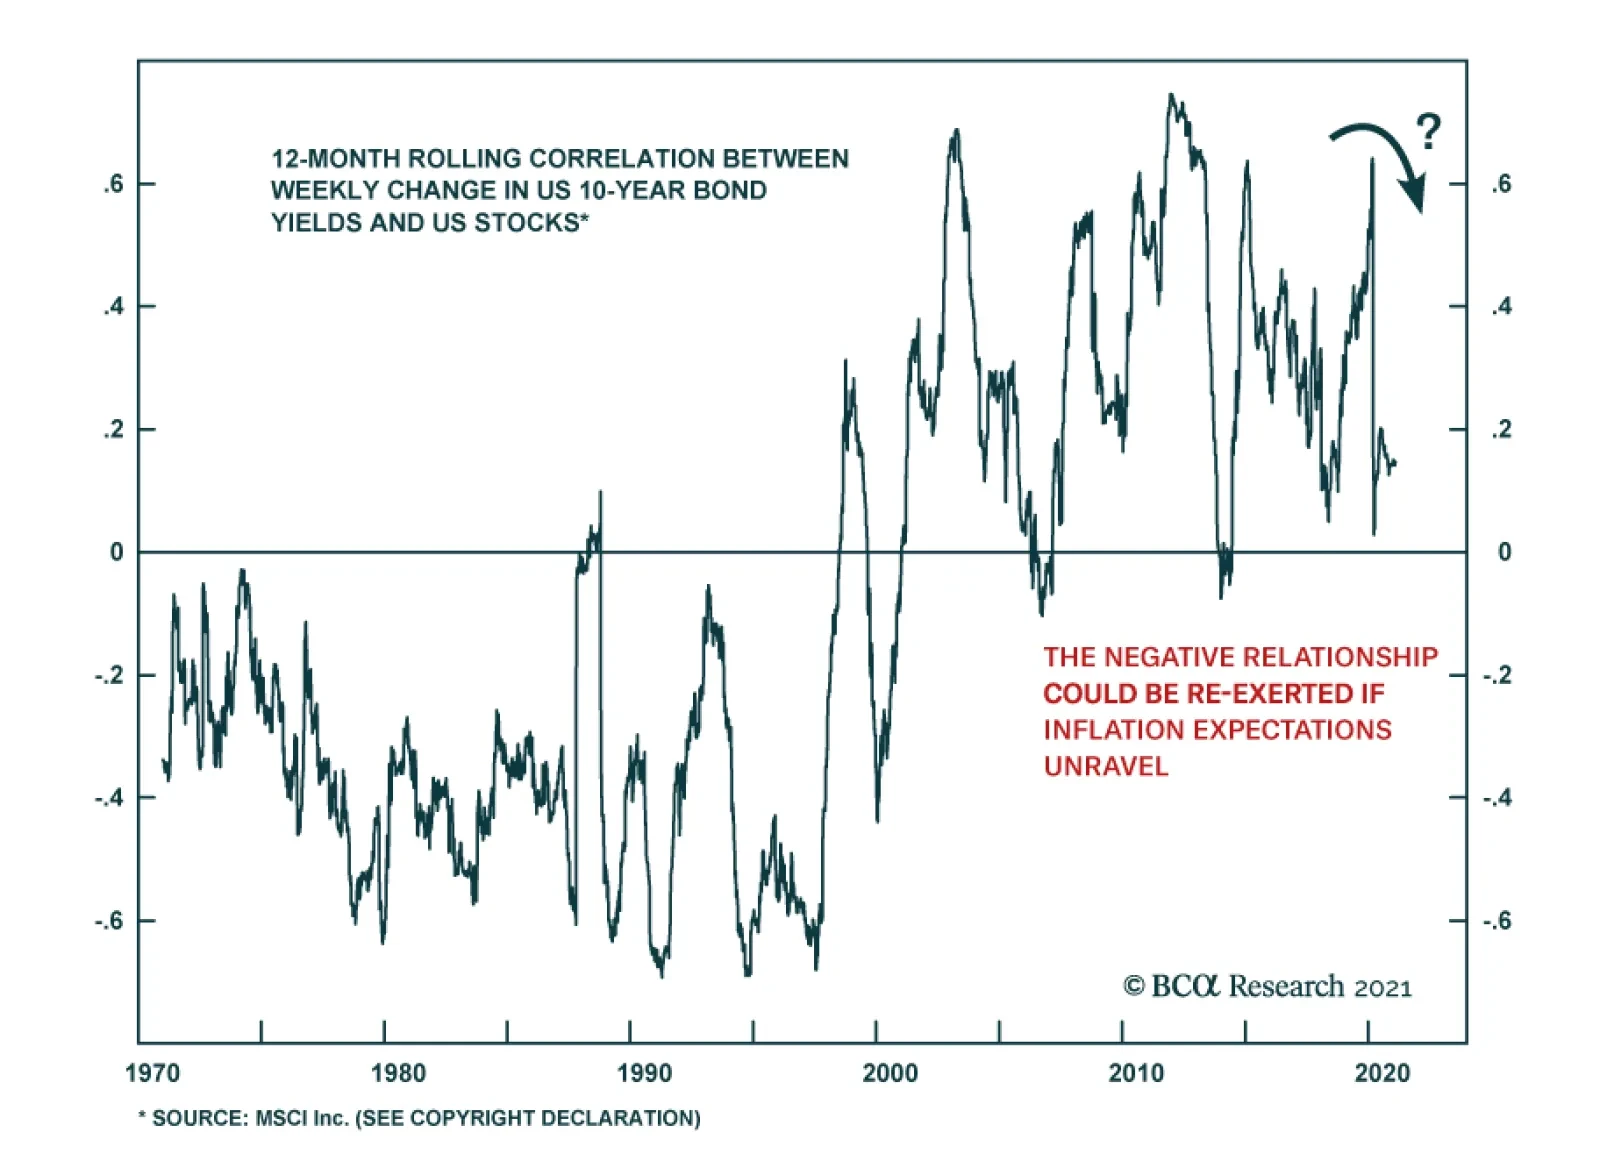
Last week, we observed that evidence from the past decade suggests that higher yields are not always a risk to stock prices, as long as the yield increase reflects favorable economic conditions, which also push up the dividend growth rate. Evidence from a…
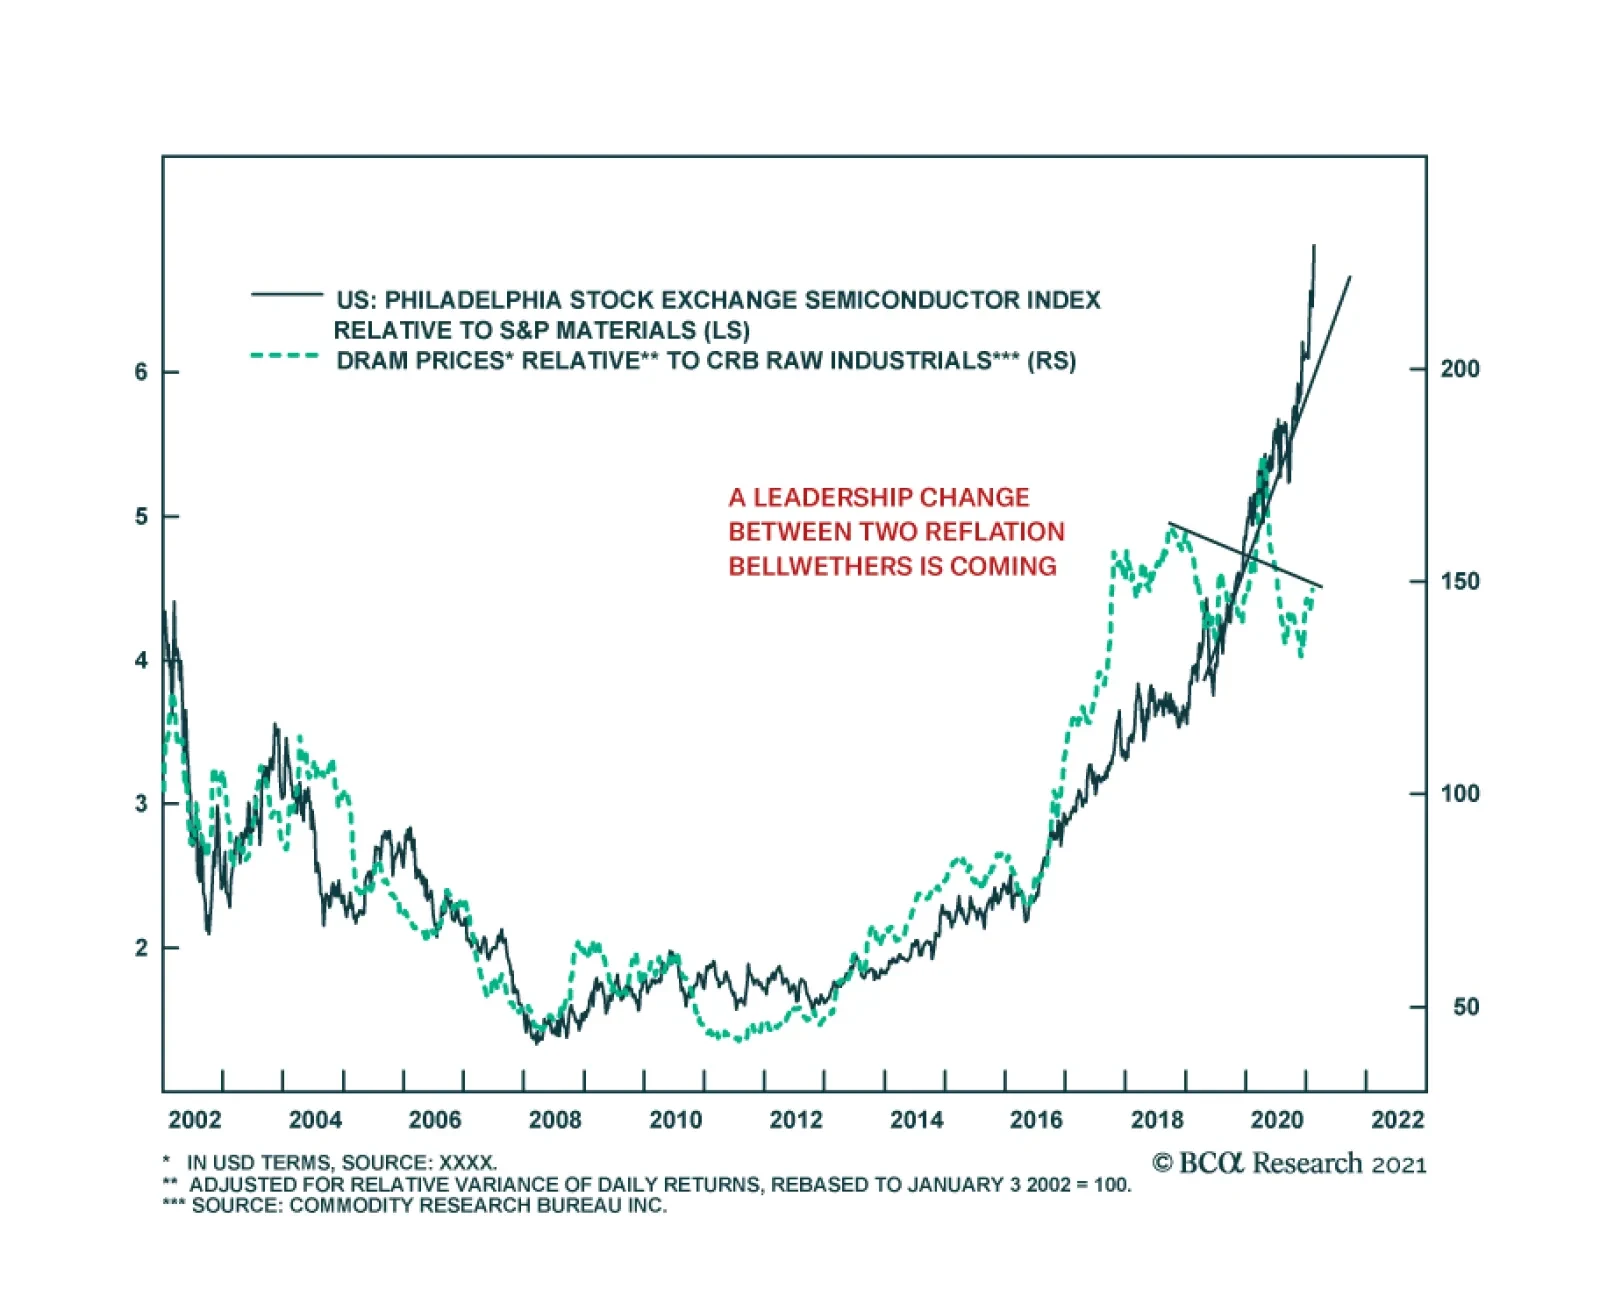
Semiconductor equities continue to defy gravity. Semiconductors are a high beta play on the global recovery and the strength of the technology sector. That has made them a prime beneficiary of the reflationary environment that has been crucial to the stocks…
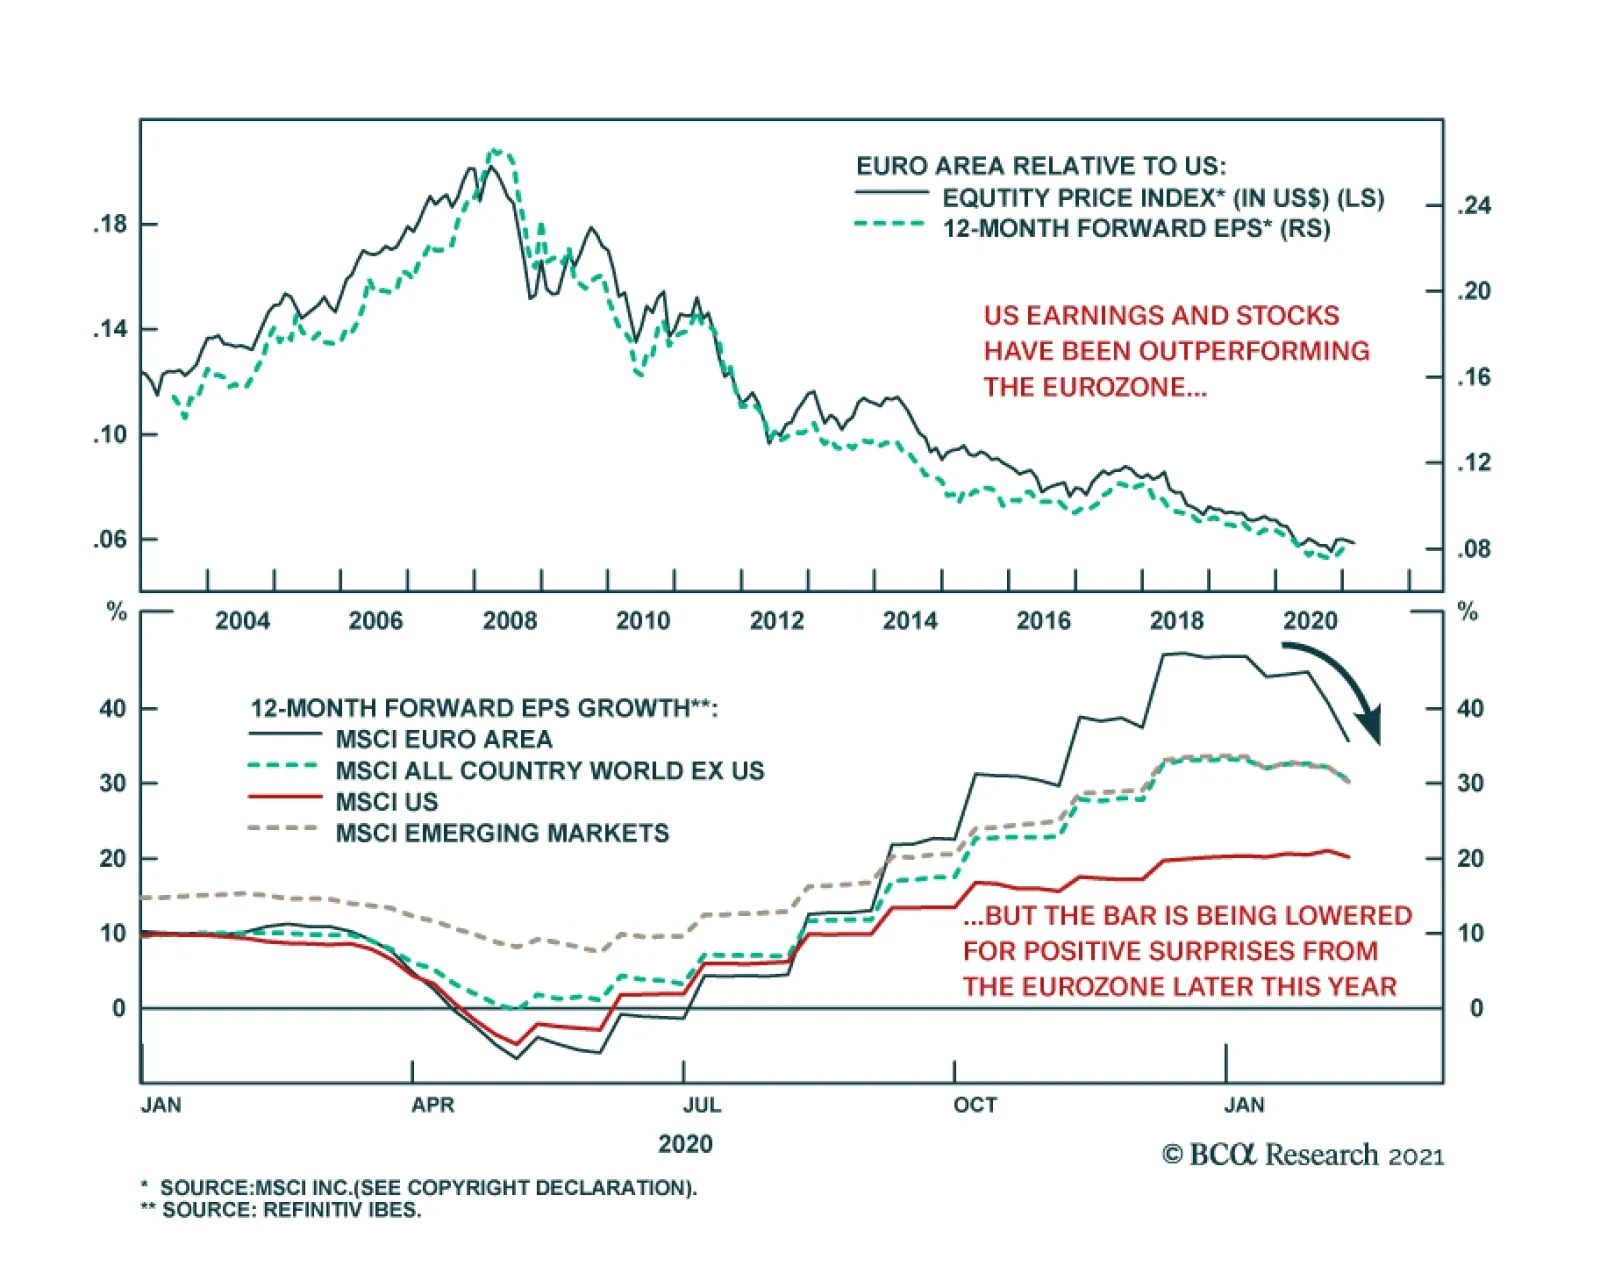
European equities lagged US ones throughout the bulk of last year, and continue to do so in 2021. Several factors explain this mediocre performance. The euro’s strength tightened monetary conditions in the euro area and is weighing on corporate…
Prepare To Lock In Gains In The Cyclicals/ Defensives Portfolio Bent
Prepare To Lock In Gains In The Cyclicals/ Defensives Portfolio Bent
Chinese data is waving a red flag as we highlighted in this Monday’s Strategy Report where we also instituted a 2.5% rolling stop to the cyclicals vs. defensives ratio. Not only are the Chinese authorities trying to engineer a slowdown with the recent reverse repo operations, but also BCA’s China Monetary Indicator and the selloff in the Chinese sovereign bond market are all corroborating the economic deceleration signal (top & middle panels). Railway freight (and infrastructure spending) data also highlight that not everything is as rosy as it appears to the naked eye in the Middle Kingdom, giving us even more reasons to worry about the longevity of the US cyclical/defensive bull market run (bottom panel). Finally, the cyclical/defensive ratio is sitting 14% above its 200-day moving average confirming the dual stretched message that our valuation and technical indicators are emitting (not shown). Bottom Line: We put a 2.5% rolling stop on the cyclicals vs. defensives ratio in order to protect gains north of 17% since inception. Should it get triggered, we will downgrade the ratio from overweight to neutral via trimming the niche materials sector to a benchmark allocation. Stay tuned.
Highlights Volatility subsided but we still think geopolitical risk is underrated in the near term. The new Biden administration faces critical tests on China/Taiwan and Iran. The Biden-Xi phone call did not resolve anything. We recommend investors hedge geopolitical risk by adding a tactical long CHF-USD. The medium-to-long-term macro backdrop is shifting in favor of frontier markets – but it is too soon to dive in. African frontier markets have not yet benefited from the global economic recovery – and may face more pain in the near term. The Ethiopian crisis will further destabilize the Horn of Africa region. Kenya is the relative beneficiary in geopolitical terms, though Kenyan stocks are expensive relative to other frontier markets. Feature Volatility subsided over the past two weeks, global stocks rallied, and bond yields rose. The US dollar bounce lost some of its steam. From a macro point of view, we understand investor exuberance. But from a geopolitical point of view, risks are now understated. President Joe Biden faces imminent tests from China, Iran, and Russia. Table 1 provides a checklist of what we need to see to conclude that a new US-China modus vivendi has been established. The phone conversation between Presidents Biden and Xi Jinping on February 10 is marginally positive but, judging by history, the call shows that tensions remain high.1 Until these conditions are met the two sides are hurtling toward a diplomatic crisis over the Taiwan Strait sometime after China emerges from its annual National People’s Congress. Incidentally, China’s ongoing policy shift toward slower and more disciplined growth will be the takeaway from this year’s legislative session, which is not positive for global cyclicals or China plays beyond the near term. China’s credit impulse has decisively rolled over and the combined fiscal-and-credit impulse is peaking now (Chart 1). Table 1First Biden-Xi Call Did Not Resolve US-China Tensions
Frontier Markets And The Ethiopian Crisis
Frontier Markets And The Ethiopian Crisis
Chart 1China's Fiscal-And-Credit Stimulus Peaking Now
China's Fiscal-And-Credit Stimulus Peaking Now
China's Fiscal-And-Credit Stimulus Peaking Now
A crisis is also brewing in the Middle East. Iran is not going to abandon its quest for nuclear weapons over the long run but it is willing to negotiate a deal in the short run that reduces US sanctions. Especially if lame duck President Hassan Rouhani gets it done before he steps down in August. The next Iranian president will not want to make the same mistake Rouhani made and bet his future on the unreliable United States. This requires Biden to rejoin the existing 2015 nuclear deal with a vague commitment to negotiate a better deal later. However, this outcome is precisely what Israeli officials have called a “calamity.” 2 The Biden team gives Iran three-to-four months before it has enough highly enriched uranium to make a bomb – it wants to move quickly on negotiations. Israel gives it a year – it wants to convince the Democrats to stick with Trump’s maximum pressure. Either way the first half of this year is crunch time. Otherwise Iran’s new administration will require a much longer negotiation. Negotiations will be checkered with attacks to demonstrate credible threats and red lines. Ultimately, since we expect Biden to forge a US-Iran détente, and since the China/Taiwan risk is negative for energy prices, we no longer express our Iran view in the form of a long oil position. Brent crude is close to our Commodity & Energy Strategy’s $63 per barrel target for this year’s average. The Saudis could abandon their production discipline when Iranian oil gets closer to coming online. Investors should distinguish these immediate geopolitical risks from the general, long-running US-China and US-Iran conflicts. These will wax and wane while global risk assets grind upward over the long haul. If China avoids over-tightening policy and the Biden administration passes early hurdles we will be more bullish. For now we recommend investors hedge their bets by increasing exposure to safe-haven assets. We remain long gold and Japanese yen. Tactically we recommend going long the Swiss franc versus the dollar as well. Finally, in what follows, we take a sojourn from these headline geopolitical risks to offer a special report on the Ethiopian crisis and implications for Africa, Europe, and frontier markets. Now is not the right time to dive headlong into African frontier markets given the risks outlined above but we do see an opportunity on the horizon. Is The Ethiopian Crisis Investment Relevant? Ethiopia is now in its fourth month of crisis. The country is grappling with internal conflict brought upon by political and ethnic differences among the former and current ruling elite. Over the past week, Ethiopian Prime Minister Abiy Ahmed spoke with US Secretary of State Antony Blinken, French President Emmanuel Macron, and German Chancellor Angela Merkel about reports that Eritrean soldiers have entered the fray. East Africa will become increasingly unstable as conflict persists, threatening security, migration, and investment into the region. Investors looking to frontier markets in light of the global liquidity explosion should exercise caution. Peacemaking Abiy Goes On The Offensive Ethiopian government forces continue to battle a minority group, the Tigray People Liberation Front (TPLF), in the north of the country. Large-scale attacks, like those seen at the start of the conflict, have mostly diminished. However, both sides continue to maintain their offensive positions. With the recent entry of Eritrean forces into Ethiopia to support the government’s battle against the TPLF, conflict between government forces and the TPLF will continue at the very least. Tensions between the government of Prime Minister Abiy and the Tigray people have been in play for years. The Tigray largely dominated Ethiopia’s ruling coalition and security forces until the past decade. Public protests in 2015 were driven by frustration over laws that denied Ethiopians basic civil and political rights. In 2018, a popular uprising brought Abiy to power and he ushered in democratic reforms and an end to conflict with neighboring Eritrea. Abiy’s “reforms” are so far of limited relevance to investors. He released several high-profile political prisoners, lifted a draconian state of emergency, and planned to amend the constitution to institute term limits for prime ministers. Some civil liberties were restored. The investment-relevant aspect of the reforms were proposals to end government monopolies in key economic sectors, including telecommunications, energy, and air transport – but these have yet to happen. Abiy was most eager to dismantle Ethiopia's previous ruling party, the Ethiopian People's Revolutionary Democratic Front (EPRDF), which was dominated by the Tigray and had run the country for 28 years. Abiy supplanted the EPRDF with a single national Prosperity Party, which was not organized on ethnic lines. Having controlled all facets of state power prior to its ouster in 2018, the TPLF views Abiy’s democratic reforms and proposals for economic liberalization with anxiety. Abiy’s interest in reforming the federalist structure of the Ethiopian state - which divides Ethiopia into nine self-governing ethnic territories - threatens to undermine the order that has historically permitted the small Tigrayan ethnic group to wield a power disproportionate to its population (Chart 2). Chart 2Major Ethnic Groups In Ethiopia
Frontier Markets And The Ethiopian Crisis
Frontier Markets And The Ethiopian Crisis
Abiy is an Oromo by origin and thus a member of Ethiopia’s largest ethnic group. His espousal of a broader nationalist agenda over narrow ethnic priorities is viewed by many of the smaller ethnic groups as eroding the right to self-rule. This includes secession, which is granted by the Ethiopian Constitution to ethnically organized regions. The TPLF has also expressed unease with Abiy over his intentions to amend the Constitution, which provides the basis of the current ethnic federalism. In defiance, the TPLF broke away from the Prosperity Party and attempted to unite opposition forces under a new federalist coalition. Failing to do so led the TPLF to isolate itself from the country’s political process. Bottom Line: As is often the case in geopolitics, the media hype about the election of a young peacemaker and would-be reformer masked the reality that Ethiopia’s old regime was coming apart at the seams. Abiy And The TPLF Faceoff Since 2019, Abiy has accused the TPLF of trying to destabilize the country and suggested that the TPLF were responsible for several mass ethnic killings across Ethiopia. Matters worsened in March 2020, during the collapse of the global economy amid the COVID-19 pandemic, when Abiy postponed national and regional elections scheduled for August, causing mass discontent among the TPLF. Abiy claimed he postponed the election because of the pandemic, citing the risks involved in mass in-person voting. But Tigray leaders feared a power grab. This is because the 2020 election was to serve as a litmus test on Abiy. Furthermore, opposition parties believe the Prosperity Party has achieved little economic policy cooperation and support among other parties, which would weaken the prospect of Abiy forming a coalition government if need be. In essence they hoped to claw back some power during the election and its deferral sent them into revolt. Relations soured further in September 2020 when the TPLF went forward with elections in Tigray, despite the rest of the country holding out for the delayed 2021 elections. The TPLF reported an overwhelming victory in the popular vote. The newly installed regional legislators in Tigray immediately declared that Abiy’s government lacked legitimacy to govern the country and refused to recognize it. The national assembly countered by annulling Tigray’s election results and refusing to acknowledge the newly elected leadership. Federal funding to the region was slashed significantly, limiting the flow of resources only to local governments to keep basic services running. The leadership in Mekele, the capital of Tigray, called the cessation of funding a declaration of war. Tensions boiled over into physical violence between government troops and the TPLF in November 2020. Widespread military attacks had been reported almost weekly between November and December often with many casualties of military personnel, TPLF members, and civilians. In 2021, attacks have significantly decreased, but TPLF resistance remains strong and intact in the North of the country. While the local economy was hard-hit by the fighting, it is not clear how long the local economy can sustain the state of resistance by both government forces and the TPLF. Bottom Line: Violence and war will continue between Abiy and the TPLF for the foreseeable future. Peace is hard to see happening at the current juncture, as Abiy looks to increase the power of his government and the TPLF fights to retain vestiges of its former power. Conflict Derails Economic Progress Ethiopia has averaged double-digit growth over the past decade, driven by large-scale fiscal spending and foreign direct investment. The country’s consumer base is also rising – 110 million people make the country the second most populous in Africa, with 50% of working age. But COVID-19 has put the brakes on future growth expectations, now penned at levels last seen in the early 2000s (Chart 3). Post 2021, growth is expected to rise significantly, but protracted mass social unrest brought about by internal conflict will see the economy grow at much lower levels. Offering a reprieve to the country’s economic woes is coffee bean production, Ethiopia’s chief export, which is mostly to the east of the country. Futures markets have priced in rising risk since the onset of the conflict. Transporting coffee beans would have to move through the north east of the country to the nearest port for export, in Djibouti. Moving through this part of the country raises the risk of encountering sporadic conflict. Chart 3Ethiopia Economic Growth
Frontier Markets And The Ethiopian Crisis
Frontier Markets And The Ethiopian Crisis
Chart 4Horn Of Africa Output Per Head
Frontier Markets And The Ethiopian Crisis
Frontier Markets And The Ethiopian Crisis
In 2000, Ethiopia was the third-poorest country in the world. More than 50% of the population lived below the global poverty line—the highest poverty rate in the world. Just two decades later, Ethiopia almost doubled GDP per capita wealth – a noteworthy achievement. But the country is still only comparable to Uganda, a much smaller, less developed economy to the southwest (Chart 4). Whilst income shared across the country has been rising, Abiy’s government runs the risk of eroding several years of economic gains that have been felt throughout the population by maintaining its battle against the TPLF. An economic crisis now would exacerbate the conflict and pull Ethiopia’s economy further into recession and poverty. Bottom Line: The Ethiopian conflict will persist in the coming years, resulting in the deterioration of many years of hard-earned economic development. The TPLF’s military and economic resources may be fast declining, but the conflict is domiciled on home ground – the Tigray region – and is widely backed by the Tigray people. International criticism is unlikely to deter Abiy from trying to minimize the TPLF’s political prowess. His popularity will allow him to keep his hard line. Yet Abiy will have to deal with an economy that will further decline as fighting continues. Regional Stability At Risk? The Horn of Africa is a gateway to the Suez Canal and as such a strategically important region. Its coastal opening on the Red Sea positions it along the critical maritime trade artery linking Europe and Asia. The Horn of Africa is also a fragile region that has seen severe conflict over the past decades: a civil war in Somalia and continued attacks by Al-Shabaab; piracy off the coast of Somalia; civil war in Darfur and South Sudan; proximity to the civil war in Yemen; ethnic unrest in Ethiopia; and the securitization of the Red Sea, as exemplified by Djibouti, which now hosts more foreign military bases than any other country in the world. Ethiopia is the African linchpin of the region’s long-term stability. The country runs a successful peacekeeping mission in neighboring Somalia. This will end if conflict with the TPLF continues to escalate. The country contributes around 4,000 of the 17,000 troops under the African Union’s mission and has around 15,000 additional soldiers in Somalia on its own — more than any other nation. If need be, troops will be pulled from Somalia to fight the TPLF, creating a security vacuum in Somalia where Al-Shabaab would revive. To make matters worse, US troops began withdrawing from two bases in Somalia in October. Though former President Trump failed to pull all US troops from the country, and President Biden is ostensibly in favor of maintaining US global engagement, it remains to be seen whether the US will put real pressure on Ethiopia to halt the conflict, such as threatening to cut its roughly $1 billion in annual aid. Many of the 700-odd US forces in Somalia train and support Somali special forces (Danab), who seek to contain the Al-Shabaab insurgency. Considering that Al-Shabaab has carried out deadly attacks on civilians throughout the East African region, such as the Westgate shopping mall attack in Kenya eight years ago and an attack on a US military base in Kenya that killed 3 Americans in January 2020, terrorism will pick up if regional security efforts are reduced. Bottom Line: Neither Ethiopia nor international terrorism are high on the Biden administration’s list of things to do. At home Biden is focused on domestic legislation to handle the pandemic and economic recovery. Abroad he is focused on restoring the 2015 Iranian nuclear deal and countering China’s and Russia’s regional ambitions. The Europeans, for their part, will react with lukewarm punitive economic measures toward Ethiopia, as they are not wishing to destabilize the region any further. Migration Will Follow After Conflict For global investors a more pertinent concern may be the rise in displaced persons, asylum seekers, and refugee populations in the region. At the end of 2019, Sub-Saharan Africa had 16.5 million internally displaced persons and 6.5 million refugees. Of this, the Horn of Africa hosts 8.1 million internally displaced persons and 4.5 million refugees and Ethiopia hosts 1.7 million displaced persons and 700,000 refugees. Note that these numbers come from the year before Ethiopia’s tensions boiled over – Ethiopian refugees will surge in 2020-21. In terms of migrants outside of Africa and originating from Ethiopia, there were 170 000 refugees and asylum seekers at the end of 2019 (Chart 5). Refugees, asylum seekers, and displaced persons will multiply as conflict rages. Neighboring countries like South Sudan, Sudan, Eritrea, and Somalia, which are already stretched in their capacity to hold such persons, will be overwhelmed. Already, these four countries alone account for approximately 4.4 million refugees, making up more than half of Africa’s total number of refugees (Chart 6). While Ethiopia’s contribution to the continent’s migrant base (both refugees and asylum seekers) is small (2.2%) in comparison to its neighbors, it is this very reason that suggests destabilization will add significant numbers to the growing crisis on the continent. Chart 5Ethiopian Refugees And Asylum Seekers
Frontier Markets And The Ethiopian Crisis
Frontier Markets And The Ethiopian Crisis
Chart 6African Refugees And Asylum Seekers
Frontier Markets And The Ethiopian Crisis
Frontier Markets And The Ethiopian Crisis
Europe and the Middle East are the two preferred regions for Ethiopian migrants. Europe received approximately 22% of Ethiopian-born refugees and asylum seekers in 2019, again, prior to the outbreak of civil war (Chart 7). Chart 7Ethiopian And African Refugees In The EU
Frontier Markets And The Ethiopian Crisis
Frontier Markets And The Ethiopian Crisis
With reports suggesting that an additional 600,000 displaced persons have emerged due to this year’s conflict, and another 40,000 refugees, the EU could see an additional 10,000 migrants from Ethiopia alone over the next year. On top of that would be counted any increase in refugees and asylum seekers resulting from increasing instability in the Horn of Africa. A more intense conflict will drive the numbers up dramatically. Bottom Line: The effects resulting from conflict in the region’s most populous and stable economy will carry over into neighboring countries, such as Somalia, exacerbating the refugee and economic crises in the Horn of Africa and ultimately increasing the risk of greater immigration into Europe. In comparison to the Syrian refugee crisis, Ethiopia is not in a state of utter collapse like Syria but if it did collapse it would pose a larger risk to Europe. Ethiopia’s population is four times larger than that of Syria’s in 2011. Syria counted 6 million internally displaced persons and almost 5 million refugees (approximately 25% of the population) at the start of the civil war. From the 5 million refugees, 2% made their way into Europe. A civil war of a similar magnitude in Ethiopia would result in almost 28 million refugees (25% of 110 million population), and 600 000 refugees heading toward Europe, by the same metrics. Surrounding Markets Will Benefit From Re-Directed Investment Direct investment flows from the country’s primary benefactor, China, have helped to spur Ethiopia’s growth and development. The country has received approximately 67% of all Chinese direct investment funds into the Horn of Africa since 2005 and 8% of the total in Sub-Saharan Africa (Chart 8). Chart 8China Slows Investment In Africa
Frontier Markets And The Ethiopian Crisis
Frontier Markets And The Ethiopian Crisis
The trend has turned down over the past couple of years, with Chinese officials citing over-exposure to Ethiopia as a reason for lower outward investment into the country. In this sense China appears to have recognized a growing problem in Ethiopia in recent years. Infrastructure projects such as the Addis Ababa-Djibouti railway have resulted in large losses for Chinese firms due to insecurity and liability risks. For example, parts of railway have at times been rendered inoperable due to infrastructure theft or sabotage, or by intentional accidents by civilians to claim liability against the railway line’s constructor and operators. Rising conflict in Ethiopia will squeeze Chinese interests out of the country and redirect them to more stable markets, such as Kenya, to expand its Belt and Road Initiative along the East African coast (Chart 9). Kenya has at times received more direct investment from China than Ethiopia. China’s various problems with investment projects in Kenya pale in comparison to Ethiopia’s general instability. A nudge toward a more sustained flow of funds to Kenyan projects is now on the horizon. China could build further economic interest in neighboring Uganda but political risk continues to rise in the country after a contested election saw the country’s ruler for the past 35 years, Museveni, win his sixth term in office. The same holds for other foreign investment flows into Ethiopia. On a net basis, foreign direct investment into Ethiopia has been declining since 2016, while neighboring Uganda and Kenya have recorded upticks over the same period (Chart 10). Chart 9China’s Investment In East Africa
Frontier Markets And The Ethiopian Crisis
Frontier Markets And The Ethiopian Crisis
Chart 10Kenya And Uganda Will Get More Investment
Frontier Markets And The Ethiopian Crisis
Frontier Markets And The Ethiopian Crisis
Bottom Line: Foreign direct investment into Ethiopia and the region has been declining, even from China and even prior to the 2020 crisis. Investors and foreign flows will look to relatively more stable markets, such as Uganda and Kenya, to take on longer-term risk. Where To From Here? The longer Abiy drags out military operations, the likelier the Tigray conflict could metastasize into an humanitarian crisis and ultimately civil war. While political survival is at the forefront of Abiy’s considerations, he has broadly staked his international reputation on being a reform-minded innovator who will usher in needed change to Ethiopia. A key question is whether Abiy will now move to de-escalate the conflict – to bring military operations to a close and turn his attention to reconciliation. The Ethiopian army’s convincing victory in Mekelle provides Abiy with a valuable off-ramp to enter negotiations and pivot back to his reform agenda. If Abiy does not take advantage of this moment, he risks undermining Ethiopia’s fledgling economy, fostering a prolonged humanitarian crisis, getting stuck in a protracted armed conflict, and destroying his international reputation. The EU has already delayed payment of 90 million euros in aid in the wake of the conflict, and is threatening to withhold more from the 2 billion euro aid package that the EU agreed to disperse to Ethiopia over several years. However, at present, Abiy remains defiant, stating that the offensive toward the TPLF is warranted and arguing that Ethiopia’s sovereignty is not “for sale” to international donors. Abiy will continue to put pressure on the TPLF unless they concede to federal supremacy. As the larger force in this battle, Abiy’s government will not back down. He has the backing of the military and neighboring forces such as the Eritrean military. His popularity has remained intact through the course of this latest conflict. With an upcoming national election, he is looking at the conflict as a way to consolidate control. Bottom Line: Abiy has the political capital to wait out the TPLF’s surrender, while the economy takes a knock from ongoing conflict. Investment Takeaways A major wave of immigration from the Horn of Africa into Europe would not have predictable financial consequences. The Syrian refugee crisis, which peaked in 2015, did not have a discernible impact on the Turkish lira, or Greek, Italian, or Turkish relative equity performance. It might have contributed to investor preference for the dollar over the euro but the real driver of euro weakness at that time stemmed from the European Central Bank’s quantitative easing and US relative growth and interest rates. A bounce in USD-EUR during the spike in refugees in mid-2016 cannot be attributed to interest rate differentials but it is brief (Chart 11). Thus the significance of any major wave of immigration in the post-COVID era will be found elsewhere – in politics and geopolitics. Chart 11Syrian Refugee Crisis A Political, Not Financial Event
Syrian Refugee Crisis A Political, Not Financial Event
Syrian Refugee Crisis A Political, Not Financial Event
The geopolitical consequence of the Syrian refugee crisis was ultimately a rise in European populism or anti-establishment politics. The political establishment mostly blunted this trend by cracking down on migrant inflows. That could change in future if border controls are relaxed or the magnitude of migration increases. Falling GDP per capita in Africa over the past decade alongside superior quality of life in Europe will continue to motivate immigration, especially if Africa’s growth disappoints expectations in the aftermath of the crisis (Chart 12). Conflicts such as in Ethiopia will generate more emigration. What about African frontier markets? Ostensibly the global backdrop is as bullish for frontier markets and specifically African frontier markets. Valuations are deeply depressed after a decade of strong dollar and weak commodity prices. Now global central banks are flooding the world with liquidity, the dollar is falling, and commodity prices are rising. China, Europe, and the US have stabilized their economies. However, it should be noted that Sub-Saharan Africa’s exports have lagged and therefore the economic pain is not yet over for this region even though improvement is on the horizon (Chart 13). If growth returns to trend then Sub-Saharan Africa’s real GDP should grow in line with emerging markets at a little less than 5% per year. This is better than Latin America, which also has a slightly smaller stock of gross domestic savings, though both regions are savings-poor and struggling to form fixed capital. Chart 12Disparity Between Europe And Africa
Frontier Markets And The Ethiopian Crisis
Frontier Markets And The Ethiopian Crisis
Chart 13Global Commodity Prices And African Exports Soaring
Global Commodity Prices And African Exports Soaring
Global Commodity Prices And African Exports Soaring
Chart 14Sovereign Credit Spreads
Sovereign Credit Spreads
Sovereign Credit Spreads
Emerging and frontier markets stand to benefit from low global interest rates and rising commodity prices but they need to see global economic stabilization first. Sovereign credit spreads have come down across the frontier markets, with African markets leading the way (Chart 14). However, debt levels are high in a number of these markets. Credit default swap rates are rising after their steep fall over the second half of last year (Chart 15). Emerging market equities have rallied sharply relative to developed markets and this trend should continue as the pandemic subsides and the global recovery gains steam. But frontier markets have underperformed emerging markets since mid-2019 and South Africa specifically since COVID-19, with no sign yet of reversing. Within frontier markets, African equities have outperformed since the first vaccines heralded a recovery in the global economy (Chart 16). Chart 15Credit Default Swaps
Credit Default Swaps
Credit Default Swaps
The COVID-19 crisis has affected emerging and frontier markets differently than developed markets given that youthful populations are least susceptible to dying from the disease. However, the economic impact has required monetary easing and currency depreciation. EM and FM central banks have undertaken unprecedented and unorthodox easing actions – similar to what is seen in the developed world – to cushion the blow. Chart 16Emerging Markets Vs Frontier Markets Vs African Markets
Emerging Markets Vs Frontier Markets Vs African Markets
Emerging Markets Vs Frontier Markets Vs African Markets
Not only have EM and FM central banks cut rates but they have also cut reserve requirements for banks, intervened in foreign exchange markets, and launched government bond purchases. South Africa has begun quantitative easing while Ghana has monetized debt. Table 2 provides a glimpse at equity performance, volatility, and relative valuations and momentum in frontier markets, including African frontier markets. Returns are paltry over the course of the COVID-19 crisis. African markets have generated a negative return during this period. The table shows valuations and momentum on a relative basis – that is, relative to other markets in the table. We include South Africa, a major emerging market, by comparison to indicate that frontier markets are not necessarily more volatile even though they are far cheaper. All of these stocks other than South Africa are cheap on a price-to-earnings basis and African markets look even better on a cyclically adjusted P/E basis. Table 2African Frontier Markets: Valuations, Momentum, Volatility
Frontier Markets And The Ethiopian Crisis
Frontier Markets And The Ethiopian Crisis
Chart 17Hold Off From Frontier Markets
Hold Off From Frontier Markets
Hold Off From Frontier Markets
Nigerian stocks are extremely cheap, they have benefited from the recovery in global oil prices, and they offer half as much volatility as South African stocks. They are even cheap relative to other African frontier markets like Kenya. However, the geopolitical situation is not stable. An incident of brutality from security forces last year did not lead to wider spread social unrest but the rapid growth of the population combined with the resource curse is not favorable for socio-political stability over the long term. Even in the short term Nigeria’s rally could be upset by a reversal in oil prices, which is possible if OPEC 2.0 fails to coordinate in the face of the eventual US-Iran deal. Moreover capital controls make risks excessive for most investors, as our Emerging Markets Strategy observes. Kenya is a geopolitical beneficiary of the Ethiopian crisis. It should receive greater foreign direct investment as a result of Ethiopia’s destabilization. However, this crisis is not a driver for Kenya’s equity markets. Rather, Kenya trades in line with the trade-weighted dollar. It is not a commodity play but a telecoms play. This has been a huge benefit over the past decade. Kenya is diversified and has a large manufacturing sector. It will eventually benefit from a revival of tourism. Kenyan stocks are cheap from a global point of view but not relative to frontier markets. The long-term trend of Kenyan stocks is flat whereas most African equities are falling (Chart 17). Our Emerging Markets Strategy team has highlighted that conditions will improve in the wake of material currency depreciation. From a tactical standpoint now is not the best time to dive into frontier markets or African frontier markets but an opportunity is around the corner. African exports have not recovered, several countries are pursuing monetary easing (thus weakening currencies), the US dollar is bouncing, and China’s credit impulse is rolling over. But the long-term global trends are supportive as long as China avoids over-tightening, interest rates stay low, and the dollar resumes its weakening path as we expect. Therefore we will devote more attention to frontier opportunities going forward as they offer the attraction of large capital gains and diversification. Matt Gertken Vice President Geopolitical Strategy mattg@bcaresearch.com Guy Russell Research Analyst GuyR@bcaresearch.com Footnotes 1 The absence of a Biden-Xi call would have been market-negative but the call itself does not suggest that tensions have declined yet. The American account shows Biden lecturing Xi Jinping. He kept the Trump administration’s language regarding a "free and open Indo-Pacific," chastised Xi for "coercive and unfair economic practices, crackdown in Hong Kong, human rights abuses in Xinjiang, and increasingly assertive actions in the region, including toward Taiwan." Cooperation will be "results-oriented" and based on the "interests" of the US. All of this, in diplomatic language, is fairly tough. The Chinese account consisted of Xi giving Biden an even longer lecture about the importance of cooperation over confrontation, equality of nations, and non-interference in domestic affairs, including core interests like Hong Kong, Xinjiang, and Taiwan. See "Readout of President Joseph R. Biden, Jr. Call with President Xi Jinping of China," the White House, February 10, 2021, whitehouse.gov; and "Xi speaks with Biden on phone," Xinhua, February 11, 2021, Xinhuanet.com. 2 See Yoav Limor, "IDF Crafting New Options To Counter Iranian Threat," Israel Hayom, January 14, 2021, israelhayom.com.