Equities
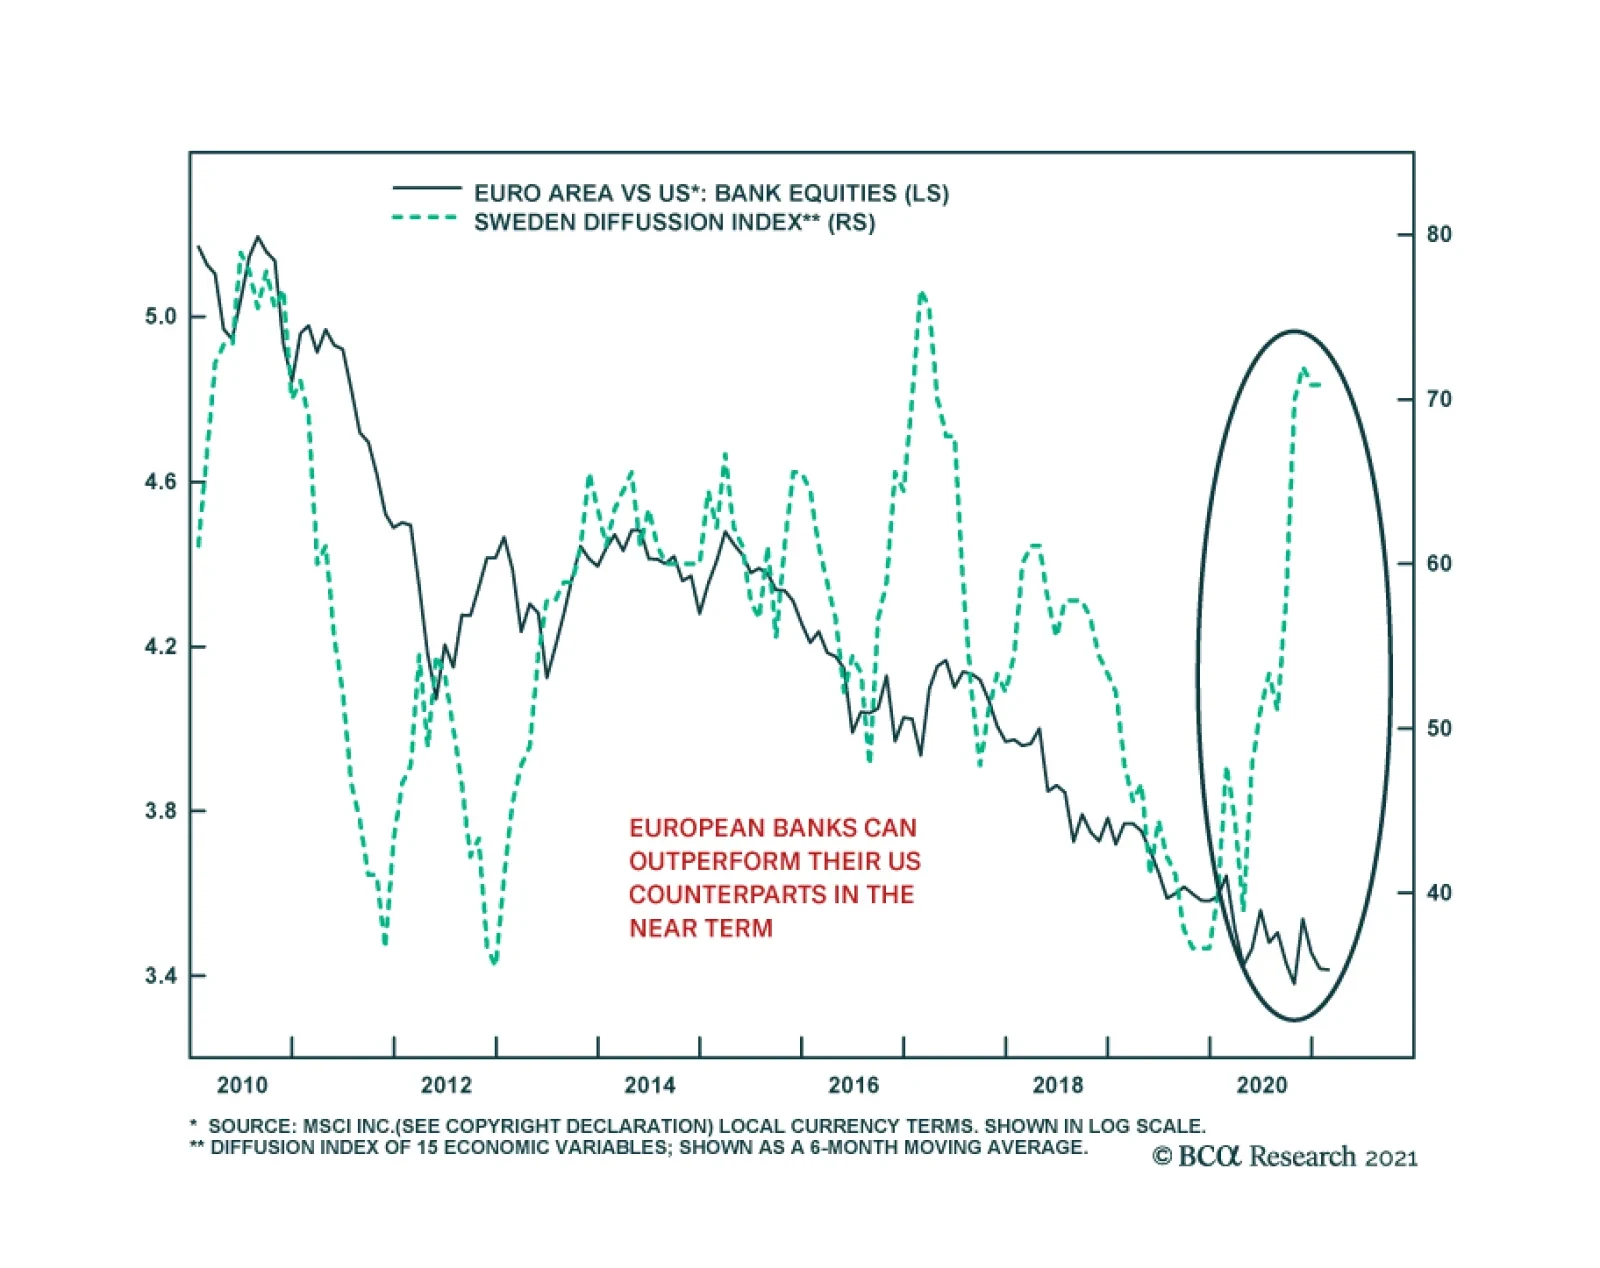
European banks face structural hurdles against their US counterparts. The return on equity of European banks stands well below that of the US, and the lower neutral rate of interest in Europe suggests that European banks will continue to face narrower net…

Highlights Italy looks like it will form a national unity coalition under Super Mario Draghi – though it is not yet a done deal. A snap election is still our base case, whether in 2021 or 2022, but the ECB will do “whatever it takes,” as will Draghi if he becomes Italy’s prime minister. Even if the right-wing populist parties win power in a snap election, their goal is to expand fiscal spending, not exit the Euro Area. And they would rule in a world where even Germany and Brussels concede the need for soft budgets. Go long BTPs versus German bunds, and Italian stocks versus Spanish stocks, on a tactical 3-6 month horizon. The structural outlook for Italy is still bearish until Italy can secure its recovery and launch structural reforms. Feature In 2016-17 we wrote two special reports on Italy under the heading of “Europe’s Divine Comedy.” In “Inferno” we focused on Italy’s structural flaws and in “Purgatorio” we explained why Italy would stay in the European Union. We have long awaited the chance to write the third installment, which must be called “Paradiso” in honor of Dante Alighieri. But the tragedy of the pandemic makes this title sadly inappropriate. The new government that is tentatively taking shape is not the solution to the country’s long-term problems either. Former European Central Bank President Mario Draghi is an excellent policymaker and would ensure that Italy does not add political chaos to its pandemic woes this year. A unity government under Draghi – which is not yet a done deal as we go to press – would be a tactical and even cyclical positive for Italian equity and bond prices but not a structural positive. The paradise of national revival will have to wait for a later date. In the meantime Italy’s performance will be dictated by its surroundings. The Black Death Italy suffered worse than the rest of Europe from COVID-19, judging both by deaths and the economic slump (Chart 1). It was the first western country to suffer a major outbreak. Outgoing Prime Minister Giuseppe Conte was the first western leader to impose a Chinese-style lockdown – which came as a shock for democratic populations unfamiliar with such draconian measures. Few will forget the terrifying moment in March when the military was deployed in Bergamo to help dispose of the bodies.1 Chart 1Italy's National Crisis
Italy's National Crisis
Italy's National Crisis
Chart 2Italy’s Unemployment Problem – Especially In The South
Europe's Divine Comedy III: Paradiso? Or Paradise Lost?
Europe's Divine Comedy III: Paradiso? Or Paradise Lost?
The crisis struck at an awkward time in Italian politics as well. Like the US and UK, Italy saw a surge of populism in the 2010s. Hostility toward the political elite arose largely in reaction to hyper-globalization, the adoption of the euro, and deep structural flaws that have engendered a sluggish and unequal economy: Poor demographics: Italy’s population peaked in 2017 and is expected to fall from 61 million to 31 million by the year 2100. Its fertility rate is 1.3, the lowest in the OECD except South Korea. It has the third smallest youth share of population (13%) and stands second only to Japan in elderly share of population (23%).2 North-South division: Southern Italy, the Mezzogiorno, is poorer, less educated, less efficient, and less well governed than northern Italy. Unemployment is 7 percentage points higher in the south than in Italy on average (Chart 2). In our “Inferno” report we concluded that regional divisions discourage exiting the Eurozone and EU, since southern Italy benefits from EU transfers and northern Italy would refuse to subsidize southern Italy without EU support (Chart 3). Chart 3EU Budget Allocations Favor Italy
Europe's Divine Comedy III: Paradiso? Or Paradise Lost?
Europe's Divine Comedy III: Paradiso? Or Paradise Lost?
Low productivity: Italy’s real output per hour has lagged that of its European peers as the country has struggled to adjust to globalization, digitization, aging, and emerging technologies (Chart 4). Chart 4Italy's Lagging Productivity
Italy's Lagging Productivity
Italy's Lagging Productivity
High debt: Italy’s debt-to-GDP ratio is expected to rise from to 134.8% to 152.6% by the year 2025, putting it on a higher-debt trajectory than even the worst case projections prior to the pandemic (Chart 5). Normally Italy runs a current account surplus and primary budget surplus, although the pandemic has pushed the country down the road of budget deficits (Chart 6). The debt problem is manageable as long as inflation is low and the ECB purchases Italian government bonds – which it will do in the interest of financial stability. But it sucks away growth and investment over time, a problem that will revive whenever the EU Commission tries to return to semi-normal fiscal policy restraints. Chart 5Italy’s Debt Pile
Europe's Divine Comedy III: Paradiso? Or Paradise Lost?
Europe's Divine Comedy III: Paradiso? Or Paradise Lost?
Chart 6Italy’s Budget Surplus Destroyed By COVID-19
Europe's Divine Comedy III: Paradiso? Or Paradise Lost?
Europe's Divine Comedy III: Paradiso? Or Paradise Lost?
Italy’s predicament can be illustrated simply by comparing the growth of GDP per capita over the past decade to that of Spain, which is a structurally comparable Mediterranean European economy and yet has generated a lot more wealth for its people after having slashed government spending and reformed the labor market and pension system in the wake of the debt crisis (Chart 7). Chart 7Spain Reformed, Italy Didn't
Spain Reformed, Italy Didn't
Spain Reformed, Italy Didn't
Structural reforms undertaken by the technocratic Mario Monti government in the wake of the sovereign debt crisis proved insufficient. Subsequent reform efforts went up in a puff of smoke when Matteo Renzi’s pro-reform constitutional referendum failed in 2016. Italy’s government is congenitally gridlocked because the lower and upper houses of the legislature have equal powers, like in the US, but its parliamentary governments can be easily toppled by either house. The 2016 constitutional reforms would have given the central government historic new powers to force through painful yet necessary structural changes – but centrist voters of different stripes hesitated to grant these new powers since they looked likely to go to populist parties on the brink of victory in the looming 2017 elections. The populists – the right-wing League in the north and the left-wing Five Star Movement in the south – did indeed come to power in 2017 but Italian’s political establishment subsequently restrained them from pursuing either serious euroskepticism or massive fiscal spending. Pro-establishment President Sergio Mattarella rejected any cabinet members who would attack the monetary union. Subsequent battles with Brussels and Germany prevented Italy from passing a blowout stimulus that challenged EU fiscal orthodoxy and threatened to precipitate a solvency crisis in the banking system. In 2019 the ambitious League broke with the Five Star Movement, which collaborated with the center-left Democratic Party to form a new coalition. But the resulting compromise government, its populism diluted, only managed one structural reform – to reduce the size of parliament – plus a moderate increase in government spending. The populist parties ended up being right about the need for more proactive fiscal policy, as Germany conceded in late 2019 and as COVID-19 lockdowns made absolutely necessary in early 2020. French President Emmanuel Macron and German Chancellor Angela Merkel agreed to launch a €750 billion EU Recovery Fund that enabled jointly issued debt for EU members, solidifying a proactive fiscal turn in the bloc. Italy now has €209 billion coming its way. This is a boon for the recovery, though it is also the origin of the politicking that brought down the ruling coalition last month. With central banks monumentally dovish, European and American fiscal engines firing on all cylinders, and China’s 2020 stimulus still coursing through the world’s veins, the macro backdrop is positive for Italy. But with Italy’s economy still shackled by fundamental flaws, it will not be a lead actor or an endogenous growth story. Bottom Line: Italy missed the chance in the 2010s to undertake structural reforms that could lift productivity and potential growth. Now it is struggling to maintain political order in the wake of a devastating pandemic and recession. The vaccine and global recovery will lift Italian assets but the future remains extremely uncertain, given the eventual need to climb down from extreme stimulus and impose painful structural reforms. Paradiso? Or Paradiso Perduto? The latest political turmoil arose over the EU Recovery Fund and how Italy will spend the €209 billion allotted to it, as well as the €38.6 billion allotted to the country under the EU’s structural budget for 2021-28. Ostensibly Matteo Renzi pulled his Italia Viva party out of the ruling coalition because he feared that former Prime Minister Conte, together with his economy and industry ministers, would spend the funds on short-term vote-winning handouts rather than long-term structural fixes in health, education, and culture. But Renzi was not appeased when Conte offered to spend more on health and education as requested. Renzi’s party fares poorly in opinion polls and the recent electoral reforms were not favorable to it, so he can hardly have wanted a new election. He wanted Italy to tap €36 billion from the European Stability Mechanism in addition to taking EU recovery funds, since this would come with strings attached in the form of structural reform. He apparently wanted to precipitate a new pro-establishment coalition. President Mattarella’s appointment of Mario Draghi to lead a national unity coalition is the solution. But as we go to press it is not certain that Draghi will be able to command a majority in parliament. Chart 8Salvini's League Lost Steam But Populist Right Still Powerful
Salvini's League Lost Steam But Populist Right Still Powerful
Salvini's League Lost Steam But Populist Right Still Powerful
Matteo Salvini and the League are the pivotal players now. Salvini and his party suffered loss of popular support in 2019 as a result of his ambitious attempt to break from the government, force new elections, and rule on its own. The party especially suffered from the pandemic, which hit its base of voters in Lombardy hard and sent voters in support of the central government as well as the political establishment (Chart 8). Salvini must now decide whether to try to rebuild his status by joining Draghi in the national interest, to show he can be a team player, albeit at risk of being seen as an institutional politician. If so, he would cede the right-wing anti-establishment space to his partner Giorgia Meloni, who leads the Brothers of Italy, which has eaten up all the support Salvini has lost since the European parliament election of 2019. What is clear is that his current strategy is not working, and he played ball with the big boys during the 2017-19 period, so we would not rule him out of a Draghi government. If Draghi does not win over Salvini and the League, he would need to win the support of the Five Star Movement to form a coalition. The party’s leaders initially said they would not join Draghi, who epitomizes the establishment of which they are sworn enemies. Yet Five Star has not lost any popular support for working with the conventional Democratic Party, in stark contrast with the League, which stayed ideologically pure but lost supporters. Some Five Star members, including Foreign Minister Luigi Di Maio, former leader of the party, want to work with Draghi and stay in government. Hence the party could still join Draghi, or it could break apart with some members defecting. It would require 33% of Five Star members in the Chamber of Deputies and 28% of Five Star members in the Senate to join Draghi to give him a majority, assuming the League and Brothers of Italy refuse to cooperate (Table 1). Interestingly, if the League is absent from the vote, and all parties other than the Brothers and Five Star join Draghi, then he could also form a government. This would give cover to the League under the pretense of COVID vigilance, without being seen as actively preventing a government formation. Table 1'Whatever It Takes' To Build A National Unity Coalition Under Super Mario Draghi
Europe's Divine Comedy III: Paradiso? Or Paradise Lost?
Europe's Divine Comedy III: Paradiso? Or Paradise Lost?
We have favored an early election and this could still occur. If there is an election it will happen before June because an election cannot happen within the last six months of the current president’s term, as per Article 88 of the Constitution. If Italy avoids a snap election till June, political stability is ensured at least till January. The pandemic was the justification for avoiding a snap election but the pandemic did not prevent the regional elections or constitutional referendum in September. The referendum was a hurdle that needed to be cleared before the next election, so now the way is open. All of the parties are greedily eying the presidency, with President Mattarella’s seven-year term set to expire next January. Mattarella has emerged as a staunch defender of the establishment and a check on anti-establishment parties. If the populists gain a plurality prior to January, then they can try to get a more sympathetic or neutral policymaker in that position. By contrast, the pro-establishment parties are hoping that a Draghi coalition can last long enough to ensure that one of their own holds that post. Since the latter need either the League or Five Star to govern, they would have to compromise on the next president – which is a very big concession. In distributing EU recovery funds, there is little doubt that a unity government under Draghi would be a credible way of proceeding. Draghi has joined other central bankers, like the Fed’s Janet Yellen, in voicing strong support for fiscal policy to get the developed democracies out of their current low-growth morass. He would have the authority and expertise to direct spending to productivity-enhancing projects at home while working with Brussels to allow Italy the greatest possible flexibility. Italy’s portion of EU recovery funds is shown in Chart 9, with the black bar indicating the part consisting of loans. The sector breakdown of total EU recovery fund is shown in Table 2. Chart 9Italy’s Fiscal Stimulus To Receive EU Top-Up
Europe's Divine Comedy III: Paradiso? Or Paradise Lost?
Europe's Divine Comedy III: Paradiso? Or Paradise Lost?
Table 2Composition Of EU Recovery Fund By Economic Sector
Europe's Divine Comedy III: Paradiso? Or Paradise Lost?
Europe's Divine Comedy III: Paradiso? Or Paradise Lost?
Yet a Draghi government is not a permanent solution to Italy’s political crisis or its economic malaise. Currently the political parties are squabbling over how to distribute a windfall of special funds – Italy is benefiting from a more pragmatic EU policy as it emerges from a crisis. But in future the parties will be fighting over what to do when the funds are spent. Even if the EU continues to be generous the stimulus will decelerate, while structural reforms will have to be attempted yet again. A technocratic Draghi government would be well positioned to institute the reforms that Italy needs but the economic medicine could sow the seeds for another voter backlash – in which case the anti-establishment right would be in prime position. This would set up a giant clash with Germany and Brussels. Italy, The EU, And Global Power Politics Geopolitically, Italy matters because it is a test of whether the European Union will continue consolidating power within its sphere of influence. If Draghi can form a unity government, oversee economic recovery and long-delayed structural reforms, and survive to reap the benefits at the voting booth, it would mark a historic victory for the EU as it lurches from crisis to crisis in pursuit of deeper integration and ever closer union. The Italian question would effectively be resolved and the EU would have the capacity to handle other challenges elsewhere. Europe’s geopolitical coherence is critical for global geopolitics as well. Europe is the prime beneficiary of US-China competition – at least until such time as it is forced to choose sides. Since Europe is a great power, it can remain neutral for a long time, using America as a stick against Chinese technology theft while expanding market share in China as it diversifies away from the United States (Chart 10). Chancellor Merkel has already signaled to Biden that she is not eager to join any “bloc” against China. Biden will have to devote a massive diplomatic effort to convince the Europeans, who are not as concerned about China’s military and strategic threat, that it is necessary to form a grand alliance toward containing China’s rise. Chart 10EU Balances Between US And China
Europe's Divine Comedy III: Paradiso? Or Paradise Lost?
Europe's Divine Comedy III: Paradiso? Or Paradise Lost?
The EU’s efforts to carve out a sphere of influence have momentum. The German and EU approach to fiscal policy has become more dovish and proactive, a concession to the southern European economies that will improve their support for the European project. Across the Atlantic the EU states see President Trump’s rise and fall as a story of America’s declining influence, which improves the EU’s authority over its own populace, and yet has not resulted in an American-imposed trade war that would undermine the recovery. To the east, EU states see Russian authoritarianism and its discontents, which reinforce the public’s commitment to democratic values and the single market. To the north, they see the negative example of Brexit, which continues to plague the UK, with Scotland pushing for independence again. To the south, Europeans have become less concerned about illegal immigration, having watched the inflow of migrants from Turkey, the Middle East, and North Africa fall sharply – at least until the next major regime failure in these regions causes a new wave of refugees (Chart 11). These events have encouraged various countries to fall in line behind the consensus of European solidarity and geopolitical independence. A technocratic government in Italy would reinforce these trends but a populist government would not be able to avoid or override them. Chart 11Europe Less Concerned About Refugees (For Now)
Europe Less Concerned About Refugees (For Now)
Europe Less Concerned About Refugees (For Now)
Chart 12Italian Euroskeptics Constrained By Public Opinion
Europe's Divine Comedy III: Paradiso? Or Paradise Lost?
Europe's Divine Comedy III: Paradiso? Or Paradise Lost?
The Italian populist parties are still in the ascent but they do not seek to exit the EU or monetary union (Chart 12). We fully expect Italy to see snap elections in 2022 if not 2023, given the fragility of any new coalition to emerge today. If the right-wing League and Brothers should win control of government, and clash with Germany and Brussels, they would still operate within an environment circumscribed by these geopolitical limitations. Otherwise greater solidarity gives the EU greater room for maneuver among the US, China, and Russia. Investment Takeaways In the short run, the Draghi government is bullish for Italian assets. If Draghi fails and snap elections are called, the downside to European equities and the euro is limited, since any risk of an Italian exit from the EU dissipated back in 2016-18. Past turmoil resulted in higher Italian bond yields and wider spreads between BTPs and German bunds because markets had to price in the risk that the Euro Area would break up. We have long highlighted that this risk was overstated and markets are well aware of that by now. The market’s muted reaction to this latest kerfuffle proves the point (Chart 13). Chart 13Markets Unimpressed By Italian Political Turmoil
Markets Unimpressed By Italian Political Turmoil
Markets Unimpressed By Italian Political Turmoil
On overweight stance toward Italian government bonds has been one of the highest conviction calls of our fixed income strategist, Rob Robis, over the past year. He expects that Italian bond yields (and spreads over German debt) will converge to Spanish levels, thus restoring a relationship last seen sustainably in 2016. He also notes that the ECB is willing to use quantitative easing to support Italy when its politics inject a risk premium into government bonds and spreads widen. The central bank is also providing additional support to Italy via cheap bank funding (TLTROs) that helps limit Italian risk premia at a time when underlying credit growth is exceedingly weak. During the height of the COVID lockdowns last year, the ECB increased its buying of Italian bonds higher than levels implied by its Capital Key weighting scheme, which officially governs bond purchases. Once Italian yields fell back to pre-pandemic levels, the ECB slowed the pace of purchases to levels at or below the Capital Key weights. As long as the pandemic lingers, the ECB will have the ability and pretext to ensure that Italian spreads do not rise too high (Chart 14). Chart 14Overweight Italian Government Bonds
Overweight Italian Government Bonds
Overweight Italian Government Bonds
True, investors may be more reluctant to drive Italian yields and spreads to new lows as long as there is a risk of elections this year or next that could bring anti-establishment leaders to power and trigger an increase in Italian political risk premia. But this trap between politics and QE still justifies an overweight stance within global bond portfolios, as Italian yields will remain too attractive for investors to ignore given the puny levels of alternative sovereign bond yields available elsewhere in the Euro Area. Go tactically long Italian BTPs relative to German bunds. Italian stocks have seen a long and dreary downtrend versus global stocks, whether relative to developed or emerging markets, including or excluding the US and China. However, they are trading at a heavy discount in terms of price-to-book and price-to-sales metrics and a Draghi government to direct stimulus funding is doubly good news. Italian stocks have rebounded against Spanish equities since 2017 – as have Italian banks versus Spanish banks. Italian non-performing loans declined from a peak of €178 billion in 2015 to €63 billion in 2020. The banks raised enough equity capital to cover these NPLs. Since banks form a significant part of the Italian bourse, an improvement in bank balance sheets would be positive for the overall market. A Draghi government would reinvigorate this tendency, especially if it credibly commits to structural reforms that elevate potential growth. Spain’s structural reforms are priced in and it is next in line for a post-COVID political shakeup (Chart 15). Go tactically long Italian stocks relative to Spanish. While a Draghi coalition is marginally positive for the euro there are several factors motivating the dollar’s counter-trend bounce in the near term (Chart 16). US and Eurozone growth are diverging, with the EU struggling to roll out its COVID vaccine while the US prepares to pile a new $1.5-$1.9 trillion fiscal stimulus on top of the unspent $900 billion stimulus passed at the end of last year. Chart 15Italian Stocks Have Upside Versus Spanish
Italian Stocks Have Upside Versus Spanish
Italian Stocks Have Upside Versus Spanish
Chart 16Wait For Geopolitical Risk To Clear Before Shorting USD-EUR
Wait For Geopolitical Risk To Clear Before Shorting USD-EUR
Wait For Geopolitical Risk To Clear Before Shorting USD-EUR
Over the long run, a Draghi government provides limited upside with regard to Italian assets. The new coalition serves to avoid an election, not enable structural reform. An unstable ruling coalition will lose support over time in what will be a difficult post-pandemic environment. An early election and anti-establishment victory are not unlikely, if not in 2021 then in 2022 when Italy faces a falling stimulus impulse and the need for painful reforms. For now the truly bullish development is Germany’s dovish shift on fiscal policy rather than any temporary sign of Italian political functionality. Dysfunction can return to Italy fairly quickly but an accommodative Germany is hard to be gotten. Hence Italy’s biggest political risks will come if populist parties win full control of government in the next election while Germany and Brussels seek to normalize fiscal policy and impose some semblance of restraint in the wake of the crisis. It is also possible that a new economic shock or wave of immigration could bring Italy’s populists not only to take power but to rediscover their original euroskepticism. Thus any preference for Italian assets should be seen as a cyclical play on global growth and European solidarity and reflation – not a structural play on Italy’s endogenous strengths. Last week we shifted to the sidelines of the stock rally due to our concern that political and geopolitical risks have fallen too much off the radar. The Biden administration faces tests over China/Taiwan and Iran/Israel. Biden’s tax hikes will come into view soon. Chinese policy tightening is also a concern, even for those of us who do not expect overtightening. These factors pose downside risk to bubbly global stock markets in the near term. Matt Gertken Vice President Geopolitical Strategy mattg@bcaresearch.com Footnotes 1 Angela Giuffrida and Lorenzo Tondo, "‘A generation has died’: Italian province struggles to bury its coronavirus dead," The Guardian, March 19, 2020, theguardian.com. 2 See Stein Emil Vollset et al, "Fertility, mortality, migration, and population scenarios for 195 countries and territories from 2017 to 2100: a forecasting analysis for the Global Burden of Disease Study," The Lancet, July 14, 2020, thelancet.com.
BCA Research’s Emerging Markets Strategy service concludes that we are in a euphoria phase where fundamentals are less pertinent. The market can either rally or fall significantly, regardless of the profit outlook. In all likelihood, volatility will continue…
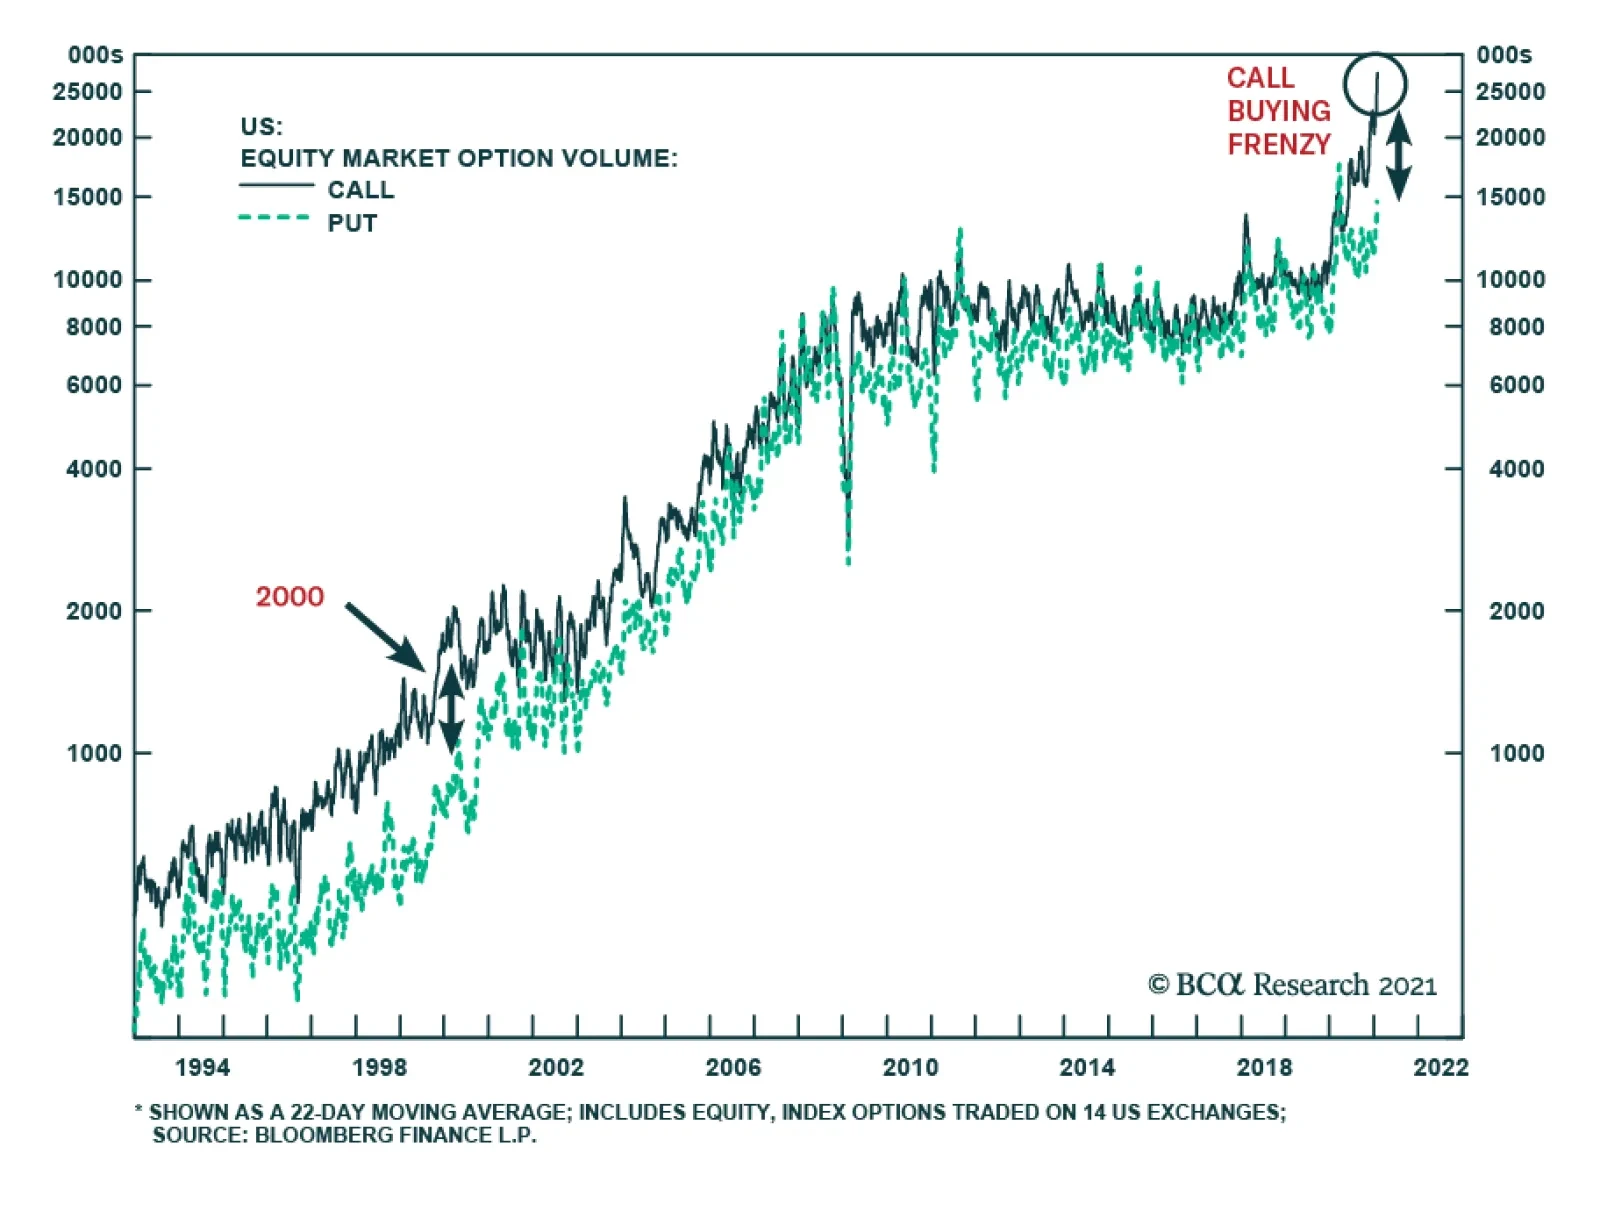
Highlights There is too much euphoria and complacency in global markets. The main distinction between the current and previous episodes of speculative equity market excesses is that classic end-of-business cycle conditions – such as economic overheating and policy tightening – are now absent. Yet, it does not mean that the bull market will continue uninterrupted. This rally might be short circuited by gravitational forces as happened with the S&P 500 in 1987 and Chinese onshore stocks in 2015. Investors should consider going long EM equity or EM currency volatility to hedge their exposure. Feature There is growing evidence that the global equity rally has turned into a frenzy. Signs of investor euphoria include: The number of traded call options in the US equity market has surged to an all-time high (Chart 1). The number of put options has spiked only in the past couple of weeks and remains well below the number of call options. Chart 1A Call Buying Frenzy Is A Symptom Of Investor Exuberance
A Call Buying Frenzy Is A Symptom Of Investor Exuberance
A Call Buying Frenzy Is A Symptom Of Investor Exuberance
Critically, there is currently too much complacency: the US put-call ratio is as low as it was in 2000 (Chart 2). The volume of stocks traded on and off all US stock exchanges has exploded since late October, reaching an all-time high (Chart 3). Chart 2A Sign Of Equity Market Complacency
A Sign Of Equity Market Complacency
A Sign Of Equity Market Complacency
Chart 3US Equity Trading Volumes Are At All-Time Highs
bca.ems_wr_2021_02_04_c3
bca.ems_wr_2021_02_04_c3
Chart 4Retail Investors Haven Been A Powerful Force In Korea And Taiwan
Retail Investors Haven Been A Powerful Force In Korea And Taiwan
Retail Investors Haven Been A Powerful Force In Korea And Taiwan
Equity fervor is prevalent not only among American individual investors but also in many parts of the world. For instance, the breathtaking rallies in the KOSPI and Taiwanese stocks has been primarily driven by local retail investors, as shown in Chart 4. The surge in Taiwanese share prices is stunning because it completely ignores the escalating geopolitical tensions over Taiwan. BCA Research’s Chief Geopolitical Strategist, Matt Gertken, recently argued that while China is unlikely to invade Taiwan immediately, a military stand-off cannot be ruled out. China and the US have yet to arrive at a mutual understanding regarding China’s access to computer chips made in Taiwan. Overall, since the lockdowns in March last year, individual investors have rushed into equities in many countries such as the US, Korea, Taiwan, Japan, India and Brazil, to name a few. Finally, US institutional investors are fully invested, as shown in Chart 5. Besides, Chart 6 reveals that US-domiciled EM equity mutual funds’ liquidity ratio (cash as a percentage of assets) is very low. Chart 5US Institutional Investors Are Long Stocks
US Institutional Investors Are Long Stocks
US Institutional Investors Are Long Stocks
Chart 6US-Domiciled EM Mutual Funds' Cash Is Low
US-Domiciled EM Mutual Funds' Cash Is Low
US-Domiciled EM Mutual Funds' Cash Is Low
There have been doubts within the global investment community about the potential for small individual investors to move the needle in the overall market. We believe that their impact has been substantial: First, there is plenty of anecdotal evidence to suggest that individual traders have been involved in options trading since the pandemic erupted. By purchasing call options, retail investors exert substantial upward pressure on share prices: dealers – who sell/write call options – typically hedge their risks by acquiring and holding the underlying stock for the duration of respective options. In short, by putting even small amounts of money at work to purchase call options, individual traders meaningfully affect share prices. Second, price formation in financial markets is influenced by the marginal investor. Everything else being equal, the entry of a new buyer into the marketplace leads to higher prices. Further, retail investors’ impact on financial markets has not been limited solely to stocks they purchase. Rather, there has been a ripple effect on the broader market. For instance, there is evidence that individual investors flocked to the market in March and April and bought en masse shares of companies most negatively affected by the pandemic, such as cruise operations, hotels, airlines and energy producers. As individual investors provided substantial bids for these stocks, institutional investors were able to offload these stocks and buy others. For instance, in Q2 last year Warren Buffett offloaded his airline stocks and allocated that capital to natural gas storage and pipelines, banks, pharma and auto stocks. If retail investors had not provided support to stocks of companies hit hard by the lockdowns and social distancing, Warren Buffett and other professional investors would not have had the opportunity to exit their positions in these stocks at acceptable prices and acquire other securities. This is the mechanism whereby the impact of new market entrants extends beyond the specific equities they purchase. Chart 7A Mini Call Option Mania Among Retail Investors
A Mini Call Option Mania Among Retail Investors
A Mini Call Option Mania Among Retail Investors
Finally, Charts 1 and 3 above clearly illustrate the surge in both the number of call options and trading volumes since last March. Among call options, transactions with a small number of options have ballooned (Chart 7). This reflects individual investors activity. Consistently, the number of brokerage accounts for retail investors has mushroomed in the US and elsewhere. Bottom Line: It is obvious that the ongoing equity market euphoria is considerable. Individual investors have been playing a vital role in fostering it. The GameStop stock saga, among others, reinforces this point. When And How Will It End? This bull market shares some similarities with previous market cycles, but it also has its distinct features. Similarities: Retail investors typically rush into financial markets toward the end of a bull market. The current US equity market rally began in 2009. After the S&P 500 showed its resilience by rebounding quickly and making new highs following the selloffs in 2015, 2018 and 2019, retail investors were reassured to jump on the bull market train when the 2020 crash occurred. In short, it took about 11 years of a US equity bull run for individual investors to feel comfortable enough to play the stock market. This is a characteristic of a late cycle/mature bull market. Speculative instruments and schemes are designed and launched. The IPO boom in SPACs1 will probably go down in history as a key feature of the speculative excesses in this cycle. Valuations overshoot during stock market euphoria but investors find reasons to justify lofty equity multiples. FAANGM stocks and other parts of the US equity market are expensive, but investors are using extremely low US bond yields – artificially suppressed by the Federal Reserve – to justify the current multiples. In such a case, the bond market will likely hold equities hostage. As bond yields rise going forward, equity valuations will be threatened. In fact, we believe rising bond yields, not the outlook for economic growth, to be the primary risk to US share prices akin to the late 1960s (Chart 8). Differences: Typically, retail investors feel comfortable investing in the stock market when the economy is strong. In this cycle, they jumped on the stock market train when the economy crashed due to the pandemic. This is a departure from previous cycles. Massive stimulus and ongoing vaccination deployment suggest the economic outlook for the US and many emerging economies is positive. In particular, EM corporate profits are set to recover (Chart 9). Chart 8The US In The 1960s: Share Prices And Treasury Yields
The US In The 1960s: Share Prices And Treasury Yields
The US In The 1960s: Share Prices And Treasury Yields
Chart 9EM EPS Is To Recover
EM EPS Is To Recover
EM EPS Is To Recover
Hence, it is hard to be bearish on stocks based on the cyclical outlook for growth, assuming vaccination campaigns will allow many major economies to fully reopen in H2 2021. Yet, a lot of this good news seem to be already priced in. Retail investors arrive to the stock market party usually in the late stage of a business cycle – when unemployment is low, inflation is rising, and policymakers are tightening policies. That combination proves lethal for the equity market and a major top in share prices ensues. Presently, due to the pandemic-induced lockdowns, we have the opposite occurring in the US and in many EM economies. Unemployment is high, inflation remains contained, and policymakers are committed to providing unlimited stimulus. In short, the main distinction between the current and previous episodes of speculative equity market excesses is that classic end-of-business cycle conditions – such as economic overheating and policy tightening – are now absent. History doesn't repeat itself, but it does rhyme. Does it mean that the bull market will continue uninterrupted? Not necessarily. This rally might be short circuited for reasons that may differ from those that terminated previous stock market frenzies. First, speculative bubbles could burst without policy tightening. An example of this is China’s equity bubble in 2015, which crashed without policy tightening due to gravitational forces reasserting themselves. Another example is the 1987 US stock market crash that occurred without an economic or fundamental financial cause. Chart 10 illustrates the cyclical trajectories of US GDP and the Fed funds rate did not change materially before and after the equity market crash. In short, the 1987 equity crash was a case when excessive speculation/overbought conditions rather than policy tightening or a recession caused an abrupt equity sell-off. Second, in the EM equity universe, leadership has been extremely narrow. Only a handful of companies have outperformed the aggregate benchmark, propelling the index to 2007 highs. These include a few Chinese new economy stocks, and Korean and Taiwanese technology stocks (Chart 11). Outside North Asian markets (China, Korea and Taiwan), every single EM bourse has underperformed both the EM and global equity benchmarks in the past year. Chart 10The 1987 S&P 500 Crash Was Not Caused By The Fed Or The Economy
The 1987 S&P 500 Crash Was Not Caused By The Fed Or The Economy
The 1987 S&P 500 Crash Was Not Caused By The Fed Or The Economy
Chart 11Euphoria In Asian TMT Stocks
Euphoria in Asian TMT Stocks
Euphoria in Asian TMT Stocks
Chart 12Global ex-TMT Stocks Have Not Broken Out Yet
bca.ems_wr_2021_02_04_c12
bca.ems_wr_2021_02_04_c12
If these global and EM TMT stocks relapse, they will inflict major damage on the EM and global indexes. The EM index has become extremely concentrated with the top five stocks accounting for 24% of the MSCI EM equity index’s market cap. Interestingly, global ex-TMT stocks have not yet broken out to new highs (Chart 12). Finally, US overall equity and global TMT valuations are vulnerable to rising US bond yields. The latter could rise without the Fed hinting at policy tightening if fixed-income investors decide that the Fed is behind the inflation curve. This could trigger a major selloff even if policymakers do not tighten policy. Investment Conclusions Chart 13Go Long EM Equity And Currency Volatility
Go Long EM Equity And Currency Volatility
Go Long EM Equity And Currency Volatility
We are in a euphoria phase where fundamentals are less pertinent. The market can either rally a lot or sell off hard regardless of the profit outlook. Navigating through such markets is challenging. Going long EM equity or EM currency volatility offers a good risk-reward profile (Chart 13). Volatility will likely rise in the coming months in both scenarios: either risk assets continue rallying or they sell off. For global equity and credit portfolios, we continue recommending a neutral allocation to EM. The long-term US dollar outlook is negative, but it is oversold and odds of a near-term rebound are still high. Our currency strategy remains to short a basket of EM currencies versus an equal-weighted average of the euro, CHF and JPY. This basket of EM currencies includes the BRL, CLP, ZAR, KRW and TRY. We continue receiving 10-year swap rates in Mexico, Colombia, Russia, China, India, Indonesia and Korea. Arthur Budaghyan Chief Emerging Markets Strategist arthurb@bcaresearch.com Footnotes 1 Special Purpose Acquisition Companies (SPAC), also known as “blank check companies”, are organizations with no commercial operations that raise capital through an IPO, which is then deployed to purchase an existing company. This process is done to bypass the lengthy process of launching a traditional IPO for a young company. Equities Recommendations Currencies, Credit And Fixed-Income Recommendations
Goldilocks And The Three Bears
Goldilocks And The Three Bears
The S&P 500 is clawing back its losses after it hiccupped last week correcting approximately 5% from peak-to-trough as the dust from the GME/WSB saga is settling down. As we showed in this Monday’s Strategy Report, there is a natural monetary tightening occurring via the financial markets that is likely to test the Fed’s resolve. Namely, whenever all three assets, the US dollar, the 10-year US Treasury, and crude oil rise together, the SPX suffers a pullback (see chart). Year-to-date, two out of these three variables are firing warning shots, and given rising odds of a US dollar reversal, the tightening trio is signaling at least some equity market indigestion. Bottom Line: The simultaneous rise in the US dollar, the 10-year US Treasury yield, and crude oil all signal that equity investors should stay vigilant.
In lieu of the next strategy report, I will be presenting the quarterly webcast titled ‘Five Contrarian Predictions For 2021-22’ on Thursday February 11 at 10.00AM EST (3.00PM GMT, 4.00PM CET, 11.00PM HKT). I hope you can join. Highlights Many of the ‘short squeezed’ investments that day traders have bid up are at, or approaching, collapsed short-term fractal structures. As such, patient long-term investors should take the other side. The biggest risk to the stock market remains the vulnerability of valuations to even a modest rise in bond yields. The happy corollary is that the structural bull market in equities will only end when the 10-year T-bond yield reaches zero. Until then, stay structurally overweight equities. Structurally overweight value-heavy European equities versus value-heavy emerging markets (EM) equities. Do not structurally overweight value-heavy European equities versus growth-heavy US equities. This is a ‘widow maker’ trade. Fractal trade: short AUD/JPY. Feature Chart of the WeekShort-Squeezed Investments Now Have Collapsed Fractal Structures (Gamestop)
Short-Squeezed Investments Now Have Collapsed Fractal Structures (Gamestop)
Short-Squeezed Investments Now Have Collapsed Fractal Structures (Gamestop)
There is no divine law that decrees the ‘correct’ time-horizon for any investment. Depending on your objectives and skills, a correct investment horizon could be anything spanning a few milliseconds to a hundred years. Once you absorb this fundamental point, it leads to a profound conclusion: The ‘correct’ price for any investment depends on your investment horizon. The Most Important Investment Question Is, Who Is Setting The Price? A long-term investor and a day trader will go through completely different thought processes to determine a stock’s ‘correct’ price. The long-term investor, intending to buy and hold the stock for ten years, will receive 40 quarterly dividend payments plus the stock price as it stands in 2031. Hence, the correct price is the discounted value of those expected cashflows. But for the day trader, intending to buy today to sell tomorrow, only one cashflow matters – tomorrow’s price. Hence, the correct price is simply the expected price at which he can sell tomorrow. The longer-term cashflows are irrelevant, unless they set the selling price tomorrow. Yet this is unlikely, because as Benjamin Graham put it: In the long run the market is a weighing machine, but in the short run it is a voting machine. Therefore, a long-term investor and a day trader are completely different animals, whose price-setting behaviour must be seen through different lenses. This matters because the price is always set by the last marginal transaction. The important question then is, who is setting the price? All of which brings us to the battle raging between a cabal of day traders and a group of hedge funds. The day trader is buying today because he expects that the hedge fund, desperate to cover its short positions, must buy at an even higher price tomorrow. The day trader’s behaviour is rational, so long as it is within the law, and so long as the hedge fund short-covering is the marginal price taker. Eventually though, the desperate hedge fund will not take the price, because there are no more short positions left to cover. At this point, if the day trader wants to exit his position, the marginal buyer will be a longer-term investor who will only buy at a much lower fundamentally-determined price. The day trader will have won the battle, but lost the war. The crucial takeaway is that we should always monitor which time-horizon of investors is setting the marginal price of an investment. We can do this by continually measuring the fractal structure of the investment’s price. We should always monitor which time-horizon of investors is setting the marginal price of an investment. When the fractal structure of an investment has collapsed, it means that the time-horizon of investors setting the price has compressed to a near-term limit. Thereby it signals that the price-setting baton will return to long-term investors who will reset the price to valuation anchors, such as discounted long-term cashflows. The implication is that the preceding trend, fuelled by short-term price setters, is likely to reverse. Today, we observe that many of the investments that day traders have recently bid up are at, or approaching, collapsed short-term fractal structures. As such, patient long-term investors should take the other side (Chart of the Week, Chart I-2 and Chart I-3). Chart I-2Short-Squeezed Investments Now Have Collapsed Fractal Structures (AMC Entertainment)
Short-Squeezed Investments Now Have Collapsed Fractal Structures (AMC Entertainment)
Short-Squeezed Investments Now Have Collapsed Fractal Structures (AMC Entertainment)
Chart I-3Short-Squeezed Investments Now Have Collapsed Fractal Structures (Blackberry)
Short-Squeezed Investments Now Have Collapsed Fractal Structures (Blackberry)
Short-Squeezed Investments Now Have Collapsed Fractal Structures (Blackberry)
The Major Misunderstanding About Real Bond Yields A common question we get is, should we compare the prospective returns on equities and bonds in nominal terms or in real terms? In an apples-for-apples comparison it shouldn’t really matter. The problem is that while we know the prospective nominal return from bonds (it is just the bond yield), it is extremely difficult to know the prospective real return from bonds. As the markets are lousy at predicting inflation, the ex-ante real bond yield is a lousy predictor of the ex-post real bond yield. A trustworthy ex-ante real bond yield requires a trustworthy prediction of inflation. But both the inflation forwards market and the breakeven inflation rate implied in inflation protected bonds are lousy at predicting inflation.1 As the markets are lousy at predicting inflation, the ex-ante real bond yield is a lousy predictor of the ex-post real bond yield (Chart I-4 and Chart I-5). Chart I-4The Markets Are Lousy At Predicting Inflation In Europe...
The Markets Are Lousy At Predicting Inflation In Europe...
The Markets Are Lousy At Predicting Inflation In Europe...
Chart I-5...And In The ##br##US
...And In The US
...And In The US
A second point is that the required excess return on equities versus bonds is a nominal concept. This is because the bond yield’s lower limit is set in nominal terms, at say -1 percent. Proximity to this nominal yield limit makes bonds very risky because there is no longer any upside to price, only downside. As the riskiness of equities and bonds converges, the required nominal return on equities collapses towards the ultra-low nominal bond yield. There are two important takeaways. First, we should always compare the valuation of equities and their prospective nominal return with the nominal bond yield. Second, the valuation of equities is exponentially sensitive to an ultra-low nominal bond yield (Chart I-6). Chart I-6The Relationship Between The Bond Yield And Stock Market Valuation Is Exponential
The Relationship Between The Bond Yield And Stock Market Valuation Is Exponential
The Relationship Between The Bond Yield And Stock Market Valuation Is Exponential
We conclude that the biggest risk to the stock market remains the vulnerability of valuations to even a modest rise in bond yields. Yet the happy corollary is that the structural bull market in equities will only end when bond yields can go no lower. In practice, this means when the 10-year T-bond yield reaches zero. Until then, long-term investors should stay in the stock market. The Major Misunderstanding About Valuation Another common question we get is, is it always meaningful to compare an investment’s valuation versus its own history? The answer is no. The comparison with a historical average is meaningful only if the valuation is mathematically stationary, which is to say it has not undergone a ‘phase-shift’. If the valuation has undergone a phase-shift, then the comparison with its own history is meaningless. As an analogy, nobody would compare their bodyweight with its lifetime average, because we understand that our bodyweight undergoes a phase-shift from childhood to adulthood. If we did compare our bodyweight with its lifetime average, it would give the false signal that we were permanently overweight! Likewise, to avoid getting a false signal from a valuation, we should always ask, has it undergone a phase-shift? If a valuation has undergone a phase-shift, then a comparison with its own history is meaningless. Unfortunately, the structural prospects for financials, oil and gas, and basic resources – sectors that dominate ‘value’ indexes and stock markets – did suffer a major downward phase-shift at the start of the 2000s (Chart I-7). It follows that we cannot compare the valuations of ‘value heavy’ indexes with their long-term history, and draw any meaningful conclusions. Chart I-7Value' Sector Profits Are In A Major Structural Downturn
Value' Sector Profits Are In A Major Structural Downturn
Value' Sector Profits Are In A Major Structural Downturn
Proving this point, the relationship between value-heavy European valuations and subsequent 10-year return is much worse for periods ending after the global financial crisis compared with periods ending before it. Whereas the relationship between growth-heavy US valuations and subsequent return has barely changed, because the structural prospects for growth sectors have not suffered downward phase-shifts (Chart I-8 and Chart I-9). Chart I-8The Relationship Between Valuation And Future Return Has Changed In Europe...
The Relationship Between Valuation And Future Return Has Changed In Europe...
The Relationship Between Valuation And Future Return Has Changed In Europe...
Chart I-9...But Not So Much ##br##In The US
...But Not So Much In The US
...But Not So Much In The US
Given the ongoing trends in value versus growth profits, it is much safer to overweight value-heavy European equities versus value-heavy emerging markets (EM) equities. Do not structurally overweight value-heavy European equities versus growth-heavy US equities. This is a ‘widow maker’ trade. Fractal Trading System* The rally in AUD/JPY is at a potential a near-term top based on its collapsed 65-day fractal structure. Accordingly, this week’s recommended trade is short AUD/JPY, setting the profit target and symmetrical stop-loss at 2.8 percent. Chart I-10AUD/JPY
AUD/JPY
AUD/JPY
In other trades, short European basic resources versus the market achieved its 4 percent profit target and is now closed. The rolling 12-month win ratio now stands at 57 percent. When the fractal dimension approaches the lower limit after an investment has been in an established trend it is a potential trigger for a liquidity-triggered trend reversal. Therefore, open a countertrend position. The profit target is a one-third reversal of the preceding 13-week move. Apply a symmetrical stop-loss. Close the position at the profit target or stop-loss. Otherwise close the position after 13 weeks. * For more details please see the European Investment Strategy Special Report “Fractals, Liquidity & A Trading Model,” dated December 11, 2014, available at eis.bcaresearch.com. Dhaval Joshi Chief European Investment Strategist dhaval@bcaresearch.com Footnotes 1 Europe and the US have deep and liquid markets in 5-year 5-year inflation swaps (or forwards), which price the expected 5-year inflation rate 5 years ahead. The current swap measures the annual inflation rate expected through 2026-31. The UK and the US also have deep and liquid markets in inflation-protected government bonds: UK index-linked gilts, and US Treasury Inflation Protected Securities (TIPS). The yield offered on such a security is real, which means in excess of inflation. The yield offered on a similar-maturity conventional bond is nominal. This means that the difference between the two yields equates to the market’s expectation for inflation over the maturity, known as the ‘breakeven inflation rate.’ Fractal Trading System Cyclical Recommendations Structural Recommendations Closed Fractal Trades Trades Closed Trades Asset Performance Currency & Bond Equity Sector Country Equity Indicators Bond Yields Chart II-1Indicators To Watch - Bond Yields
Indicators To Watch - Bond Yields
Indicators To Watch - Bond Yields
Chart II-2Indicators To Watch - Bond Yields
Indicators To Watch - Bond Yields
Indicators To Watch - Bond Yields
Chart II-3Indicators To Watch - Bond Yields
Indicators To Watch - Bond Yields
Indicators To Watch - Bond Yields
Chart II-4Indicators To Watch - Bond Yields
Indicators To Watch - Bond Yields
Indicators To Watch - Bond Yields
Interest Rate Chart II-5Indicators To Watch - Interest Rate Expectations
Indicators To Watch - Interest Rate Expectations
Indicators To Watch - Interest Rate Expectations
Chart II-6Indicators To Watch - Interest Rate Expectations
Indicators To Watch - Interest Rate Expectations
Indicators To Watch - Interest Rate Expectations
Chart II-7Indicators To Watch - Interest Rate Expectations
Indicators To Watch - Interest Rate Expectations
Indicators To Watch - Interest Rate Expectations
Chart II-8Indicators To Watch - Interest Rate Expectations
Indicators To Watch - Interest Rate Expectations
Indicators To Watch - Interest Rate Expectations
Highlights We are hesitant to call a top to the volatility spike just yet. The US dollar is experiencing a counter-trend bounce. We also see political and geopolitical risks flashing yellow. House Democrats are drafting a reconciliation bill that will remind financial markets of looming tax hikes. President Biden faces imminent tests on China/Taiwan and Iran. The tech sector has bounced amid the setback to the reflation trade. Over the long run the Biden administration’s reflationary agenda suggests tech will no longer outperform. Biden’s regulatory risk to the tech sector is not immediate but still a downside risk. No major piece of bipartisan legislation is forthcoming but the Department of Justice, FCC, and FTC can bring negative surprises. We are hitting pause on our S&P trades until Biden passes some early hurdles. Feature Volatility has room to run, judging by past post-crisis periods (Chart 1), and this time we are especially concerned with brewing geopolitical risks, namely the US-China tensions over the Taiwan Strait. This geopolitical risk comes on top of the short squeezes and battles that retail investors are having against hedge funds all over the market. China is reminding the world of its red line against Taiwanese independence while testing the newly seated Joe Biden administration over whether it will seek a technological blockade against the mainland. Economic and trade policy uncertainty have collapsed but they would surge in the event of a crisis incident (Chart 2). While war is not likely, it is possible, so we need to see the Biden administration defuse the situation and pass this first test before we are willing to take on more risk on a tactical three-to-six-month time frame. Chart 1Volatility Can Go Higher Still
Volatility Can Go Higher Still
Volatility Can Go Higher Still
Chart 2Uncertainty Down But Beijing Testing Biden
Uncertainty Down But Beijing Testing Biden
Uncertainty Down But Beijing Testing Biden
Chart 3Biden's Approval Starts At 55%
Big Tech Regulation Is A Slow Boil – But A Boil Just The Same
Big Tech Regulation Is A Slow Boil – But A Boil Just The Same
President Biden’s average approval rating in his first two weeks in office is 55%, right where former President Trump’s disapproval rating would have suggested (Chart 3). This is a significant but not extravagant improvement in political capital for the White House. Our Political Capital Index shows Biden’s position as moderate-to-strong (Table 1). Table 1Biden’s Political Capital Moderate-To-Strong
Big Tech Regulation Is A Slow Boil – But A Boil Just The Same
Big Tech Regulation Is A Slow Boil – But A Boil Just The Same
The implication is that he still has a chance of passing his $1.9 trillion American Rescue Plan as a bipartisan bill with 10 Republican senators, a feat that would likely lower the topline value to around $1.3 trillion (Republicans proposed $618 billion) and exclude an increase in the federal minimum wage to $15 per hour. There is also a strong swing of independents in favor of Democrats in the opinion polling, in the wake of the incident on Capitol Hill on January 6, despite the fact that Republican and Democratic party identification are both stuck at around 30% — meaning that the Biden administration does have something to gain by appearing bipartisan (Chart 4).1 Republicans might cooperate to staunch the bleeding of their own support. Even Republicans approve of stimulus amid the pandemic and they would later be able to oppose Biden’s more controversial proposals with better optics having demonstrated bipartisan intent at the outset. However, House Democrats are already proceeding with a budget resolution, the first step in the budget reconciliation process that enables them to bypass Republicans entirely and get almost everything they want (Diagram 1). Chart 4Will Independents Keep Breaking Toward Democrats?
Will Independents Keep Breaking Toward Democrats?
Will Independents Keep Breaking Toward Democrats?
Diagram 1Timeline Of Impeachment, Budget Reconciliation, And Regular Legislation
Big Tech Regulation Is A Slow Boil – But A Boil Just The Same
Big Tech Regulation Is A Slow Boil – But A Boil Just The Same
Biden’s political capital should strengthen over the next year as the vaccine rollout improves and the economy comes roaring back. Official economic projections suggest that growth will glide solidly above potential until 2026 and that the output gap will close by 2024 (Chart 5). These estimates will be disappointed in various ways, of course, but in the near-term the risk is to the upside as they do not include Biden’s proposed $1.9 trillion rescue plan or his remaining, post-COVID agenda afterwards, which could cost anywhere from $3.7-$6.4 trillion over a ten-year period.2 The economy will be at less risk of relapsing than of overheating. This is especially true given the Federal Reserve’s new average inflation targeting strategy, which will discourage rate hikes till next year at the very earliest (and, from a political point of view, we would think 2023). Looking at the chart, Biden’s economic backdrop is far more propitious than that of his former boss Barack Obama’s back in 2009. Biden’s political momentum is therefore sustainable when it comes to the two budget reconciliation bills he wants to pass this year and next year. Republican internal divisions will help him. These were highlighted this week by Republican National Committee Chair Ronna McDaniel’s criticism of former New York Mayor Rudy Giuliani’s claims of voter fraud after the election and Senate Minority Leader Mitch McConnell’s recent scathing criticism of controversial pro-Trump freshman House member Marjorie Taylor Greene of Georgia. Republicans are only beginning their internal struggle and it is not certain that it will be resolved in time for the 2022 midterm elections. This is another reason to think that Biden’s political capital will be sustained and that moderate Republicans might assist with some Democratic legislation. The risks to Biden’s momentum stem from foreign policy (China, Iran, Russia), rapidly emerging financial instability, his party’s attempts at social control, and any major (not minor) negative developments involving the still-running pandemic and vaccine rollout. Chart 5US Economic Outlook Over Biden’s Term
Big Tech Regulation Is A Slow Boil – But A Boil Just The Same
Big Tech Regulation Is A Slow Boil – But A Boil Just The Same
Macro Reflation Says Stay Underweight Tech The tech sector experienced a manic phase last year when COVID-19 struck and lockdowns kept consumers at home with nothing to do but work, shop, and stare at their phones. The big five companies – Apple, Microsoft, Google, Amazon, and Facebook – together witnessed an extraordinary run up relative to the other 495 companies in the S&P index that has since peaked and dropped off (Chart 6). Chart 6Fade The Big Tech Bounce Over Long Run
Fade The Big Tech Bounce Over Long Run
Fade The Big Tech Bounce Over Long Run
Tech stock market capitalization accounts for 34% of American economic output – an extreme sign of over-concentration at a time when the market is generally inflated, according to the Buffett Index of stock market cap relative to GDP (Chart 7). Tech outperformance rests on strong earnings growth – supercharged due to the COVID crisis – as well as the secular fall in bond yields as a result of the global backdrop of excessive savings, low inflation, and scarce growth. Tech stocks are especially sensitive to bond yields because markets are projecting their earnings far into the future, as our colleague Mathieu Savary explained back in August. Ultra-dovish monetary policy with zero interest rates for longer and longer time frames is a perennial gift to these companies (Chart 8). Chart 7Buffett Indicator Says Big Tech Too Big
Buffet Indicator Says Big Tech Too Big
Buffet Indicator Says Big Tech Too Big
Chart 8Big Tech Maxing Out As Bond Yields Rise?
Big Tech Maxing Out As Bond Yields Rise?
Big Tech Maxing Out As Bond Yields Rise?
The catch is when and if growth and inflation expectations pick up. Even during the Dotcom bubble in the 1990s, the tech sector could not withstand rising interest rates (Chart 9). Eventually higher inflation will translate into central bank hikes and rising real interest rates – which should be very bad for tech as future cash flows lose value. Rising rates increase the cost of capital, while cyclical industries perform better in high growth environments with rising commodity prices. A recovery of inflation is becoming a more visible risk to investors over the coming few years. Even though unemployment is still elevated, and the output gap negative, the sea change in fiscal policy is likely to close this gap quickly and put upward pressure on expectations and prices. It will still take time to close the gap but each new dose of government spending on top of what is needed to plug the gap in demand due to the pandemic-stricken service sector will accelerate the time frame in which the labor market will tighten and price pressure will return. Investors are increasingly wary of this inflation risk as it is the logical consequence of the new combination of extreme monetary and fiscal accommodation. Earnings in the tech sector relative to the rest of the market have also peaked – and did not exceed their previous high point in 2010 despite the uniquely favorable backdrop (Chart 10). The big five have nearly saturated a lot of markets which raises the possibility that if the policy backdrop darkens, then they will see earnings disappointments. The Biden administration’s plan to raise the corporate tax rate to 28% and impose a 15% minimum tax on company book income would come as a double whammy for tech earnings, as they are relatively more exposed to increases in effective tax rates than other sectors. Chart 9Big Tech Wants Deflation, Big Government Wants Reflation
Big Tech Wants Deflation, Big Government Wants Reflation
Big Tech Wants Deflation, Big Government Wants Reflation
Chart 10Big Tech Earnings Outperformance Hit Ceiling Amid Pandemic
Big Tech Earnings Outperformance Hit Ceiling Amid Pandemic
Big Tech Earnings Outperformance Hit Ceiling Amid Pandemic
Finally, there is the long building problem of regulatory risk, as Americans have clearly become more concerned about Big Tech’s power and influence over their daily lives and politics. Here we do not think the Biden administration poses an immediate threat of frontal legislative assault, but we do think the end game is greater regulation, including tougher enforcement from antitrust agencies. Combined with geopolitical risk from Europe and other countries also seeking to tax and regulate these companies, the recent global semiconductor shortage, and the potential for a Taiwanese tech blockade, the political risk is clearly to the downside. Bottom Line: The macro backdrop has darkened for the tech sector. With governments turning more reflationary via a sea change in fiscal policy on top of ultra-easy monetary policy, inflation expectations should recover and inflation-sensitive sectors like tech should underperform. This risk is clear despite the fact that inflation requires the labor market to heal first. Any political, geopolitical, or regulatory risks would only further undermine the case for tech sector outperformance. Tech, Polarization, And Disinflation A critical question for investors is the relationship between US political polarization, the tech sector, and the disinflationary macroeconomic context that has proven so beneficial for Big Tech’s stock market performance. If polarization leads to gridlock, austerity, and disinflation, then tech can continue to enjoy the policy environment. But if polarization subsides, or if it coexists with a reflationary backdrop – as is the case today – then tech faces a new risk. It is fair to hypothesize that the rise of Silicon Valley and especially of social media has something to do with the explosion in US polarization over the past three decades. A simple chart of the S&P 500 alongside our polarization proxy – which measures the difference in presidential approval based on party – suggests that polarization could have some connection with tech sector outperformance (Chart 11). This is not a coincidence but the causality may work differently than some assume. The first period of tech sector outperformance, which rested on the “peace dividend” period of hyper-globalization, strong growth, strong dollar, low inflation, and technical innovation, occurred during the explosion of US polarization in the wake of the Cold War, when the US’s common enemy fell and the country’s political parties turned to do battle with each other for global supremacy. The structural changes of Reaganomics and NAFTA coincided with the political battles of the Republican revolution of 1994 and Bill Clinton’s sex scandal and impeachment. This heady period came to a peak in 2000 when the dotcom bubble burst and the US suffered its first contested election since 1876. Essentially globalization led to a deflationary backdrop that favored tech but also triggered the political struggle within the US for the spoils of victory in the Cold War. Chart 11Big Tech Likes Polarization And Gridlock
Big Tech Likes Polarization And Gridlock
Big Tech Likes Polarization And Gridlock
The second period of tech sector outperformance emerged from the Great Recession, still higher wealth inequality, and the slow-burn economic recovery of the 2010s. The disinflationary environment and dollar bull market proved beneficial to the tech companies. In this case globalization’s deflationary effects continued but were compounded with US household deleveraging, which was far more malicious for the American middle class. Crucially, polarization created gridlock in Congress from 2010, preventing the US from pursuing a robust fiscal policy in the wake of the crisis that might have led to a more rapid recovery. Instead an extended disinflationary environment fed into social unrest and populism. While public animus naturally turned against Wall Street and the Big Banks in the wake of the financial crisis, the Dodd-Frank financial reform helped to pacify the public’s anger (though not entirely – and financial regulation is gradually reemerging as a relevant political risk). As the financial crisis faded from memory, but the low-growth, disinflationary environment continued to take a toll on households, an angry electorate began to freely express itself in the digital realm. Tech companies were happy to ride this wave and outperformed other sectors. As the backlash continued mounting, tech companies failed to rein in the angry userbase they had cultivated, and now they are staring at massive regulatory and legal risks from policymakers. Both Barack Obama and Donald Trump used Twitter and social media as a tool to establish direct engagement with their political base, much as Franklin Delano Roosevelt had used the radio and the fireside chat. This rising political heft ultimately made the companies conspicuous as conservatives blamed them for supporting the Obama administration (and Clinton campaign) while liberals especially blamed them for getting Trump elected. The Trump saga in particular gave rise to the so-called “tech-lash,” or backlash, as the companies’ core base of young, urbanized, cosmopolitan, and international users called on the tech companies to stop the spread of Russian propaganda, or other propaganda they disagreed with, and undertake socially progressive causes. Meanwhile the older, conservative, and rural population doubted that Russian interference caused the 2016 election result and sensed that the tech companies’ content moderators might not be all that scrupulous regarding the difference between conservative views and Russian information warfare (Chart 12, top panel). In combination with the heated election year campaigning, the pandemic and the backlash against lockdown, tension in the virtual world came to a peak last year and spilled out into the real world. This all came to a head with Twitter and Facebook first censoring and then banning President Trump from their platforms amid his claims of voter fraud and the riot on Capitol Hill. Chart 12Big Tech Not The Chief Driver Of Polarization
Big Tech Regulation Is A Slow Boil – But A Boil Just The Same
Big Tech Regulation Is A Slow Boil – But A Boil Just The Same
Two major policy changes have occurred that threaten to reverse this macro backdrop. First, as a result of the 2020 crisis the Democrats won control of the White House and Congress and can now pass their mammoth spending agenda, which goes beyond pandemic relief to expanding the role of government in American economy and society – including by reflating the economy and imposing higher taxes on corporations, both of which threaten to undermine the tech sector’s outperformance. Second, China’s secular slowdown, reduction of trade dependency, and divorce from the US economy have undermined hyper-globalization. The Biden administration is pursuing on-shoring and China restrictions albeit to a lesser extent than its predecessor. If technological advance and social media cause political polarization, then these policy shifts may not last long or have a durable macro effect. But technology and communication tools have advanced throughout history regardless of whether polarization in any given country was rising or falling. Older people are the most partisan in the US yet they are the least enthusiastic users of social media (Chart 12, bottom panel). Tech and social media have proliferated across the world and yet polarization has fallen in Germany, Australia, Sweden, and other economies even as it has risen in the United States and arguably the United Kingdom (Chart 13). If social media enabled populist outcomes like Trump and Brexit, then why did populism fall short in France, Spain, Italy, and Germany? Social media participation thrived on the rise of polarization through the 2000s and 2010s but it exacerbated the problem – and once polarization erupted in the form of an anti-establishment presidency, Russian interference, the Cambridge Analytica scandal, and real world riots and social unrest, the tech platforms found themselves in the crosshairs of both of the political factions and the various politicians trying to appease their anger. Silicon Valley and the FAANGs operate in a power struggle – not merely a politicized environment – that is here to stay and will direct their attention away from their primary business and toward paying for lobbyists in Washington, Brussels, and elsewhere. This in itself is a danger to their business models even if it were not the case that the macro and policy backdrop is less supportive. Bottom Line: The reflationary fiscal and policy backdrop will continue in the coming years, a macro headwind for tech outperformance, while political risks to the tech sector have grown substantially. Chart 13Polarization Falls In Many Countries Despite Social Media
Big Tech Regulation Is A Slow Boil – But A Boil Just The Same
Big Tech Regulation Is A Slow Boil – But A Boil Just The Same
Congress In Check But Regulatory Risk Persists Democrats and Republicans have a different and opposed set of grievances against Big Tech, which is likely to prevent comprehensive legislation from developing anytime soon. But legislation is still possible, and in the meantime risks will come from emboldened regulators. Based on the House judiciary hearing in July 2020, Democrats are concerned with content moderation and market concentration. They want to fortify their recent gains in preventing social media companies from aiding what they regard as the spread of seditious and libelous material or propaganda that favors the anti-establishment Trumpist right wing. Judging by the Senate Republicans’ hearings in October and November 2020, Republicans are primarily concerned with content moderation– i.e. preventing conservatives from being de-platformed, and conservative views from being censored. Republicans are less concerned about market concentration, i.e. accusations of monopolistic and anti-competitive behavior.3 Now that the social media companies have more or less thrown in with the Democrats on content moderation, Democratic priorities are likely to shift to antitrust and anti-competitive behavior. But serious changes would require either abolishing the filibuster in the Senate (which is not happening for the time being due to last month’s bipartisan power-sharing arrangement) or winning over 10 Republicans. This will be difficult, especially when it comes to the Democratic belief that a generational shift in antitrust doctrine and practice is necessary. A frontal assault on the sector would require passing a law that resolves a number of jurisprudential issues so that the courts could be instructed to interpret antitrust issues with a greater focus on rooting out anti-competitive or collusive behavior (as opposed to lowering prices and preventing consumer harm). This is possible but Republican agreement would require major compromises that the Democrats are not inclined to make. A bipartisan bill is still possible because last year’s hearings revealed that there is common ground between the two parties. Both have agreed that anti-trust agencies should be strengthened and empowered to examine Big Tech; that data should be portable and platforms should be interoperable (rather than favoring their own services or imposing penalties for users who would switch services); that mergers and acquisitions should be examined with the presumption that consumers will be harmed, so that the merging parties must show that they cannot otherwise achieve the desired consumer benefits and that their actions will serve some public good; and that regulators need not trouble themselves excessively about the problem of accurately defining the market, which is always a sticking point for such fast evolving services.4 Moreover there is overlap between the populist sides of both parties, comparable to the bipartisan populist demands to give larger household rebates amid the COVID crisis. For example, Democrats want to revise Section 230 of the Communications Decency Act, which protects the tech companies from being held liable for the actions and comments of third parties on their platforms. The Democratic proposal is to break down the distinction between neutral tools and content creation, arguing that tech platforms can be “negligent” and that in order to benefit from the liability protections they should have to demonstrate that they have taken reasonable steps to prevent unlawful misuse of their platforms that cause harm to others. This idea of “reasonable moderation” would leave a very vague standard for judges that would lead to a complex operating environment across different jurisdictions, but it is attractive to Trumpists and right-wing populists who support greater ability to sue the platforms for alleged bias.5 Thus revising Section 230 could create a bridge between the two parties, albeit isolating the free-market contingent in either party. It would foist huge new liabilities not only on the tech giants but also on startups and market entrants with far fewer lawyers. The mechanism will be a decisive feature of any future legislative proposal, however. Republicans are staunchly opposed to creating an Internet oversight committee, similar to the Consumer Financial Protection Bureau, or anything that smacks of Big Brother and would risk too cozy of a relationship between the regulatory state and the immense capabilities of the tech companies. But they could be amenable to law that strengthens the antitrust agencies and alters the parameters of judicial scrutiny if they believed it would make consumer choice and innovation more likely. If popular opinion suggested great urgency on this issue then perhaps the parties’ differences could be resolved more quickly in the form of a major bill. But polls suggest the populace is also divided on tech regulation – in part because the pandemic left consumers largely thankful for the Internet services that they relied on so heavily while under lockdown. A bare majority of conservative Republicans and liberal Democrats now favor tech regulation, the average voter is lukewarm, and moderates of both parties show little enthusiasm (Chart 14). By contrast, at the height of Democratic anxiety over Trump’s election and Russian interference, a clear majority of Democrats and Democrat-leaning independents favored tougher regulation. Chart 14Public Split On Government Regulation Of Big Tech Companies
Big Tech Regulation Is A Slow Boil – But A Boil Just The Same
Big Tech Regulation Is A Slow Boil – But A Boil Just The Same
In short, the public is split, the parties are split, and the various 2020 crises have temporarily subsided, so tech regulatory risk will emanate from regulatory authorities but not from major new legislation anytime soon. Regulatory agencies thus threaten to give tech stocks negative surprises – even if the process takes time. Biden will replace one commissioner on the Federal Trade Commission (FTC) immediately but may only be able to replace two Republican commissioners toward the end of his term, in September 2023 and 2024, meaning that the commission will be divided (Table 2). Any major crackdown on market concentration will have to proceed upon bipartisan grounds unless Democrats gain control of this commission sooner. Meanwhile Biden will be able to replace outgoing Republican Ajit Pai on the Federal Communications Commission (FCC) right away, giving a Democratic tilt to this body, which is capable of pursuing the administration’s goals on content regulation (Table 3). Here the Supreme Court may eventually weigh in to defend free speech and press rights, which Section 230 ultimately reinforces, but the tech companies will be in the firing line until then. Table 2Federal Trade Commission Balance Of Power
Big Tech Regulation Is A Slow Boil – But A Boil Just The Same
Big Tech Regulation Is A Slow Boil – But A Boil Just The Same
Table 3Federal Communications Commission Balance Of Power
Big Tech Regulation Is A Slow Boil – But A Boil Just The Same
Big Tech Regulation Is A Slow Boil – But A Boil Just The Same
Finally, Biden’s nominee for the US Assistant Attorney General for the antitrust division will be a critical post to watch for the Department of Justice’s involvement in tech regulation and antitrust, though this position requires Senate confirmation, which will rule out any populist candidate. If Biden picks a former Facebook lawyer as rumored then he clearly will not be prioritizing a tough antitrust stance.6 Bottom Line: With the Senate filibuster intact for the time being, Democrats need 10 Republican senators to join them to pass any significant legislation that would amount to a frontal assault on the tech sector. This is possible but not probable in the short run, as Congress prioritizes the fight against the pandemic, Republicans and Democrats remain divided and the public is lukewarm about regulation. Much more likely is a regulatory slow boil at the hands of the DOJ, FCC, FTC, and the states. Biden Maintains Obama Alliance With Silicon Valley Public opinion is wishy washy about Big Tech, as mentioned above. Compare attitudes toward Wall Street and the major pharmaceutical corporations. Opinion shifted against the banks drastically during the financial crisis and has since recovered to about 24% net approval, although there are also polls showing that consumers of all stripes believe the banking sector got off easy and could use more regulation (Chart 15). The health care industry also took a hit during the Great Recession, when laid off workers also lost their health insurance, and has also largely recovered due to its conduct during the pandemic. The exception is Big Pharma, which is widely blamed for excessive drug prices, got bashed under President Trump, and is about to get bashed by President Biden in the form of price caps and Medicare negotiations. By contrast with these sectors, the computer and Internet industry has seen a hit to its popular support since Trump’s election but never dipped into net negative territory and may be recovering due to its helpful role during the COVID lockdowns. When net popular approval turns negative then it will be a flashing red light for the tech sector that sweeping regulation is imminent. While some of the opinion polling is lagging, the crisis over the election is unlikely to produce this effect because the public views break down along partisan lines. Chart 15Big Tech More Popular Than Big Banks, Big Pharma
Big Tech Regulation Is A Slow Boil – But A Boil Just The Same
Big Tech Regulation Is A Slow Boil – But A Boil Just The Same
Thus unlike the Trumpists, or the populists in the Democratic Party, the Biden administration is only inclined gradually to dial up the pressure on Big Tech. Biden would bite off more than any president could chew if he tackled tech aggressively along with other big corporations. His campaign platform and early executive orders show that he is already tackling Big Health Insurance and Big Oil, sectors that make up 7.5% and 1.4% of GDP respectively. There is at least some focus on re-regulating the financial industry as well (7.7% of value add), albeit with lower priority. To attempt a major overhaul of Big Tech (at least 5.3% of GDP) on top of all this would be impracticable even if Biden were inclined to listen to the anti-monopoly crusaders in his party. Information services are obviously important to the economies of solid blue states like California, New York, and Washington but they are increasingly important to critical swing states like Georgia and Pennsylvania – places where voters will be skeptical of Biden’s policies on energy and immigration. The information sector is growing fastest in blue states and in battlegrounds like Arizona. It employs more people in blue states and in battlegrounds like Georgia. And it is rapidly employing more people in the grand prize of Democratic designs, Texas, where an exodus of Californians fleeing poor governance and high costs holds out the possibility of creating a decisive Democratic ascendancy in the Electoral College. Silicon Valley and other tech clusters will maintain their unique strengths and network effects for a long time but the dispersion of the tech sector to cheaper heartland regions has electoral consequences that mainline Democrats will not want to suppress. Not only did the tech firms help Biden get elected through votes and media controls but also through campaign contributions. The financial and health care industries punished the Democrats for passing the Affordable Care Act (Obamacare) and Dodd-Frank reforms in 2009-12 (Chart 16). By contrast the tech heavily favors Democrats over Republicans (with donations at $170 million versus $20 million in the 2020 election). Biden’s priorities are two budget reconciliation bills that will partially reverse the Trump tax cuts in order to pay for the entrenchment and expansion of Obamacare and other aspects of his health care and child care agenda. He is also focused on infrastructure, particularly green infrastructure and renewables, to create jobs and galvanize the climate change coalition. Broad re-regulation is coming down the pike, but health, immigration, energy, and labor are higher priorities than tech. The tech sector faces greater scrutiny than before, first from the FCC and later from the DOJ and FTC, but the administration will have more room for maneuver later in its term. Bottom Line: The Obama administration forged an alliance with Silicon Valley that Biden will largely maintain. The purpose of regulatory pressure is to build leverage over the tech giants. Chart 16Big Tech A Big Donor To Democratic Party
Big Tech Regulation Is A Slow Boil – But A Boil Just The Same
Big Tech Regulation Is A Slow Boil – But A Boil Just The Same
Investment Takeaways Not all of the dominoes are lined up to topple Big Tech in a massive display of federal monopoly busting. The public is lukewarm and the political elite are divided. Nevertheless the long-term trajectory points to greater government scrutiny – and the tech sector has no margin of safety for political risk as the macro backdrop has started to shift in a more inflationary direction. Our colleague Juan Correa Ossa has shown that antitrust action to curb corporate power has tended to occur at times in US history where stock market earnings are elevated or rising rapidly relative to average wages, when inflation is running hot, and yet the economy has entered a bust phase where politicians are looking for a scapegoat to deflect public anger (Table 4). Table 4Stock Performance In Selected Judicial Events
Big Tech Regulation Is A Slow Boil – But A Boil Just The Same
Big Tech Regulation Is A Slow Boil – But A Boil Just The Same
While inflation is not an immediate problem (at least not yet), it was not a problem when the FTC and DOJ went after Microsoft starting in 1998. The distressed economy and tech bubble are good enough reason for investors to expect the government to increase antitrust pressure (Chart 17). If inflation recovers in the coming years around the time the Biden administration gains room to maneuver on this issue then it is doubly bad for the tech sector. Chart 17Anti-Trust Usually Follows Economic Bust
Anti-Trust Usually Follows Economic Bust
Anti-Trust Usually Follows Economic Bust
In Microsoft’s case, the stock fell when the government first brought charges but rallied throughout the twists and turns of the courtroom – especially after 2002 when the case was settled, and ever since (Chart 18). Fortunately for the company the DOJ backed away from breakup and instead ordered it to open up its application programming to others. But even firms that are broken up usually create buying opportunities. Note that Microsoft cleared its image and has not become the subject of government or popular scrutiny again today. Today’s regulators are likely to place a greater burden of proof on tech companies attempting mergers and acquisitions. The alternative for startups is to hold an initial public offering – and IPOs have exploded amid the current context of low rates, easy money, investor exuberance, a chilling effect on M&A, and a lingering pandemic. The markets are frothy, buyer beware (Chart 19). Chart 18Microsoft's Anti-Trust Warning
Microsoft's Anti-Trust Warning
Microsoft's Anti-Trust Warning
Chart 19Regulators Will Crack Down On M&A
Regulators Will Crack Down On M&A
Regulators Will Crack Down On M&A
Strategically we remain favorable toward value stocks over growth stocks given the changing macro and policy backdrop outlined above (Chart 20). However, in the very near term we would not encourage investors to take on any additional risk. The latest bout of volatility is not necessarily over, political and geopolitical risks are now underrated after a period in which they subsided from peak levels, and exuberant markets are subject to very sharp corrections. Matt Gertken Vice President Geopolitical Strategy mattg@bcaresearch.com Jesse Anak Kuri Associate Editor jesse.Kuri@bcaresearch.com Chart 20Take A Pause Amid Value Vs Growth Setback
Take A Pause Amid Value Vs Growth Setback
Take A Pause Amid Value Vs Growth Setback
Appendix Table A1Political Risk Matrix
Big Tech Regulation Is A Slow Boil – But A Boil Just The Same
Big Tech Regulation Is A Slow Boil – But A Boil Just The Same
Table A2Biden’s Cabinet Position Appointments
Big Tech Regulation Is A Slow Boil – But A Boil Just The Same
Big Tech Regulation Is A Slow Boil – But A Boil Just The Same
Footnotes 1 Congressional Budget Office, “Overview of the Economic Outlook: 2021-2031,” February 2021, cbo.gov. 2 Committee for a Responsible Federal Budget, “The Cost of the Trump and Biden Campaign Plans” October 7, 2020, and “The Cost of the Trump and Biden COVID Response Plans,” October 29, 2020, October 7, 2020, crfb.org. 3 The huge gap between the two parties can be illustrated by the recent case of Parler, the microblog that sought to rival Twitter by maintaining laissez faire content moderation standards. When Parler came under fire for attracting conservatives in the wake of the Twitter ban against Trump, Apple and Amazon teamed up to block it from their app purchasing and cloud services, thus effectively banning the app for 99% of users. There is no doubt that any private platform can regulate content according to its own standards on its own sites. In the words of Section 230, this extends not only to “obscene” or “excessively violent” material but to anything “otherwise objectionable.” But once tech companies prevent the emergence of competitors and alternatives, and cooperate in doing so, they enter much more dangerous legal territory. And yet the response from the House Democrats on the oversight committee was to ask the FBI to investigate Parler for hosting far-right extremists. Conservatives are therefore up in arms. The courts have not yet weighed in but the case represents a larger risk to the tech firms than the usual challenges under Section 230. 4 Representative Ken Buck, “The Third Way,” House Judiciary Committee, Subcommittee on Antitrust, Commercial, and Administrative Law 5 See Will Duffield, “Circumventing Section 230: Product Liability Lawsuits Threaten Internet Speech,” Cato Institute, January 26, 2021, cato.org. 6 See Ryan Grim and David Dayen, “Merrick Garland Wants Former Facebook Lawyer To Top Antitrust Division,” The Intercept, January 28, 2021, theintercept.com.
Reopen The “Back-To-Work” Trade, And Put The Small Cap Size Bias On Upgrade Alert
Reopen The “Back-To-Work” Trade, And Put The Small Cap Size Bias On Upgrade Alert
We are reopening our long “Back-To-Work”/short “COVID-19 Winners” pair trade that we first instituted in the September 8th, 2020 Strategy Report, and subsequently closed earlier this year for a gain of 21.5%, since inception as our risk management rolling stop was hit. Yesterday we highlighted that the recent market tumult is likely an equity-only event and the underlying cyclical drivers in the stock market remain intact. As equity vol settles down and the sudden fall in the 10-year Treasury yield reverses course (it remains one of the key risks to our economic reopening theme), there are high odds that the long “Back-To-Work”/short “COVID-19 Winners” share price ratio will resume its ascend. At the same time, the bullish theme for the economic reopening trade got another boost from the most recent ISM release that posted upbeat numbers especially on the prices paid subcomponent of the survey (bottom two panels). Thus, we are compelled to re-initiate this trade. With regard to the small cap bias that we recently monetized handsome gains for our portfolio – which is driven by similar macro catalysts – we are on the lookout to re-establish a small cap size bias, but at a better entry point (top two panels). Bottom Line: Reopen the long “Back-To-Work” / short “COVID-19 Winners” pair trade and put the small size bias on upgrade alert. The ticker symbols in the “Back-To-Work” and “COVID-19 Winners” baskets are: LUV, DAL, MAR, HLT, CVX, EOG, SBUX, MCD, CAT, HON, AXP, COF, NUE, GM; and TDOC, FCN, ZM, CTXS, JNJ, AMGN, REGN, CLX, RBGLY, WMT, COST, KR, NFLX, AMZN, respectively.
Highlights Chart 1China's PMIs Dropped In January
China Macro And Market Review
China Macro And Market Review
January’s official PMI suggests that China’s economic recovery started the year on a weaker note. While both manufacturing and non-manufacturing PMIs remain in expansionary territory, the moderation was larger than in previous Januarys, which implies that more than seasonal factors were at play (Chart 1). The lockdowns in January due to a resurgence of COVID-19 cases in China are distorting business activities. Moreover, travel restrictions imposed for the upcoming Lunar New Year (LNY) will profoundly affect household consumption and the service sector in February and perhaps into March. Chinese stock prices, on the other hand, registered gains in January in both onshore and offshore markets. As noted in last week’s report, Chinese stocks face downside risks in the near term and we recommend that investors turn cautious. Economic and profit growth may disappoint in the first quarter, against a tightening policy backdrop. Feature Monetary Policy Normalization Remains On Track In the past three weeks, the PBoC drained short-term liquidity on a net basis from the interbank system. This action reversed market expectations in earlier January that the central bank would start to loosen monetary stance. Chart 2Chinas Monetary Policy Unlikely To Change Course When The Economy Strengthens
Chinas Monetary Policy Unlikely To Change Course When The Economy Strengthens
Chinas Monetary Policy Unlikely To Change Course When The Economy Strengthens
The soft patch in China’s first-quarter economic recovery may prompt the PBoC to temporarily slow the pace of interest rate tightening, but it is unlikely that policymakers will reverse their policy normalization over the next 6 to 12 months (Chart 2). The authorities have been increasingly concerned about asset price inflation. In our view, near-term policy shifts will be tied to asset prices rather than consumer prices. The PBoC stated that its policymaking will be data dependent, but it may not succumb to a marginally slower recovery, particularly if the weakness proves to be transitory. Moreover, the unprecedented growth contraction from Q1 last year will boost economic data in the first three months of this year due to a low base effect. This year’s monetary policy could be reminiscent of 2019 when the PBoC frequently adjusted the short-term interbank rate (i.e. 1- to 7-days) while keeping the longer rate (3-month repo rate) mostly trendless throughout the year (Chart 3). In this scenario, China's 10-year government bond yield will not rise by as much as in 2017-2018 (Chart 4). Without a substantial improvement in profit growth, however, a slower rise in bond yields will be only marginally positive for Chinese stocks (Chart 4, bottom panel). Chart 3Policy Normalization Remains On Track
Policy Normalization Remains On Track
Policy Normalization Remains On Track
Chart 4Smaller Bond Yield Hikes Are Marginally Positive For Chinese Stocks
Smaller Bond Yield Hikes Are Marginally Positive For Chinese Stocks
Smaller Bond Yield Hikes Are Marginally Positive For Chinese Stocks
Corporations May Not Deliver Strong Profit Growth In 2021 Chart 5An Impressive Profit Recovery Supported The Stock Rally In 2H20
An Impressive Profit Recovery Supported The Stock Rally In 2H20
An Impressive Profit Recovery Supported The Stock Rally In 2H20
The newly released industrial profits data showed a sharp rebound in growth this past December, with the annual profit up by 4.1% over 2019. An impressive recovery in profit growth in the second half of last year helped to drive up Chinese stock prices (Chart 5). However, the magnitude of the rally in stock prices has been much more substantial than implied by the underlying profit growth. Industrial profits have barely recovered to their 2018 levels, while A shares have jumped by 40% in the past two years (Chart 5, bottom panel). Moreover, the strong recovery in profit growth may not be sustainable in 2021. While sales revenues may pick up even more this year, operating costs will likely increase, which would compress corporate profit margins (Chart 6). Lower operating costs from last year’s cheaper financing and growth-support policies, such as tax cuts and loan payment deferrals, helped to widen corporate profit margins. China’s social security contribution exemption and reduction policy reduced the cost burden of enterprises by 1.5 trillion yuan in 2020. Moreover, cheaper global commodity and oil prices in earlier 2020 also lowered China’s industrial input prices (Chart 7). Chart 6Increasing Operation Costs May Weigh On Industrial Profit Margins
Increasing Operation Costs May Weigh On Industrial Profit Margins
Increasing Operation Costs May Weigh On Industrial Profit Margins
Chart 7Input Prices Have Risen Faster Than Output Prices
Input Prices Have Risen Faster Than Output Prices
Input Prices Have Risen Faster Than Output Prices
Chart 8Product Inventories And Account Receivables Have Not Fully Recovered
Product Inventories And Account Receivables Have Not Fully Recovered
Product Inventories And Account Receivables Have Not Fully Recovered
The normalization of policy rates and bond yields along with the rebound in commodity prices will weigh on industrial profit margins and profit growth this year. Furthermore, some cost-reduction benefits will be rolled back: policymakers have announced an end to the social security contribution waiver for corporations in 2021. However, they will extend the reduction of unemployment insurance from the end of April 2021 to April 2022. It is still unclear whether China will grant the same scale of corporate tax relief this year as it did in 2020. We note that industrial inventory turnover has not recovered to its pre-pandemic level, finished product inventories remain high, and accounts receivable payments are taking longer to reach businesses compared with 2019. All these factors highlight a lack of vigor in the industrial sector’s recovery (Chart 8). Travel Restrictions Will Dampen Q1 Economic Growth Chart 9A New Wave Of COVID-19 Cases In China
A New Wave Of COVID-19 Cases In China
A New Wave Of COVID-19 Cases In China
New travel restrictions may cause some short-term distortion in China’s aggregate economy in the first quarter. China announced inter-provincial travel constraints for the LNY, effective between January 28 and March 8, due to a resurgence of COVID-19 cases in Beijing and the northern provinces (Chart 9). Local authorities urged migrant workers to stay in their work places and not return to their hometowns. According to the Ministry of Transport, it is estimated that around 50% of migrant workers will remain in place during the LNY. Manufacturing production (secondary industry) may increase slightly because workers will take fewer vacation days during the LNY. Nevertheless, the positive effect will be more than offset by large losses from consumption and tourism (tertiary industry). Reduced consumption from holiday travel, restaurant dining, offline shopping and services will overwhelm online retail sales of goods and services. All these factors will negatively impact Q1 GDP because tertiary industry accounts for around 55% of China’s GDP, a much larger slice than secondary industry1 (Chart 10). January’s PMI shows that after narrowing in the past six months, the gap between production (supply) and new orders (demand) sub-indexes widened again in January (Chart 11). We expect the travel restrictions to exacerbate the goods oversupply in February and perhaps even into March. Chart 10New Travel Restrictions Will Have A Negative Impact On Q1 GDP
New Travel Restrictions Will Have A Negative Impact On Q1 GDP
New Travel Restrictions Will Have A Negative Impact On Q1 GDP
Chart 11Goods Oversupply May Last Through Q1
Goods Oversupply May Last Through Q1
Goods Oversupply May Last Through Q1
Lingering Deflationary Pressures While headline CPI moved back into inflationary territory in December, mainly driven by food price increases, core CPI has fallen to its lowest level since late 2010 (Chart 12). Prices for some key consumer goods and services remain firmly in deflation and they may deteriorate further in Q1 due to a high price base during last year’s LNY. Chart 12Lingering Deflationary Pressures On Consumer Prices
Lingering Deflationary Pressures On Consumer Prices
Lingering Deflationary Pressures On Consumer Prices
Chart 13PPI Will Likely Turn Positive In Q1 Due To Low Base Effect
PPI Will Likely Turn Positive In Q1 Due To Low Base Effect
PPI Will Likely Turn Positive In Q1 Due To Low Base Effect
Chart 14A Stronger RMB Will Exacerbate Deflationary Pressures
A Stronger RMB Will Exacerbate Deflationary Pressures
A Stronger RMB Will Exacerbate Deflationary Pressures
PPI deflation has eased and will probably turn positive in Q1 this year, supported by an expansionary business cycle and a low base (Chart 13). However, the risk of deflation may resurface in the second half of the year as stimulus effects subside. As such, China’s corporate profit growth will again face downward pressure, which would be exacerbated by a stronger RMB and rising real interest rate (Chart 14). Shipping Disruptions Should Be Transitory China’s export sector remains strong, benefiting from improving global demand and strength in China’s manufacturing supply chains. The drop in January’s PMI export new orders sub-index was mainly seasonal and could be due to the recent pandemic-related logistical disruptions and bottlenecks at ports (Chart 15). The recent massive jump in freight costs reflects these one-off factors and bouts of inflation this year due to disruptions in logistics, which will likely prove to be transitory (Chart 16). Chart 15Exports Should Remain Robust Through 1H21
Exports Should Remain Robust Through 1H21
Exports Should Remain Robust Through 1H21
Chart 16A Jump In Freight Costs is Probably Transitory
A Jump In Freight Costs is Probably Transitory
A Jump In Freight Costs is Probably Transitory
Real Estate Sector Under Stricter Scrutiny Housing demand and prices in top-tier cities picked up again in December despite rising mortgage rates and more restrictive bank lending to the real estate sector (Chart 17). In our view, the rebound in floor space started will be short-lived, and the gap between floor space started and completed will continue to converge (Chart 18). Real estate developers face stricter borrowing regulations and the rate of expansion of new projects will slow this year due to shrinking land transfers in 2020. Still, real estate developers will continue to finish their existing projects and promote new home sales. Therefore, on a net basis, we expect real estate investment and construction activities to remain stable in the first half of 2021. Chart 17Housing Demand In First Tier Cities Climbed Again In December
Housing Demand In First Tier Cities Climbed Again In December
Housing Demand In First Tier Cities Climbed Again In December
Chart 18A Rebound In Floor Space Started May Be Short lived
A Rebound In Floor Space Started May Be Short lived
A Rebound In Floor Space Started May Be Short lived
Table 1China Macro Data Summary
China Macro And Market Review
China Macro And Market Review
Table 2China Financial Market Performance Summary
China Macro And Market Review
China Macro And Market Review
Qingyun Xu, CFA Senior Analyst qingyunx@bcaresearch.com Jing Sima China Strategist jings@bcaresearch.com Footnotes 1China’s secondary industry is mainly comprised of mining, manufacturing, the production and supply of electricity, gas and water, and construction. The tertiary industry refers to traffic, storage and mail businesses, information transfer, computer services and software, wholesale and retail trade, accommodation and food, finance, and other services. Cyclical Investment Stance Equity Sector Recommendations
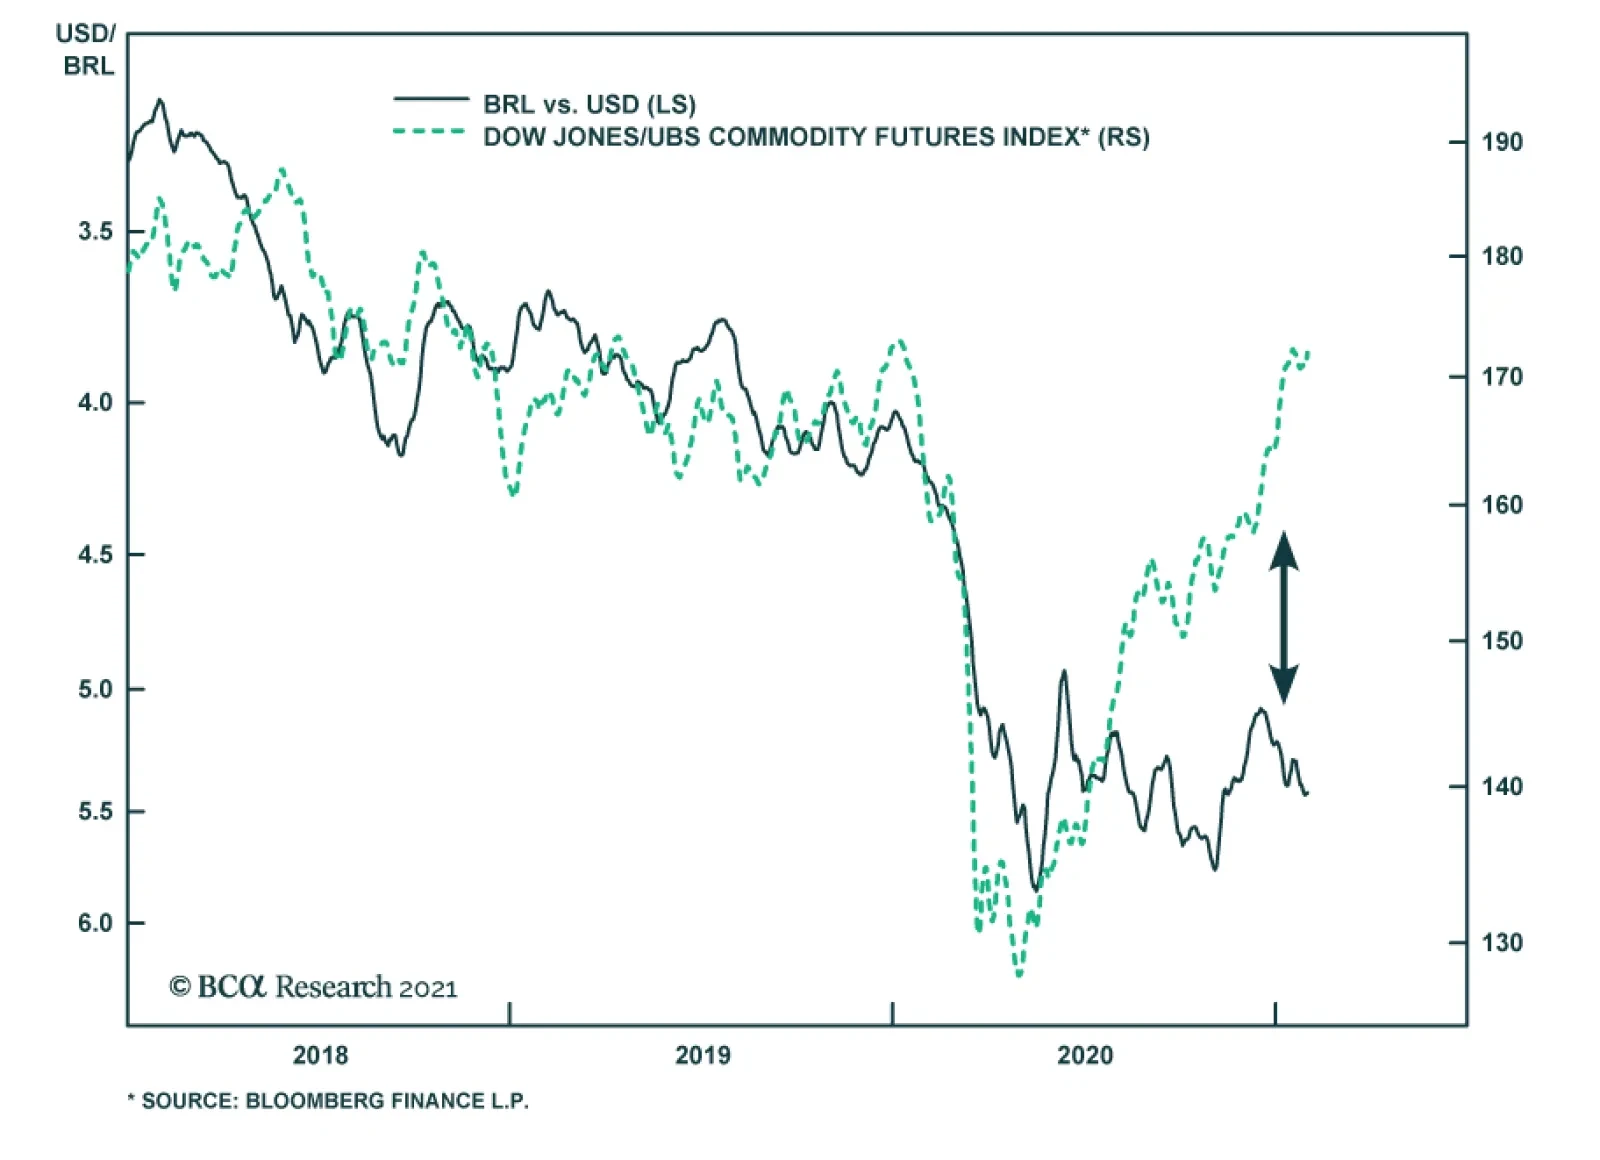
BCA Research’s Emerging Markets Strategy service remains negative on the BRL. Brazilian stocks will only become a clear buy after their risk premium reflects fiscal challenges better. Rising resource prices and the global risk-on environment have failed to…