Equities
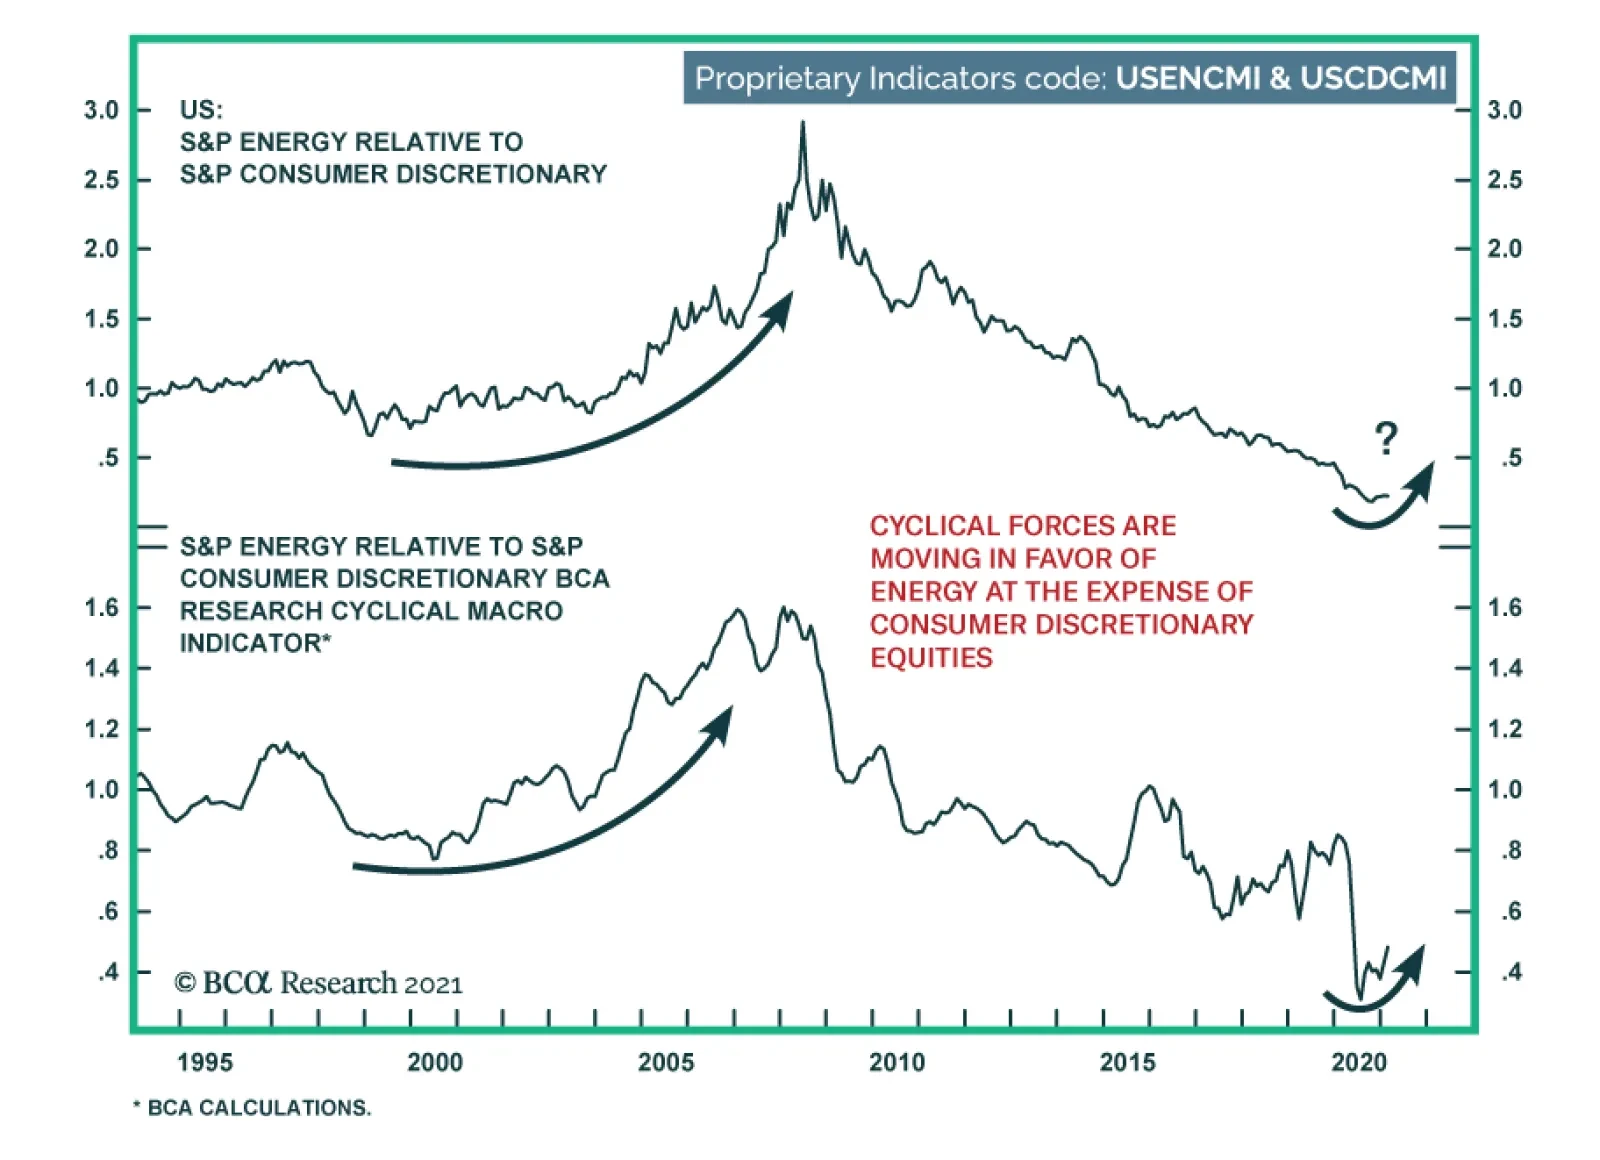
A high-octane bet on the energy sector is to overweight it at the expense of consumer discretionary equities. During the pandemic-induced global recession, consumer discretionary (mainly Amazon) thrived while energy stocks suffered. These trends have begun to…

We recommend investors monetize gains in the hedge we first recommended on December 7, 2020 in the form of VIX June futures, for a gain of 19% since inception, assuming conservatively that no leverage was used in executing this hedge. While the GME/Wallstreetbets saga has yet to fully play out, three reasons underpin our decision. First, this appears to be an equity only event as both USDJPY and USDCHF foreign exchange pairs went up last Wednesday and Friday. In a traditional “risk off” phase, the yen and the franc would spike versus the greenback not selloff. Second, during periods of active Fed QE the broad equity market has never fallen more than 10% from respective peaks. Using the Sunday night low for ES futures results in a 5.3% peak to trough fall for the broad market, well in the range of previous active Fed QE pullbacks. Finally, the spot VIX has jumped from 21 to a recent peak of 38, likely reflecting a lot of negative news. Spot VIX with a current (as we went to press) 33 handle implies that in the next 30 days the S&P 500 will either fall or rise by roughly 10% and vault to all-time highs or sink back to 3400. While the jury is still out on how this short squeeze phase will play out, a steeply inverted vol curve last week also signaled that the worst is likely behind us (see chart). Bottom Line: Crystalize 19% gains since inception in the VIX futures hedge, but stay vigilant.
Book Gains In VIX Futures
Book Gains In VIX Futures
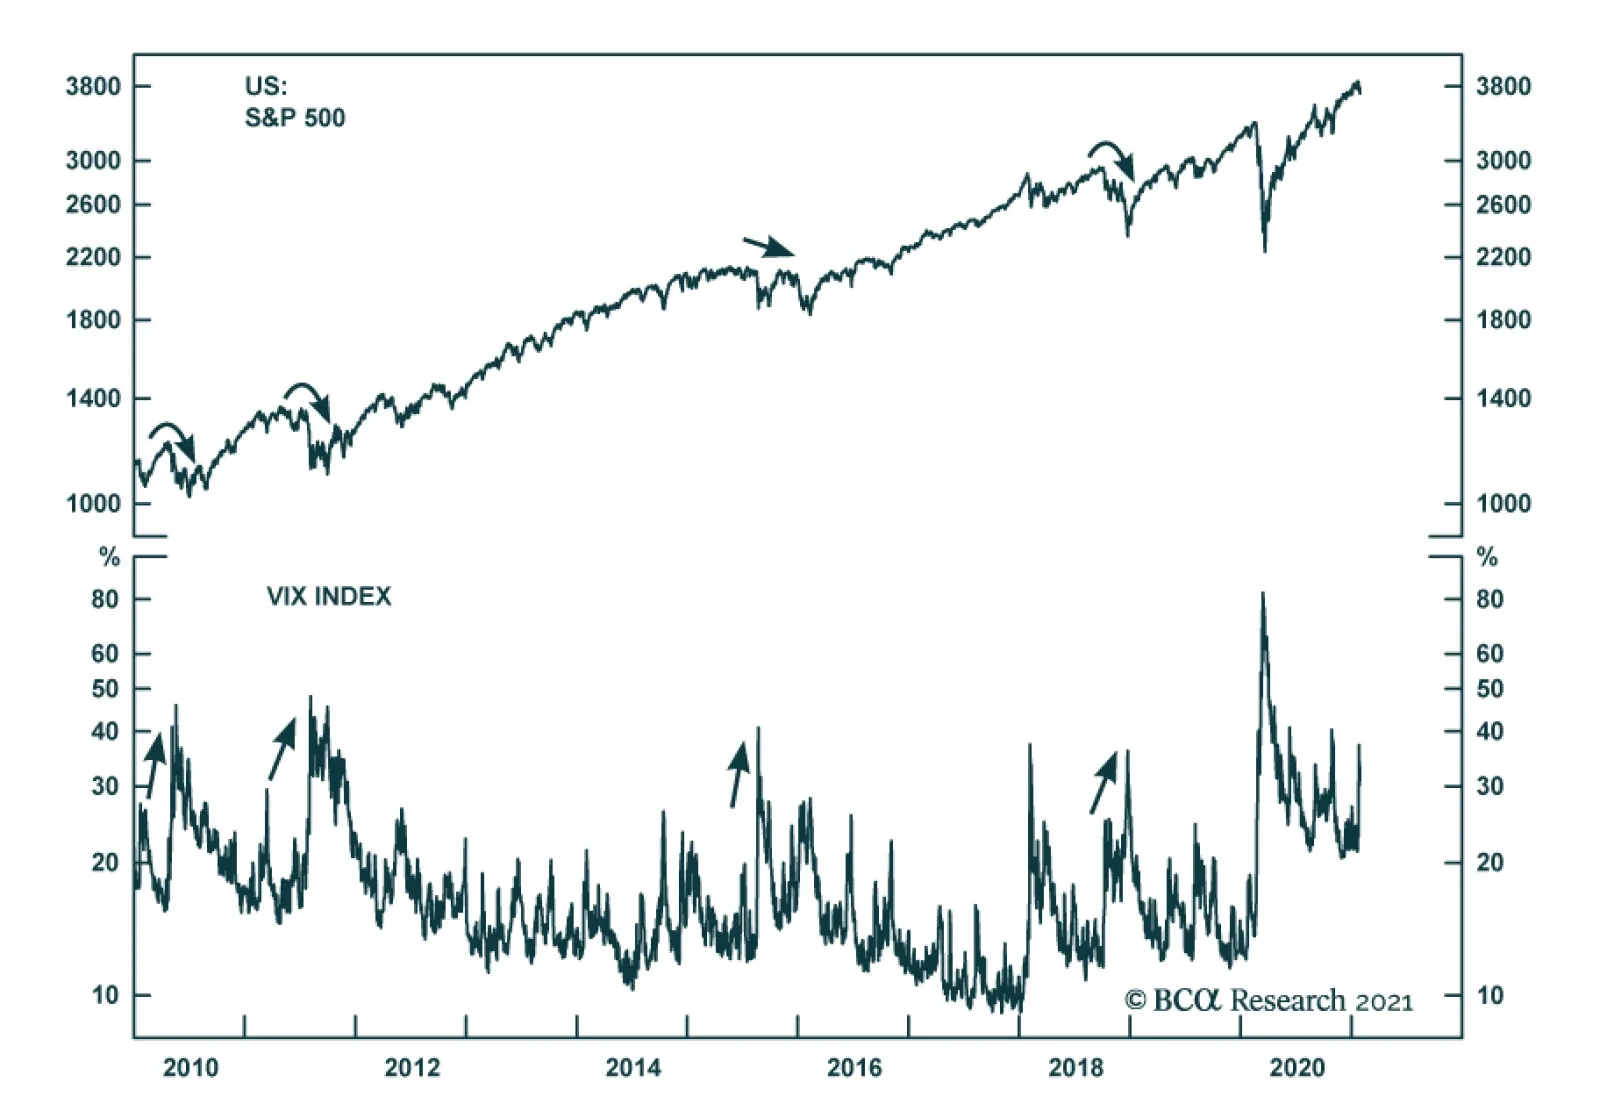
BCA Research’s US Equity Strategy service recommends that investors hold VIX June futures as a hedge to long equity exposure. Since December 2008, when the Fed first hit the zero lower bound and had commenced an unorthodox monetary policy experiment…
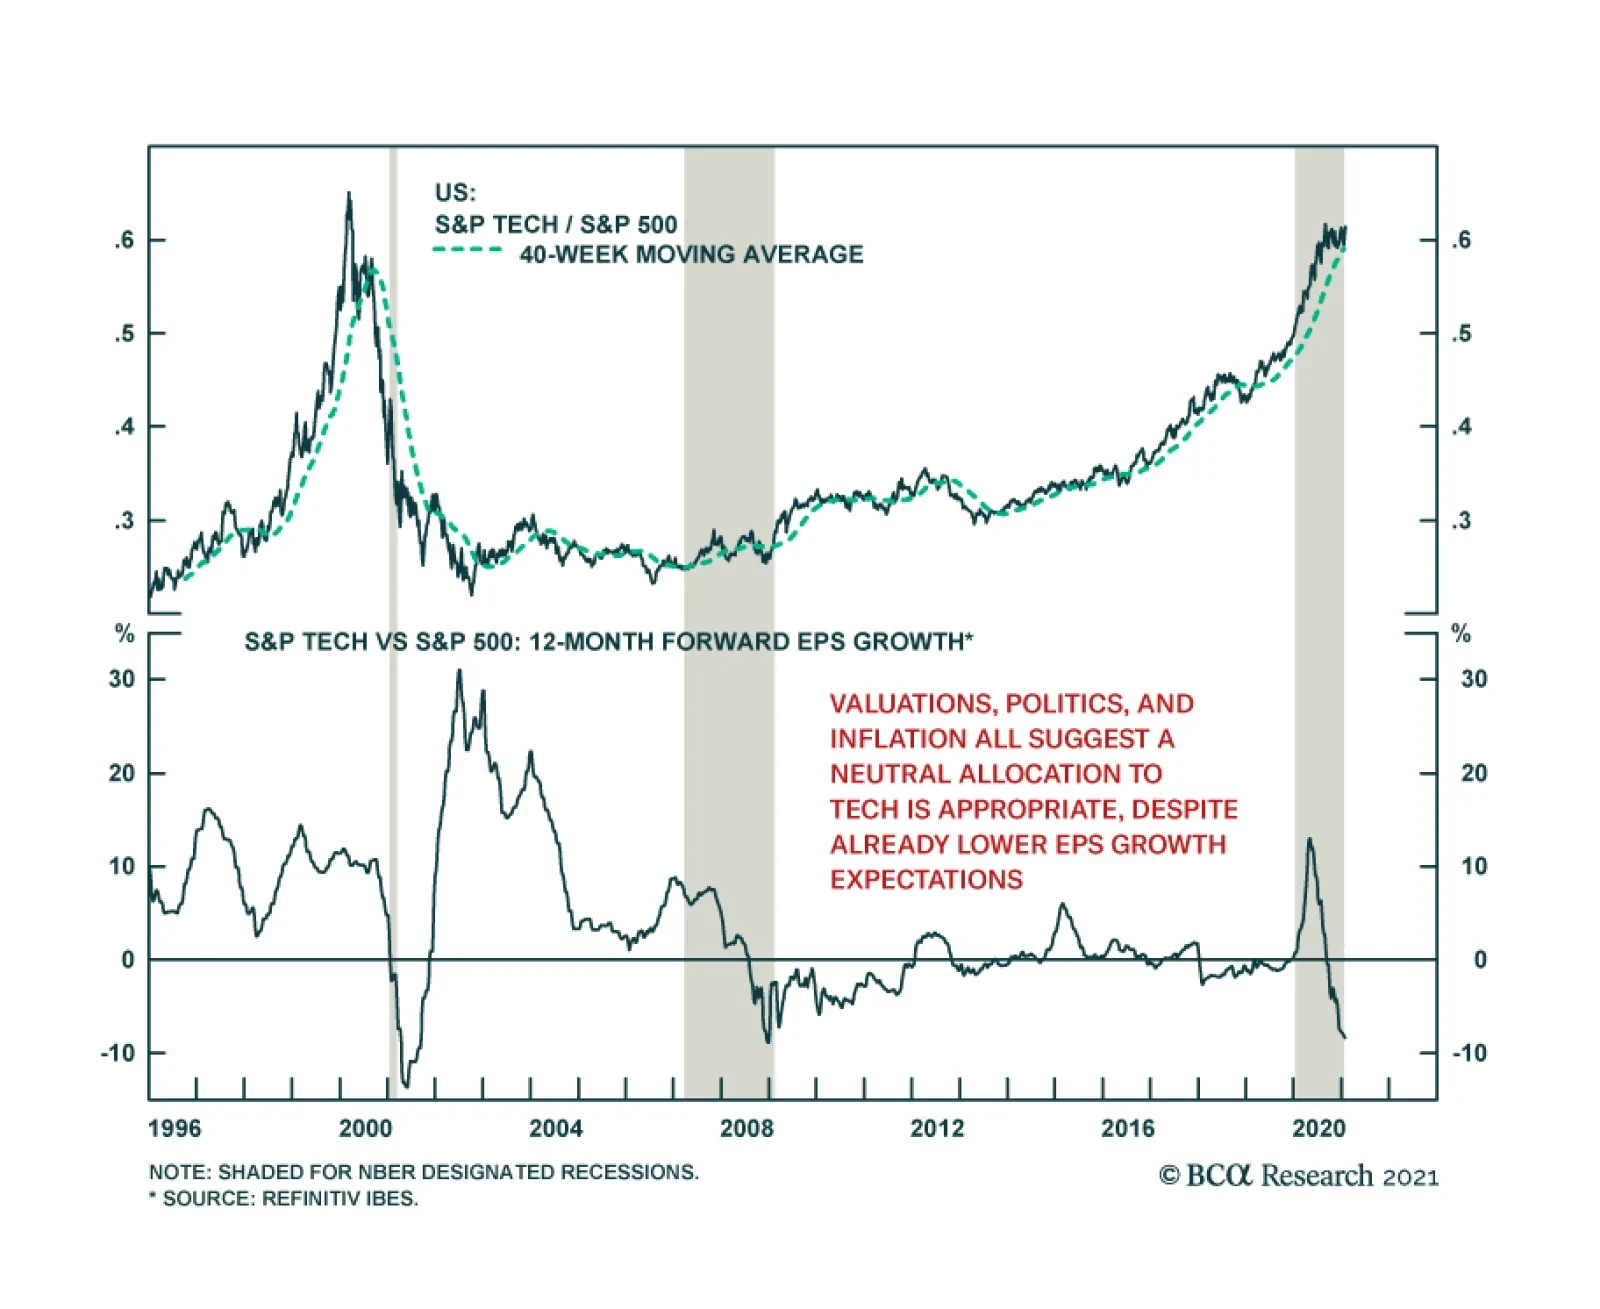
Major tech firms reported a series of excellent results last week, with top constituents Apple, Microsoft, Visa and Mastercard surpassing expectations. This begs whether the tech sector is set to resume its outperformance versus the S&P 500. We think not.…
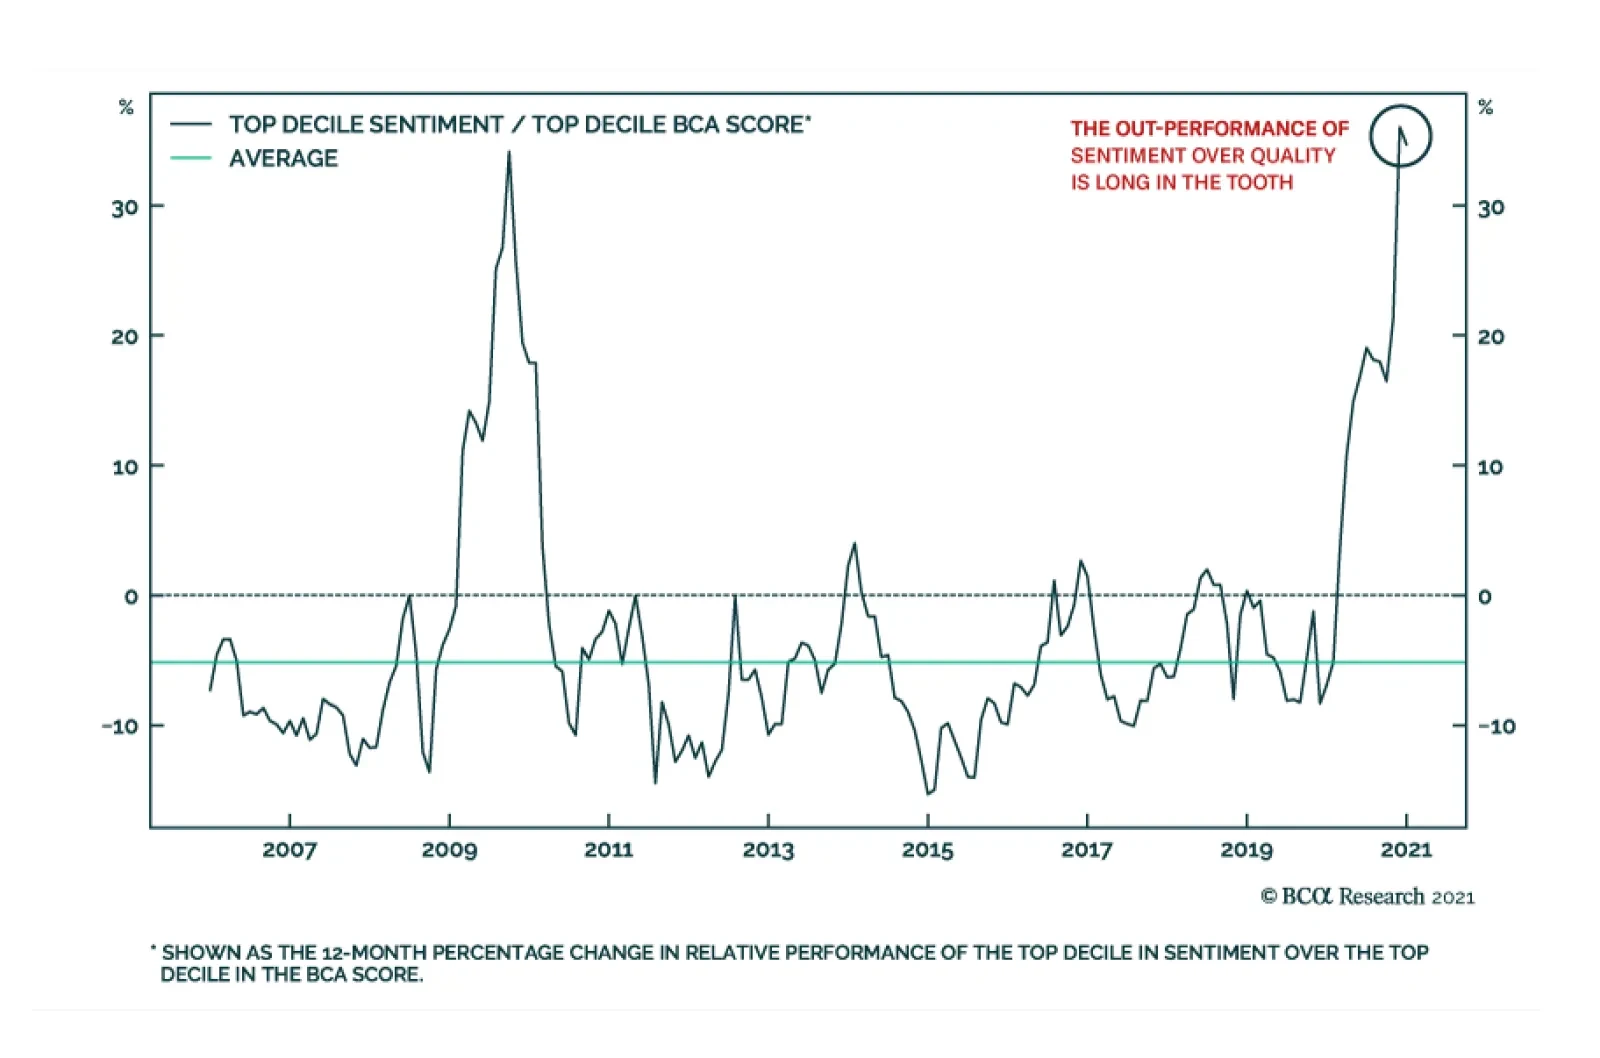
We can use the BCA Research Equity Analyzer (EA) to evaluate the role of sentiment in the current frenzy absorbing certain corners of the market. Today, sentiment is the best performing factor in the model and has generated an outperformance of 36% on an…
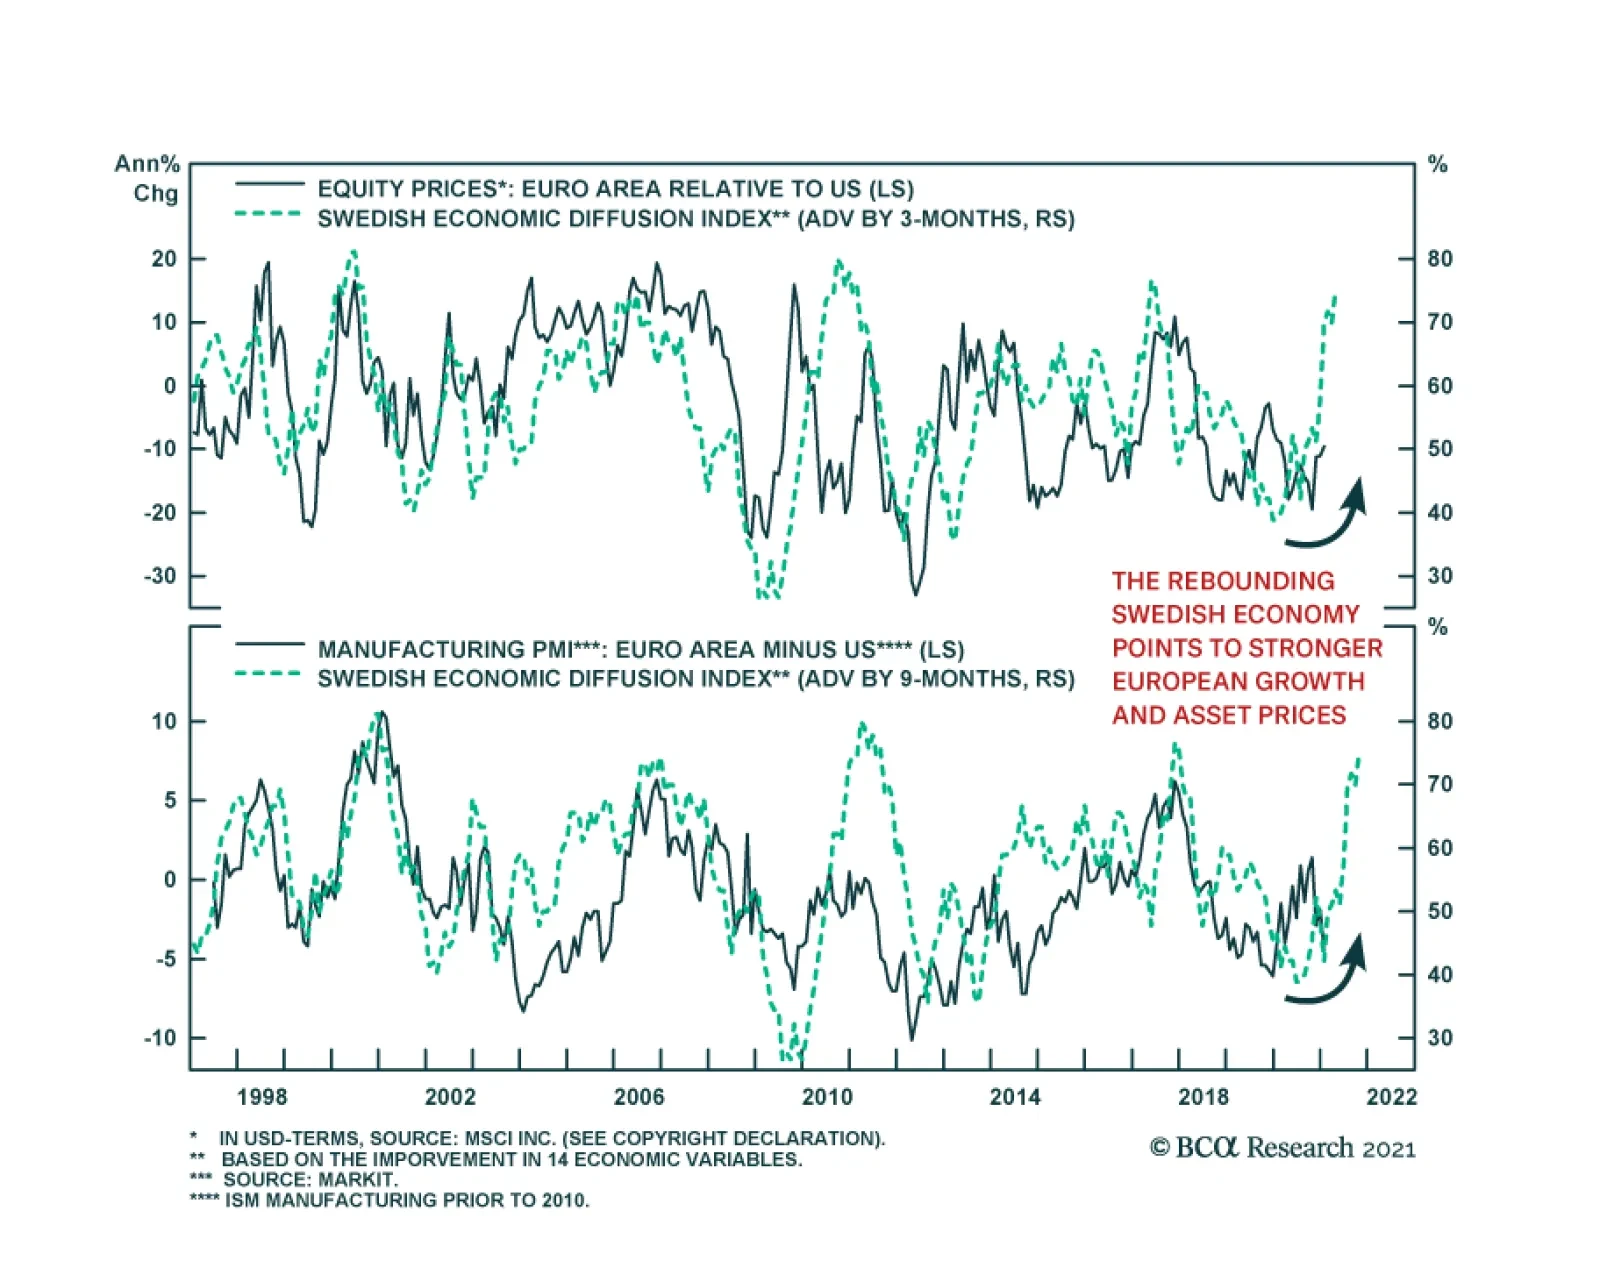
Sweden has a small open economy that specializes in the exports of intermediate industrial goods. This property not only makes Sweden extremely sensitive to the global business cycle, but also, Sweden is among the first advanced economies to respond to pick…
Highlights US-China tensions are escalating over the Taiwan Strait as Beijing tests the new Biden administration, yet financial markets are flying high and unprepared for a resumption of structurally elevated geopolitical risk. US restrictions on Chinese tech and arms sales, US internal political divisions, Taiwanese independence activists, China’s power grab in Hong Kong, and aggressive foreign policy from Xi Jinping create what could become a perfect storm. The rattling of sabers can escalate further as a “fourth Taiwan Strait crisis” has been a long time coming – though “gun to head” we do not think China’s civilian leadership is ready to initiate a war over Taiwan. Biden’s shift to a more defensive US strategy on tech offers Beijing the far less risky alternative of continuing its current (very successful) long game. We are closing most of our risk-on, cyclical trades and shifting to a neutral position until we can get a better read on how far the crisis will escalate. Maintain hedges and safe-haven trades: gold, yen, health stocks, an Indian overweight in EM, and defense stocks relative to others. Feature President Joe Biden faces his first crisis as the US and China rattle sabers over the Taiwan Strait. The crisis does not come at a surprise to watchers of geopolitics but it could produce further negative surprises for financial markets that are just starting to take note of it. This premier geopolitical risk combined with vaccine rollout problems, weak economic data releases, and signs of froth sent global equities down 2% over the past five days. The US 10-year Treasury yield fell to 1%, the USD-CNY rose by 0.03%, gold fell by 0.6%, and copper fell by 2%. As things stand today, we are prepared to buy on the dip but we are closing most of our long bets and positioning for a big dip now that our premier geopolitical risk in the Taiwan Strait shows signs of materializing. A series of Chinese air force drills have cut across the far southwestern corner of Taiwan’s Air Defense Identification Zone (ADIZ) over the past week, giving alarm to the Taiwanese military (Map 1). Beijing is sending a clear warning to the Biden administration that Taiwan is its “red line” – namely Taiwanese independence but also Beijing’s access to Taiwanese-made semiconductors. There is not yet a clear signal that China is about to attack or invade Taiwan but an attack is possible. Investors should not underrate the significance of a show of force over Taiwan at this juncture. Map 1Flight Paths Of People’s Liberation Army Aircraft, January 24, 2021
Is The Taiwan Strait Crisis Here? – A GeoRisk Update
Is The Taiwan Strait Crisis Here? – A GeoRisk Update
Chart 1Global Trade Troubles
Global Trade Troubles
Global Trade Troubles
We are also taking this opportunity to book a 37% gain on our long US energy trade. Global politics are fundamentally anarchic in the context of the US’s relative geopolitical decline, and internal divisions and distractions, and the simultaneous economic shocks that have knocked global trade off course (Chart 1), jeopardizing the newfound success and stability of the ambitious emerging market challengers to the United States. Geopolitical Risk Is Back (Already) Chart 2US And China Lead Global Growth Recovery
US And China Lead Global Growth Recovery
US And China Lead Global Growth Recovery
The US and China have snapped back more rapidly than other economies from the COVID-19 pandemic despite their entirely different experiences (Chart 2). The virus erupted in China but its draconian lockdowns halted the outbreak while it unleashed a wave of monetary and fiscal stimulus to reboot the economy. The US showed itself unwilling and unable to maintain strict lockdowns, leaving its economy freer to operate, and yet also unleashed a wave of stimulus. The US stimulus is the biggest in the world yet China’s is underrated in Chart 3 due to its reliance on quasi-fiscal credit expansion, which amounted to 8.5% of GDP. That goes on top of the 5.6% of GDP fiscal expansion shown here. For most of the past year financial markets have priced the positive side of this stimulus – the fact that it prevented larger layoffs, bankruptcies, and defaults and launched a new economic cycle. Going forward they will face the negative side, which includes financial instability and foreign policy assertiveness. Countries that are domestically unstable yet fueled by government spending can take risks that they would not otherwise take if their economy depended on private or foreign sentiment. The checks and balances that prevent conflict during normal times have been reduced. Chart 3US Leads Stimulus Blowout This Time, Though China Stimulus Larger Than Appears
Is The Taiwan Strait Crisis Here? – A GeoRisk Update
Is The Taiwan Strait Crisis Here? – A GeoRisk Update
Global economic policy uncertainty has fallen from recent peaks around the world but it remains elevated in the US, China, and Russia, which are engaged in a great power struggle that will continue in the coming years (Chart 4). This struggle has escalated with each new crisis point, from 2001 to 2008 to 2015 to 2020, and shows no sign of abating in 2021. Chart 4APolicy Uncertainty Still Rising Here ...
Policy Uncertainty Still Rising Here ...
Policy Uncertainty Still Rising Here ...
Chart 4B... And Can Easily Revive Here
... And Can Easily Revive Here
... And Can Easily Revive Here
Chart 5Terrorism Falling In World Ex-US (For Now)
Terrorism Falling In World Ex-US (For Now)
Terrorism Falling In World Ex-US (For Now)
Europe, the UK, Australia, and various emerging markets will suffer spillover effects from this geopolitical struggle as well as from their own domestic turmoil in the wake of the global recession. Immigration and terrorism have dropped off in recent years but will revive in the Middle East and elsewhere when the aftershocks of the global crisis lead to new state failures, weakened governments, and militant extremism (Chart 5). In many countries, domestic political risks appear contained today but the reality is that social unrest and political opposition will mount over time if unemployment is not dealt with and inflation starts to climb. These two factors combine form the “Misery Index,” a useful indicator of socio-political discontent. India, Russia, Brazil, Turkey, South Africa, Mexico, and Indonesia are just a few of the major emerging markets that face high or rising misery indexes and hence persistent forces for political change (Chart 6). Chart 6AMore Social And Political Unrest To Come
More Social And Political Unrest To Come
More Social And Political Unrest To Come
Chart 6BMore Social And Political Unrest To Come
More Social And Political Unrest To Come
More Social And Political Unrest To Come
So far there have not been many changes in government – the US is the major exception. But change will accelerate from here. It is not hard to see that weakening popular support for national leaders and their ruling coalitions will result in more snap elections, election upsets, and surprise events in the coming months and years (Chart 7). Chart 7Changing Of The Guard Under Way In Global Politics
Is The Taiwan Strait Crisis Here? – A GeoRisk Update
Is The Taiwan Strait Crisis Here? – A GeoRisk Update
Chart 8Italian Elections Heighten Sovereign Spread
Italian Elections Heighten Sovereign Spread
Italian Elections Heighten Sovereign Spread
For example, Italian voters likely face an early election even though Prime Minister Giuseppe Conte saw some of the best opinion polling of any first-world leader since COVID emerged. Last year we identified Italy as a leading candidate for an early snap election and we still maintain that an election is the likeliest outcome of the crumbling ruling coalition. The pandemic has created havoc in the country and now the ruling parties want to take advantage of the situation to strengthen their hand in distributing the $254 billion in European recovery funds destined for Italy. A new electoral law was passed in the fall, enabling an election to go forward, and the leading parties all hope to have control of parliament when the next presidential election occurs in early 2022, since the president is a key player in government and cabinet formation. Political risk is therefore set to increase and boost the risk premium in Italian bonds, producing a counter-trend spread widening for the coming 12 months or so (Chart 8). Anti-establishment right-wing parties, which taken together lead in public opinion, threaten to blow out the Italian budget. It is not a foregone conclusion that they will prevail – and these parties have moderated their rhetoric on the euro and monetary union – but it is an understated risk at present and has some staying power, even if moderate by the standards of geopolitical risks in other regions. Russia also faces rising political and geopolitical risk in the aftermath of the pandemic, which has had an outsized effect on a population that is disproportionately old and unhealthy (Chart 9). Moscow is now witnessing the most serious outpouring of government opposition since 2011 despite the fact that its cyclical economic conditions are not the worst among the emerging markets. The economic recovery is likely to be stunted by the new US administration’s efforts to extend and expand sanctions and any geopolitical conflicts that ensue. We remain negative on Russian equities as we have for the past two years and look at other emerging market oil plays as offering the same value without the geopolitical risk (Chart 10). Chart 9Russian Social Unrest Aggravated By Pandemic
Is The Taiwan Strait Crisis Here? – A GeoRisk Update
Is The Taiwan Strait Crisis Here? – A GeoRisk Update
Chart 10Russian Equities Face Persistent Geopolitical Risk
Russian Equities Face Persistent Geopolitical Risk
Russian Equities Face Persistent Geopolitical Risk
Investors do not need to care about social unrest in itself but do need to pay attention when it leads to a change in government or the overall policy setting. This is what we will monitor for the countries highlighted in these charts as being especially at risk. Italy and Spain are the most likely to see government change in the developed world, though we should note that however stable Germany’s ruling Christian Democrats appear as Chancellor Angela Merkel steps down, there could still be an upset this fall (Chart 11). France’s Emmanuel Macron is still positioned for re-election next year but his legislative control is clearly in jeopardy – and it is at least worth noting that the right-wing anti-establishment leader Marine Le Pen has started to move up in the polls for the first time since 2017, even though she has a very low chance of actually taking power (Chart 12). Chart 11German Election Not A Foregone Conclusion
German Election Not A Foregone Conclusion
German Election Not A Foregone Conclusion
Chart 12Signs Of Life For Marine Le Pen?
Signs Of Life For Marine Le Pen?
Signs Of Life For Marine Le Pen?
Chart 13UK Now Turns To Keeping Scotland
UK Now Turns To Keeping Scotland
UK Now Turns To Keeping Scotland
Even the UK, which has found the “middle way” solution to the Brexit imbroglio, in true British form, faces a significant increase in political risk beginning with local elections in May. If these produce a resounding victory for the Scottish National Party then it will interpret the vote as a mandate to pursue a second independence referendum, which will be a narrow affair even if Prime Minister Boris Johnson is tentatively favored to head it off (Chart 13). Bottom Line: Financial markets have been preoccupied with the pandemic and global stimulus. But now political and geopolitical risks are underrated once again. They are starting to rear their heads, not only in the US-China-Russia power struggle but also in the domestic politics of countries that face high policy uncertainty and high or rising misery indexes. Biden And Xi Bound To Collide It is too soon to identify the “Biden Doctrine” in American foreign policy, as the new president has not yet taken significant action, but the all-too-predictable showdown in the Taiwan Strait could provide the occasion. Since the fall of 2019 we have warned that US-China great power competition would intensify despite any “phase one” trade deal. President Trump undertook a flurry of significant punitive measures on China during his lame duck months in office and now Beijing is pressuring the Biden administration to reverse these measures or at least call a halt to them. The fundamental premise of Biden’s campaign against President Trump was that he would restore America’s active role in international affairs against the supposed isolationism of Trump. Of course, the fact that the Democrats gained full control of Congress means that Biden will not be restricted to foreign policy over his four-year term but will be consumed with trying to cut deals on Capitol Hill to pass his domestic agenda. Nevertheless Biden’s foreign policy schedule is already packed as he is rattling sabers with China, issuing warnings to Russian President Vladimir Putin, and cutting off arms sales to Saudi Arabia and the UAE to signal that he intends to reformulate the Iranian nuclear deal. Americans broadly favor an active role in the world, which is clear from opinion polling in the wake of Trump’s challenge to the status quo – they are weary of wars in the Middle East but are not showing appetite for a broader withdrawal from global affairs (Chart 14). Similarly polling on global trade shows that Trump, if anything, roused the public’s support for trade despite French or Japanese levels of skepticism about it. Chart 14Americans Still Favor Global Engagement
Americans Still Favor Global Engagement
Americans Still Favor Global Engagement
The implication is that the US budget deficit will remain larger for longer and that the US trade deficit will balloon amidst a surge in domestic demand. Trump’s attempt to shrink trade deficits without shrinking the budget deficit (or overall demand) proved economically impossible. Chart 15Biden And The US Role In The World
Biden And The US Role In The World
Biden And The US Role In The World
The Biden administration is opting for expanding the twin deficits albeit at a much greater risk to the dollar’s value. Markets have already discounted this shift to the point that the dollar is experiencing a bounce from having reached oversold levels. The bounce will continue but it is against the grain, the fall will resume later, as indicated by these policies. Another implication is that defense spending will not fall much due to the geopolitical pressures facing the Biden administration. Non-defense spending will go up but defense spending will remain at least flat as a share of overall output (Chart 15). With this policy setting in the US, policy developments in China made it inevitable that US-China strategic tensions would resume where Trump left off despite Biden’s campaign platform of de-emphasizing the China threat. In the long run, Biden’s push for renewed engagement with China runs up against the fact that Beijing’s overarching political and economic strategy is focused on import substitution and technological acquisition, as outlined in the fourteenth five-year plan. China’s share of global exports has grown even larger despite the pandemic and yet China is weaning itself off of global imports in pursuit of strategic self-sufficiency. The US will be left with less global export share, less market access in China, and ongoing dependency on trade surplus nations to buy its debt (Chart 16). Unless, that is, the Biden administration engages in very robust diplomacy and is willing to take geopolitical risks not unlike those that Trump took. Chart 16China's Role In The World Motivates Opposition
China's Role In The World Motivates Opposition
China's Role In The World Motivates Opposition
Chart 17China Plays Are Getting Stretched
China Plays Are Getting Stretched
China Plays Are Getting Stretched
One of the clear takeaways from the above is that industrial metals and China plays, like the Australian dollar and Swedish equities, are facing a pullback. Though Chinese policymakers will ultimately accommodate the economy, the combination of a domestic policy tug-of-war and a renewal of US-China tensions will take the air out of these recent outperformers (Chart 17). Bottom Line: The Biden administration faces a resumption in strategic tensions with China. First, the immediate crisis over the Taiwan Strait can escalate from here (see below). Second, the US-China economic conflict is set to escalate over the long run with the US pursuing an unsustainable policy of maximum reflation while China turns away from the liberal “reform and opening” agenda that enabled positive US-China ties since 1979. This combination points to a large increase in the US trade dependency on China even as China grows more independent of the US and technologically capable. This result ensures that tensions will persist over the long run. Is The Fourth Taiwan Strait Crisis Already Here? Biden may be forced into significant foreign policy action right away in the Taiwan Strait, where General Secretary Xi Jinping has put his fledgling administration to the test. Over the past week Beijing has sent a large squadron of nuclear-capable bombers and fighter jets to cut across the far southwest corner of Taiwan’s Air Defense Identification Zone (Map 2). This activity is a continuation of an upgraded tempo of military drills around the island, including a flight across the median line last year, and follows an alleged army build-up across from the island last year.1 The US for its part has upgraded its freedom of navigation operations over the past several years, including in the Taiwan Strait (though not yet putting an aircraft carrier group into the strait as in the 1990s). Map 2Flight Paths Of People’s Liberation Army Aircraft, January 25-28, 2021
Is The Taiwan Strait Crisis Here? – A GeoRisk Update
Is The Taiwan Strait Crisis Here? – A GeoRisk Update
In response to China’s sorties on January 23, the US State Department urged the People’s Republic to stop “attempts to intimidate its neighbors, including Taiwan,” called for mainland dialogue with Taiwan’s “elected representatives” (albeit not naming anyone), declared that the US would deepen ties with Taiwan, and pledged a “rock-solid” commitment to the island. Not coincidentally the USS Roosevelt aircraft carrier arrived in the South China Sea on the same day as China’s largest sortie, January 24. Meanwhile a Chinese government spokesman said the military drills should be seen as a “solemn warning” to the Biden administration that China will reunify the island by force if necessary. China is not only concerned about Taiwanese secession and US-Taiwan defense relations, as always, but is specifically concerned that the Biden administration will persist with the technological “blockade” that the Trump administration imposed on Huawei, Semiconductor Manufacturing International Corporation (SMIC), their suppliers, and a range of other Chinese state-owned enterprises and tech firms. Neither the US nor Chinese statements have yet made a definitive break with the longstanding policy framework on Taiwan that first enabled US-China détente and engagement. The US State Department reiterated its commitment to the diplomatic documents that frame the relationship with the People’s Republic and the Republic of China, namely the Three Communiques, the Taiwan Relations Act, and the Six Assurances. It did not make explicit mention of the One China Policy although the US version of that policy is incorporated in the first of the three communiques (the 1972 Shanghai Communique). However, China may not be appeased by this statement. Xi Jinping has gradually shifted the language in major Communist Party policy statements over the past several years to indicate a greater willingness to use force against Taiwan, even suggesting that he envisions the reunification of China by 2035.2 The Trump administration’s offensives have accelerated this security dilemma. In addition to export controls on high tech, Trump signed several significant bills on Taiwan into law over the course of his term that aim to upgrade the relationship. These include the Taiwan Assurance Act of 2020 at the end of last year, which calls for deeper US-Taiwan relations, greater Taiwanese involvement in international institutions, larger US arms sales to support Taiwan’s defense strategy, and more diplomatic exchanges.3 Separately, the US and Taiwan also signed a science-and-technology cooperation agreement on December 15 and the Biden administration is interested in negotiating a free trade agreement.4 A few additional points: The struggle over access to Taiwan’s state-of-the-art semiconductor production continues to escalate. The Trump administration concluded its tenure by cutting off American exports of chips, parts, designs, and knowhow to Chinese telecom giant Huawei, thus putting Taiwan Semiconductor Manufacturing Company (TSMC) into the position of having to halt sales of certain goods to the mainland. TSMC accounts for one-fifth of global semiconductor capacity and produces the smallest, fastest, and most efficient chips. China’s SMIC has been hamstrung by these controls as well as Huawei and other Chinese tech champions. This issue remains unresolved and is the primary immediate driver of conflict between the US and China since both economies would suffer if semiconductor supplies were severed. The US’s capability of imposing a tech blockade on China threatens its long-term productivity and hence potentially regime survival, while China’s capability of attacking Taiwan threatens the critical supply lines of the US and its northeast Asian allies, including essential computer chips for US military needs (the main reason the US has tried to strong-arm TSMC into building a fabrication plant in Arizona).5 US arms sales en route to Taiwan. While there are rumors that the Biden administration will delay these sales, the Taiwanese government claims they have been assured that the transfers will go forward. This arms package does not include the most provocative weapons systems, such as F-35 fighter jets, but it does contain advanced weapons systems and weapons that can be seen as offensive rather than defensive. These include truck-mounted rocket launchers, precision strike missiles, 66 F-16 fighter jets, Harpoon anti-ship missiles, subsea mines, and advanced drones. So it is possible that Beijing will put its foot down to prevent the transfer, just as it tried to halt the less-sensitive transfer of THAAD missiles to South Korea during the last US presidential transition. If this should be the case then it will cause a major escalation in tensions until the US either halts the arms transfer or completes it – and completing the transfer, if China issues an ultimatum, will lead to conflict. Growth of “secessionist forces” in Taiwan. Chinese media have specifically cited a political “alliance” that formed on January 24 and aims to revise the island’s democratic constitution. The Taiwanese public no longer sees itself primarily as Chinese but as Taiwanese and is increasingly opposed to eventual reunification. What is the end-game? First, as stated, the current escalation in tensions can go much further in the coming weeks and months. We are not prepared to sound the “all clear” as a confrontation has been building for years and could conceivably amount to Cuban Missile Crisis proportions, which would likely trigger a bear market. Second, we do not yet see China staging a full-scale attack or invasion on Taiwan. China’s goal is to continue expanding its economy and technology, its economic heft in Asia and the world, and thus its global influence and military power. It cannot achieve this goal if it is utterly severed from Taiwan, but it also cannot achieve this goal if it precipitates a war with not only Taiwan but also the US, Japan, other US allies, and a devastation of the very semiconductor foundries upon which Taiwan’s critical importance stands. Playing the long game of growing its economy and taking incremental steps of imposing its political supremacy has paid off so far, including in Hong Kong and the South China Sea. Both Russia’s and China’s gradual slices of regional power have demonstrated that the US does not have the appetite, focus, and resolve to fight small wars at present – whereas Washington is untested on its commitment to major wars such as an invasion of Taiwan would precipitate. At very least China needs to determine whether the Biden administration intends to impose a technological blockade, as the Trump administration looked to do. Biden has so far outlined a “defensive game” of securing US networks, preventing US trade in dual-use technologies that strengthen China’s military, on-shoring semiconductor production, and accelerating US research and development. This leaves open the possibility of issuing waivers for trade in US-made or US-designed items that do not have military purposes, albeit with the US retaining the possibility of removing the waivers if China does not reciprocate. This strategy amounts to what Biden’s “Asia Tsar,” Kurt Campbell, has called “stable competition.” Therefore the earliest indications from the Biden administration suggest that it will seek a lowering of temperature while defending the US’s red lines – and this should prevent a full-scale Taiwan war in the short run, though it does not prevent a major diplomatic crisis at any time. If Biden does in fact pursue this more accommodative approach, and seeks to reengage China, then that Beijing has a much lower-cost strategy that is immediately available, as opposed to an all-or-nothing gambit to stage the largest amphibious assault since D-Day, which is by no means assured to succeed and could in the worst case provoke a nuclear war. This strategy includes negotiating waivers on US tech restrictions, accelerating its high-tech import substitution strategy, and continuing to poach the talent from Taiwan and steal the technology needed to circumvent US restrictions. As long as Washington does not make a dash for a total blockade, Beijing should be expected to pursue this alternate strategy. Investment Takeaways The market is not priced for a serious escalation in US-China-Taiwan tensions. If there is a 17% chance of a 30%-40% drawdown in equities on jitters over a major war, then equities should suffer a full 7%+ correction to discount the possibility. While the prospects of full-scale war are much lower, at say 5%, these odds could escalate rapidly if the two sides fail to mitigate a diplomatic or military crisis through red telephone communications. Chart 18China/Taiwan Policy Uncertainty Will Converge To Upside
China/Taiwan Policy Uncertainty Will Converge To Upside
China/Taiwan Policy Uncertainty Will Converge To Upside
While Chinese policy uncertainty remains elevated, it still has plenty of room to rise. It has diverged unsustainably from Taiwanese uncertainty, which only recently showed signs of ticking up in response to manifest strategic dangers. This gap will converge to the upside as US-China tensions persist and the global news media gradually turns its spotlight away from Donald Trump, alerting financial markets to the persistence of the world’s single most important geopolitical risk right under their nose (Chart 18). Inverting our market-based Geopolitical Risk Indicators, so that falling risk is shown as a rising green line, it becomes apparent that Chinese equities and Taiwanese equities have gone vertical, have only started to correct, and are highly exposed to exogenous events stemming from their fundamentally unstable political relationship. Hong Kong stocks, by contrast, have performed in line with the market’s perception of their political risk, so that there is less discrepancy between market sentiment and reality – even though they will also sell off in the event that this week’s events escalate into a larger confrontation (Chart 19). Chart 19Geopolitical Risks Lurking In Asian Equities
Geopolitical Risks Lurking In Asian Equities
Geopolitical Risks Lurking In Asian Equities
Chart 20Stay Long Korea / Short Taiwan Due To Geopolitical Risk
Stay Long Korea / Short Taiwan Due To Geopolitical Risk
Stay Long Korea / Short Taiwan Due To Geopolitical Risk
South Korean stocks were also overstretched and due for correction. We have long advocated a pair trade favoring Korean over Taiwanese stocks to capture the relative geopolitical risk as well as more favorable valuations in Korea (Chart 20). The ingredients for a fourth Taiwan Strait crisis are all present. This week’s showdown could escalate further. Global and East Asian equities are overbought and vulnerable to a larger correction, especially Taiwanese stocks. US equities are also sky-high and vulnerable to a larger correction, although they would be favored relative to the rest of the world in the event of a full-fledged crisis. Chart 21Geopolitical Flare-Up Would Upset This Trend
Geopolitical Flare-Up Would Upset This Trend
Geopolitical Flare-Up Would Upset This Trend
We maintain our various geopolitical longs and hedges, including gold, Japanese yen, an Indian overweight within EM, and health stocks. We remain long global defense stocks as well. Because our base case is that the current crisis will not result in war, but rather high diplomatic tensions, we are inclined to buy on the dips. But we expect a big dip even in the event of a merely diplomatic crisis that involves no jets shot down or ships sunk. Therefore for now we are closing long municipal bonds versus Treasuries, long international stocks versus American, long GBP-EUR, long Trans-Pacific Partnership countries, and long value versus growth stocks. These trades should be reinitiated once we have clarity on the magnitude of the US-China crisis, given the extremely accommodative economic and policy backdrop, which will, if anything, become more accommodative if geopolitical risks materialize yet fall short of total war. Oil and copper would suffer relative to gold in the meantime (Chart 21). Our remaining strategic portfolio still favors stocks that would ultimately benefit from instability in Greater China, such as European industrials relative to global, Indian equities relative to Chinese, and South Korean equities relative to Taiwanese. While the spike in tensions reinforces our conclusion in last week’s report that long-dated Chinese government bonds should rally on Taiwan risk, this recommendation was made in the context of discussing domestic Chinese markets and is primarily intended for mainland investors or those with a mandate to invest in Chinese assets. Foreign investors could conceivably be exposed to sanctions or capital controls in the event of a major crisis – as we have long flagged is also a risk with foreign holders of Russian ruble-denominated bonds. We have made a note in our trade table accordingly. Matt Gertken Vice President Geopolitical Strategy mattg@bcaresearch.com Footnotes 1 Brad Lendon, "Almost 40 Chinese warplanes breach Taiwan Strait median line; Taiwan President calls it a 'threat of force,'" CNN, September 21, 2020, cnn.com. 2 Richard C. Bush, "8 key things to notice from Xi Jinping’s New Year speech on Taiwan," Brookings Institute, January 7, 2019, brookings.com. 3 Trump also signed the Taiwan Travel Act on March 16, 2018 and the Taiwan Allies International Protection and Enhancement Initiative Act on March 26, 2019. For the Taiwan Assurance Act, see Kelvin Chen, "Trump Signs Taiwan Assurance Act Into Law," Taiwan News, December 28, 2020, taiwannews.com. 4 Jason Pan, "Alliance formed to draft Taiwanese constitution," Taipei Times, January 24, 2021, taipeitimes.com; Emerson Lim and Matt Yu, "Taiwan, U.S. sign agreement on scientific cooperation," Focus Taiwan, December 18, 2020, focustaiwan.tw; Ryan Hass, "A case for optimism on US-Taiwan relations," Brookings Institute, November 30, 2020, brookings.com. 5 Thomas J. Shattuck, "Stuck in the Middle: Taiwan’s Semiconductor Industry, the U.S.-China Tech Fight, and Cross-Strait Stability," Foreign Policy Research Institute, Orbis (65:1) 2021, pp. 101-17, www.fpri.org. Section II: GeoRisk Indicators China
China: GeoRisk Indicator
China: GeoRisk Indicator
Russia
Russia: GeoRisk Indicator
Russia: GeoRisk Indicator
UK
UK: GeoRisk Indicator
UK: GeoRisk Indicator
Germany
Germany: GeoRisk Indicator
Germany: GeoRisk Indicator
France
France: GeoRisk Indicator
France: GeoRisk Indicator
Italy
Italy: GeoRisk Indicator
Italy: GeoRisk Indicator
Canada
Canada: GeoRisk Indicator
Canada: GeoRisk Indicator
Spain
Spain: GeoRisk Indicator
Spain: GeoRisk Indicator
Taiwan
Taiwan: GeoRisk Indicator
Taiwan: GeoRisk Indicator
Korea
Korea: GeoRisk Indicator
Korea: GeoRisk Indicator
Turkey
Turkey: GeoRisk Indicator
Turkey: GeoRisk Indicator
Brazil
Brazil: GeoRisk Indicator
Brazil: GeoRisk Indicator
Section III: Geopolitical Calendar
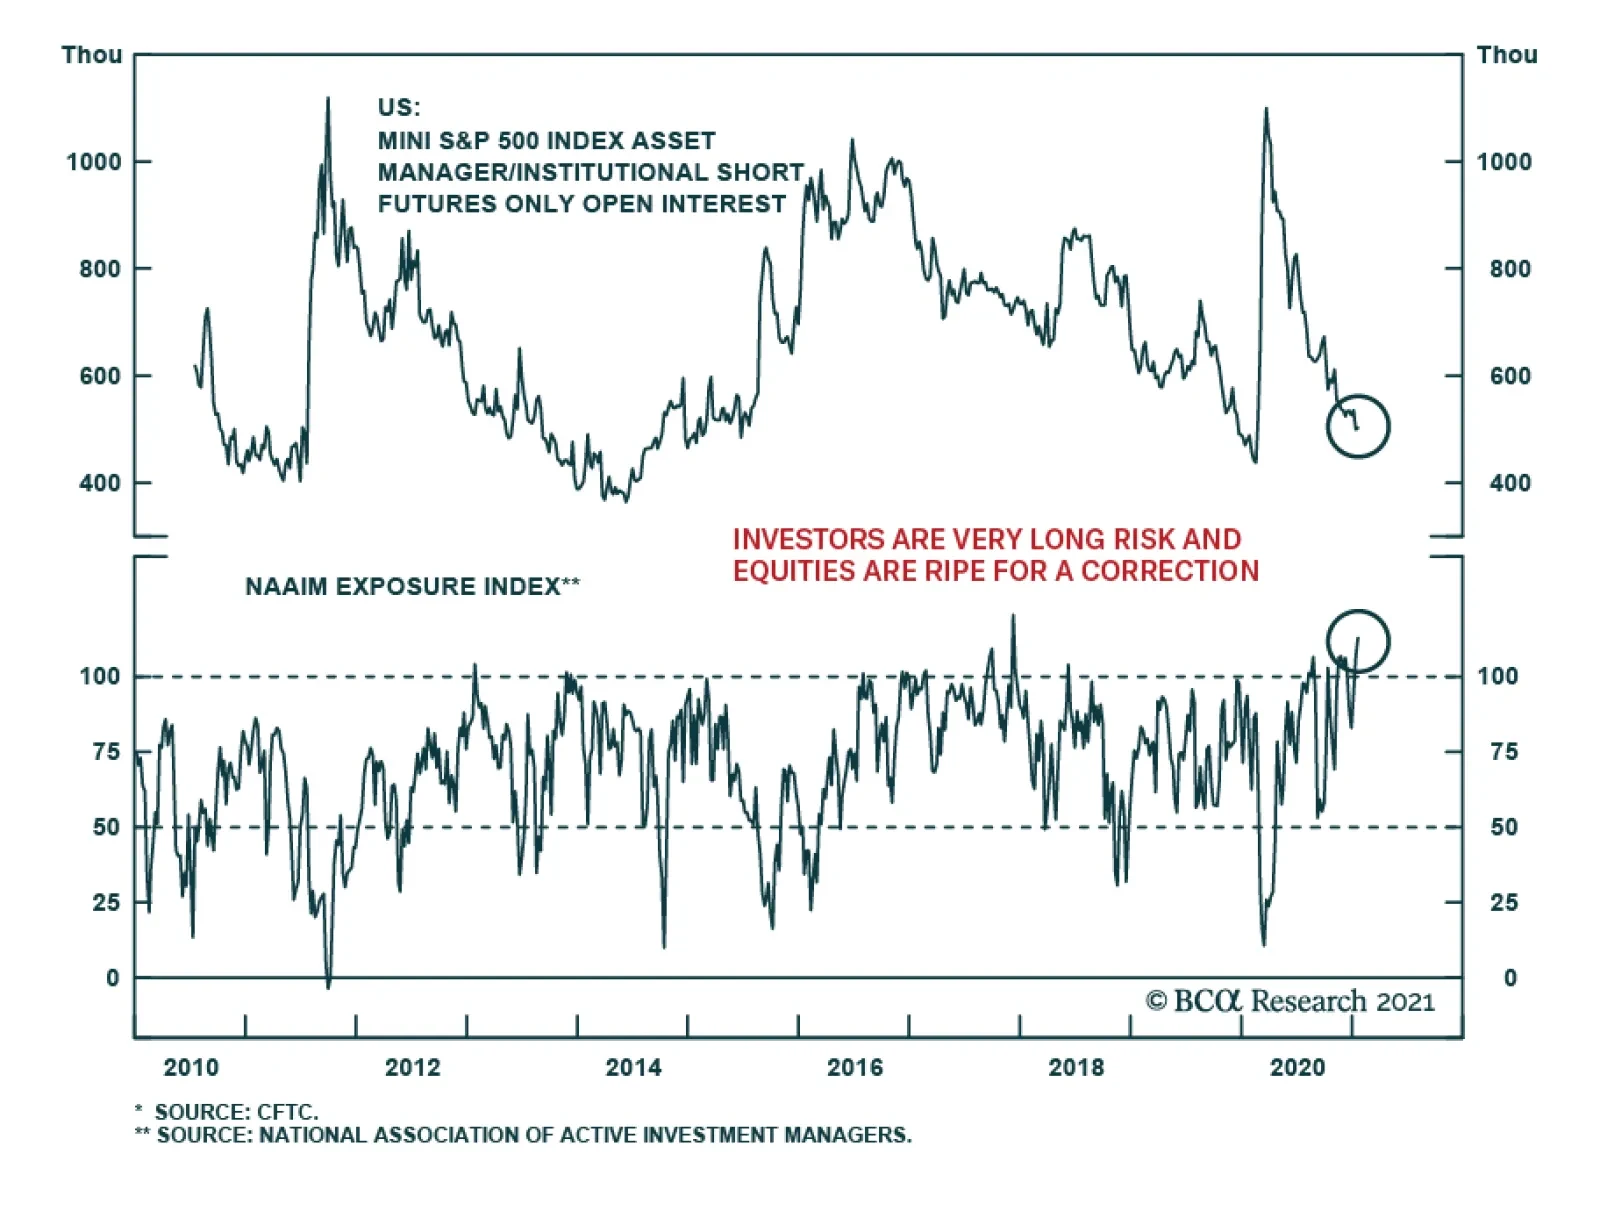
The dizzying gains attained over the past few days by the likes of GME, AMC and NAKD on the back of Reddit-engineered short squeezes have raised hopes of similar gains elsewhere. Instead, the message from market sentiment and positioning indicators is that…
BCA Research’s Emerging Markets Strategy service concludes that the enormous size of US stimulus and overflow of liquidity is creating a thrill akin to riding a tiger. Remarkably, this kind of jubilation is very similar to what EM experienced in 2009-10. That…
Highlights The enormous size of US stimulus and overflow of liquidity is creating a thrill akin to riding a tiger. Remarkably, this kind of jubilation is very similar to what EM experienced in 2009-10. That was followed by a lost decade for EM. The US equity and bond markets as well as the economy have grown accustomed to constant stimulus – an addiction that will be very hard to wean off. Due to recurring stimulus, the US will experience asset bubbles and inflation in the real economy. The Fed will fall behind the inflation curve. The resulting downward pressure on the US dollar in the coming years favors EM stocks and fixed-income markets over their US counterparts. Feature Policymakers worldwide and in the US in particular “are riding a tiger”. Congress is authorizing unlimited spending and the government is on a borrowing and spending spree. So far there are no constraints on the ballooning budget deficit. Government bond yields are well behaved. In turn, the Fed is printing limitless money to finance the Treasury and there have been no market or economic constrictions. Share prices are at a record high and credit spreads are very tight. The US dollar is depreciating but it is a benign adjustment for the US because the greenback had been too strong for too long. Chart 1EM's Soft-Budget Constraints In 2009-10 Were Followed By A Decade-Long Hangover
EM's Soft-Budget Constraints In 2009-10 Were Followed By A Decade-Long Hangover
EM's Soft-Budget Constraints In 2009-10 Were Followed By A Decade-Long Hangover
In brief, the enormous size of US stimulus and overflow of liquidity is creating a thrill akin to riding a tiger. Remarkably, this kind of jubilation is very similar to what EM experienced in 2009-10. At the BCA annual conference in New York in 2016, one of the invited speakers – a hedge fund manager – recounted that in 2010, in a private conversation with an investor, Brazilian President Lula da Silva likened ruling Brazil to driving a sports car at high speed in the city with no police around. These were prescient words to describe the situation in Brazil’s economy and financial markets in 2009-10. In 2009-10, Brazil – like many other developing countries – benefited from both the impact of China’s enormous stimulus on commodities prices as well as from foreign capital inflows in part triggered by the Fed’s QE program. In addition, its own government provided sizeable monetary and fiscal stimulus. This stimulus trifecta – emanating from China, the US and local authorities – produced a one-off economic boom and a cyclical bull market in Brazil and other EM countries. Yet, the exuberance was followed by a stagflationary period in Brazil, and later a depression and associated rolling bear markets. Brazil was a poster child for that EM era. The experience of other EM economies was similar and the performance of their financial markets was equally underwhelming. These economies, their leaders, and financial markets wholly enjoyed the stimulus of that period. What followed, however, was a drawn-out hangover that lasted many years: EM ex-China, Korea and Taiwan share prices have been flat for the past 10 years and their currencies were depreciating till last spring (Chart 1). China, the epicenter of epic stimulus in 2009-10, had a similar experience. Its investable ex-TMT stocks, i.e., excluding Alibaba, Tencent and Meituan, are presently at the same level as they were in 2010 (Chart 2). The underlying cause has been a collapse in listed companies’ return on assets (Chart 2, bottom panel). It is essential to emphasize that such poor Chinese equity market performance occurred despite recurring fiscal and credit stimulus from Chinese authorities since 2009 (Chart 2, top panel). As we discussed in detail in a previous report, soft-budget constraints – unlimited stimulus and liquidity overflow – led to complacency, inefficiencies and falling return on capital in EM/China. Chart 3 demonstrates that EM EPS (including China, Korea and Taiwan and their TMT companies) has been flat for 10 years and non-financial companies’ return on assets plunged during the past decade. Chart 2China: "Free Money" Undermined Corporate Efficiency And Profitability
China: "Free Money" Undermined Corporate Efficiency And Profitability
China: "Free Money" Undermined Corporate Efficiency And Profitability
Chart 3EM EPS And Return On Assets: The Lost Decade
EM EPS And Return On Assets: The Lost Decade
EM EPS And Return On Assets: The Lost Decade
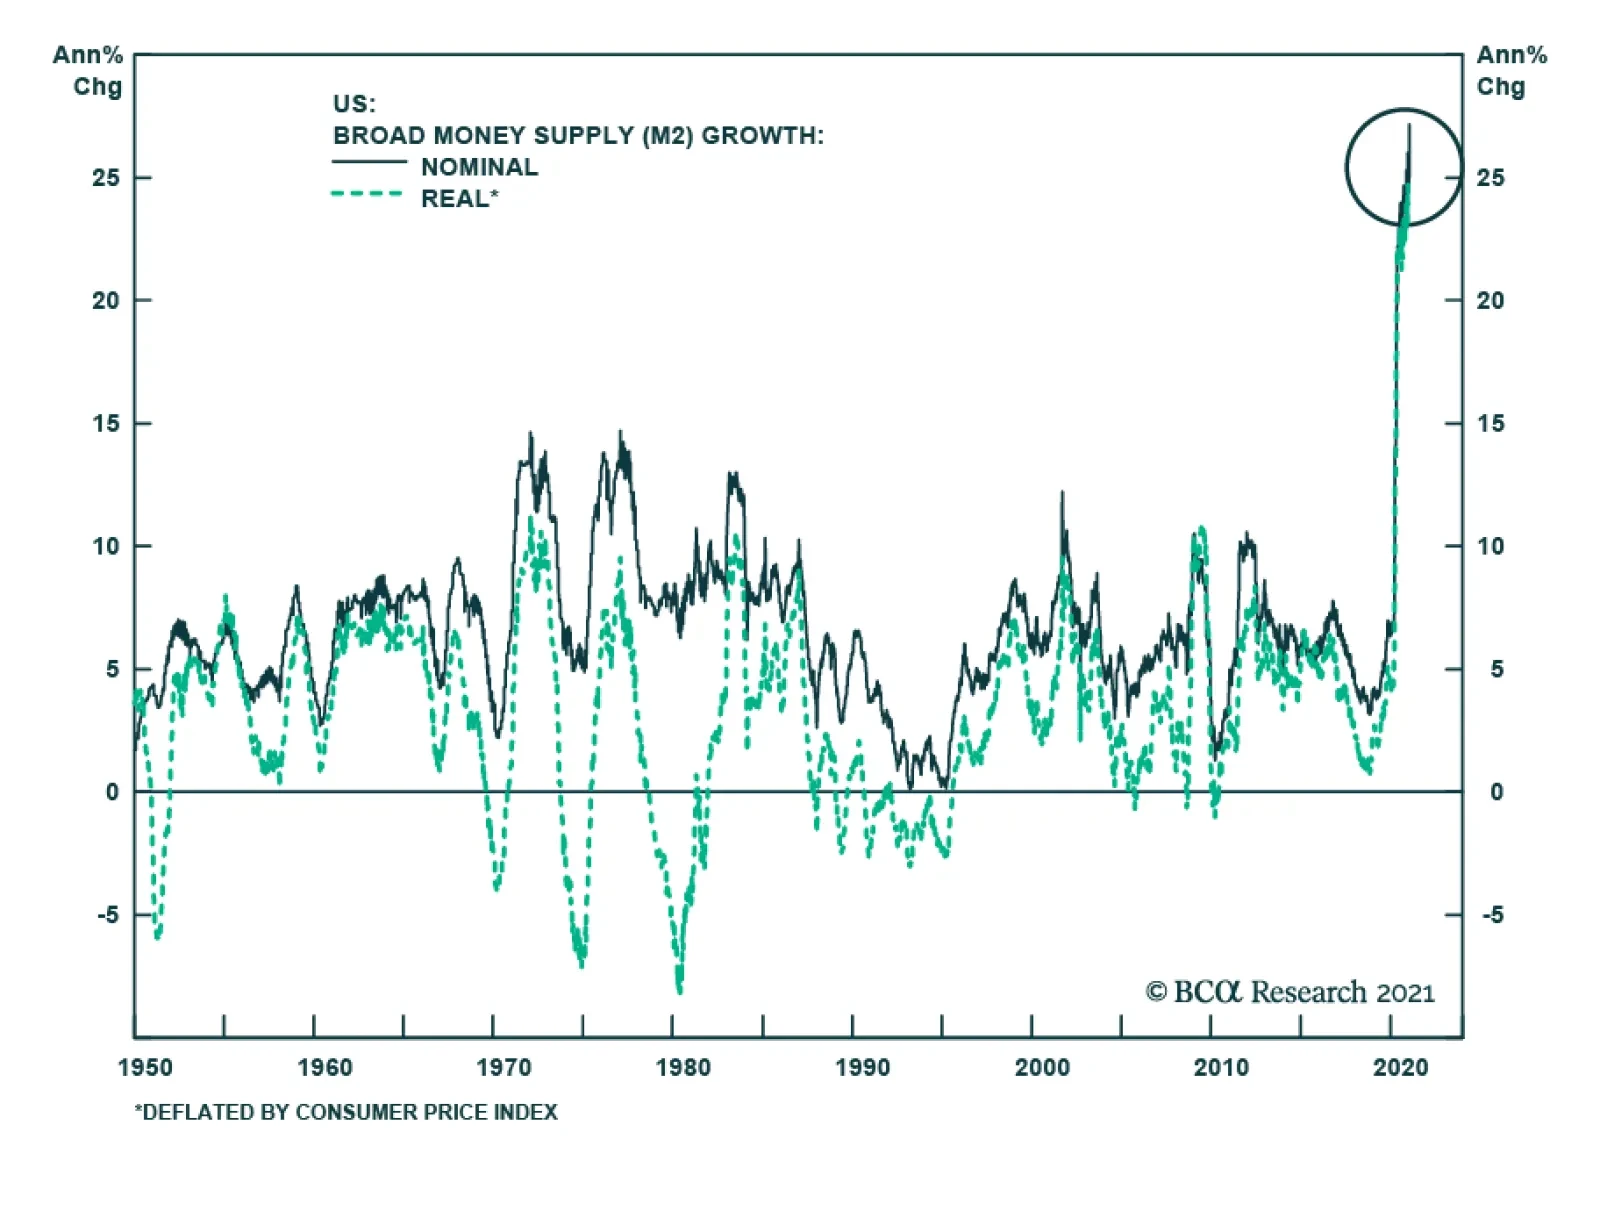
Can The US Dismount The Tiger? The US is currently experiencing no budget constraints. US broad money (M2) growth is at a record high both in nominal and real terms (Chart 4). In turn, the fiscal thrust was 11.4% of GDP last year and will remain substantial this year as most of Biden’s stimulus plan is likely to gain approval from Congress. Chart 4Helicopter Money In The US
Helicopter Money In The US
Helicopter Money In The US
Chart 5China Has Not Been Able To Wean Off Stimulus
China Has Not Been Able To Wean Off Stimulus
China Has Not Been Able To Wean Off Stimulus
Such an explosive boom in US money supply and fiscal largess will continue. Even after the pandemic is under control, it will be hard for policymakers to withdraw stimulus. China is a case in point. In the past 10 years, any time Beijing attempted to reduce the stimulus, China’s economic growth downshifted considerably and financial markets sold off (Chart 5, top panel). This forced Chinese policymakers to continuously enact new rounds of stimulus measures. As a result, they have not been able to achieve their goal of stabilizing the credit-to-GDP ratio (Chart 5, bottom panel). Similar dynamics will likely transpire in the US. Having been inflated enormously, US equity and corporate credit markets will be exceptionally sensitive to any policy shifts. US financial markets will riot at any attempt to withdraw monetary or fiscal stimulus. Given how sensitive US policymakers are to selloffs in financial markets, authorities will be extremely reluctant to exit these stimulative policies. Overall, the US equity and bond markets as well as the economy have grown accustomed to constant stimulus – an addiction that will be very hard to wean off. Bottom Line: Riding a tiger is fun. The hitch is that no one can safely get off a tiger. Similarly, US authorities are currently enjoying the exuberance from stimulus, but they will not be able to safely and smoothly dismount. Inflation, Asset Bubbles Or Capital Misallocation? In any system where an explosive money/credit boom persists, the outcome will be one or a combination of the following: inflation, asset bubbles or capital misallocation. Charts 6 and 7 illustrate that rampant money/credit growth in Japan and Korea in the second half of the 1980s produced property and equity market bubbles. Chart 6Japan: Money And Asset Prices
Japan: Money And Asset Prices
Japan: Money And Asset Prices
Chart 7Korea: Money And Asset Prices
Korea: Money And Asset Prices
Korea: Money And Asset Prices
Chart 8Deploying Credit To Capital Spending Could Lead To Deflation
Deploying Credit To Capital Spending Could Lead To Deflation
Deploying Credit To Capital Spending Could Lead To Deflation
In China’s case, the 2009-10 stimulus resulted in a property bubble as well as capital misallocation. Over the years, we have discussed these outcomes in China in detail and will not elaborate on them in this report. The pertinent question is why inflation has remained depressed in China. In fact, bouts of deflation occurred in various industries in China in the past 10 years. One usually associates a money/credit boom with demand exceeding supply resulting in higher inflation. That is correct if money/credit origination finances consumption with little capital expenditures taking place. However, the credit outburst in China enabled a capital spending boom. This led to a greater supply of goods and services, which in many cases exceeded underlying demand. The upshot has been deflation in various goods prices (Chart 8). History does not repeat but it rhymes. Open-ended stimulus in the US will eventually lead to years of economic and financial malaise. The nature of the challenges that the US will face matters not only to US financial markets but also to EM. Odds are that the US will experience asset bubbles and inflation in the real economy. We will not debate whether the US equity market is already in a bubble or not. Suffice it to say that in our opinion, parts of the market are already in a bubble. The main observation we will make in that regard is as follows: the sole way to justify the current broad US equity valuations is to assume that US Treasurys yields will not rise from the current levels. If US bond yields do not rise much, equity prices could hover at a high altitude. However, any mean reversion in US bond yields will deflate American share prices considerably. In turn, the outlook for US bond yields is contingent on the Fed’s willingness to continue with QE. We do not doubt the Fed will continue buying government securities until it faces a significant inflationary threat. Hence, the primary threat to US and global equity prices is inflation. Fertile Grounds For Inflation In The US Odds of inflation rising meaningfully above 2% in the US economy in the next 12-24 months have increased substantially:1 1. A combination of surging money supply and a potential revival in the velocity of money herald higher nominal GDP growth and inflation. It is critical to realize that in contrast to the last decade when the Fed was also undertaking QE programs, US money supply is now skyrocketing, as shown in Chart 4. In the Special Report from October 22 we discussed in depth why US money growth is currently substantially stronger than the post-GFC period. With household income and deposits (money supply) booming due to fiscal transfers funded by the Fed, the only missing ingredient for inflation to transpire is a pickup in the velocity of money. Lets’ recall: Nominal GDP = Price Level x Output Volume = Velocity of Money x Money Supply Solving the above equation for inflation, we get: Price Level = (Velocity of Money x Money Supply) / (Output Volume) Going forward, the velocity of US money will likely recover, for it is closely associated with consumer and businesses’ willingness to spend. At that point, a rising velocity of money and greater money supply will work together to exert upward pressure on nominal GDP and inflation (Chart 9). Chart 9The US: The Velocity Of Money Correlates With Inflation Momentum
The US: The Velocity Of Money Correlates With Inflation Momentum
The US: The Velocity Of Money Correlates With Inflation Momentum
2. Government policies targeting faster growth in employee compensation are conducive to higher inflation. One of the Biden administration’s key priorities is to boost wages and reduce income inequality. Unless productivity growth accelerates considerably in the coming years, odds are that labor’s share in national income will rise and companies’ profit margins will shrink (Chart 10). Businesses will attempt to raise prices to restore their profit margins. Provided income and spending will be strong, companies could succeed in raising their prices. In the US, a modest wage-inflation spiral is probable in the coming years. Chart 10The US: Faster Wage Growth Will Likely Undermine Corporate Profit Margins
The US: Faster Wage Growth Will Likely Undermine Corporate Profit Margins
The US: Faster Wage Growth Will Likely Undermine Corporate Profit Margins
Chart 11US Core Goods Price Inflation Is Accelerating
US Core Goods Price Inflation Is Accelerating
US Core Goods Price Inflation Is Accelerating
3. Demand-supply distortions and shortages will lead to higher prices. The pandemic has distorted supply chains while the overwhelming demand for manufacturing goods has produced shortages of manufacturing goods. US household spending on goods is booming and US core goods prices as well as import prices from emerging Asia and China are rising (Chart 11). In the service sector, lockdowns will permanently curtail capacity in some sectors. Meanwhile, the reopening of the economy will likely release pent-up demand for services, leading to shortages in certain segments. 4. De-globalization – the ongoing shift away from the lowest price producer – entails higher costs of production and, ultimately, higher prices. 5. Higher industry concentration and less competition create fertile grounds for inflation. Over the past two decades, the competitive structure of many US industries has changed – it has become oligopolistic. Due to cheap financing and weak enforcement of anti-trust regulation, large companies have acquired smaller competitors. In many industries, several dominant players now have a substantial market share. Such a high concentration across many industries raises odds of collusion and price increases when the macro backdrop permits. In sum, US inflation will rise well above 2% in the coming years. Inflationary pressures will become evident later this year when the economy opens up. The main and overarching risk to this view is that technology and automation will boost productivity and allow companies to cut or maintain prices despite cost pressures. Conclusions And Investment Strategy As America’s economy normalizes in the second half of this year, US inflationary pressures will begin rising. However, the Fed will fall behind the inflation curve – it will be late to acknowledge the potency of the inflationary pressures and act on it. It is typical for policymakers to downplay a budding new economic or financial tendency when they have long been pre-occupied with the opposite. Policymakers often fight past wars and are slow to calibrate their policy when the setting changes. The Fed falling behind the inflation curve is bearish for the US dollar in the medium and long-term. Share prices will be caught between rising inflationary pressures and the Fed’s continuous dovishness. This could create large swings in share prices: the market will sell off in response to evidence of rising inflation but will rebound after being calmed by the Fed. Eventually, fundamentals will prevail and the next US equity bear market will be due to higher inflation and rising bond yields. Over the coming several years, US share prices and bond yields will be negatively correlated as they were in the second half of the 1960s (Chart 12). Chart 12The 1960-70s: US Treasury Yields And The S&P 500 Were Negatively Correlated
The 1960-70s: US Treasury Yields And The S&P 500 Were Negatively Correlated
The 1960-70s: US Treasury Yields And The S&P 500 Were Negatively Correlated
Chart 13Will Gold Outperform Global Equities?
Will Gold Outperform Global Equities?
Will Gold Outperform Global Equities?
This is not imminent, but it is not several years away either. Inflation could become the market’s focus later this year. Such a backdrop of heightening inflation risks and the Fed falling behind the curve will favor gold over equities – this ratio might be making a major bottom (Chart 13). In this context, we reiterate our trade of being long gold/short EM stocks. For now, global risk assets are extremely overbought and many of them are expensive. In short, they are overdue for a correction. During this setback, EM equities and credit markets will suffer and in the near term could even underperform their respective global benchmarks. In anticipation of such a setback, we have not upgraded EM to overweight. We continue to recommend maintaining a neutral allocation to EM in global equity and credit portfolios. Consistently, the US dollar will rebound because it is very oversold. We continue shorting a basket of EM currencies versus the euro, CHF and JPY. High-risk currencies will underperform low-beta currencies. The EM/China backdrop remains disinflationary. Therefore, fixed-income investors should continue receiving 10-year swap rates in the following EM countries: Mexico, Colombia, Russia, China, Korea, India, and Malaysia. Arthur Budaghyan Chief Emerging Markets Strategist arthurb@bcaresearch.com Footnotes 1 This is the view of BCA’s Emerging Markets team and is different from BCA’s house view. The latter is more benign on the US inflation outlook in the coming years. Equities Recommendations Currencies, Credit And Fixed-Income Recommendations