Equities
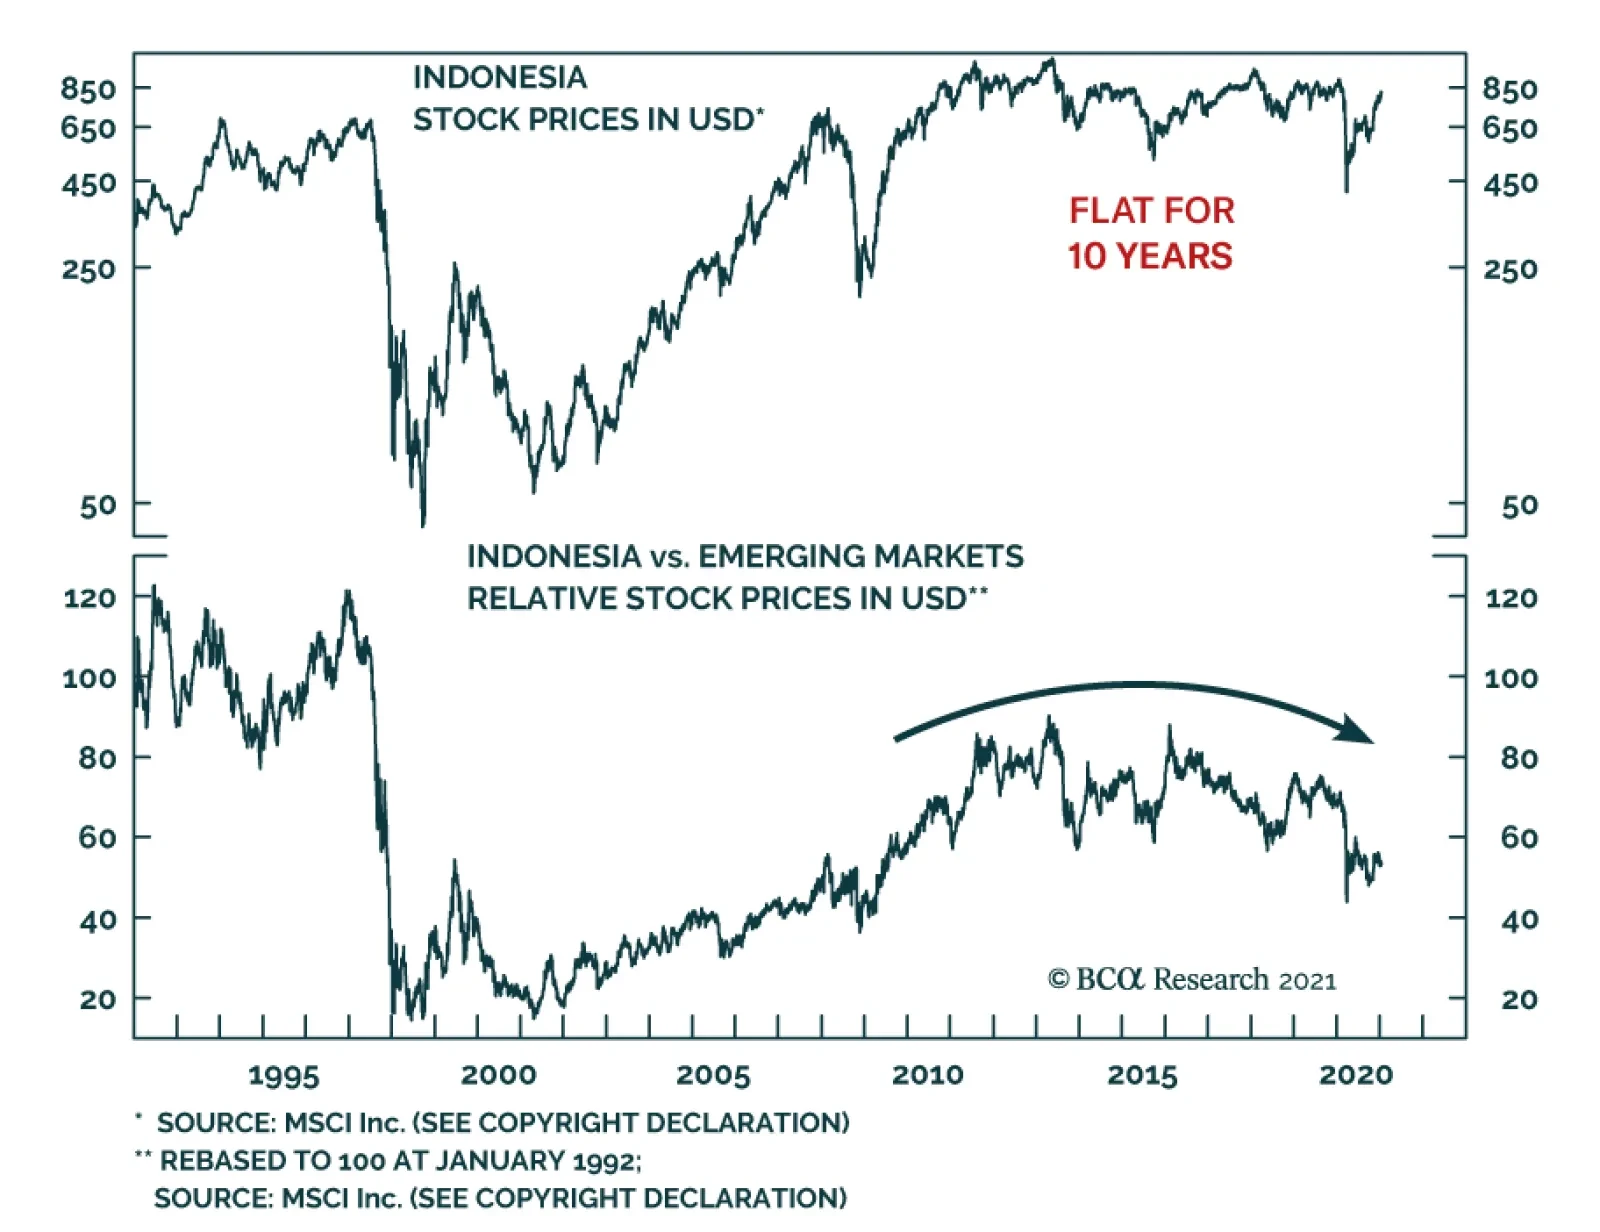
According to BCA Research’s Emerging Markets Strategy service, equity investors should put Indonesian equities on an upgrade watch list, despite their current underweight status. Bond investors should overweight Indonesia in an EM portfolio. …

There is little good news left that the market can discount to push the SPX higher through the multiple expansion pathway. This implies that earnings will have to do the heavy lifting and pull the SPX higher. The near all-time high 23x forward P/E multiple-implied SPX level will remain a bar hard to surpass and, similar to last summer when the market discounted the second wave of infections, it will face stiff resistance. We are already cautious on the near-term equity market prospects and would also recommend investors fade any overshoots above the 23 handle on the forward P/E level as the risk/reward ratio will be skewed to the downside (top & third panels). Tuesday’s Insight drew parallels with 2009-2010, and today we continue the analogy further and disaggregate the SPX return into its two components: forward P/E and “E”. Importantly the 2009-2010 episode is a close resemblance to today (third & bottom panels). The forward P/E similarity is especially striking. In fact, in order for the SPX to continue cyclically grinding higher to reach our end-2021 target of about 4,000, a repeat of 2010 is required when the forward multiple passed the baton to profits (see the second chart on the next page). Bottom Line: Lofty valuations add to our near-term cautious broad equity market view. Stay tuned.
Pushing On A String?
Pushing On A String?
Pushing On A String?
Pushing On A String?
Highlights Long-term investors should remain in the stock market – because central banks’ explicit commitment to financial stability will force them to crush bond yields in response to any major pullback in the $500 trillion worth of risk-assets. Given that stock market valuations are an inverse and exponential function of bond yields, crushing bond yields can give stock prices a massive boost. Hence, the structural bull market in stocks will end only when long-dated US bond yields approach zero. Nevertheless, expect a near-term exhaustion within the bull market, given stretched tech valuations and a fragile 65-day fractal structure of stocks versus bonds. Maintain a near-term tilt towards defensive sectors such as healthcare and utilities, and stock markets with a high exposure to these sectors, such as Switzerland and Portugal. Expect a countertrend rally in the dollar. Fractal trade: underweight Korea. Feature Chart I-1AStocks Became Unhinged From The Economy...
Stocks Became Unhinged From The Economy...
Stocks Became Unhinged From The Economy...
Chart I-1B...And Became Hinged To The Bond Yield, Inversely And Exponentially
...And Became Hinged To The Bond Yield, Inversely And Exponentially
...And Became Hinged To The Bond Yield, Inversely And Exponentially
Investment strategy is about a lot more than macroeconomics. As my colleague Garry Evans points out, the best investors seek wisdom from many other disciplines: statistics, psychology, organizational theory, geopolitics, history, climate science etc. In 2020 the list added three new subjects: virology, epidemiology, and immunology. The lesson is that investors need to be heterodox. To this end, Garry has published a list of non-finance books that are essential reading for all investors, available here https://www.bcaresearch.com/reports/view_report/31160/gaa. Yet despite the multi-disciplinarian inputs to an investment outcome, most investment strategy is not heterodox, it remains stubbornly orthodox – placing primacy on macroeconomics. The canonical form is, here is my outlook for economy X, so here is my outlook for stock market X. This primacy of macroeconomics is dangerous, because stock markets have become increasingly unhinged from the economy. How Stocks Became Unhinged From The Economy… Stock markets have become increasingly unhinged from the economy for three reasons. Stock markets have become increasingly unhinged from the economy. The first reason is that, to varying degrees, the composition of a stock market has become very different to the composition of the economy. Consider Denmark. Its stock market has a 41 percent weighting to healthcare and biotechnology, of which 21 percent is in the multinational pharmaceutical company, Novo Nordisk.1 Suffice to say, with such a heavy skew to global pharma and biotech, the Danish stock market has absolutely no connection with the Danish economy (Chart I-2). Chart I-2Denmark = Long Biotech
Denmark = Long Biotech
Denmark = Long Biotech
Now consider the much larger UK stock market. The oil sector contributes less than 1 percent to UK GDP, yet it contributes almost 20 percent to the sales of UK listed companies (because of the £0.5 trillion multinational sales of BP and Royal Dutch). Add in all the other multinational revenues and you will find little connection between UK listed companies’ sales and the UK economy (Chart I-3). Chart I-3Oil And Gas Is Overrepresented In The UK Stock Market Versus The UK Economy
Oil And Gas Is Overrepresented In The UK Stock Market Versus The UK Economy
Oil And Gas Is Overrepresented In The UK Stock Market Versus The UK Economy
A similar story holds true for the largest stock market of all, the US stock market. The tech sector contributes less than 5 percent to US GDP, yet it contributes 12 percent to the sales of the US listed companies. This significant overexposure to tech means that the aggregate sales of US listed companies are not representative of the US economy (Chart I-4). Chart I-4Tech Is Overrepresented In The US Stock Market Versus The US Economy
Tech Is Overrepresented In The US Stock Market Versus The US Economy
Tech Is Overrepresented In The US Stock Market Versus The US Economy
But what about the global stock market? The global stock market also has different sector skews compared with the global economy. This explains why, in 2015, the sales of global listed companies unhinged from a growing global economy, and suffered a severe and ‘hidden’ -11 percent recession, worse even than that suffered during the global financial crisis of 2008-09 (Chart I-5). Chart I-5Stock Market Revenues Suffered A Severe 'Hidden' Recession In 2015
Stock Market Revenues Suffered A Severe 'Hidden' Recession In 2015
Stock Market Revenues Suffered A Severe 'Hidden' Recession In 2015
The second reason that stocks are unhinged from the economy is the obvious point that the stock market is a discounting mechanism. Stocks are priced off the economy not as it is now, but as the market expects it at some future date. But what future date? The answer is: it varies. The market is composed of investors with many different time-horizons, ranging from day traders to multi-year horizon pension funds. In practice though, the long-term horizons tend to be fluid, sometimes compressing to focus on market momentum, sometimes re-expanding and reconnecting to a valuation anchor such as expected sales or profits. The shorter that the average time horizon of the stock market is, the more unhinged the market becomes from the valuation anchor. When the time horizon ultimately re-expands, the stock market reconnects with its valuation anchor, sometimes violently. Hence, it is crucial to monitor the average time horizon of the market using fractal analysis. And beware if the time horizon has compressed too far. The third reason that stocks can unhinge from the economy is that valuation extremes can dominate the price. To the extent that a weaker economy depresses the bond yield, and that valuation is an inverse exponential function of the bond yield, the paradox is that a much weaker economy can cause much higher stock prices. That was the story of 2020 (Chart of the Week). The corollary is that the perception of a stronger economy, by pushing up the bond yield, can depress stock and other risk-asset prices. This is a big worry because the total worth of global risk-assets, at $500 trillion, dwarfs the $90 trillion global economy by more than five to one.2 To their credit, central banks now understand this major risk, evidenced by the explicit addition of ‘financial stability’ to their mandates. Put simply, if stock and risk-asset prices fell far enough, central banks would be forced to crush bond yields. …And What To Do About It Having gone through the three reasons why stocks are unhinged from the economy, we can now advise on three ways that investors should respond. Avoid the canonical form, here is my outlook for economy X, so here is my outlook for stock market X. First, avoid the canonical form, here is my outlook for economy X, so here is my outlook for stock market X. In a few cases of X, such as Germany and Norway, there is a reasonable connection between the economy and stock market, but these are the exceptions. Mostly, the connection is either non-existent, as in Denmark and the UK, or tenuous, as in the US (Chart I-6 and Chart I-7). Chart I-6Little Connection Between GDP And Stock Market Revenues In The UK...
Little Connection Between GDP And Stock Market Revenues In The UK...
Little Connection Between GDP And Stock Market Revenues In The UK...
Chart I-7...And ##br##Europe
...And Europe
...And Europe
Instead, think in terms of the composition of the stock market. It is the sectors and stocks that dominate the stock market, rather than the local economy, that will drive its performance. Second, always monitor the average time horizon of the market (or any investment), and beware if it compresses too far. This is identified by the fractal structure breaking down, warning of a potential instability. For example, as we presaged last week in Stocks Are Vulnerable… And So Is Bitcoin, the reason that bitcoin has just suffered a 20 percent pullback was that the time horizons of its investors had compressed too far. Specifically, bitcoin’s 130-day fractal structure had collapsed, just as it had before previous pullbacks in late 2017 and mid-2019 (Chart I-8). Chart I-8Bitcoin's Investor Time Horizons Compressed Too Far
Bitcoin's Investor Time Horizons Compressed Too Far
Bitcoin's Investor Time Horizons Compressed Too Far
Third, swings in stock market valuations swamp the changes in the economic fundamentals. And the driver of these valuation swings is the bond yield, inversely and exponentially. Hence, if you get just one thing right, that one thing must be the bond yield. Some Investment Conclusions The most important conclusion is that investors who can ride out pullbacks should remain in the stock market. The simple reason is that central banks’ explicit commitment to financial stability will force them to crush bond yields in response to any major pullback in the $500 trillion worth of risk-assets. Given that stock market valuations are an inverse and exponential function of bond yields, crushing bond yields can give stock prices a massive boost – as we witnessed last year during the sharpest economic contraction in a century. One important takeaway is that the structural bull market in stocks will end only when bond yields can no longer be crushed. As bond yields in Europe and Japan are already close to their lower bound, this effectively means that bull market in stocks will end only when long-dated US bond yields approach zero. Long-term investors should stay in stocks until then. Nevertheless, as we detailed last week, we anticipate a near-term exhaustion within the bull market, for two reasons. First, the (earnings) yield premium on tech stocks versus the 10-year bond yield is at its 2.5 percent lower threshold that has presaged four previous market exhaustions. Second, the average time horizon of stocks versus bonds has compressed too far, evidenced by a fragile 65-day fractal structure (Chart I-9). Chart I-9Stock Versus Bond Investor Horizons Have Compressed Too Far
Stock Versus Bond Investor Horizons Have Compressed Too Far
Stock Versus Bond Investor Horizons Have Compressed Too Far
Hence, for the near-term, maintain a tilt towards defensive sectors such as healthcare and utilities, and stock markets with a high exposure to these sectors, such as Switzerland and Portugal. Expect a countertrend rally in the dollar. Finally, expect a countertrend rally in the dollar, given that in the short term the dollar is just the perfect mirror-image of the stock market (Chart I-10). Chart I-10The Dollar Has Been The Perfect Mirror-Image Of The Stock Market
The Dollar Has Been The Perfect Mirror-Image Of The Stock Market
The Dollar Has Been The Perfect Mirror-Image Of The Stock Market
Fractal Trading System* The near-vertical rally in the Korean stock market is vulnerable to a setback given that both the 130-day and 65-day fractal structures have collapsed. Accordingly, underweight MSCI Korea versus MSCI AC World, setting a profit target and symmetrical stop-loss at 10.6 percent. Chart I-11MSCI Korea Vs. MSCI All-Country World
MSCI Korea Vs. MSCI All-Country World
MSCI Korea Vs. MSCI All-Country World
In other trades, long XLU versus XLB was closed at its stop-loss. The rolling 12-month win ratio now stands at 60 percent. When the fractal dimension approaches the lower limit after an investment has been in an established trend it is a potential trigger for a liquidity-triggered trend reversal. Therefore, open a countertrend position. The profit target is a one-third reversal of the preceding 13-week move. Apply a symmetrical stop-loss. Close the position at the profit target or stop-loss. Otherwise close the position after 13 weeks. * For more details please see the European Investment Strategy Special Report “Fractals, Liquidity & A Trading Model,” dated December 11, 2014, available at eis.bcaresearch.com. Dhaval Joshi Chief European Investment Strategist dhaval@bcaresearch.com Footnotes 1 Based on Datastream indexes. 2 The $500 trillion comprises $300 trillion in real estate plus $200 trillion in other risk-assets such as equities, corporate bonds, and EM debt. Fractal Trading System Cyclical Recommendations Structural Recommendations Closed Fractal Trades Trades Closed Trades Asset Performance Currency & Bond Equity Sector Country Equity Indicators Bond Yields Chart II-2Indicators To Watch - Bond Yields
Indicators To Watch - Bond Yields
Indicators To Watch - Bond Yields
Chart II-2Indicators To Watch - Bond Yields
Indicators To Watch - Bond Yields
Indicators To Watch - Bond Yields
Chart II-3Indicators To Watch - Bond Yields
Indicators To Watch - Bond Yields
Indicators To Watch - Bond Yields
Chart II-4Indicators To Watch - Bond Yields
Indicators To Watch - Bond Yields
Indicators To Watch - Bond Yields
Interest Rate Chart II-5Indicators To Watch - Interest Rate Expectations
Indicators To Watch - Interest Rate Expectations
Indicators To Watch - Interest Rate Expectations
Chart II-6Indicators To Watch - Interest Rate Expectations
Indicators To Watch - Interest Rate Expectations
Indicators To Watch - Interest Rate Expectations
Chart II-7Indicators To Watch - Interest Rate Expectations
Indicators To Watch - Interest Rate Expectations
Indicators To Watch - Interest Rate Expectations
Chart II-8Indicators To Watch - Interest Rate Expectations
Indicators To Watch - Interest Rate Expectations
Indicators To Watch - Interest Rate Expectations
Highlights Structural reform is coming to the US in the wake of the riotous 2020 election cycle. Extreme levels of political polarization will subside, albeit remaining relatively elevated. This will smooth the way to a more proactive fiscal policy that secures the economic recovery. The Biden administration has enough political capital to pass large fiscal stimulus, an expansion of Obamacare, and an increase of taxes, regulations, and the minimum wage. The Republican Party will go into the political wilderness – and it may not recover from its internal struggle in time for the 2022-24 elections. Moderate Republicans will assist in passing legislation. Stay cyclically long stocks over bonds, cyclicals over defensives, and value over growth, but introduce tactical hedges. Go long VIX. Feature Structural reform is coming to the United States in the wake of the riotous 2020 election cycle. The incoming administration of President-elect Joe Biden will usher in a stabilization of US politics by means of a substantial increase in fiscal support for the economy. This provides a backstop for the recovery that, combined with the ultra-accommodative Federal Reserve, suggests investors should keep an optimistic attitude toward risk assets over the coming 12 months, despite the inevitable ups and downs (Chart 1). Biden and the establishment politicians of both parties are beset by rising forces of populism on the right and left. They likely recognize that their political survival, as well as the country’s stability, depends on maintaining the recovery. The soon-to-be ruling Democratic Party narrowly obtained the majorities necessary to pass at least a few major laws. Chart 1Biden's First 100 Days Triggers Brief Pullback
2021 Key Views: Structural Reform
2021 Key Views: Structural Reform
The change in political leadership will be beneficial for the middle class household but less so for Big Business and corporate earnings. The US faces a rocky historical transition toward larger government involvement in the economy, more restrictions on private enterprise, and more redistribution of wealth. Labor is taking up a larger share of national income, as opposed to capital – a big shift away from the trend of the past 40 years (Chart 2). That period was extremely friendly to equity investors. The future will be trickier, though for the time being the market is pricing the good news. Chart 2Labor Makes A Comeback Versus Capital
2021 Key Views: Structural Reform
2021 Key Views: Structural Reform
In this report we lay down our three key views for 2021: Peak Polarization – US political polarization is at extreme levels and though it will subside in the wake of the feverish 2020 cycle, it will remain elevated in the coming years. There will be aftershocks from the past year’s crises. Extremism and political violence will continue to flare up with the possibility of domestic terrorist incidents. The market impact of this trend is inherent in the Democratic victory in the White House and Congress, but the Biden administration’s political capital will increase upon any major shocks stemming from extreme polarization. Bipartisan Structural Reform – Investors should expect a flurry of legislation. The Democrats will be anxious to reward their base and consolidate power. Moderate Republicans will assist on some votes. New taxes and spending, a higher federal minimum wage, a larger safety net (e.g. healthcare), and administrative reforms will all ensue. Republicans In The Wilderness – The Republican Party is hereby exiled into the political wilderness to settle its internal struggle over Trumpism. The Party of Lincoln will somehow survive but it may not recover by 2024. Below we explain these views, what would undermine them, and what they mean for investors over the next 12 months and beyond. View #1: Peak Polarization US political polarization hit extreme levels over the past year according to various measures (Chart 3). Polarization will retreat as a result of Biden’s victory over Trump – Biden will have a higher approval rating, both generally and among the opposite party, than Trump did. But it will remain elevated relative to history. Structural drivers of polarization, such as wealth and racial inequality, congressional gerrymandering, and regional disparities, remain unaddressed. It will take time to reduce them. Hence, US social and political instability will continue in 2021. Most of this will be noise but some of it will not. Chart 3Polarization At Extremes
2021 Key Views: Structural Reform
2021 Key Views: Structural Reform
Chart 4Terrorism On The Rise In The US
2021 Key Views: Structural Reform
2021 Key Views: Structural Reform
There will be aftershocks in the wake of the Trump rebellion on January 6 and the House Democrats’ decision to impeach him for a second time. A massive show of force will attend Biden’s inauguration, but extremism and political violence of various kinds have been flaring in recent years and will persist for some time (Chart 4). Both the FBI and the Department of Homeland Security have warned of a rise in domestic extremism and terrorism. Increased political instability creates fertile ground for malign actors of all stripes to operate, including domestic or foreign saboteurs. At a critical juncture in the nation’s politics like today, a major attack could wreak more panic and uncertainty than otherwise would be the case. The past year of unrest shows that the bar is high for markets to respond to passing political events. But a major crisis event that has systemic importance cannot be ruled out in today’s precarious environment. In the event of a major domestic terrorist incident, such as the 1995 Oklahoma City bombing, the vast majority of the public would react with utter revulsion and rally around the flag (Chart 5), while the federal counterterrorism response would be overwhelming, just as it was in the 1990s. Chart 5OKC Bombing Spurred Rally Round The Flag
2021 Key Views: Structural Reform
2021 Key Views: Structural Reform
The market impact of such an attack would be fleeting. Other domestic incidents bear this out, such as the Waco siege (1993), the Olympic Park bombing in Atlanta (1996), the Charleston church massacre (2015), and the shooting of Republican lawmakers in 2017 (Chart 6). This point is intuitive given the extensive rioting and unrest in 2020 yet the fall of market volatility throughout the year. Yet the past year’s social and political instability does have major investment implications. It has led to full Democratic control of Congress and the White House on an agenda of fiscal expansion and wealth redistribution. Chart 6Market Largely Ignores Domestic Terrorism
2021 Key Views: Structural Reform
2021 Key Views: Structural Reform
What About Long-Term Effects? With the government supporting the economy, it is less likely that the US will experience a drastic backslide into even greater social instability in the coming years. On the contrary, a more proactive fiscal policy, with more robust social safety nets in terms of health, unemployment, child care, and old age, means that social stability should improve (Chart 7). If the material wellbeing of the country fails to improve, or if exogenous events further destabilize the US, then the social and political environment will deteriorate further. But we would expect that 2021 will see the US secure the recovery and begin to restore order, at least temporarily. Longer term stabilization will require a succession of improvements that span administrations. Chart 7Better Social Safety Net Could Reduce Deaths Of Despair
2021 Key Views: Structural Reform
2021 Key Views: Structural Reform
Bottom Line: The Biden administration’s political support will increase if there are any major attacks and that support will be used to restore order. The market ramifications of any such response are already known: expansive, proactive fiscal policy to stabilize the economy and society and thus reduce the odds of greater division and radicalization. This kind of stabilization is positive for risk assets over a 12-month horizon. View #2: Bipartisan Structural Reform Investors should bet on a flurry of legislation from the Democrats (Table 1). They will be anxious to reward their base, consolidate power, and restore the political establishment to a position of primacy. They will be determined to act quickly, remembering how the 2010 midterms stymied their agenda after winning a blue sweep in the wake of the last major national crisis. Table 1Biden’s Priority? Stimulus … And More Stimulus
2021 Key Views: Structural Reform
2021 Key Views: Structural Reform
Not only do Democrats control Congress but also Republicans are divided – by their loss of the Senate and by Trump’s rebellion. Over the coming year, moderate Republicans will be much more likely to vote with Democrats than the latter will be to defect from their party, especially on popular legislation such as economic stimulus (Chart 8). Chart 8Biden’s Priority? Stimulus … And More Stimulus
2021 Key Views: Structural Reform
2021 Key Views: Structural Reform
If Republicans prove obstructionist then we would not rule out the Democrats mustering the votes to remove the Senate filibuster. But in the current climate, several moderate Republicans, such as Alaska Senator Lisa Murkowski, Pennsylvania Senator Pat Toomey, and Utah Senator Mitt Romney, are looking to distance themselves from Trump and Trumpism. Opposition to government spending has lost a lot of steam in US politics. The populist Republicans are increasingly willing to accept large spending to ease burdens on their voter base. Trump was a big spender, and the Republicans passed large spending bills during his term. Republicans have supported large household rebates as a COVID relief measure, as our Global Investment Strategy points out. These include prominent Senators like Lindsey Graham of South Carolina as well as presidential hopefuls like Marco Rubio of Florida and Josh Hawley of Missouri. Granted, desperate times call for desperate measures – Republican fiscal hawkishness will return now that the party is in the opposition. But there can be little doubt that Republican fiscal discipline has eroded given that both populists and moderates have loosened their standards. Austerity will not have as much support in the 2020s as it did after 2008. There is no chance that Democrats and Republicans will agree on a 2011-style Budget Control Act in the near future. The budget deficit will normalize albeit at a higher level than before the crisis (Chart 9). Chart 9Budget Deficit: Larger For Longer
2021 Key Views: Structural Reform
2021 Key Views: Structural Reform
Democrats are guaranteed to drive a big spending agenda through Congress. They have the votes, the popular support, and the lingering COVID crisis as added impetus. The voting record of the Obama administration reinforces the high likelihood of Democratic unity as well as moderate GOP support (Chart 10). Chart 10Obama Era Shows Democrats Will Pass Legislation
2021 Key Views: Structural Reform
2021 Key Views: Structural Reform
What About Tax Hikes? Congress will also raise taxes sooner or later. The party is united on the need to tackle economic inequality. There is no clear relationship between marginal tax rates and economic growth, capital spending, or productivity, according to our US Investment Strategist Doug Peta. If anything a positive correlation exists between corporate tax rates and economic growth, suggesting the right time to increase taxes is when the economy has recovered from recession or is otherwise in full stride (Chart 11). Nevertheless it is intuitive that a big tax hike could weigh on growth when it is first rolled out. Chart 11A Growing Economy Enables Tax Hikes
2021 Key Views: Structural Reform
2021 Key Views: Structural Reform
So there is a good basis for the Biden administration to delay raising taxes until the recovery is secure. However, taxes will go up sooner or later (Chart 12). Chart 12Corporate Tax Rate Will Rise Sooner Or Later But The Economy Can Power Through It
2021 Key Views: Structural Reform
2021 Key Views: Structural Reform
Taxes must rise to pay for new spending and, in the Democratic Party’s view, redress inequality. The use of the budget reconciliation procedure to pass laws with a simple majority in the Senate will necessarily require revenue offsets over a ten-year window to pay for new spending. The Trump tax cuts were never very popular to begin with, so the political blowback is manageable (Chart 13). Any delay would be temporary and thus its positive effects would be counteracted by the expectations of firms and investors. Passing tax hikes in 2021 enables COVID to serve as a pretext for a larger round of spending increases than would otherwise be possible to offset the new tax burden. Taxes can be passed in 2021 but not take effect until 2022. That might prevent the full impact from hitting ahead of midterm elections that year. Democrats hope to pick up two seats in the Senate, bringing their majority to 52-48 and bringing the more controversial parts of their agenda within reach. Chart 13Trump Tax Cuts Were Never Very Popular
2021 Key Views: Structural Reform
2021 Key Views: Structural Reform
Note also that the Biden administration aims only partially to repeal the Trump tax cuts. The new corporate tax rate will rise to no more than 28%, which is still seven percentage points lower than Trump found it in 2016. Nor is Biden projecting a higher top marginal individual rate than the 39.6% that prevailed before Trump. The minimum corporate tax rate of 15% will bring a bigger negative impact for firms but it will be politically popular. There could also be a financial transactions tax, which Biden has said he supports. All of this is achievable with Senate control (Table 2). Table 2Biden’s Fiscal Agenda
2021 Key Views: Structural Reform
2021 Key Views: Structural Reform
Investors should expect an early hit to earnings expectations. There will be an earnings hit from the simultaneous increase in taxes, regulations, and the doubling of the minimum wage to $15 per hour. Moreover investors need to price in more than Biden’s agenda. They need to price in a broader shift in US policy to redistribute wealth from capital to labor. Firms will face a new paradigm that is less corporate-friendly and laissez faire, at least until the Republican Party recovers and offers a viable alternative. And as discussed below, that could take a while. Bottom Line: The Biden administration will pass big new increases in spending and taxation as well as minimum wages and a slew of new regulations on labor and the environment. The shift to a fiscally proactive US government, at a time when the Fed is ultra-dovish, will ensure that the positive market reaction continues for the most part of the coming 12 months. But sooner or later markets will have to discount a generally more intrusive government that will reduce profit margins. View #3: Republicans In The Wilderness The Republican Party will go into the political wilderness in 2021, where it faces an internal struggle over how to deal with Trump and Trumpism. In the short run this means Republicans will not be well organized to oppose the Biden administration. In the long run, the outcome of this internal struggle will have a historic impact on the overall US policy outlook. Trump has become the first president to be impeached twice. There are eight days until Biden’s inauguration at noon on January 20. The Senate, still led by Republicans, has scheduled the trial to take place after that time, but it may still be relevant. If Trump is tried and convicted, which requires a two-thirds vote, then he could be disqualified from holding any future office on a simple majority vote. Otherwise, Congress could censure him, which would be merely symbolic. The Democrats hope to force Republicans to go on the record after Trump’s interference with the peaceful transfer of power to force them either to break with their party or wear the Trump albatross forevermore. Republican senators are not as reliable for Trump in any new impeachment as in the first one. A vote to remove, disqualify, or censure him would enable them to wash their hands of his actions. This could be useful for swing state moderates. The problem for the GOP is that it is still beholden to Trump, who generated large voter turnout and won 47% of the national vote, despite a pandemic and recession. Trump has left the party in better condition, in terms of seats, than his predecessor George Bush did (Chart 14). If he leaves the GOP and starts his own party, he could bring anywhere from one-third to half of Republican voters with him and thus hobble the party semi-permanently (Chart 15). It has happened before in US history.1 Chart 14GOP Still Fairly Strong In Congress, State Capitol
2021 Key Views: Structural Reform
2021 Key Views: Structural Reform
Chart 15If Trump Leaves, He Could Take One-Third To Half Of GOP Voters
2021 Key Views: Structural Reform
2021 Key Views: Structural Reform
A high-stakes negotiation will have to be held in a smoke-filled back room. Trump wants the 2024 nomination; the GOP wants his base. A solution would involve the GOP exculpating Trump yet again while he shepherds his base over to a successor within the party. But there is deep distrust. Trump was never a normal Republican and now he is even at odds with Vice President Mike Pence, Senate Leader Mitch McConnell, and his former chief of staff Mick Mulvaney. The party is losing donors over Trump’s actions, as companies withdraw support in the name of democracy. Moderate lawmakers and high-profile Republicans are trying to sever ties with Trump and considering leaving the party. If Republicans convince Trump to put away his 2024 aspirations and support the party, they may recuperate fairly quickly, on a populist basis. If they cannot, then the party may split, whether formally or informally, and hand the Democrats a decade-long ascendancy in US politics. Trump has shown that his base is too small to win against a fully mobilized Democratic-led political establishment. But without his base the Republicans definitely cannot win. The Republican Party will thus experience varying degrees of fracture in 2021. So far, Trump says he will run in 2024 and there is no reason to doubt him. But this is moot if the Senate agrees to impeach. This means the party is almost guaranteed to suffer a lasting split that will undermine its prospects in 2022, which would normally be fairly strong, and set up a bloody primary election in 2024. If this is the path the party embarks on in 2021, then investors should expect the Biden administration to be more effective than its narrow majorities suggest in passing legislation. Bottom Line: The Republican Party will suffer a deep fissure, or split entirely apart, depending on President Trump’s actions in the coming years. The implication is that the GOP opposition will be mostly ineffective in Washington in 2021. Moderate senators will be liable to vote with the Democratic majority on major bills. This is especially true of bills relating to COVID relief, economic stimulus, health care, or administrative reform to prevent 2020 election debacles from happening again. Investment Takeaways US equity markets and risk assets will eventually suffer a correction when the market comes to grips with the Biden administration’s capabilities and the looming rise in taxes, regulations, and wages. A stock market drop around Biden’s inauguration and first 100 days would fit the pattern of new “sweep” governments with single-party control. Timing is always tricky especially because the market is exuberant about the combination of larger fiscal and monetary stimulus. Stock prices are technically extended, expensive, and vulnerable to a negative growth surprise, but we would be buyers amid an equity pullback as the policy and macro fundamentals remain supportive. We are bullish over the 12-month horizon, especially in the first half. We are long stocks, the stock-to-bond ratio, value over growth, infrastructure plays, and reflation plays. Fiscal spending will go up quickly with new legislation, whereas tax hikes could be delayed. The implication is that the deficit will get larger and the yield curve will steepen, which is beneficial for cyclical and value plays. When tax hikes come into focus – which we expect to be soon – the tech sector will be the first casualty. We are long materials relative to Big Tech and would also be constructive toward energy relative to tech. The sectors that face the greatest policy risks under the Biden administration – health care, energy, financials – are also the ones best positioned to capitalize on the fresh burst of policy reflation, especially the latter two. Big Pharma and the health insurers clearly face higher policy and regulatory risks. We recommend going tactically short S&P managed health care relative to the broad market. Consumers stand to benefit from stimulus measures that add to their already formidable pile of savings and provide more robust safety nets. Consumer discretionary stocks will also benefit from the normalization of the economy. Thus we view consumer plays favorably in general and recommend going long consumer staples as a tactical hedge. As another tactical hedge we recommend going long volatility (VIX). Several clients have asked about the drop in Twitter’s share prices upon its announcement that President Trump would be permanently removed from the platform. In general, we expect a drop in polarization to coincide with a drop in tech outperformance (Chart 16). The reason is that a slight increase in bipartisanship will result in fewer fiscal cliffs and policy-induced shocks, thus helping inflation expectations recover. This will benefit value stocks more so than growth. The Biden administration is allied with Big Tech but the threats to this sector are sprouting up in both political parties and from every direction – from anti-trust authorities, state-level governments, privacy advocates, free speech advocates, foreign tax authorities and regulators, and unions. We will discuss the latest controversies regarding Big Tech and free speech/press in future reports but for now suffice it to say that the macro and policy landscape is shifting against Big Tech. The big five tech firms may still see their stock prices rise but they will underperform the other 495 companies on the S&P. Chart 16Polarization And Tech Go Hand-In-Hand
2021 Key Views: Structural Reform
2021 Key Views: Structural Reform
Matt Gertken Vice President US Political Strategy mattg@bcaresearch.com Appendix Table A1Biden’s Cabinet Position Appointments
2021 Key Views: Structural Reform
2021 Key Views: Structural Reform
Footnotes 1 Namely in the 1912 election when Theodore Roosevelt left the Republican Party and started the progressive “Bull Moose” party, costing incumbent President William Howard Taft the election versus Democratic challenger Woodrow Wilson. One could loosely interpret Texan Ross Perot’s presidential runs in 1992 and 1996 in a similar vein, and perhaps that would be more applicable to any future independent run by President Trump.
Highlights The incidents of state-owned enterprise (SOE) bond defaults late last year reflected deteriorating corporate balance sheets and exposed local governments’ weakening fiscal positions. Both were preexisting conditions that worsened due to the pandemic. China’s policymakers have vowed to accelerate restructuring the SOE/corporate sector, but they face a dilemma between economic stability and painful reforms; the outcome will ultimately depend on policymakers’ pain thresholds. In the next 6 to 12 months, the policy tightening cycle will continue and credit growth will decelerate. Chinese stocks are already more expensive than before the start of the last policy tightening cycle. We recommend a neutral position on domestic and investable stocks for now. Feature The days of China’s unconditional bailout of state firms may be over. In the past six months, Beijing has embarked on a series of reform agendas, including restructuring and stricter regulations targeting SOEs and the broader spectrum of the corporate sector. When three SOEs defaulted on bond payments late last year, neither the central nor the local government supported those firms. Allowing market forces to allocate capital to more productive firms by driving out the less efficient companies is structurally positive for the Chinese economy. However, the pursuit of meaningful SOE and broader corporate reforms will be a tough choice for Chinese policymakers this year while the economic recovery is underway. Ultimately, the degree and speed to reform SOEs will depend on how much near-term pain policymakers are willing to endure. We recommend a neutral position in Chinese stocks for now. We expect the financial markets to experience frequent mini-cycles in 2021 due to policy zigzags. Risks for policy miscalculations cannot be ruled out; equity prices will falter if Chinese authorities push for deeper reforms and tighter industry regulations while scaling back stimulus at the same time. Chinese stocks are already expensive and are vulnerable to authorities opting for much smaller stimulus and harsher corporate/SOE reforms. SOE Defaults: Policy Response Matters More Than Defaults Chart 1Policy Zigzags And Market Mini-Cycles
Policy Zigzags And Market Mini-Cycles
Policy Zigzags And Market Mini-Cycles
A flurry of high-profile defaults by state firms late last year unnerved investors and pushed up onshore corporate bond yields. Beijing’s move to allow SOEs to fail forced investors to reprice bonds issued by state firms as much riskier propositions. Following the defaults in November, the PBoC injected unusually large interbank liquidity; the de jure policy rate dropped and Chinese stock prices rallied (Chart 1). In our view, the recent liquidity injections do not provide enough evidence that macro policy is shifting to an easier bias. Despite a retreat in the short-term interbank rate, the authorities have plowed ahead with reforms and initiated more restrictions in key industries. In the coming months, investors should expect the following: SOE reforms will tolerate more bond defaults. Bank loans and local government bonds make up nearly 80% of China’s total domestic credit, whereas corporate bonds (including SOEs and local government financing vehicles (LGFVs)) account for only 10% of the total (Chart 2). Thus, even if corporate bond defaults push up yields, Beijing may see this as a small price to pay in the near term, in exchange for a market-driven system cleansing to eliminate inefficient SOEs. This outcome will be negative for corporate bonds (Chart 3). Chart 2Corporate Bond Issuance Make Up Only A Small Portion Of Total Financing
Corporate Bond Issuance Make Up Only A Small Portion Of Total Financing
Corporate Bond Issuance Make Up Only A Small Portion Of Total Financing
Chart 3Periods Of Financial Tightening Dampen Corporate Bond Market
Periods Of Financial Tightening Dampen Corporate Bond Market
Periods Of Financial Tightening Dampen Corporate Bond Market
Chart 4Higher Funding Costs Will Discourage Corporate Borrowing
Higher Funding Costs Will Discourage Corporate Borrowing
Higher Funding Costs Will Discourage Corporate Borrowing
Policymakers may underestimate the unintended consequences of SOE defaults on credit flow and the broader economy. The central bank was able to engineer a sharp drop in its policy rate last month, which may prompt policymakers to believe that interbank liquidity injections are efficient market-calming measures and rising corporate bond yields will not impede overall credit growth. This may be true in the short term, however, tightened policy in the name of reforms has previously pushed up both the 3-month SHIBOR and bank lending rates, leading to a significant slowing in credit growth and an eventual slowdown in economic expansion (Chart 4). Reasons for such chain reactions are twofold. First, banks become more risk averse during a tightening cycle and charge higher premiums when lending to smaller financial institutions and the private sector (Chart 4, bottom panel). Secondly, although Chinese SOEs can borrow from banks at much lower interest rates than private-sector entities (Chart 5), their heavy indebtedness makes them hyper-sensitive to even a slight uptick in financing costs. Chinese SOEs rely more on bank lending than bond issuance for financing and SOE borrowers dominate China’s bank credit to the corporate sector.1 Chart 6 shows that the rise in the weighted average lending rate in 2017 was relatively minor compared with levels that prevailed in the past decade. Nonetheless, a less than one percentage point hike in the lending rate materially slowed credit growth and the investment-driven sectors of China's economy. Chart 5SOEs Tend To Have Lower Borrowing Costs, Partially Reflecting Implicit Government Guarantees
China's SOE Reform Dilemma
China's SOE Reform Dilemma
Chart 6Small Rise In Lending Rate, Large Fall In Credit Growth
Small Rise In Lending Rate, Large Fall In Credit Growth
Small Rise In Lending Rate, Large Fall In Credit Growth
Regulatory pressures will lead to de facto tightening. As outlined in our 2021 Outlook report, as part of the macroeconomic policy normalization, credit growth will likely decelerate by two to three percentage points this year from 2020. The extended Macro Prudential Assessment (MPA) System will wrap up by year-end and financial institutions will need to start slowing their asset balance sheets to meet the assessments. Moreover, last week the central government revised Measures for the Performance Evaluation of Commercial Banks. The modified version factors lending to the new-economy sectors and micro and small enterprises into the performance evaluation and salaries of the state-owned and controlled commercial banks’ management.2 The new measures will likely dampen the banks’ propensity to lend to old-economy sectors, such as real estate and traditional infrastructure. All in all, a faster-than-desired slowdown in credit growth will ensue if policymakers simultaneously allow more SOE/corporate defaults, undertake industry reforms, and implement tighter banking regulations in 2021. This is negative for both economic growth and the equity market. Bottom Line: Chinese policymakers will likely allow more SOE defaults in the coming months. In addition to an increased number of SOE defaults that is negative for the corporate bond market, sped up industry restructuring and more stringent regulations may lead to a sharp fall in credit growth and stock prices. Worsening Old Economy SOEs’ Financial Positions Chart 7SOEs Are Less Efficient Than Private Firms In Profitability And Productivity
China's SOE Reform Dilemma
China's SOE Reform Dilemma
An acceleration in SOE reforms may trigger near-term risks, but a delay in restructuring China’s loss-making SOEs will have repercussions in the long term. The explicit and implicit government protections for SOEs have eroded their efficiencies compared with the private sector (Chart 7). The most significant side effect is a rapid rise in SOE leverage and diminishing profitability in some of the old economy sectors. It may be a dead end for the government to continue bailing out state firms with inefficient operations and financial losses. A Special Report we previously published showed that among SOEs in the industrial and construction sectors, which account for half of all SOEs in China, the adjusted return on assets (ROA) versus borrowing costs has been negative since 2013 (Chart 8). This suggests that SOE investment funded by higher leverage cannot produce sufficient income to repay debt. During the last tightening cycle that started in late 2016, policymakers managed to rein in local SOE debt growth, but it reversed course in 2018 due to a collapse in domestic demand (Chart 9). As Chart 8 illustrates, ROA among SOEs in the industrial and construction sectors has significantly deteriorated since then. Chart 8SOEs Financial Gains From Debt Are In Deep Contraction
SOEs Financial Gains From Debt Are In Deep Contraction
SOEs Financial Gains From Debt Are In Deep Contraction
Chart 9China Was Successful In Reining In SOE Debt, But Only Briefly
China Was Successful In Reining In SOE Debt, But Only Briefly
China Was Successful In Reining In SOE Debt, But Only Briefly
Bottom Line: A continued capital misallocation by perpetually leveraging SOEs and LGFVs with negative marginal operating gains will eventually lead to a self-reinforcing debt trap. In turn, that would precipitate a default en masse and necessitate a larger government bailout. Another Layer To The SOE Reform Dilemma The central government’s SOE reform agenda is further complicated by the involvement of local governments (LGs). We have several observations: First, a meaningful SOE restructuring, which would require consolidating/liquidating some of the unprofitable SOE assets, may expose the LGs’ fiscal vulnerabilities to both investors and regulators. The fiscal weakness of China’s provincial-level governments is illustrated by the bond-payment default of Yongcheng Coal, a SOE from Henan Province. Henan is economically sound with GDP growth above the national average. However, when considering the province’s direct and hidden debt, debt servicing costs, and liquidity availability, Henan is in a group of 10 provinces with the worst fiscal conditions in 2020.3 This implies that LG officials may not have been able to bail out Yongcheng even if they wanted to. Moreover, cash-strapped LGs have reportedly formed reciprocal and entrenched relationships with local SOEs. These SOEs may carry debt for LGs and in turn, free up an LG’s borrowing capacity. When these SOEs fail, the credibility of LG officials may be questioned and investigated by the central government. As such, LGs are incentivized to protect their local SOEs. Chart 10More Defaults, More Bank Lending
China's SOE Reform Dilemma
China's SOE Reform Dilemma
Secondly, removing the government’s bailout of SOE debt defaults does not negate the underlying factor eroding SOE productivity: the government’s support of local SOEs with easier access to bank loans. Banks, which heavily influence LGs, are not always vigilant about risks associated with local SOE debt. Banks provide loans at preferential rates to localities and their affiliated SOEs. In return, LGs often award banks financing opportunities for profitable infrastructure projects. In this regard, local SOE bond defaults are not necessarily detrimental to bank profits because banks can make up their losses through financing more lucrative projects. Studies show that even when some LGs have experienced large-scale SOE bond defaults, lending to these LGs from commercial banks actually increased relative to other forms of financing (Chart 10). Beijing must take bold measures to break up the long-standing relationship between LGs and SOEs in order to achieve any market-oriented reform of local SOEs. The LGs will likely strongly resist severing the connection. Lastly, given that SOEs are often deployed to support the central government’s economic, political and strategic initiatives, LGs can use those grand initiatives to help justify their local SOEs’ existence - even unprofitable ones. Bottom Line: Beijing faces a tough choice between implementing effective SOE reforms and worsening local governments’ fiscal conditions with negative implications for economic growth. While allowing more SOE bond defaults can force investors to reprice SOE credit risks, as long as the implicit government support for SOEs through bank lending still exists, allocating capital to more efficient private-sector companies will be a formidable task. Investment Conclusions Some economists argue that China’s SOE debt should be considered part of public-sector leverage because many SOE investments are affiliated with government projects. Additionally, Chinese SOEs have accumulated massive assets, which can more than offset their debt4 and make SOE bonds and debt low- risk propositions. Moreover, even though the government may allow more SOE bond defaults, if the defaults threaten China’s financial stability, then the government can move non-performing debt from LGs and SOEs to the balance sheets of the central bank or central government. There are several issues with this argument. The stock of assets in a large portion of Chinese SOEs5 has persistently failed to generate sufficient cash flow to service debt, which implies that the true value of the assets may be low and will likely be sold at below cost when liquidated. It is not useful to compare book value of assets with debt because the true value of assets is contingent on the income/cash flow that they generate. We agree that public-sector leveraging/deleveraging is fundamentally a political choice in countries with control over their own monetary policy and debt is in local currency. Theoretically, a country can monetize public and private local currency-denominated debt via a central bank or government- controlled commercial banks. In such a case, the authorities will have little control over inflation, the exchange rate, and the long-term productivity. For now, Chinese policymakers seem to be on a path of accelerating reform, an indication that they want to avoid bailing out state firms and private-sector companies. In addition, President Xi’s “dual circulation” mantra emphasizes the importance of improving the country’s corporate efficiency and productivity. We think that consolidating some inefficient SOE sectors in the old economy fits such initiative. Our baseline view is that the SOE consolidation process will be gradual and the PBoC will provide sufficient liquidity in an effort to prevent market jitters. At the same time, the sharp turns in the policy rate in the past six months are prime examples of the periodic oscillation in China’s policymaking between maintaining economic stability and pursuing meaningful reforms. The policy swings will create mini-cycles for Chinese risk asset prices. Chinese stocks are not cheap compared with values at the start of the last policy tightening cycle (Chart 11A and 11B). We recommend a neutral position on domestic and investable equities for the time being. CHART 11AInvestable Stocks Are More Expensive Now Than Prior To The Last Tightening Cycle
Investable Stocks Are More Expensive Now Than Prior To The Last Tightening Cycle
Investable Stocks Are More Expensive Now Than Prior To The Last Tightening Cycle
CHART 11BA-Shares Are Less Expensive, But Valuations Are Still Elevated
China's SOE Reform Dilemma
China's SOE Reform Dilemma
Jing Sima China Strategist jings@bcaresearch.com Footnotes 1Based on the OECD estimates, SOEs’ share of China’s total corporate debt escalated from 46% in 2013 to roughly 80% in 2018. 2Banks included in the new appraisal system are state-owned and state-controlled commercial lenders, and other commercial banks may also refer to the guidelines. Lenders will be evaluated yearly and the results will be factored into the annual reviews of top bank executives as salary determinants. Each of the four new categories will carry an equal weighting. The “national development goals and real economy” category has four benchmarks: serving the government’s “ecological civilization strategy” to encourage lending for green industries and companies; serving strategic emerging industries; implementing the “two increases” - inclusive lending to micro and small enterprises; and implementing the “two controls” - nonperforming loans and borrowing costs of micro and small enterprises. The category “controlling and preventing risks” includes metrics on bad loan ratios, the nonperforming loan growth rate, provision coverage, liquidity ratios and capital adequacy ratios. 3“Seeing Through the Frosted Glass: Assessing Chinese Local Governments’ Creditworthiness”, Pengyuan Rating Public Finance Report, June 2020 4Chinese SOE assets are estimated to have reached 2.3 times China’s 2019 GDP, whereas their debt is close to 130% of GDP. 5IMF estimated that about a quarter of Chinese SOEs were operating at a loss in 2017. Cyclical Investment Stance Equity Sector Recommendations
Are Tech Titans Giving Way?
Are Tech Titans Giving Way?
Overconcentration of returns in a handful of stocks has been an overarching theme in a number of our 2020 publications. For instance, we separated the SPX in the S&P 5 vs. the S&P 495 in late-July, and showed how a handful of tech titan stocks dominated S&P 500 returns, especially since 2015. Roughly a month later these tech stocks peaked, and the normalization process began (top panel). It is remarkable that the S&P 5 are down in absolute terms since their September 2 crest, whereas the S&P 495 are up over 15%. The recent surge in the 10-year Treasury yield exacerbated the nosedive in relative share prices as it deals a blow to the bubbly valuation of the longest duration sector in the SPX: the tech sector. Crudely put, the steeper the selloff in the bond market the greater the fall in relative market capitalization (10-year Treasury yield shown inverted, middle & bottom panels). Bottom Line: Stick with a barbell tech sub-group positioning, preferring software and services to hardware and equipment, but stay tuned.
Highlights Strong/weak productivity growth leads to secular bull/bear markets in both equities and the currency. We illustrate why and how robust productivity gains can engender a virtuous self-reinforcing cycle that can run for many years. Detecting productivity for macro strategists is akin to doctors diagnosing a patient – it entails more art than science. Inflation, the real trade balance, and company profit margins constitute a litmus test for assessing productivity growth. Feature By far, the most critical variable determining long-term economic growth is a country’s productivity. This report presents why productivity matters for investors and examines how to gauge productivity growth given it is practically impossible to measure accurately. We use the framework presented in this report to analyze long-term trends in individual EM economies. In a follow-up piece, we will present a practical application of this framework by ranking developing economies according to their productivity and long-term growth potential. This report does not discuss what is needed to boost productivity because the policy prescriptions are well known and are widely available in economic literature. That said, we have outlined some of these in Box 1. BOX 1 The Basic Formula For Long-Term Growth For any economy, the potential growth rate is what can be achieved and sustained in the very long run. It can be expressed as follows: Potential (real) growth rate = productivity growth + labor force growth Given that we can use demographic data to approximate the number of people entering and exiting the labor force for each year over the next 18 years, the labor force growth variable can be easily estimated. Hence, the key unknown in the above formula is productivity growth. In a developing economy, it is difficult to measure productivity accurately (Chart 1). That is why when analyzing the long-term outlook, we first assess whether the country has effectively implemented the structural reforms needed to achieve faster productivity growth – some of which are listed below. We combine these observations with symptoms associated with either strong or weak productivity growth in order to assess an economy’s potential growth trajectory. Chart 1Productivity Growth Estimates For EM/China
Productivity Growth Estimates For EM/China
Productivity Growth Estimates For EM/China
Recommended policies to raise productivity growth typically include: building hard and soft infrastructure, improving education and training, investing in new technologies and equipment, promoting entrepreneurship and formation of new businesses, promoting competition, augmenting R&D spending, importing foreign “know how,” and fostering industry clusters that specialize in certain products or processes. Why Does Productivity Matter For Investors? Following are the investment implications of productivity growth: 1. Productivity is the sole driver of growing prosperity, which is reflected in rising per capita real incomes (Chart 2). Productivity = output per employee per hour = (real GDP or output) / (number of employees x number of hours worked) Rising productivity creates more income that is shared between employees and shareholders. If productivity rises by 5% and hourly wages increase by 2.5% in a year, unit labor costs will drop by 2.5%. In such a case, the 5% increase in productivity is shared equally between shareholders and employees. A lack of productivity gains and resulting stagnant income for both employees and business owners might lead to rising socio-political tensions and ultimately to political instability. 2. Strong productivity gains allow an economy to grow faster without experiencing high inflation (Chart 3). The upshot is reduced cyclicality in economic activity, i.e., business cycles are characterized by longer expansions and shallow and less frequent downturns. Equity investors will thus likely pay higher equity multiples due to the reduced cyclicality of corporate profits. Chart 2Productivity Is Ultimately Reflected In Rising Real Income Per Capita
Productivity Is Ultimately Reflected In Rising Real Income Per Capita
Productivity Is Ultimately Reflected In Rising Real Income Per Capita
Chart 3China: Strong Productivity Growth Has Kept A Lid On Inflation
China: Strong Productivity Growth Has Kept A Lid On Inflation
China: Strong Productivity Growth Has Kept A Lid On Inflation
The rationale is that robust productivity advances allow the economy to expand with low inflation with no need for monetary tightening. The relationship between productivity and inflation is discussed in detail below. A structurally low inflation environment allows policymakers to promptly deploy large monetary and fiscal stimulus when faced with economic downturns. In addition, low interest rates are also associated with higher equity valuations. On the contrary, a lack of productivity growth makes business cycles short-lived. Inflation will rise faster during a business cycle expansion in an economy with low productivity growth. In turn, interest rates will rise more rapidly in those economies, short-circuiting the expansion. Equity investors will be reluctant to pay high multiples for companies operating in such environments. 3. On a microeconomic level, high productivity gains are typically associated with higher profit margins and vice versa (Chart 4). Shareholders assign higher equity multiples to enterprises with higher profit margins and return on capital. Chart 4Faster Productivity Growth = Wider Corporate Profit Margins
Faster Productivity Growth = Wider Corporate Profit Margins
Faster Productivity Growth = Wider Corporate Profit Margins
Besides, wider profit margins allow companies to tolerate higher real interest rates. High real interest rates attract foreign fixed-income capital supporting the nation’s exchange rate. Given that labor costs make up a large share of costs in many companies, unit labor costs are a critical determinant of corporate profitability. Meanwhile, selling prices, sales as well as input prices are often beyond management control. Therefore, raising productivity (output per hour of an employee) is one of the few ways to lift corporate profitability and, by extension, return on capital. Unit labor costs = (wage per person per hour) / productivity 4. Rapid productivity advances allow companies to become more competitive without currency depreciation (Chart 5and Chart 6). Exchange rates of countries that achieve faster productivity growth typically appreciate in the long run. Chart 5Switzerland: High Productivity Has Sustained Competitiveness/Export Volumes Despite Currency Appreciation
Switzerland: High Productivity Has Sustained Competitiveness/Export Volumes Despite Currency Appreciation
Switzerland: High Productivity Has Sustained Competitiveness/Export Volumes Despite Currency Appreciation
Chart 6China and Vietnam: Rising Export Market Share Reflects Productivity Gains
China and Vietnam: Rising Export Market Share Reflects Productivity Gains
China and Vietnam: Rising Export Market Share Reflects Productivity Gains
Enterprises with higher productivity can drop their selling prices with limited impact on their profitability. By doing so, they can undercut their competitors and gain market share. Hence, solid productivity gains also entail a competitive currency, eliminating the need for central banks to hike interest rates in order to defend the exchange rate. 5. High indebtedness – in both public and private sectors – is easier to manage amid brisk productivity gains because the latter generate strong economic growth and relatively low nominal interest rates. Robust income gains among businesses and households, as well as for the government via taxation, enable indebted agents to service higher debt loads. Besides, nominal GDP growth above nominal interest rates arithmetically implies a drop in the public debt-to-GDP ratio. In brief, the economy could “grow into its debt” with robust productivity gains. In sum, strong/weak productivity growth leads to secular bull/bear markets in both equities and the currency. Rapid Productivity Gains Lead To A Virtuous Circle The following illustrates how robust productivity gains can engender a virtuous self-reinforcing cycle that can run for many years. Fast productivity gains allow for either fast wage or rapid corporate profit growth or a combination of the two. As income per capita rises, consumer spending grows and capital owners are willing to invest. New investments create new jobs and income and could also boost future productivity if substantial capital misallocation is dodged. The economy expands at a rapid rate, but inflation and, thereby, interest rates remain capped because the economy’s productive capacity grows in line with demand. Strong income and profit growth as well as stable borrowing costs lead to more credit demand from both households and businesses. Bank and non-bank credit expand but rapid household income gains and healthy enterprise profitability as well as growing government tax revenues support the private or public sectors’ debt servicing capacity. Robust economic growth, elevated real interest rates and high profitability attract foreign capital and foreign inflows lead to currency appreciation. Yet, such currency appreciation should not undermine the competitiveness of local producers – both exporters and those competing with imported goods. As discussed above, sizable productivity gains could reduce unit labor costs and allow domestic companies to drop their prices, sustaining their market shares in both export markets and domestically. Consequently, the trade balance does not deteriorate structurally despite a rapid expansion in domestic demand. Healthy balance of payments support the currency, i.e., the central bank does not need to hike interest rates or draw down reserves to defend the exchange rate. Finally, rapid corporate profit and household income growth as well as reasonably low nominal interest rates sustain high asset (equity and property) valuations for longer. Such a virtuous circle can persist until something breaks or major excesses – for example, capital misallocation, credit or property bubbles – emerge and then unravel. Meager Productivity Gains Lead To A Vicious Circle The following demonstrates how stagnant productivity can set in motion a vicious self-reinforcing circle. With no productivity gains, a business cycle recovery will likely lead to higher inflation sooner than later. The latter will short circuit the economic expansion as the central bank is forced to hike interest rates. If the central bank does not hike interest rates despite rising inflation, real (inflation-adjusted) interest rates will fall and could become negative. Low real rates are bearish for the currency. Either the central bank will be forced eventually to hike interest rates substantially or the exchange rate will continue depreciating. There are two reasons why low real interest rates are negative for the exchange rate: (1) low real borrowing costs will encourage more borrowing, spending, and investment. Such very strong domestic demand in the context of limited domestic productive capacity will lead to a ballooning trade deficit; and/or (2) low real interest rates will discourage foreign fixed-income capital inflows and weigh on the currency. With no productivity gains, any increase in wages will lead to rising unit labor costs and shrinking profit margins; corporate profitability and return on capital will plunge. The sole way to protect profitability amid rising unit labor costs is to raise selling prices. The latter could spur a wage-inflation spiral. Rising unit labor costs and resulting shrinking corporate profit margins leave domestic producers no room to reduce their selling prices to compete in export markets and with imports. The result is less exports, less import substitution and a deteriorating trade balance. In such a case, the only way to restore the competitiveness of domestic producers is to devalue the exchange rate. Declining or low returns on capital will discourage business investment, in general, and foreign direct investment (FDI) in particular with negative ramifications for future productivity. A worsening trade balance as well as diminishing foreign equity and FDI inflows also entail currency depreciation. This feeds into inflation and leads inevitably to monetary policy tightening. Such tightening prompts weaker growth, lower profitability and more foreign capital outflows. This vicious circle can persist until a major regime shift occurs: a dramatically devalued currency that stays very cheap or corporate restructuring and structural reforms that lead to higher productivity. Commodity Prices And Productivity A critical question to address regarding productivity in commodity producing countries is the issue of rising and falling commodity prices. Higher commodity prices lead to improved prosperity and vice versa. Does this mean that high commodity prices should be treated as productivity improvements? There is some ambiguity in regard to this but our preference is not to treat fluctuations in commodity prices as changes in the nation’s structural productivity. Let us consider the examples of Nigeria, which produces and exports oil, and Vietnam, which manufactures and ships smartphones in large quantities. Let us assume that smartphone exports are as important to Vietnam in generating income per capita as oil exports are to Nigeria. A doubling in oil prices amid flat oil export volumes would generate windfall oil revenues which would lift Nigeria’s income per capita. If smartphone prices remain constant but smartphone production and shipments (volumes) double, income per capita in Vietnam would rise as much as in Nigeria.1 The difference between these two scenarios in Nigeria and Vietnam is as follows: Nigeria would be made richer due to the price increases: it would be producing and exporting the same number of barrels of oil but a doubling in crude prices would augment income per capita in Nigeria. The problem is that Nigeria does not control oil prices. If oil prices decline, the nation’s income per capita would also drop substantially. Hence, there would have been no genuine (structural) productivity gains and Nigeria’s prosperity would be at the mercy of the global oil market. In the case of Vietnam, its productivity will have risen as it has succeeded in producing twice as many smartphones as it did last year. The country has built capacity, acquired technology and developed human skills to double smartphone production. This increased capacity, technology acquisition and skills cannot be taken away from Vietnam. This is a case of genuine productivity advancement. In fact, Vietnam could build on these skills and start producing other, more value-added goods. What if Nigeria doubled its oil output and export volume due to more investment and new technologies (as the US succeeded in doing with shale oil)? This scenario would qualify as genuine productivity gains. At any oil price scenario, Nigeria’s oil export revenues would double. The sole caveat is that the new oil production should have reasonably low breakevens, i.e., oil production should be viable even if oil prices decline. The same caveat is applicable to Vietnam. The difference between Nigeria (oil) and Vietnam (smartphones) is that commodities prices are much more volatile than manufactured goods prices. Bottom Line: In commodity producing countries, rising commodities prices have the same effect on income per capita as productivity gains. However, per capita income gains originating from higher commodities prices are reversable, i.e., not sustainable in the very long run. Consequently, higher commodity prices should not be treated as structural productivity gains. By contrast, productivity advancements – like Vietnam doubling its capacity to produce smartphones or Nigeria doubling its oil production volume – are non-reversable, i.e., they cannot be taken away. Hence, these constitute genuine productivity gains. Detecting Productivity Is Akin To Doctors Diagnosing A Patient Even in advanced countries, productivity is hard to measure accurately. Hence, any measure of productivity in developing economies should be used with a grain of salt. How do we carry out long-term analysis of developing economies when the key variable – productivity growth – is hard to measure? How do we make projections about productivity growth going forward? We see structural macro analysis as analogous to the work of doctors. When diagnosing a patient, doctors cannot necessarily observe what is happening in the patient’s body. Doctors conduct various tests and then analyze those results in the context of the symptoms. Putting it all together, they make a diagnosis and prescribe the necessary treatment. Similar to the manner in which doctors rely on symptoms and medical tests to determine where there is sufficient evidence of a disease, macro strategists do not see what is really occurring in their “patient’s” body, i.e., economies. Data for macro strategists is akin to medical tests for doctors. In developing countries, the quantity of economic data available to macro strategists is limited and of poor quality. Therefore, observing symptoms of economies under consideration and interpreting them correctly is crucial to the job of macro strategists for emerging economies. As they can count less on hard data and instead rely more on symptoms, their analysis is more of an art than a science. Symptoms Associated With Productivity: How To Detect Productivity At a country level, robust productivity gains are ceteris paribus typically associated with: A structurally improving real trade balance (exports minus import volumes), which is not due to a cheapened currency or a relapse in domestic demand but is due to domestic producers achieving the following: Becoming more competitive and gaining market share in global trade Succeeding in import substitution (imported products are crowded out by locally produced ones) Low inflation during an extended period of business cycle expansion Corporate profit margins expanding simultaneously with higher wages amid low inflation. A lack of productivity gains are ceteris paribus normally attendant with: A structurally deteriorating real trade balance as: Domestic producers lose market share in global exports Domestic producers lose market share to importers in local markets Rising inflation amid a moderate recovery in domestic demand Lingering downward pressure on corporate profit margins i.e., a modest rise in wage growth leads to a drop in corporate profit margins. On the whole, inflation, the real trade balance, and company profit margins constitute a litmus test for assessing productivity growth. A widening real trade deficit is a form of hidden inflationary pressure and a sign of lackluster productivity growth. The rationale is as follows: In a closed economy, when expanding demand outpaces the productive capacity of that economy, i.e., productivity gains do not keep up with thriving domestic demand, inflation will rise considerably. In short, rising inflation will be a symptom of paltry productivity gains. In an open economy, when domestic demand outpaces the productive capacity of that economy, inflation might not rise as demand could be satisfied by imports of foreign goods and services. In such a scenario, even though the trade balance will deteriorate, the currency might stay firm for a while because of foreign capital inflows or rising export (commodities) prices. As a result, inflation will stay low for some time. Eventually, when tailwinds from foreign capital inflows or high export prices cease, the currency will nosedive. Importers will have to raise prices in local currency causing a spike in inflation. Why would foreign capital inflows halt? Lackluster productivity gains amidst solid wage increases would cause a corporate profit margin squeeze and profitability will plummet. As a result, both FDI and equity inflows will dry up and the currency will depreciate. The latter will push up inflation considerably. In a nutshell, in an open economy poor productivity growth might not necessarily lead to high inflation where domestic demand can be satisfied by imports. In these cases, we can say that a widening real trade deficit is a form of hidden inflation. The only exception is when the real trade balance deteriorates due to imports of capital goods and/or new technologies that will be used to build new productive capacity. In such a case, a ballooning trade deficit should not be viewed as a form of hidden inflation and poor productivity growth. If consumer goods dominate imports, this would signify low chances of sizable productivity gains in a given country. If capital goods dominate imports, there are higher odds of future productivity gains. If these imported equipment and technologies are properly utilized, they will make the nation productive and competitive in the coming years. Higher productivity stemming from imports of these capital goods/new technologies, i.e., enlarged capacity to produce goods and services at lower costs, will cap inflation as well as expand exports and result in significant import substitution. A Checklist For Detecting Productivity Diagram 1 presents macro signposts that can be used to diagnose whether an economy is experiencing strong or weak productivity growth (these do not include traditional metrices such as education, R&D spending, strong governance, soft- and hard-infrastructure, etc.): Diagram 1A Checklist For Detecting Productivity
A Primer On Productivity
A Primer On Productivity
Arthur Budaghyan Chief Emerging Markets Strategist arthurb@bcaresearch.com Footnotes 1 We assume here that all inputs for smartphones are produced domestically, in Vietnam. This is not a realistic assumption, but we use it only to illustrate a macro point about productivity.
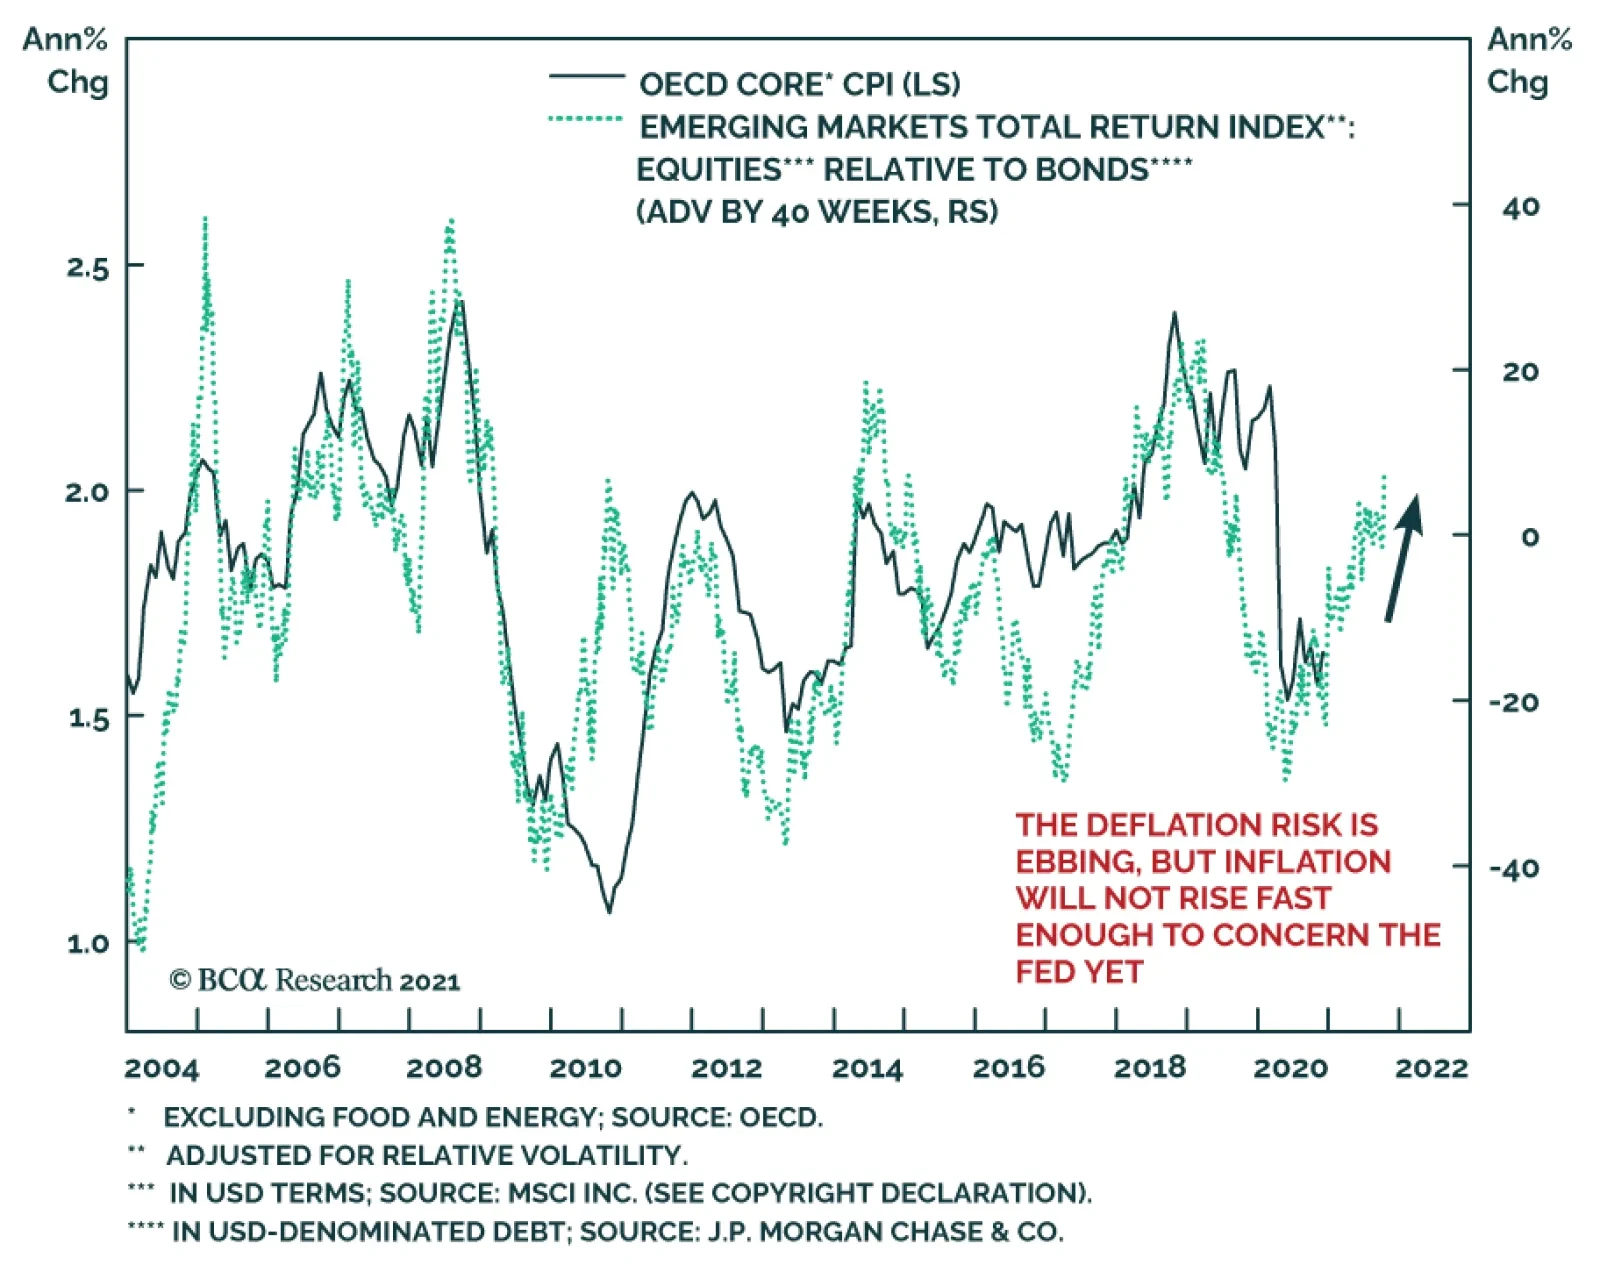
Much of the cyclical outlook for yields hinges on the outlook for inflation. For now, global core CPI continues to linger toward its nadir. However, important indicators suggest that it is set to trend higher in the coming quarters. One of the most…
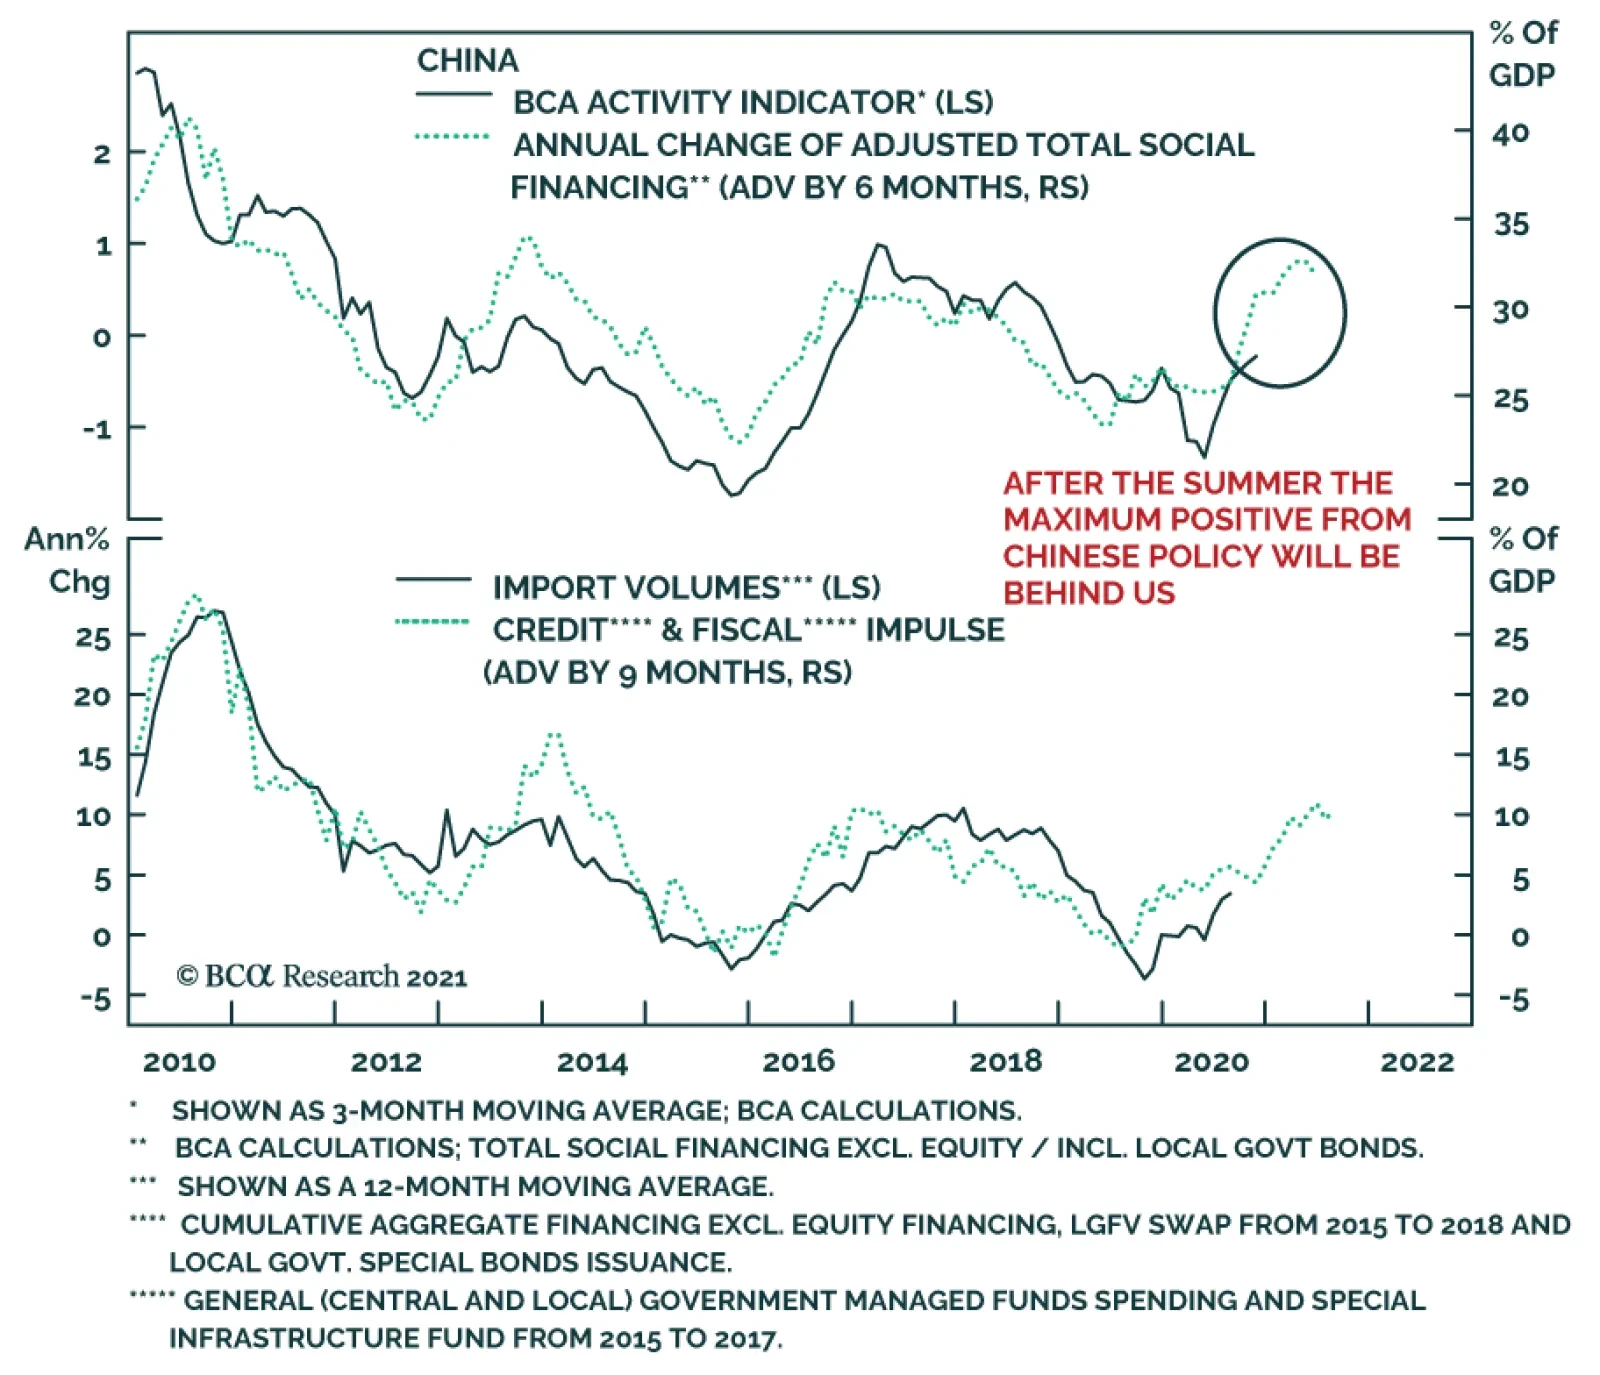
Chinese money supply decelerated in December, disappointing consensus expectations of a much more muted slowdown. M1 money supply grew 8.6% y/y, down from 10.0% y/y in November, and M2 decelerated to 10.1% y/y from 10.7% y/y. Similarly, aggregate financing…
(Part III) Don’t Overstay Your Welcome
(Part III) Don’t Overstay Your Welcome
Consistent with the previous Insight’s cautionary tone, we recommend investors book gains of 16% on the small size bias that we have been exploring since the October 26, 2020 inception (top panel) and 6% since the high-conviction calls report on December 7, 2020. Small caps have gone parabolic since late October and the small/large 13-week rate of change annualized momentum is at the highest print since the dotcom bubble era breaching 100%/annum recently (second panel), and second largest ever in the history of our data set (not shown). The top 10 constituents of small cap indexes are now populated by highly speculative names (see here and here) and in the Russell 2000 specifically the weights of some of the top 10 constituents have jumped to more than 10 fold from the 0.05% median weight to over 0.5% weight. In other words, elements of frothiness are also evident in small cap indexes. At least a pause for breath is likely in the next three months and we opt to move to the sidelines and downgrade the size bias back down to neutral. Finally, we are also shifting the 10% stop in our long “Back-To Work”/short “COVID-19 Winners” pair trade baskets to a 5% rolling stop in order to protect gains of over 25% since the September 8, 2020 inception (bottom panel). Bottom Line: The easy money has been made in the small/large ratio, lock in gains and step aside. Today we also switch our trailing 10% stop to a rolling 5% stop in the long “Back-To Work”/short “COVID-19 Winners” pair trade baskets. Stay tuned.