Equities

(Part II) Downgrade Alert On Cyclicals Versus Defensives
(Part II) Downgrade Alert On Cyclicals Versus Defensives
The previous Insight highlighted the similarities between the 2009/10 episode and today, when the SPX troughed in March 2009 similar to the recent recessionary trough in March 2020. Our biggest worry is the reflex rebound in the dollar. Everyone is short dollars and this one-sided bet is at risk of capsizing the ship. Importantly, interest rate differentials will likely start to push the greenback higher. The bottom panel of the chart shows that since the August trough, 10-year US Treasury yields have more than doubled to over 1.1%, whereas the 10-year bund yield has stayed muted at -0.5%. Additional US fiscal easing along with the sustained rebound in the US economy should continue to weigh on bond prices and further push interest rates higher and eventually stock valuations lower. This accumulated interest rate pressure will at the margin start to weigh on EUR / USD. As a result, the near parabolic move in cyclicals versus defensives will at least go on hiatus. We are putting the S&P utilities sector on upgrade alert and the S&P materials sector on downgrade alert and once we execute these moves our portfolio will hopefully monetize double digit gains since the July 27, 2020 inception, and will push our cyclicals/defensives portfolio bent back to even keel. Bottom Line: Prepare to lock in gains in the cyclicals versus defensives portfolio bent (via downgrading materials and upgrading utilities), this ratio is now on our downgrade watch list (please see the next Insight).
(Part I) Turn Cautious On The SPX
(Part I) Turn Cautious On The SPX
Last autumn during the 10% SPX correction, we started to reposition the portfolio to benefit from the reopening trade and initiated our long “Back-To-Work”/short “COVID-19 Winners” trade, implemented a small cap size bias, reiterated our cyclicals / defensives portfolio bent by downgrading the S&P pharma index to underweight (which pushed the S&P health care to neutral) and crystalized handsome gains in our VIX futures trade.
(Part I) Turn Cautious On The SPX
(Part I) Turn Cautious On The SPX
We were arguing that stocks would glide lower into the election and then take off as geopolitical in general and election in particular uncertainty would subside and also seasonality would switch from a headwind to a powerful tailwind for stocks. One week following the election we updated our three EPS scenarios for 2021 and also upped our calendar 2021 EPS estimate to $168, from $162 previously, and lifted our SPX target for end-2021 to 4,000. Since then, the SPX is up nearly 600 points and we are now compelled to turn wary. Keep in mind that the S&P 500 has fully discounted the 24% EPS growth for calendar 2021 and now that we are in early 2021 and the market will soon look into calendar 2022 EPS, we doubt that the sell side’s $196 EPS level which translates into 17% EPS growth rate is attainable, especially given the specter of rising corporate taxes. The higher the SPX will rise in the near-term the more it will eat into future returns and thus push down the expected return. Equity flows are very powerful both from sidelined cash coffers, which are getting replenished from fiscal easing packages and from investors fleeing bonds. The implication is that timing the exact turn is difficult. The chart (on the previous page) shows that 2009/10 is an interesting parallel to draw, which we used recently when we initiated a VIX futures hedge to our high-conviction calls for the June 2021 expiry, as a number of asset classes signal that it is prudent to be cautious especially on the prospects of the broad equity market. Applying the SPX return from the 2009 trough to the 2010 peak, implies that the SPX can rise to 4,010 if history at least rhymes. Given recent bubble talk in the media, using the October 1998 to March 2000 parallel and applying that SPX return would imply an SPX level of 3,687 (see table). Our sense is that the further we rise the bigger the snapback will be and a retest of the October 2020 lows is a high probability event. Thus, from a tactical perspective we are not willing to risk 100-200 points of upside for a potential 800-point drawdown. One enticing synthetic long trade recommendation we are initiating is to buy a $390/$410 call spread on the SPY ETF and sell a $340 put for March 19 expiry for a modest cost of $0.67 per contract. The June expiry is a good alternative for more conservative investors with an actual $2.85 per contract cash inflow. This is not a speculative trade; it is a way to deploy fresh capital (i.e. covered position) at a much lower S&P 500 level given our still sanguine broad equity market view on a cyclical 9-12 month time horizon. This way we can partially participate (as we cap our gains) in the unfolding mania, and if markets turn around, as we expect on a near-term tactical basis, this trade goes long the SPY at a much lower level. Bottom Line: The board equity market risk/reward tradeoff is to the downside for the next three months on a tactical basis (please see the next Insight).
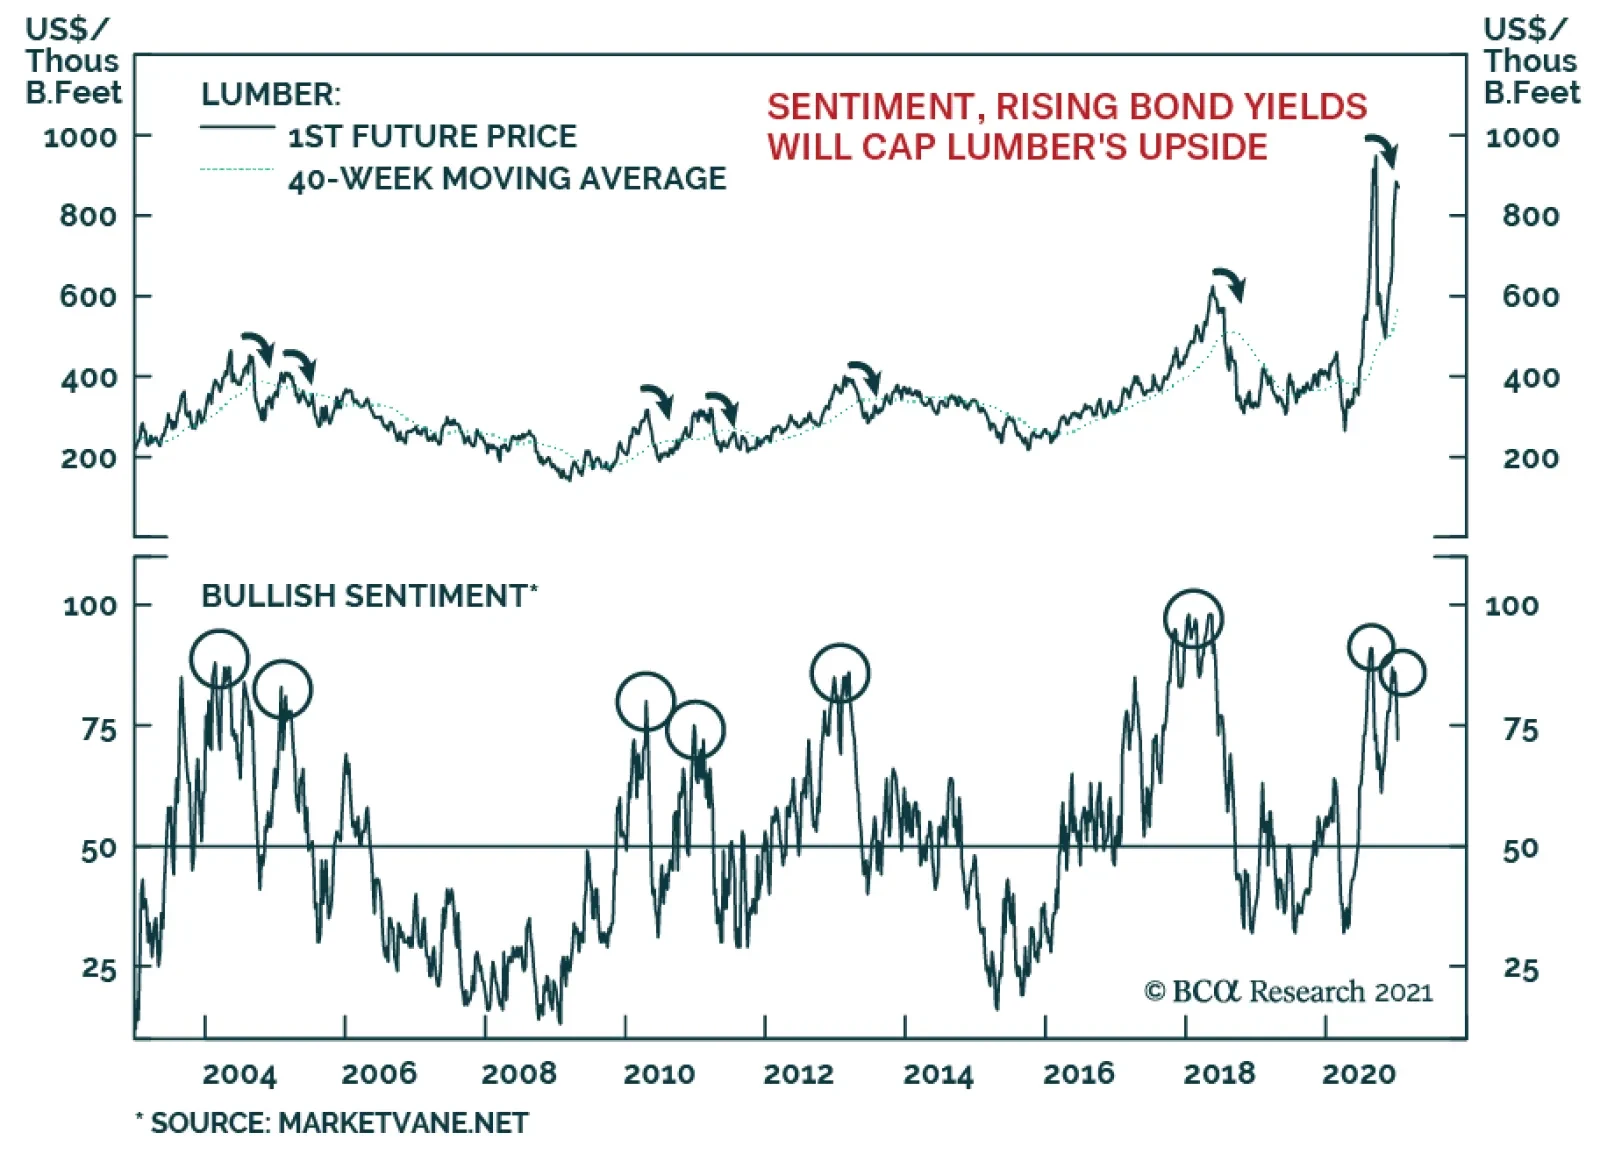
After an impressive run-up in mid-December, lumber prices now appear over-stretched and vulnerable to the downside. For one, sentiment is at levels that marked tops in the past, suggesting that prices are susceptible to a sell-off. Moreover, bond yields…
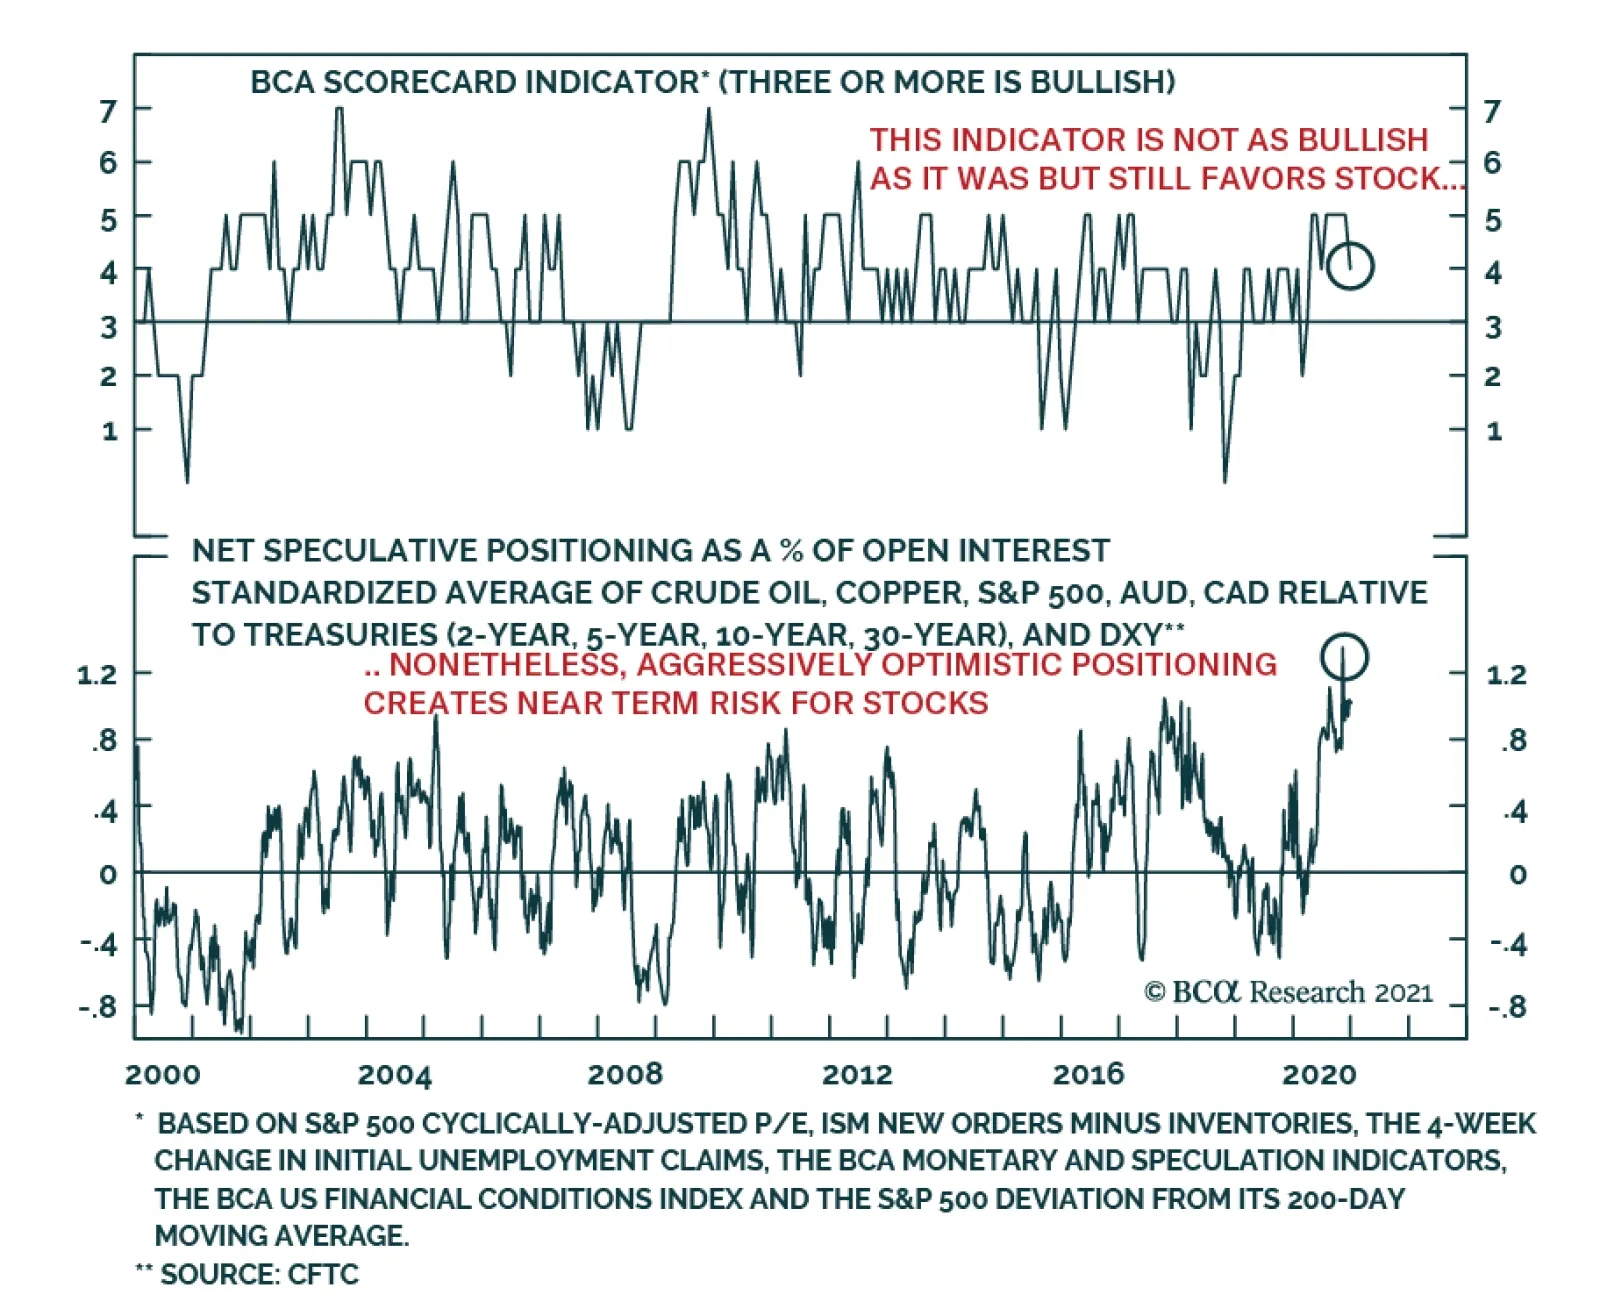
The economic and policy outlook remains conductive to higher risk asset prices on a cyclical basis. In fact, our BCA Scorecard Indicator remains well into bullish territory and is therefore consistent with stronger stock prices over the remainder of 2021. …
Highlights We remain constructive on the economy and financial markets, … : US households have stored up a great deal of dry powder for consumption once the economy fully reopens, last month’s stopgap fiscal measures will help relieve pressure on the most vulnerable households, and the Georgia Senate results ensure that even more fiscal transfers are in store. … but there is a non-negligible risk that investors will get too excited about the positive backdrop: The exceedingly supportive policy backdrop could easily help the S&P 500 push into the low 4,000s, but it’s not clear what investors will have to look forward to for the rest of 2021 if it ascends to that level early in the year. We do not share the bubble-spotters’ alarm, but we are willing to study their arguments: We like to test our convictions by seeking out opposing views and we therefore read Jeremy Grantham’s bubble essay with great interest. We do not share his urgent concern, and our recommended asset allocations are nearly the mirror image of his, but we are taking a deep dive into his view and its implications. Feature As a grad student on the South Side of Chicago, I used to run on the bike path along the lake. On windless days, the three or four miles north from Hyde Park Boulevard felt especially easy, and I would think, “this is what it’s like when there’s no wind.” Then I’d head for home and discover there’d been a breeze behind me all along. A mile or two in, I’d realize it was no breeze and marvel at how I hadn’t noticed it on the way out. The moral of the story, as I told it then, is that if you think it’s not windy in Chicago, just turn around. Now it seems that it has a broader, weightier lesson: it can be easy to miss the wind when it’s behind you. Jeremy Grantham’s carefully reasoned bubble warning, posted online last Tuesday,1 has inspired us to re-examine our outlook and how widely it’s shared. We are not changing our view – we remain vigilantly bullish – but it is worth devoting ample time to consider the risks to it. This week, we highlight the elements of Grantham’s piece that most caught our attention; next week, we will discuss strategies to try to reduce an investor’s vulnerability to them. The Belated Blue Wave Grantham’s essay highlights vulnerabilities that could come to the fore sometime in the near future, but the Democratic sweep of Georgia’s Senate seats has immediate market implications. By virtue of Vice President-elect Harris’s tie-breaking vote, the Democrats will hold a majority in the 50-50 chamber beginning January 20th. The outcome ensures that the Biden administration will have slim majorities in both houses of Congress for its first two years (pending appointments and special elections). Although a five-seat House majority and the slimmest possible Senate majority will not give the incoming administration carte blanche to enact sweeping legislative changes, it will have an easier time pursuing its agenda than it would have had the Republicans held on to just one of the Georgia Senate seats. Item number one on that agenda is likely to be bulked-up fiscal aid for struggling households, states and municipalities. The economic and market significance of the blue wave is that Congress can now become a full partner supporting the monetary policy aim of erring to the side of providing too much accommodation. With the Fed pledging that it won’t take its foot off the gas any time soon, revived fiscal spending will provide the economy with an incremental reflationary boost that should benefit risk assets. Fiscal transfers will be at least partially funded with increased taxes on corporations and high-earning individuals. Profit margins will narrow, but empirical evidence of a relationship between tax rates and economic growth is elusive (Chart 1). Economic growth is largely a function of growth in the size of the working-age population and growth in productivity. Investment leads productivity – workers become more productive when endowed with more and better tools – but history suggests that investment spending is indifferent to corporate tax rates (Chart 2), as is productivity (Chart 3). Chart 1We Don't Like Taxes, Either ...
We Don't Like Taxes, Either ...
We Don't Like Taxes, Either ...
Chart 2... But They Do Not Seem To Impact Investment ...
... But They Do Not Seem To Impact Investment ...
... But They Do Not Seem To Impact Investment ...
Chart 3... Or Productivity Growth
... Or Productivity Growth
... Or Productivity Growth
We are disposed to agree with the idea that higher taxes are a drag on growth. Transferring spending power from the private sector to government apparatchiks is not likely to improve efficiency. Business executives are as fallible as any other experts, however, and changes in tax rates have a smaller multiplier effect than the proposed spending measures. Net-net, we expect that the outcome of the Georgia run-offs will lead to slightly higher interest rates, a steeper yield curve, increased consumption and fewer defaults, a welcome mélange for credit performance and the equities that were left behind as investors flocked to COVID winners. A Slippery Slope Chart 4Bull Markets Tend To Go Out With A Bang
Let's Not Get Carried Away
Let's Not Get Carried Away
[G]reat bubbles are where fortunes are made and lost – and where investors truly prove their mettle. For positioning a portfolio to avoid the worst pain of a major bubble breaking is likely the most difficult part. Every career incentive in the industry and every fault of individual human psychology will work toward sucking investors in. [Emphasis added.] As Jeremy Grantham lays it out, the latter stages of a bull market are especially perilous. Given that bull markets run hot before they end (Chart 4), it becomes fiendishly difficult to resist their pull. The recency bias drives an investor to focus on the most recent data points to the exclusion of older ones, pointing to higher expected returns than might be inferred from a more comprehensive sample. The phenomenon encourages equity overexposure at inopportune times if returns are mean-reverting. Professional investors are as susceptible to recency bias and overconfidence (fueled by having had the wind at their back) as non-professionals, and their judgment can be additionally clouded by career pressures. Those who achieve the longest tenures are at least subconsciously attuned to Keynes’ dictum that it is better to fail conventionally than to succeed unconventionally. Staying at the party too long with lots of others may hold far less risk than staking out a solitary position. The bottom line is that asset management incentives encourage groupthink, especially as late-stage bull markets go into overdrive. Dizzying Heights The long, long bull market since 2009 has finally matured into a fully-fledged epic bubble. Featuring extreme overvaluation, explosive price increases, frenzied issuance, and hysterically speculative investor behavior, I believe this event will be recorded as one of the great bubbles of financial history[.] Bubbles are only identifiable in retrospect, but several aspects that financial historian Charles Kindleberger associated with manias are evident. Money is cheap and readily available and valuations are quite high. One could argue that anticipation of short-term capital gains is drowning consideration of future earnings for at least some equity investors or, as Grantham puts it, “stocks [are] rising … simply because they are rising.” Make no mistake: Equity valuations are demanding and de-rating appears more likely than continued re-rating. The main valuation metrics clearly indicate that equities are richly priced. The S&P 500’s forward earnings multiple is hovering around two standard deviations above the mean, at heights previously reached only in the late ‘90s and early ‘00s (Chart 5). Price-to-sales is at an all-time high, three standard deviations above the mean (Chart 6, top panel), while book (Chart 6, middle panel) and cash flow multiples (Chart 6, bottom panel) are elevated but not yet extreme. Price-to-sales should rise if markets believe pandemic-induced margin pressure is temporary and will reverse once the country is vaccinated, but the one-plus-sigma surge above pre-COVID levels would seem to be a bit much. Chart 5Equity Valuations Are Pushing The Envelope
Equity Valuations Are Pushing The Envelope
Equity Valuations Are Pushing The Envelope
Chart 6Making A Run At '99-'00
Making A Run At '99-'00
Making A Run At '99-'00
Equity option and IPO activity is redolent of euphoria and overtrading. Equity call option volume has surged to record levels (Chart 7, top panel), reportedly on the back of an explosion in small retail activity, and the put-call ratio has fallen to dot-com-bubble levels as demand for exposure has swamped demand for protection (Chart 7, bottom panel). New IPOs have been coming fast and furious (Chart 8, top panel) at a relatively tender average age (Chart 8, bottom panel). Sponsors’ shift away from hoarding early- and middle-stage returns to inviting the public to share them may prove to be telling. There are many reasons to sell equity interests, but expecting them to blast higher isn’t typically one of them. Chart 7The Merry Men Of Sherwood Forest Have Discovered Options Are A Gas, Too
The Merry Men Of Sherwood Forest Have Discovered Options Are A Gas, Too
The Merry Men Of Sherwood Forest Have Discovered Options Are A Gas, Too
Chart 8Take The Money And Run
Take The Money And Run
Take The Money And Run
The Legend Who Cried Wolf This isn’t the first time Grantham or one of his colleagues has expressed concern about rising stock prices. It may be unduly harsh to call him a perma-bear, but GMO has consistently underestimated equities and the firm has seen its assets under management (AUM) cut in half over the last five years, to $60 billion, while its flagship asset allocation fund has lost over 60% of AUM. As an RIA firm executive told a Bloomberg reporter, “I can see how clients lose patience with them. They get defensive way before anybody else.2” It’s important to recognize different commentators’ biases/agendas when evaluating their arguments. Grantham calls out the broker-dealers as perpetual market cheerleaders, but he has a stake in convincing GMO clients and prospects that value investing principles are still relevant. BCA’s business model is far more insulated from markets’ direction, but our research services have a bias to fit inherently unruly markets into tidy narratives. Disclosing the risks to our views is an essential part of our process, but the hypotheses we reject will always get less of an airing than the ones we embrace – no investor has time to read weekly 50-page deliberations. Why Now? The canonical BCA question – So What? – is meant to keep researchers focused on the market relevance of their inquiries. But we have long advocated for a second question – Why Now? – to keep our focus on timeliness. Spotting imbalances, which can take a maddeningly long time to reverse, isn’t enough to earn alpha. To translate macro analysis into promising investment ideas, an investor also needs to identify potential catalysts that might unwind the imbalance. Bull markets become exhausted once so much capital is invested in them that there is no one left to keep buying, just as bear markets end when the urgency to sell dissipates. Sentiment can offer clues into remaining buying or selling power, and the day before the Grantham piece appeared, an experienced financial advisor with a stellar portfolio management record emailed that, “This is one of the few times in my career where I feel like the market is simple and the consensus is right. It almost always feels like there is something obviously bad on the horizon but this market feels like there is really good news on the horizon.” I have known him for over 30 years and can attest to his intelligence, diligence and savvy. His clients are in excellent hands and his constructive take may well be spot on. Indeed, we hope so, since it dovetails with ours, but his assurance gave us pause. For now, it doesn't seem to be universal, as it contrasted starkly with this musing from another trusted confidante (a family office CIO) as 2020 was winding down, “What can be said about work other than make certain we don’t mistake this bull market for brilliance.” Valuation is a notoriously lousy timing indicator and sentiment is a squishy concept that is hard to pin down. Both can remain stretched for a long period of time. An investor shouldn't bet against them unless s/he has a good reason for believing they are on the verge of reversing. Perhaps not having to run on the relative performance hamster wheel like most professional investors gives the family office CIO, who also has a great track record, a little broader perspective, but every investor could use a dose of humility. Skepticism is an essential component of successful investing as well, especially as stocks are making new highs. If you think it’s not windy … Investment Implications We respect Jeremy Grantham’s experience and formidable accomplishments and listen closely to any insights he’s willing to share. We acknowledge that there are many signs of froth across financial markets and that the Kindleberger red line of purchasing assets without regard to their intrinsic merit could be crossed in the not-too-distant future. We echo the sentiment that central bankers are not omnipotent and that easy monetary policy is not a magical elixir. We do, however, assert that the combination of extremely easy monetary policy and a new round of fiscal aid offers equities and spread product a supportive backdrop that should be expected to hold throughout the year provided that markets don’t get over their skis by bidding up asset prices too far. The bottom line is that market vulnerabilities are cropping up but we disagree with the view that they are about to bring an end to risk asset outperform-ance. We remain overweight equities and spread product while keeping an eye out for anything untoward. As we have been saying for several weeks, we are bullish, albeit vigilantly so. One of our roles is to worry for our clients, and we are scanning the horizon for signs of trouble even more thoroughly than normal. Until we see those signs, or until risk asset prices rise so much that they sour their risk-reward prospects, we will stick with our call. On the last point, we are in complete agreement with Grantham: The one reality that you can never change is that a higher-priced asset will produce a lower return than a lower-priced asset. You can’t have your cake and eat it. You can enjoy it now, or you can enjoy it steadily in the distant future, but not both – and the price we pay for having this market go higher and higher is a lower 10-year return from the peak. Doug Peta, CFA Chief US Investment Strategist dougp@bcaresearch.com Footnotes 1https://www.gmo.com/americas/research-library/waiting-for-the-last-dance/ Accessed January 5, 2021. Grantham is the octogenarian co-founder of Grantham, Mayo and van Otterloo (GMO), a value-oriented asset manager for institutional investors. 2 McDonald, Michael. "Grantham’s Bear Market Call Tests Patience of GMO Fund Investors," Bloomberg, November 24, 2020.
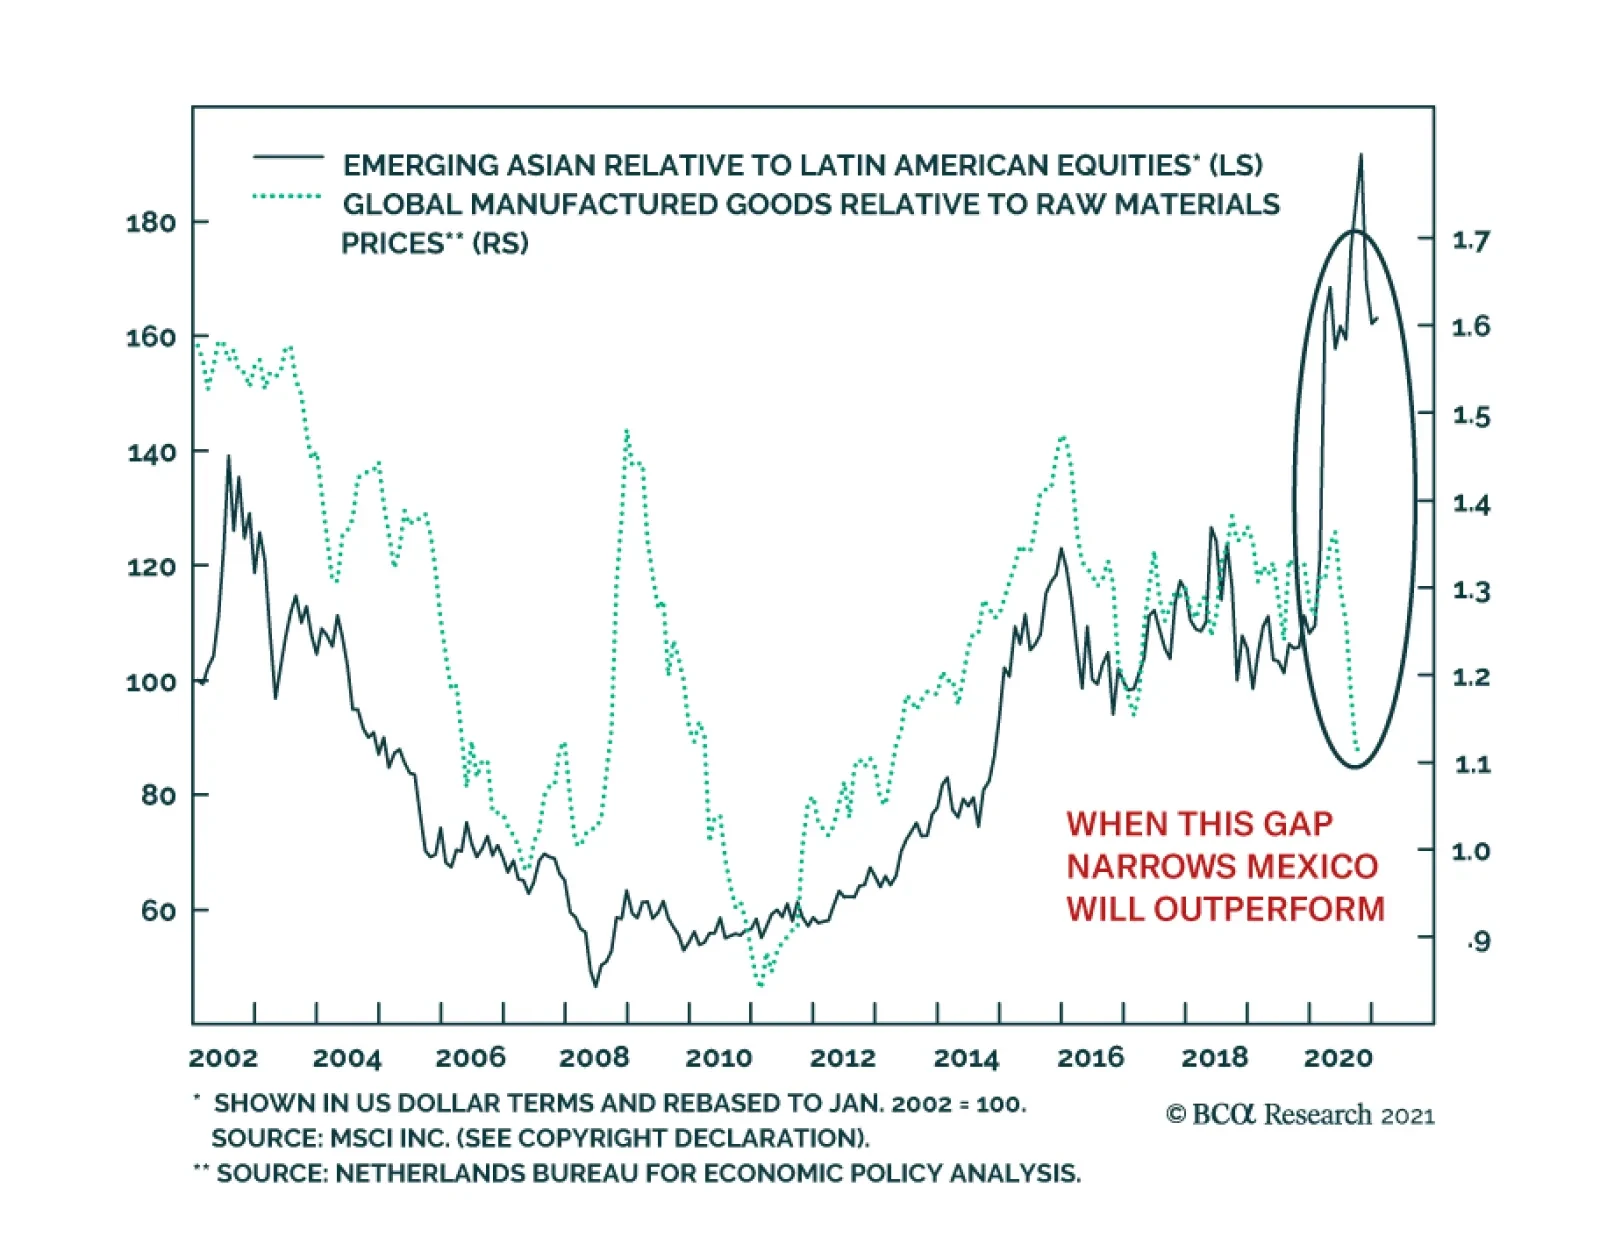
EM Asian equities have enjoyed an outsized outperformance versus EM ones in general and Latin American ones in particular over the past 12 years. This trend is under threat. From 2010 to early 2020, the relative performance of Asian equities closely…
Markets have rallied on the back of easy fiscal and monetary conditions, both of which will boost growth this year, especially now that vaccines will allow for a more permanent softening of rolling lockdowns in the second half of 2021. However, a virtuous…
Highlights Markets largely ignored the uproar at the US Capitol on January 6 because the transfer of power was not in question. Democratic control over the Senate, after two upsets in the Georgia runoff, is the bigger signal. US fiscal policy will become more expansive yet the Federal Reserve will not start hiking rates anytime soon. This is a powerful tailwind for risk assets over the short and medium run. Politics and geopolitics affect markets through the policy setting, rather than through discrete events, which tend to have fleeting market impacts. The current setting, in the US and abroad, is negative for the US dollar. The implication is positive for emerging market stocks and value plays. Go long global stocks ex-US, long emerging markets over developed markets, and long value over growth. Cut losses on short CNY-USD. Feature Chart 1Market's Muted Response To US Turmoil
Market's Muted Response To US Turmoil
Market's Muted Response To US Turmoil
Scenes of mayhem unfolded in the US Capitol on January 6 as protesters and rioters flooded the building and temporarily interrupted the joint session of Congress convened to count the Electoral College votes. Congress reconvened later and finished the tally. President-elect Joe Biden will take office at noon on January 20. Financial markets were unperturbed, with stocks up and volatility down, though safe havens did perk up a bit (Chart 1). The incident supports our thesis that the US election cycle of 2020 was a sort of “Civil War Lite” and that the country is witnessing “Peak Polarization,” with polarization likely to fall over the coming five years. The incident was the culmination of the past year of pandemic-fueled unrest and President Trump’s refusal to concede to the Electoral College verdict. Trump made a show of force by rallying his supporters, and apparently refrained from cracking down on those that overran Congress, but then he backed down and promised an orderly transfer of power. The immediate political result was to isolate him. Fewer Republicans than expected contested the electoral votes in the ensuing joint session; one Republican is openly calling for Trump to be forced into resignation via the 25th amendment procedure for those unfit to serve. The electoral votes were promptly certified. Vice President Mike Pence and other actors performed their constitutional duties. Pence reportedly gave the order to bring out the National Guard to restore order – hence it is possible that Pence and Trump’s cabinet could activate the 25th amendment, but that is unlikely unless Trump foments rebellion going forward. Vandals and criminals will be prosecuted and there could also be legal ramifications for Trump and some government officials. Do Politics And Geopolitics Affect Markets? The market’s lack of concern raises the question of whether investors need trouble themselves with politics at all. Philosopher and market guru Nassim Nicholas Taleb tweeted the following: If someone, a year ago, described January 6, 2021 (and events attending it) & asked you to guess the stock market behavior, admit you would have gotten it wrong. Just so you understand that news do not help you understand markets.1 This is a valid point. Investors should not (and do not) invest based on the daily news. Of course, many observers foresaw social unrest surrounding the 2020 election, including Professor Peter Turchin.2 Social instability was rising in the data, as we have long shown. When you combined this likelihood with the Fed’s pause on rate hikes, and a measurable rise in geopolitical tensions between the US and other countries, the implication was that gold would appreciate. So if someone had told you a year ago that the US would have a pandemic, that governments would unleash a 10.2% of global GDP fiscal stimulus, that the Fed would start average inflation targeting, that a vaccine would be produced, and that the US would have a contested election on top of it all, would you have expected gold to rise? Absolutely – and it has done so, both in keeping with the fall in real interest rates plus some safe-haven bonus, which is observable (Chart 2). Chart 2Gold Price In Excess Of Fall In Real Rates Implies Geopolitical Risk
Gold Price In Excess Of Fall In Real Rates Implies Geopolitical Risk
Gold Price In Excess Of Fall In Real Rates Implies Geopolitical Risk
The takeaway is that policy matters for markets while politics may only matter briefly at best. Which brings us back to the implications of the Trump rebellion. What Will Be The Impact Of The Trump Rebellion? We have highlighted that this election was a controversial rather than contested election – meaning that the outcome was not in question after late November when the court cases, vote counts, and recounts were certified. This was doubly true after the Electoral College voted on December 14. The protests and riots yesterday never seriously called this result into question. Whatever Trump’s intentions, there was no military coup or imposition of martial law, as some observers feared. In fact the scandal arose from the President’s hesitation to call out the National Guard rather than his use of security forces to prevent the transfer of power, as occurs during a coup. This partially explains why the market traded on the contested election in December 2000 but not in 2020 – the result was largely settled. The Biden administration now has more political capital than otherwise, which is market-positive because it implies more proactive fiscal policy to support the economic recovery. Trump’s refusal to concede gave Democrats both seats in the Georgia Senate runoffs, yielding control of Congress. Household and business sentiment will revive with the vaccine distribution and economic recovery, while the passage of larger fiscal stimulus is highly probable. US fiscal policy will almost certainly avoid the mistake of tightening fiscal policy too soon. Taken with the Fed’s aversion to raising rates, greater fiscal stimulus will create a powerful tailwind for risk assets over the next 12 months. The primary consequence of combined fiscal and monetary dovishness is a falling dollar. The greenback is a counter-cyclical and momentum-driven currency that broadly responds inversely to global growth trends. But policy decisions are clearly legible in the global growth path and the dollar’s path over the past two decades. Japanese and European QE, Chinese devaluation, the global oil crash, Trump’s tax cuts, the US-China trade war, and COVID-19 lockdowns all drove the dollar to fresh highs – all policy decisions (Chart 3). Policy decisions also ensured the euro’s survival, marking the dollar’s bottom against the euro in 2011, and ensuring that the euro could take over from the dollar once the dollar became overbought. Today, the US’s stimulus response to COVID-19 – combined with the Fed’s strategic review and the Democratic sweep of government – marked the peak and continued drop-off in the dollar. Chart 3Euro Survival, US Peak Polarization, Set Stage For Rotation From USD To EUR
Euro Survival, US Peak Polarization, Set Stage For Rotation From USD To EUR
Euro Survival, US Peak Polarization, Set Stage For Rotation From USD To EUR
Chart 4China's Yuan Says Geopolitics Matters
China's Yuan Says Geopolitics Matters
China's Yuan Says Geopolitics Matters
The Chinese renminbi is heavily manipulated by the People’s Bank and is not freely exchangeable. The massive stimulus cycle that began in 2015, in reaction to financial turmoil, combined with the central bank’s decision to defend the currency marked a bottom in the yuan’s path. China’s draconian response to the pandemic this year, and massive stimulus, made China the only major country to contribute positively to global growth in 2020 and ensured a surge in the currency. The combination of US and Chinese policy decisions has clearly favored the renminbi more than would be the case from the general economic backdrop (Chart 4). Getting the policy setting right is necessary for investors. This is true even though discrete political events – including major political and geopolitical crises – have fleeting impacts on markets. What About Biden’s Trade Policy? Trump was never going to control monetary or fiscal policy – that was up to the Fed and Congress. His impact lay mostly in trade and foreign policy. Specifically his defeat reduces the risk of sweeping unilateral tariffs. It makes sense that global economic policy uncertainty has plummeted, especially relative to the United States (Chart 5). If US policy facilitates a global economic and trade recovery, then it also makes sense that global equities would rise faster than American equities, which benefited from the previous period of a strong dollar and erratic or aggressive US fiscal and trade policy. Trump’s last 14 days could see a few executive orders that rattle stocks. There is a very near-term downside risk to European and especially Chinese stocks from punitive measures, or to Emirati stocks in the event of another military exchange with Iran (Chart 6). But Trump will be disobeyed if he orders any highly disruptive actions, especially if they contravene national interests. Beyond Trump’s term we are constructive on all these bourses, though we expect politics and geopolitics to remain a headwind for Chinese equities. Chart 5Big Drop In Global Policy Uncertainty
Big Drop In Global Policy Uncertainty
Big Drop In Global Policy Uncertainty
US tensions with China will escalate again soon – and in a way that negatively impacts US and Chinese companies exposed to each other. Chart 6Geopolitical Implications Of Biden's Election
Geopolitical Implications Of Biden's Election
Geopolitical Implications Of Biden's Election
The cold war between these two is an unavoidable geopolitical trend as China threatens to surpass the US in economic size and improves its technological prowess. Presidents Xi and Trump were merely catalysts. But there are two policy trends that will override this rivalry for at least the first half of the year. First, global trade is recovering– as shown here by the Shanghai freight index and South Korean exports and equity prices (Chart 7). The global recovery will boost Korean stocks but geopolitical tensions will continue to brood over more expensive Taiwanese stocks due to the US-China conflict. This has motivated our longstanding long Korea / short Taiwan recommendation. Chart 7Global Economy Speaks Louder Than North Korea
Global Economy Speaks Louder Than North Korea
Global Economy Speaks Louder Than North Korea
Chart 8China Wary Of Over-Tightening Policy
China Wary Of Over-Tightening Policy
China Wary Of Over-Tightening Policy
Chart 9Global Stock-Bond Ratio Registers Good News
Global Stock-Bond Ratio Registers Good News
Global Stock-Bond Ratio Registers Good News
Second, China’s 2020 stimulus will have lingering effects and it is wary of over-tightening monetary and fiscal policy, lest it undo its domestic economic recovery. The tenor of China’s Central Economic Work Conference in December has reinforced this view. Chart 8 illustrates the expectations of our China Investment Strategy regarding China’s credit growth and local government bond issuance. They suggest that there will not be a sharp withdrawal of fiscal or quasi-fiscal support in 2021. Stability is especially important in the lead up to the critical leadership rotation in 2022.3 This policy backdrop will be positive for global/EM equities despite the political crackdown on General Secretary Xi Jinping’s opponents will occur despite this supportive policy backdrop. The global stock-to-bond ratio has surged in clear recognition of these positive policy trends (Chart 9). Government bonds were deeply overbought and it will take several years before central banks begin tightening policy. What About Biden’s Foreign Policy? Chart 10OPEC 2.0 Cartel Continues (For Now)
Accommodative US Monetary Policy, Tighter Commodity Markets Will Stoke Inflation OPEC 2.0 Cartel Continues (For Now)
Accommodative US Monetary Policy, Tighter Commodity Markets Will Stoke Inflation OPEC 2.0 Cartel Continues (For Now)
Iran poses a genuine geopolitical risk this year – first in the form of an oil supply risk, should conflict emerge in the Persian Gulf, Iraq, or elsewhere in the region. This would inject a risk premium into the oil price. Later the risk is the opposite as a deal with the Biden administration would create the prospect for Iran to attract foreign investment and begin pumping oil, while putting pressure on the OPEC 2.0 coalition to abandon its current, tentative, production discipline in pursuit of market share (Chart 10). Biden has the executive authority to restore the 2015 nuclear deal (Joint Comprehensive Plan of Action). He is in favor of doing so in order to (1) prevent the Middle East from generating a crisis that consumes his foreign policy; (2) execute an American grand strategy of reviving its Asia Pacific influence; (3) cement the Obama administration’s legacy. The Iranian President Hassan Rouhani also has a clear interest in returning to the deal before the country’s presidential election in June. This would salvage his legacy and support his “reformist” faction. The Supreme Leader also has a chance to pin the negative aspects of the deal on a lame duck president while benefiting from it economically as he prepares for his all-important succession. The problem is that extreme levels of distrust will require some brinkmanship early in Biden’s term. Iran is building up leverage ahead of negotiations, which will mean higher levels of uranium enrichment and demonstrating the range of its regional capabilities, including the Strait of Hormuz, and its ability to impose economic pain via oil prices. Biden will need to establish a credible threat if Iran misbehaves. Hence the geopolitical setting is positive for oil prices at the moment. Beyond Iran, there is a clear basis for policy uncertainty to decline for Europe and the UK while it remains elevated for China and Russia (Chart 11). Chart 11Relative Policy Uncertainty Favors Europe and UK Over Russia And China
Relative Policy Uncertainty Favors Europe and UK Over Russia And China
Relative Policy Uncertainty Favors Europe and UK Over Russia And China
The US international image has suffered from the Trump era and the Biden administration’s main priorities will lie in solidifying alliances and partnerships and stabilizing the US role in the world, rather than pursuing showdown and confrontation. However, it will not be long before scrutiny returns to the authoritarian states, which have been able to focus on domestic recovery and expanding their spheres of influence amid the US’s tumultuous election year. Chart 12GeoRisk Indicators Say Risks Underrated For These Bourses
GeoRisk Indicators Say Risks Underrated For These Bourses
GeoRisk Indicators Say Risks Underrated For These Bourses
The US will not seek a “diplomatic reset” with Russia, aside from renegotiating the New START treaty. The Democrats will seek to retaliate for Russia’s extensive cyberattack in 2021 as well as for election interference and psychological warfare in the United States. And while there probably will be a reset with China, it will be short-lived, as outlined above. This situation contrasts with that of the Atlantic sphere. The Biden administration is a crystal clear positive, relative to a second Trump term, for the European Union. The EU and the UK have just agreed to a trade deal, as expected, to conclude the Brexit process, which means that the US-UK “special relationship” will not be marred by disagreements over Ireland. European solidarity has also strengthened as a result of the pandemic, which highlighted the need for collective policy responses, including fiscal. Thus the geopolitical risks of the new administration are most relevant for China/Taiwan and Russia. Comparing our GeoRisk Indicators, which are market-based, with the relative equity performance of these bourses, Taiwanese stocks are the most vulnerable because markets are increasingly pricing the geopolitical risk yet the relative stock performance is toppy (Chart 12). The limited recovery in Russian equities is also at risk for the same reason. Only in China’s case has the market priced lower geopolitical risk, not least because of the positive change in US administration. We expect Biden and Xi Jinping to be friendly at first but for strategic distrust to reemerge by the second half of the year. This will be a rude awakening for Chinese stocks – or China-exposed US stocks, especially in the tech sector. Investment Takeaways Chart 13Global Policy Shifts Drive Big Investment Reversals
Global Policy Shifts Drive Big Investment Reversals
Global Policy Shifts Drive Big Investment Reversals
The US is politically divided. Civil unrest and aftershocks of the controversial election will persist but markets will ignore it unless it has a systemic impact. The policy consequence is a more proactive fiscal policy, resulting in virtual fiscal-monetary coordination that is positive both for global demand and risk assets, while negative for the US dollar. The Biden administration will succeed in partially repealing the Trump tax cuts, but the impact on corporate profit margins will be discounted fairly mechanically and quickly by market participants, while the impact on economic growth will be more than offset by huge new spending. Sentiment will improve after the pandemic – and Biden has not yet shown an inclination to take an anti-business tone. The past decade has been marked by a dollar bull market and the outperformance of developed markets over emerging markets and growth stocks like technology over value stocks like financials. Cyclical sectors have traded in a range. Going forward, a secular rise in geopolitical Great Power competition is likely to persist but the macro backdrop has shifted with the decline of the dollar. Cyclical sectors are now poised to outperform while a bottom is forming in value stocks and emerging markets (Chart 13). We recommend investors go strategically long emerging markets relative to developed. We are also going long global value over growth stocks. We are not yet ready to close our gold trade given that the two supports, populist fiscal turn and great power struggle, will continue to be priced by markets in the near term. We are throwing in the towel on our short CNY-USD trade after the latest upleg in the renminbi, though our view continues to be that geopolitical fundamentals will catch yuan investors by surprise when they reassert themselves. We also recommend preferring global equities to US equities, given the above-mentioned global trends plus looming tax hikes. Matt Gertken Vice President Geopolitical Strategy mattg@bcaresearch.com Footnotes 1 January 6, 2020, twitter.com. 2 See Turchin and Andrey Korotayev, "The 2010 Structural-Demographic Forecast for the 2010-2020 Decade: A Retrospective Assessment," PLoS ONE 15:8 (2020), journals.plos.org. 3 Not to mention that 2021 is the Communist Party’s 100th anniversary – not a time to make an unforced policy error with an already wobbly economy.

After bottoming in Q4, the German DAX is rallying and outperforming the Euro Stoxx 50 in the process. While the near-term is muddled by the pandemic’s resurgence, the global manufacturing recovery this year will ultimately benefit the German economy and…
Highlights An uninterrupted advance in reflation trades will be possible if the FOMO (fear of missing out) evolves into a full-blown mania. This scenario cannot be ruled out especially with retail investors around the world continuing to flock into equity markets. EM equity valuations are neither cheap in absolute terms nor relative to Europe and Japan. EM is cheap only versus the S&P 500. US relative equity outperformance in common currency terms is breaking down. Go long EM stocks / short the S&P 500. The Blue Wave in the US is very bearish for the greenback and has reduced our expectations of the magnitude and duration of any near-term US dollar rebound. It has in fact reinforced our medium- to long-term negative US dollar view. Feature Financial markets are at a crossroad. On the one hand, the reflation trades have already rallied a great deal and might be at a point of exhaustion. On the other hand, gigantic monetary and fiscal support from authorities worldwide, and the US in particular, could push global share prices into a no gravity zone where major overshoots and manias are possible. The bullish view is well-known: DM central banks’ easy monetary and fiscal policies will endure. Moreover, the global economy will continue its recovery as vaccines are made accessible by mid-year to a large share of the population in advanced economies. Markets will ignore any growth disappointment stemming from the expansion and/or extension of lockdowns as they are forward-looking and expect widespread vaccine deployment to eventually allow for a reopening of the economies. We agree with these points. The negative view is also well-recognized: investor sentiment on global equities in general and EM in particular is very elevated and reflation trades have become overbought. These are valid and correct points as well. Chart I-1 illustrates that the Sentix investor sentiment1 on EM equities is at an all-time high. In the past, when sentiment reached these levels EM share prices experienced either a correction or a bear market. Chart I-1Investor Sentiment On EM Equities Is At A Record High
Investor Sentiment On EM Equities Is At A Record High
Investor Sentiment On EM Equities Is At A Record High
Further, the December issue of the Bank of America/Merrill Lynch survey noted that investor overweights in EM stocks and commodities are the highest since November 2010 and February 2011, respectively. These proved to be the major (structural) tops in EM equities and commodities. Certainly, positioning in EM is even more crowded now than it was four weeks ago. Are EM equities at a point of exhaustion – where the rally runs out – or at a point of no gravity – where nothing will stop them from marching higher? In the near term, either is possible. It truly depends on investor behavior which is impossible to forecast with any high degree of certainty. Chart I-2Korean Stocks Have Benefited From Local Retail Mania
Korean Stocks Have Benefited From Local Retail Mania
Korean Stocks Have Benefited From Local Retail Mania
For instance, retail mania has been happening not only in the US but also in many developing countries. In particular, the astonishing rally in Korean stocks has been propelled not by foreign investors but by local retail investors (Chart I-2). That is why traditional yardsticks of investment analysis have not been useful. In the medium and long term, the trend in global share prices, and thereby EM, will likely be shaped by issues where there is no consensus among investors. In our opinion, there are two subjects upon which investors disagree: (1) whether global and EM equity valuations are too expensive, and (2) whether US inflation will rise sufficiently so that the Federal Reserve abandons its super-easy monetary policy stance, and when markets will begin to price this in. EM equity valuations are not at all cheap. An uninterrupted advance will be possible if the FOMO (fear of missing out) evolves into a full-blown mania. This scenario cannot be ruled out especially with retail investors around the world continuing to flock into equity markets. Concerning US inflation, the odds are that it will rise sooner and faster than is expected by the market and the Fed. Although the Fed is unlikely to singlehandedly spoil the party, fixed-income markets could start pricing in rate hikes sooner rather than later with ramifications for share prices. We will discuss equity valuations in this report and devote a separate report in the coming weeks to the inflation outlook in the US and China. Market Implications Of The Blue Wave Chart I-3US Consumption Of Industrial Metals Is Too Small
Reflation Trades: Exhaustion Or No Gravity?
Reflation Trades: Exhaustion Or No Gravity?
We expected US Republicans to maintain their majority in the Senate after Georgia’s Senate elections, thus dimming the likelihood of more large-scale fiscal stimulus. If realized, that would have triggered a rebound in the US dollar from very oversold levels. US Democrats effectively gaining control of the Senate has major implications for financial markets: America’s fiscal policy will be looser than otherwise. Swelling government spending will boost domestic demand and will produce a wider trade deficit and higher inflation. Yet, the Fed is unlikely to tighten policy anytime soon and real interest rates will remain negative. This is very bearish for the US dollar. Any rebound in the greenback, which is possible given its oversold conditions, should be faded. According to our Chief Geopolitical Strategist Matt Gertken, odds are that Democrats will partially repeal the corporate tax cuts enacted during Trump’s administration. This is negative for both the US dollar and for Wall Street. One of the main campaign promises of Democrats has been to address income inequality. Actions on this front are good for Main Street but these policies will weigh on corporate profitability. Big Tech faces a greater threat of taxes from a united Congress as opposed to a divided Congress, but Biden’s executive decrees will not be too harsh given that these companies are a major source of support for Democrats. US nominal interest rates will rise but so will nominal GDP growth. The negative impact of higher US bond yields on EM will be more than offset by two forces: a weaker US dollar and stronger exports to the US. Finally, the shift in US fiscal policy is clearly inflationary. However, the impact on commodities prices will be modest. The US accounts for only 8% of global industrial metals consumption compared to China’s 57% share (Chart I-3). So, a slowdown in China commencing in H2 2021 will more than offset the rise in US metals consumption. Concerning oil, the US is the world’s largest crude consumer. Hence, higher household income and spending are positive for oil prices. However, a forceful Democrat push toward green energy is structurally negative for US oil consumption. These two forces might offset each other leaving oil prices to be determined by other factors. Bottom Line: Democrat control of both houses of Congress is positive for US nominal GDP and, hence, for corporate revenues but is bearish for the US dollar and corporate profit margins. Net-net, this reinforces our view that US relative equity outperformance in common currency terms has already passed its secular top and is breaking down (Chart I-4, top panel). By contrast, this US policy shift is positive for EM financial markets (Chart I-4, bottom panel). We recommend a new trade/strategy: go long EM stocks / short the S&P 500. EM Equity Valuations In our opinion, global stocks, especially US ones, are expensive and EM equities are far from being cheap. Let’s begin with EM equity valuations: Chart I-5 shows our Composite Valuation Indicator (CVI) for the MSCI EM equity benchmark. It is an average of four individual valuation indicators: market cap-weighted, equal-weighted, trimmed mean, and median. Chart I-4US Equity Outperformance Is Over
US Equity Outperformance Is Over
US Equity Outperformance Is Over
Chart I-5EM Equities: Good News Are Fully Priced In
EM Equities: Good News Are Fully Priced In
EM Equities: Good News Are Fully Priced In
In turn, each of these four indicators incorporates five multiples: forward P/E, trailing P/E, price-to-cash EPS, price-to-book value and price-to-dividend ratios. According to Chart I-5, EM equities are expensive. Not only are trailing P/E and price-to-cash EPS ratios extremely elevated but also the forward P/E ratio is the highest and the dividend yield is the lowest it has been in 18 years (Chart I-6). Even though EM stocks do not appear to be expensive based on a price-to-book value (PBV) ratio, a structural decline in EM return on equity (RoE) entails that the fair value range for the PBV ratio has downshifted over the past decade and the current reading should be taken with a grain of salt. Chart I-7 demonstrates that the RoEs for the entire MSCI EM universe, equal-weighted MSCI EM equity index and MSCI non-financial EM companies have deteriorated structurally. Hence, a decline in return on equity is widespread among EM-listed companies, i.e. it is not a feature unique to only large caps. Chart I-6EM Equity Multiples
EM Equity Multiples
EM Equity Multiples
Chart I-7A Structural Drop In EM RoE Heralds Lower Multiples
A Structural Drop In EM RoE Heralds Lower Multiples
A Structural Drop In EM RoE Heralds Lower Multiples
In brief, the structural decline in EM RoE justifies a lower PBV ratio for EM equities (Chart I-7, bottom panel). Relative to DM, EM equities are not cheap. They are cheap versus their US peers but expensive versus European and Japanese stocks. Chart I-8 exhibits the relative Composite Valuation Indicator for EM relative to DM. For EM, it is the same as in Chart I-5 and for DM we use an identical measure. When discussing equity valuations, one should now distinguish between growth and value stocks. EM growth stocks are grossly overvalued as shown in the top panel of Chart I-9. EM value stocks are close to their fair value, i.e., they are not cheap (Chart I-9, bottom panel). Chart I-8EM Versus DM: Relative Equity Multiples
EM Versus DM: Relative Equity Multiples
EM Versus DM: Relative Equity Multiples
Chart I-9Multiples For EM Growth And Value Stocks
Multiples For EM Growth And Value Stocks
Multiples For EM Growth And Value Stocks
A caveat is in order: all of these CVIs do not incorporate interest rates into valuation models. We look at equity multiples in the context of low interest rates in the sections that follow. Incorporating Interest Rates Into Equity Valuations Chart I-10EM Earnings Yields Adjusted For Local Bond Yields
EM Earnings Yields Adjusted For Local Bond Yields
EM Earnings Yields Adjusted For Local Bond Yields
There are various ways to incorporate interest rates/the discount factor into equity valuations. One way is to calculate the difference between forward earnings yield (EY) and long-term bond yields. We use forward EY because trailing EPS is still depressed by the pandemic-induced economic crash, i.e., trailing P/Es do not provide a true valuation picture. Chart I-10 demonstrates the gap between EM forward EY and 10-year US bond yields (on the top panel) and the same forward EY and EM local bond yields (Chart I-10, bottom panel). Both measures are not far from their historical means. Hence, adjusted for bond yields, EM stocks are fairly valued. That said, there are two pertinent questions that follow from this: (1) how do EM equities compare to their DM peers; and (2) how well have these interest rate-adjusted valuation measures worked in markets where interest rates had dropped to zero. In other words, do near-zero interest rates warrant a secular bull market? We address this last topic in the section below. As to the first question, Chart I-11 presents the forward EY-local interest rate differential for major equity markets. A higher differential presage cheaper equity valuation relative to lower numbers. Chart I-11US And EM Equities Have Been Chronically Expensive Versus European And Japanese Ones
US And EM Equities Have Been Chronically Expensive Versus European And Japanese Ones
US And EM Equities Have Been Chronically Expensive Versus European And Japanese Ones
According to this measure, Japanese and Euro Area equities have been and remain cheaper than US and EM equities. Chart I-12 ranks all individual EM equity benchmarks as well as major DM bourses based on the differential between forward EY and local nominal bond yields. Stocks in India, Indonesia, South Africa, Turkey, Mexico and Colombia are expensive, adjusted for local bond yields. Chart I-12Cross Country Valuation Ranking: Forward Earnings Yield Minus Local Bond Yields
Reflation Trades: Exhaustion Or No Gravity?
Reflation Trades: Exhaustion Or No Gravity?
By contrast, equity markets in Central Europe, core Europe and Russia offer better value, relative to domestic bonds. The EM aggregate index, the Chinese investable benchmark and the S&P 500 fall in the middle of this valuation ranking. Bottom Line: Based on equity multiples, EM equities are expensive. However, when adjusted for interest rates, absolute valuation of EM equities is neutral. Relative to DM, the EM equity benchmark is not cheap. In fact, they are more expensive compared to European and Japanese stocks. Equity Valuation When Rates Are At Zero No doubt, equity prices should be re-rated as interest rates drop. However, what should the equilibrium P/E multiple be when interest rates are close to zero? Japan, the euro area and Switzerland offer a roadmap. Chart I-13Japanese And European Stocks Have Not Entered Structural Bull Markets Despite Negative Rates
Japanese and European Stocks Have Not Entered Structural Bull Markets Despite Negative Rates
Japanese and European Stocks Have Not Entered Structural Bull Markets Despite Negative Rates
For some time now, these markets have had to process many of the same features that US and global markets are currently facing. Specifically: They have had negative policy rates and 10-year government bond yields for many years. Their central banks have been conducting some sort of QE programs. The Bank of Japan and the Swiss National Bank have been purchasing equities and the ECB has been buying corporate bonds. Finally, onward from 2012 until the eruption of the pandemic, economic growth in Japan, the euro area and Switzerland was decent. Despite negative interest rates, their broad equity markets have failed to break out into a structural bull market. Their stocks have re-rated, but the upside was capped (Chart I-13). Critically, the forward EY differential with their local government bond yields have stayed wide (Chart I-14). Chart I-14Japanese, Euro Area And Swiss Equities Have Not Re-Rated Despite Negative Bond Yields
Japanese, Euro Area And Swiss Equities Have Not Re-Rated Despite Negative Bond Yields
Japanese, Euro Area And Swiss Equities Have Not Re-Rated Despite Negative Bond Yields
In sum, the experiences of Japanese, Swiss and other European markets show that zero or negative interest rates alone did not compel a secular bull market in share prices. Rather, equity re-rating in these bourses has been relatively moderate. Investment Considerations The Blue Wave is very bearish for the greenback as we argued above. This development has reduced our conviction regarding the magnitude and duration of any near-term US dollar rebound. It has in fact reinforced our medium- to long-term negative US dollar view. Potential EM currencies that investors should consider buying on a dip versus the US dollar are MXN, SGD, KRW, TWD, CNY, INR and CZK. For now, we continue to recommend a neutral allocation to EM equities and credit within global equity and credit portfolios, respectively. However, we note that odds of EM outperformance have risen with the Blue Wave in the US and ensuing US dollar depreciation. Yet, Europe and Japan presently offer a better risk/reward profile than EM. However, to reflect our strong conviction of a breakdown in US relative performance and a more upbeat view on EM versus US stocks, we recommend the following trade/strategy: long EM stocks / short the S&P 500, currency unhedged. Concerning the absolute performance of EM and DM stocks, they are very overbought, reasonably expensive and sentiment is very bullish. In normal times, this would argue for a pullback. For example, Chart I-15 shows that a rollover in the inverted US equity put-call ratio typically heralds a setback in the S&P500. Chart I-15A Red Flag? Do Indicators No Longer Work?
A Red Flag? Do Indicators No Longer Work?
A Red Flag? Do Indicators No Longer Work?
However, if global stocks are moving from a FOMO stage to a mania phase, many traditional relationships and indicators might not work. This and the fact the EM equity index is at a critical juncture entails its outlook is currently highly uncertain – odds of a breakout (FOMO evolving into a mania) and a potential setback are equal. Finally, some housekeeping, we are closing the long Chinese Investable stocks / short Korean stocks recommendation. This trade has generated a massive loss of 33.5% as the KOSPI has taken off in recent weeks. We continue to overweight both Chinese and Korean equities within an EM equity portfolio. We will likely make changes to our recommended country allocations within equity and fixed-income portfolios in the coming weeks. Stay tuned. Arthur Budaghyan Chief Emerging Markets Strategist arthurb@bcaresearch.com Footnotes 1 The Sentix Asset Classes Sentiment Emerging Markets Equities Index is polled among 5,000 European individual and institutional investors. In the survey, investors are asked about their medium-term price expectations for the asset class. Source: SENTIX. Equities Recommendations Currencies, Credit And Fixed-Income Recommendations