Equities
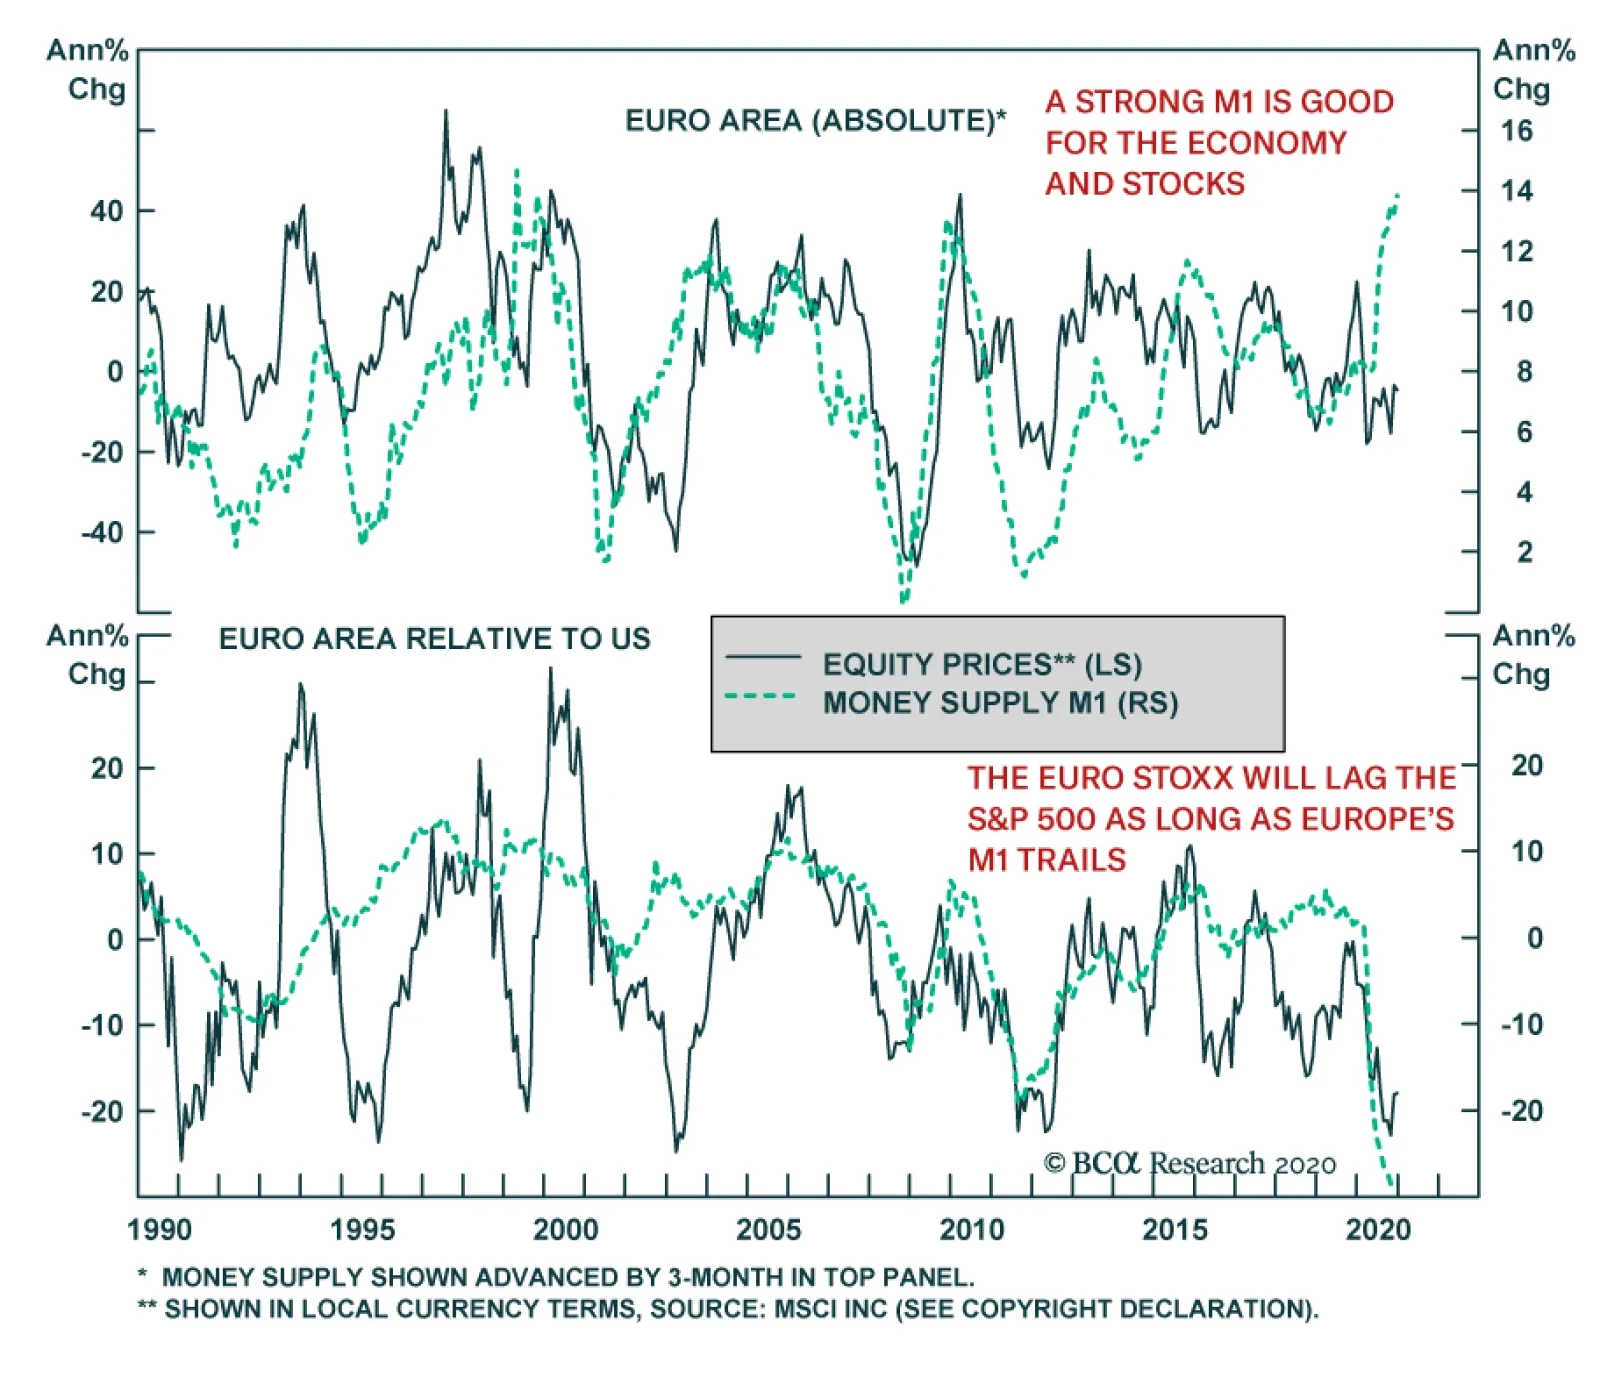
The Eurozone’ M1 money supply is expanding at a 14% annual pace, its fastest rate since 1999. On the European continent, banks represent a much larger share of credit origination than they do in the US. Due to this lack of credit disintermediation, M1 still…
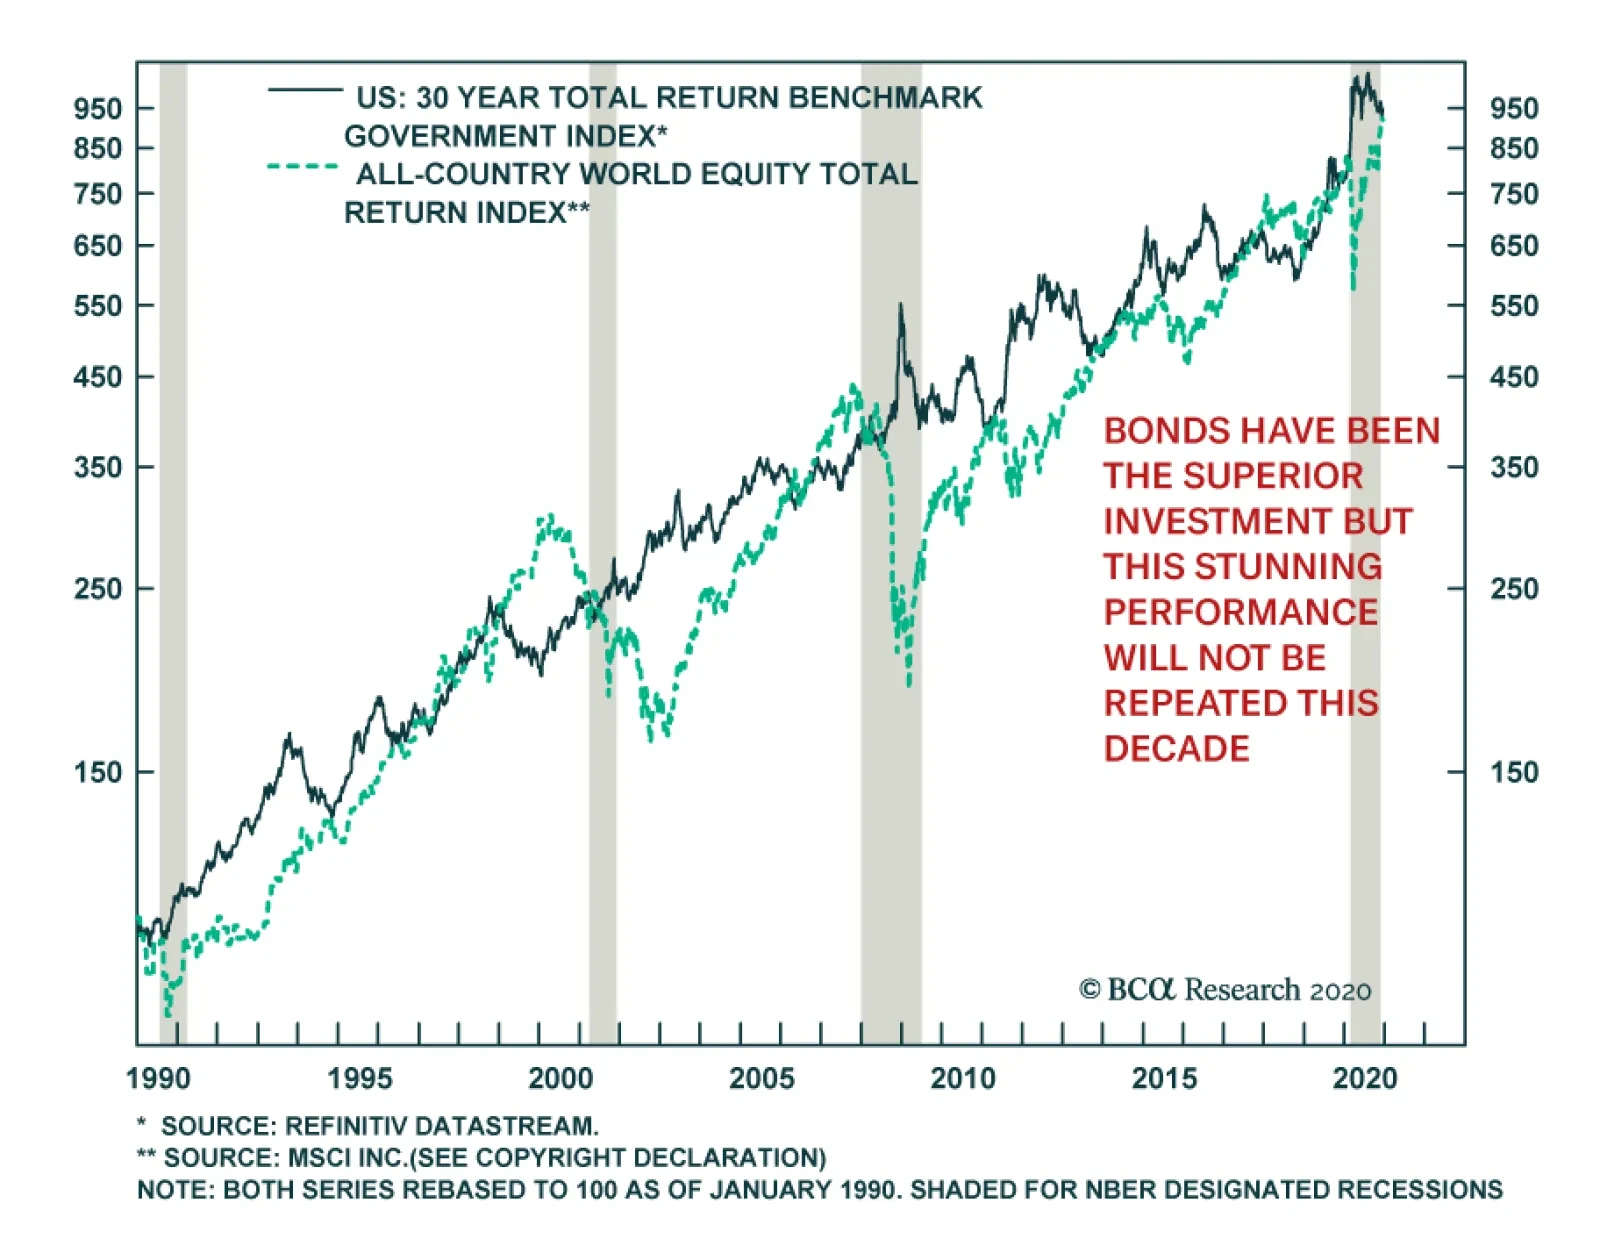
From 1990 to today, US Treasuries and global equities have delivered equivalent returns of roughly 7.5% on an annualized basis. This means that bonds have been the superior investment because of their significantly lower volatility. These equivalent…
Market sentiment has reached dangerously elevated levels. BCA Research recently highlighted how the bullishness embedded in both an extremely low CBOE put-call ratio and an elevated AAII bull-minus-bear spread represents a negative signal from a…

Highlights With a vaccine already rolling out in the UK and soon in the US, investors have reason to be optimistic about next year. Government bond yields are rising, cyclical equities are outperforming defensives, international stocks hinting at outperforming American, and value stocks are starting to beat growth stocks (Chart 1). Feature President Trump’s defeat in the US election also reduces the risk of a global trade war, or a real war with Iran. European, Chinese, and Emirati stocks have rallied since the election, at least partly due to the reduction in these risks (Chart 2). However, geopolitical risk and global policy uncertainty have been rising on a secular, not just cyclical, basis (Chart 3). Geopolitical tensions have escalated with each crisis since the financial meltdown of 2008. Chart 1A New Global Business Cycle
A New Global Business Cycle
A New Global Business Cycle
Chart 2Biden: No Trade War Or War With Iran?
Biden: No Trade War Or War With Iran?
Biden: No Trade War Or War With Iran?
Chart 3Geopolitical Risk And Global Policy Uncertainty
Geopolitical Risk And Global Policy Uncertainty
Geopolitical Risk And Global Policy Uncertainty
Chart 4The Decline Of The Liberal Democracies?
The Decline Of The Liberal Democracies?
The Decline Of The Liberal Democracies?
Trump was a symptom, not a cause, of what ails the world. The cause is the relative decline of the liberal democracies in political, economic, and military strength relative to that of other global players (Chart 4). This relative decline has emboldened Chinese and Russian challenges to the US-led global order, as well as aggressive and unpredictable moves by middle and small powers. Moreover the aftershocks of the pandemic and recession will create social and political instability in various parts of the world, particularly emerging markets (Chart 5). Chart 5EM Troubles Await
EM Troubles Await
EM Troubles Await
Chart 6Global Arms Build-Up Continues
Global Arms Build-Up Continues
Global Arms Build-Up Continues
We are bullish on risk assets next year, but our view is driven largely from the birth of a new economic cycle, not from geopolitics. Geopolitical risk is rapidly becoming underrated, judging by the steep drop-off in measured risk. There is no going back to a pre-Trump, pre-Xi Jinping, pre-2008, pre-Putin, pre-9/11, pre-historical golden age in which nations were enlightened, benign, and focused exclusively on peace and prosperity. Hard data, such as military spending, show the world moving in the opposite direction (Chart 6). So while stock markets will grind higher next year, investors should not expect that Biden and the vaccine truly portend a “return to normalcy.” Key View #1: China’s Communist Party Turns 100, With Rising Headwinds Investors should ignore the hype about the Chinese Communist Party’s one hundredth birthday in 2021. Since 1997, the Chinese leadership has laid great emphasis on this “first centenary” as an occasion by which China should become a moderately prosperous society. This has been achieved. China is deep into a structural economic transition that holds out a much more difficult economic, social, and political future. Chart 7China: Less Money, More Problems
China: Less Money, More Problems
China: Less Money, More Problems
The big day, July 1, will be celebrated with a speech by General Secretary Xi Jinping in which he reiterates the development goals of the five-year plan. This plan – which doubles down on import substitution and the aggressive tech acquisition campaign – will be finalized in March, along with Xi’s yet-to-be released vision for 2035, which marks the halfway point to the “second centenary,” 2049, the hundredth birthday of the regime. Xi’s 2035 goals may contain some surprises but the Communist Party’s policy frameworks should be seen as “best laid plans” that are likely to be overturned by economic and geopolitical realities. It was easier for the country to meet its political development targets during the period of rapid industrialization from 1979-2008. Now China is deep into a structural economic transition that holds out a much more difficult economic, social, and political future. Potential growth is slowing with the graying of society and the country is making a frantic dash, primarily through technology acquisition, to boost productivity and keep from falling into the “middle income trap” (Chart 7). Total debt levels have surged as Beijing attempts to make this transition smoothly, without upsetting social stability. Households and the government are taking on a greater debt load to maintain aggregate demand while the government tries to force the corporate sector to deleverage in fits and starts (Chart 8). The deleveraging process is painful and coincides with a structural transition away from export-led manufacturing. Beijing likely believes it has already led de-industrialization proceed too quickly, given the huge long-term political risks of this process, as witnessed in the US and UK. The fourteenth five-year plan hints that the authorities will give manufacturing a reprieve from structural reform efforts (Chart 9). Chart 8China Struggles To Dismount Debt Bubble
China Struggles To Dismount Debt Bubble
China Struggles To Dismount Debt Bubble
Chart 9China Will Slow De-Industrialization, Stoking Protectionism
China Will Slow De-Industrialization, Stoking Protectionism
China Will Slow De-Industrialization, Stoking Protectionism
Chart 10China Already Reining In Stimulus
China Already Reining In Stimulus
China Already Reining In Stimulus
A premature resumption of deleveraging heightens domestic economic risks. The trade war and then the pandemic forced the Xi administration to abandon its structural reform plans temporarily and drastically ease monetary, fiscal, and credit policy to prevent a recession. Almost immediately the danger of asset bubbles reared its head again. Because the regime is focused on containing systemic financial risk, it has already begun tightening monetary policy as the nation heads into 2021 – even though the rest of the world has not fully recovered from the pandemic (Chart 10). The risk of over-tightening is likely to be contained, since Beijing has no interest in undermining its own recovery. But the risk is understated in financial markets at the moment and, combined with American fiscal risks due to gridlock, this familiar Chinese policy tug-of-war poses a clear risk to the global recovery and emerging market assets next year. Far more important than the first centenary, or even General Secretary Xi’s 2035 vision, is the impending leadership rotation in 2022. Xi was originally supposed to step down at this time – instead he is likely to take on the title of party chairman, like Mao, and aims to stay in power till 2035 or thereabouts. He will consolidate power once again through a range of crackdowns – on political rivals and corruption, on high-flying tech and financial companies, on outdated high-polluting industries, and on ideological dissenters. Beijing must have a stable economy going into its five-year national party congresses, and 2022 is no different. But that goal has largely been achieved through this year’s massive stimulus and the discovery of a global vaccine. In a risk-on environment, the need for economic stability poses a downside risk for financial assets since it implies macro-prudential actions to curb bubbles. The 2017 party congress revealed that Xi sees policy tightening as a key part of his policy agenda and power consolidation. In short, the critical twentieth congress in 2022 offers no promise of plentiful monetary and credit stimulus (Chart 11). All investors can count on is the minimum required for stability. This is positive for emerging markets at the moment, but less so as the lagged effects of this year’s stimulus dissipate. Chart 11No Promise Of Major New Stimulus For Party Congress 2022
No Promise Of Major New Stimulus For Party Congress 2022
No Promise Of Major New Stimulus For Party Congress 2022
Not only will Chinese domestic policy uncertainty remain underestimated, but geopolitical risk will also do so. Superficially, Beijing had a banner year in 2020. It handled the coronavirus better than other countries, especially the US, thus advertising Xi Jinping’s centralized and statist governance model. President Trump lost the election. Regardless of why Trump lost, his trade war precipitated a manufacturing slowdown that hit the Rust Belt in 2019, before the virus, and his loss will warn future presidents against assaulting China’s economy head-on, at least in their first term. All of this is worth gold in Chinese domestic politics. Chart 12China’s Image Suffered In Spite Of Trump
2021 Key Views: No Return To Normalcy
2021 Key Views: No Return To Normalcy
Internationally, however, China’s image has collapsed – and this is in spite of Trump’s erratic and belligerent behavior, which alienated most of the world and the US’s allies (Chart 12). Moreover, despite being the origin of COVID-19, China’s is one of the few economies that thrived this year. Its global manufacturing share rose. While delaying and denying transparency regarding the virus, China accused other countries of originating the virus, and unleashed a virulent “wolf warrior” diplomacy, a military standoff with India, and a trade war with Australia. The rest of Asia will be increasingly willing to take calculated risks to counterbalance China’s growing regional clout, and international protectionist headwinds will persist. The United States will play a leading part in this process. Sino-American strategic tensions have grown relentlessly for more than a decade, especially since Xi Jinping rose to power, as is evident from Chinese treasury holdings (Chart 13). The Biden administration will naturally seek a diplomatic “reset” and a new strategic and economic dialogue with China. But Biden has already indicated that he intends to insist on China’s commitments under Trump’s “phase one” trade deal. He says he will keep Trump’s sweeping Section 301 tariffs in place, presumably until China demonstrates improvement on the intellectual property and tech transfer practices that provided the rationale for the tariffs. Biden’s victory in the Rust Belt ensures that he cannot revert to the pre-Trump status quo. Indeed Biden amplifies the US strategic challenge to China’s rise because he is much more likely to assemble a “grand alliance” or “coalition of the willing” focused on constraining China’s illiberal and mercantilist policies. Even the combined economic might of a western coalition is not enough to force China to abandon its statist development model, but it would make negotiations more likely to be successful on the West’s more limited and transactional demands (Chart 14). Chart 13The US-China Divorce Pre-Dates And Post-Dates Trump
The US-China Divorce Pre-Dates And Post-Dates Trump
The US-China Divorce Pre-Dates And Post-Dates Trump
Chart 14Biden's Grand Alliance A Danger To China
Biden's Grand Alliance A Danger To China
Biden's Grand Alliance A Danger To China
The Taiwan Strait is ground zero for US-China geopolitical tensions. The US is reviving its right to arm Taiwan for the sake of its self-defense, but the US commitment is questionable at best – and it is this very uncertainty that makes a miscalculation more likely and hence conflict a major tail risk (Chart 15). True, Beijing has enormous economic leverage over Taiwan, and it is fresh off a triumph of imposing its will over Hong Kong, which vindicates playing the long game rather than taking any preemptive military actions that could prove disastrous. Nevertheless, Xi Jinping’s reassertion of Beijing and communism is driving Taiwanese popular opinion away from the mainland, resulting in a polarizing dynamic that will be extremely difficult to bridge (Chart 16). If China comes to believe that the Biden administration is pursuing a technological blockade just as rapidly and resolutely as the Trump administration, then it could conclude that Taiwan should be brought to heel sooner rather than later. Chart 15US Boosts Arms Sales To Taiwan
2021 Key Views: No Return To Normalcy
2021 Key Views: No Return To Normalcy
Chart 16Taiwan Strait Risk Will Explode If Biden Seeks Tech Blockade
2021 Key Views: No Return To Normalcy
2021 Key Views: No Return To Normalcy
Bottom Line: On a secular basis, China faces rising domestic economic risks and rising geopolitical risk. Given the rally in Chinese currency and equities in 2021, the downside risk is greater than the upside risk of any fleeting “diplomatic reset” with the United States. Emerging markets will benefit from China’s stimulus this year but will suffer from its policy tightening over time. Key View #2: The US “Pivot To Asia” Is Back On … And Runs Through Iran Most likely President-elect Biden will face gridlock at home. His domestic agenda largely frustrated, he will focus on foreign policy. Given his old age, he may also be a one-term president, which reinforces the need to focus on the achievable. He will aim to restore the Obama administration’s foreign policy, the chief features of which were the 2015 nuclear deal with Iran and the “Pivot to Asia.” The US is limited by the need to pivot to Asia, while Iran is limited by the risk of regime failure. A deal should be agreed. The purpose of the Iranian deal was to limit Iran’s nuclear and regional ambitions, stabilize Iraq, create a semblance of regional balance, and thus enable American military withdrawal. The US could have simply abandoned the region, but Iran’s ensuing supremacy would have destabilized the region and quickly sucked the US back in. The newly energy independent US needed a durable deal. Then it could turn its attention to Asia Pacific, where it needed to rebuild its strategic influence in the face of a challenger that made Iran look like a joke (Chart 17). Chart 17The "Pivot To Asia" In A Nutshell
The "Pivot To Asia" In A Nutshell
The "Pivot To Asia" In A Nutshell
It is possible for Biden to revive the Iranian deal, given that the other five members of the agreement have kept it afloat during the Trump years. Moreover, since it was always an executive deal that lacked Senate approval, Biden can rejoin unilaterally. However, the deal largely expires in 2025 – and the Trump administration accurately criticized the deal’s failure to contain Iran’s missile development and regional ambitions. Therefore Biden is proposing a renegotiation. This could lead to an even greater US-Iran engagement, but it is not clear that a robust new deal is feasible. Iran can also recommit to the old deal, having taken only incremental steps to violate the deal after the US’s departure – manifestly as leverage for future negotiations. Of course, the Iranians are not likely to give up their nuclear program in the long run, as nuclear weapons are the golden ticket to regime survival. Libya gave up its nuclear program and was toppled by NATO; North Korea developed its program into deliverable nuclear weapons and saw an increase in stature. Iran will continue to maintain a nuclear program that someday could be weaponized. Nevertheless, Tehran will be inclined to deal with Biden. President Hassan Rouhani is a lame duck, his legacy in tatters due to Trump, but his final act in office could be to salvage his legacy (and his faction’s hopes) by overseeing a return to the agreement prior to Iran’s presidential election in June. From Supreme Leader Ali Khamenei’s point of view, this would be beneficial. He also needs to secure his legacy, but as he tries to lay the groundwork for his power succession, Iran faces economic collapse, widespread social unrest, and a potentially explosive division between the Iranian Revolutionary Guard Corps and the more pragmatic political faction hoping for economic opening and reform. Iran needs a reprieve from US maximum pressure, so Khamenei will ultimately rejoin a limited nuclear agreement if it enables the regime to live to fight another day. In short, the US is limited by the need to pivot to Asia, while Iran is limited by the risk of regime failure. A deal should be agreed. But this is precisely why conflict could erupt in 2021. First, either in Trump’s final days in office or in the early days of the Biden administration, Israel could take military action – as it has likely done several times this year already – to set back the Iranian nuclear program and try to reinforce its own long-term security. Second, the Biden administration could decide to utilize the immense leverage that President Trump has bequeathed, resulting in a surprisingly confrontational stance that would push Iran to the brink. This is unlikely but it may be necessary due to the following point. Third, China and Russia could refuse to cooperate with the US, eliminating the prospect of a robust renegotiation of the deal, and forcing Biden to choose between accepting the shabby old deal or adopting something similar to Trump’s maximum pressure. China will probably cooperate; Russia is far less certain. Beijing knows that the US intention in Iran is to free up strategic resources to revive the US position in Asia, but it has offered limited cooperation on Iran and North Korea because it does not have an interest in their acquiring nuclear weapons and it needs to mitigate US hostility. Biden has a much stronger political mandate to confront China than he does to confront Iran. Assuming that the Israelis and Saudis can no more prevent Biden’s détente with Iran than they could Obama’s, the next question will be whether Biden effectively shifts from a restored Iranian deal to shoring up these allies and partners. He can possibly build on the Abraham Accords negotiated by the Trump administration smooth Israeli ties with the Arab world. The Middle East could conceivably see a semblance of balance. But not in 2021. The coming year will be the rocky transition phase in which the US-Iran détente succeeds or fails. Chart 18Oil Market Share War Preceded The Last US-Iran Deal
Oil Market Share War Preceded The Last US-Iran Deal
Oil Market Share War Preceded The Last US-Iran Deal
Chart 19Still, Base Case Is For Rising Oil Prices
Still, Base Case Is For Rising Oil Prices
Still, Base Case Is For Rising Oil Prices
Chart 20Biden Needs A Credible Threat
Biden Needs A Credible Threat
Biden Needs A Credible Threat
The lead-up to the 2015 Iranian deal saw a huge collapse in global oil prices due to a market share war with Saudi Arabia, Russia, and the US triggered by US shale production and Iranian sanctions relief (Chart 18). This was despite rising global demand and the emergence of the Islamic State in Iraq. In 2021, global demand will also be reviving and Iraq, though not in the midst of full-scale war, is still unstable. OPEC 2.0 could buckle once again, though Moscow and Riyadh already confirmed this year that they understand the devastating consequences of not cooperating on production discipline. Our Commodity and Energy Strategy projects that the cartel will continue to operate, thus drawing down inventories (Chart 19). The US and/or Israel will have to establish a credible military threat to ensure that Iran is in check, and that will create fireworks and geopolitical risks first before it produces any Middle Eastern balance (Chart 20). Bottom Line: The US and Iran are both driven to revive the 2015 nuclear deal by strategic needs. Whether a better deal can be negotiated is less likely. The return to US-Iran détente is a source of geopolitical risk in 2021 though it should ultimately succeed. The lower risk of full-scale war is negative for global oil prices but OPEC 2.0 cartel behavior will be the key determiner. The cartel flirted with disaster in 2020 and will most likely hang together in 2021 for the sake of its members’ domestic stability. Key View #3: Europe Wins The US Election Chart 21Europe Won The US Election
Europe Won The US Election
Europe Won The US Election
The European Union has not seen as monumental of a challenge from anti-establishment politicians over the past decade as have Britain and America. The establishment has doubled down on integration and solidarity. Now Europe is the big winner of the US election. Brussels and Berlin no longer face a tariff onslaught from Trump, a US-instigated global trade war, or as high of a risk of a major war in the Middle East. Biden’s first order of business will be reviving the trans-Atlantic alliance. Financial markets recognize that Europe is the winner and the euro has finally taken off against the dollar over the past year. European industrials and small caps outperformed during the trade war as well as COVID-19, a bullish signal (Chart 21). Reinforcing this trend is the fact that China is looking to court Europe and reduce momentum for an anti-China coalition. The center of gravity in Europe is Germany and 2021 faces a major transition in German politics. Chancellor Angela Merkel will step down at long last. Her Christian Democratic Union is favored to retain power after receiving a much-needed boost for its handling of this year’s crisis (Chart 22), although the risk of an upset and change of ruling party is much greater than consensus holds. Chart 22German Election Poses Political Risk, Not Investment Risk
German Election Poses Political Risk, Not Investment Risk
German Election Poses Political Risk, Not Investment Risk
However, from an investment point of view, an upset in the German election is not very concerning. A left-wing coalition would take power that would merely reinforce the shift toward more dovish fiscal policy and European solidarity. Either way Germany will affirm what France affirmed in 2017, and what France is on track to reaffirm in 2022: that the European project is intact, despite Brexit, and evolving to address various challenges. The European project is intact, despite Brexit, and evolving to address various challenges. This is not to say that European elections pose no risk. In fact, there will be upsets as a result of this year’s crisis and the troubled aftermath. The countries with upcoming elections – or likely snap elections in the not-too-distant future, like Spain and Italy – show various levels of vulnerability to opposition parties (Chart 23). Chart 23Post-COVID EU Elections Will Not Be A Cakewalk
Post-COVID EU Elections Will Not Be A Cakewalk
Post-COVID EU Elections Will Not Be A Cakewalk
Chart 24Immigration Tailwind For Populism Subsided
Immigration Tailwind For Populism Subsided
Immigration Tailwind For Populism Subsided
The chief risks to Europe stem from fiscal normalization and instability abroad. Regime failures in the Middle East and Africa could send new waves of immigration, and high levels of immigration have fueled anti-establishment politics over the past decade. Yet this is not a problem at the moment (Chart 24). And even more so than the US, the EU has tightened border enforcement and control over immigration (Chart 25). This has enabled the political establishment to save itself from populist discontent. The other danger for Europe is posed by Russian instability. In general, Moscow is focusing on maintaining domestic stability amid the pandemic and ongoing economic austerity, as well as eventual succession concerns. However, Vladimir Putin’s low approval rating has often served as a warning that Russia might take an external action to achieve some limited national objective and instigate opposition from the West, which increases government support at home (Chart 26). Chart 25Europe Tough On Immigration Like US
Europe Tough On Immigration Like US
Europe Tough On Immigration Like US
Chart 26Warning Sign That Russia May Lash Out
Warning Sign That Russia May Lash Out
Warning Sign That Russia May Lash Out
Chart 27Russian Geopolitical Risk Premium Rising
Russian Geopolitical Risk Premium Rising
Russian Geopolitical Risk Premium Rising
The US Democratic Party is also losing faith in engagement with Russia, so while it will need to negotiate on Iran and arms reduction, it will also seek to use sanctions and democracy promotion to undermine Putin’s regime and his leverage over Europe. The Russian geopolitical risk premium will rise, upsetting an otherwise fairly attractive opportunity relative to other emerging markets (Chart 27). Bottom Line: The European democracies have passed a major “stress test” over the past decade. The dollar will fall relative to the euro, in keeping with macro fundamentals, though it will not be supplanted as the leading reserve currency. Europe and the euro will benefit from the change of power in Washington, and a rise in European political risks will still be minor from a global point of view. Russia and the ruble will suffer from a persistent risk premium. Investment Takeaways As the “Year of the Rat” draws to a close, geopolitical risk and global policy uncertainty have come off the boil and safe haven assets have sold off. Yet geopolitical risk will remain elevated in 2021. The secular drivers of the dramatic rise in this risk since 2008 have not been resolved. To play the above themes and views, we are initiating the following strategic investment recommendations: Long developed market equities ex-US – US outperformance over DM has reached extreme levels and the global economic cycle and post-pandemic revival will favor DM-ex-US. Long emerging market equities ex-China – Emerging markets will benefit from a falling dollar and commodity recovery. China has seen the good news but now faces the headwinds outlined above. Long European industrials relative to global – European equities stand to benefit from the change of power in Washington, US-China decoupling, and the global recovery. Long Mexican industrials versus emerging markets – Mexico witnessed the rise of an American protectionist and a landslide election in favor of a populist left-winger. Now it has a new trade deal with the US and the US is diversifying from China, while its ruling party faces a check on its power via midterm elections, and, regardless, has maintained orthodox economic policy. Long Indian equities versus Chinese – Prime Minister Narendra Modi has a single party majority, four years on his political clock, and has recommitted to pro-productivity structural reforms. The nation is taking more concerted action in pursuit of economic development since strategic objectives in South Asia cannot be met without greater dynamism. The US, Japan, Australia, and other countries are looking to develop relations as they diversify from China. Matt Gertken Vice President Geopolitical Strategy mattg@bcaresearch.com
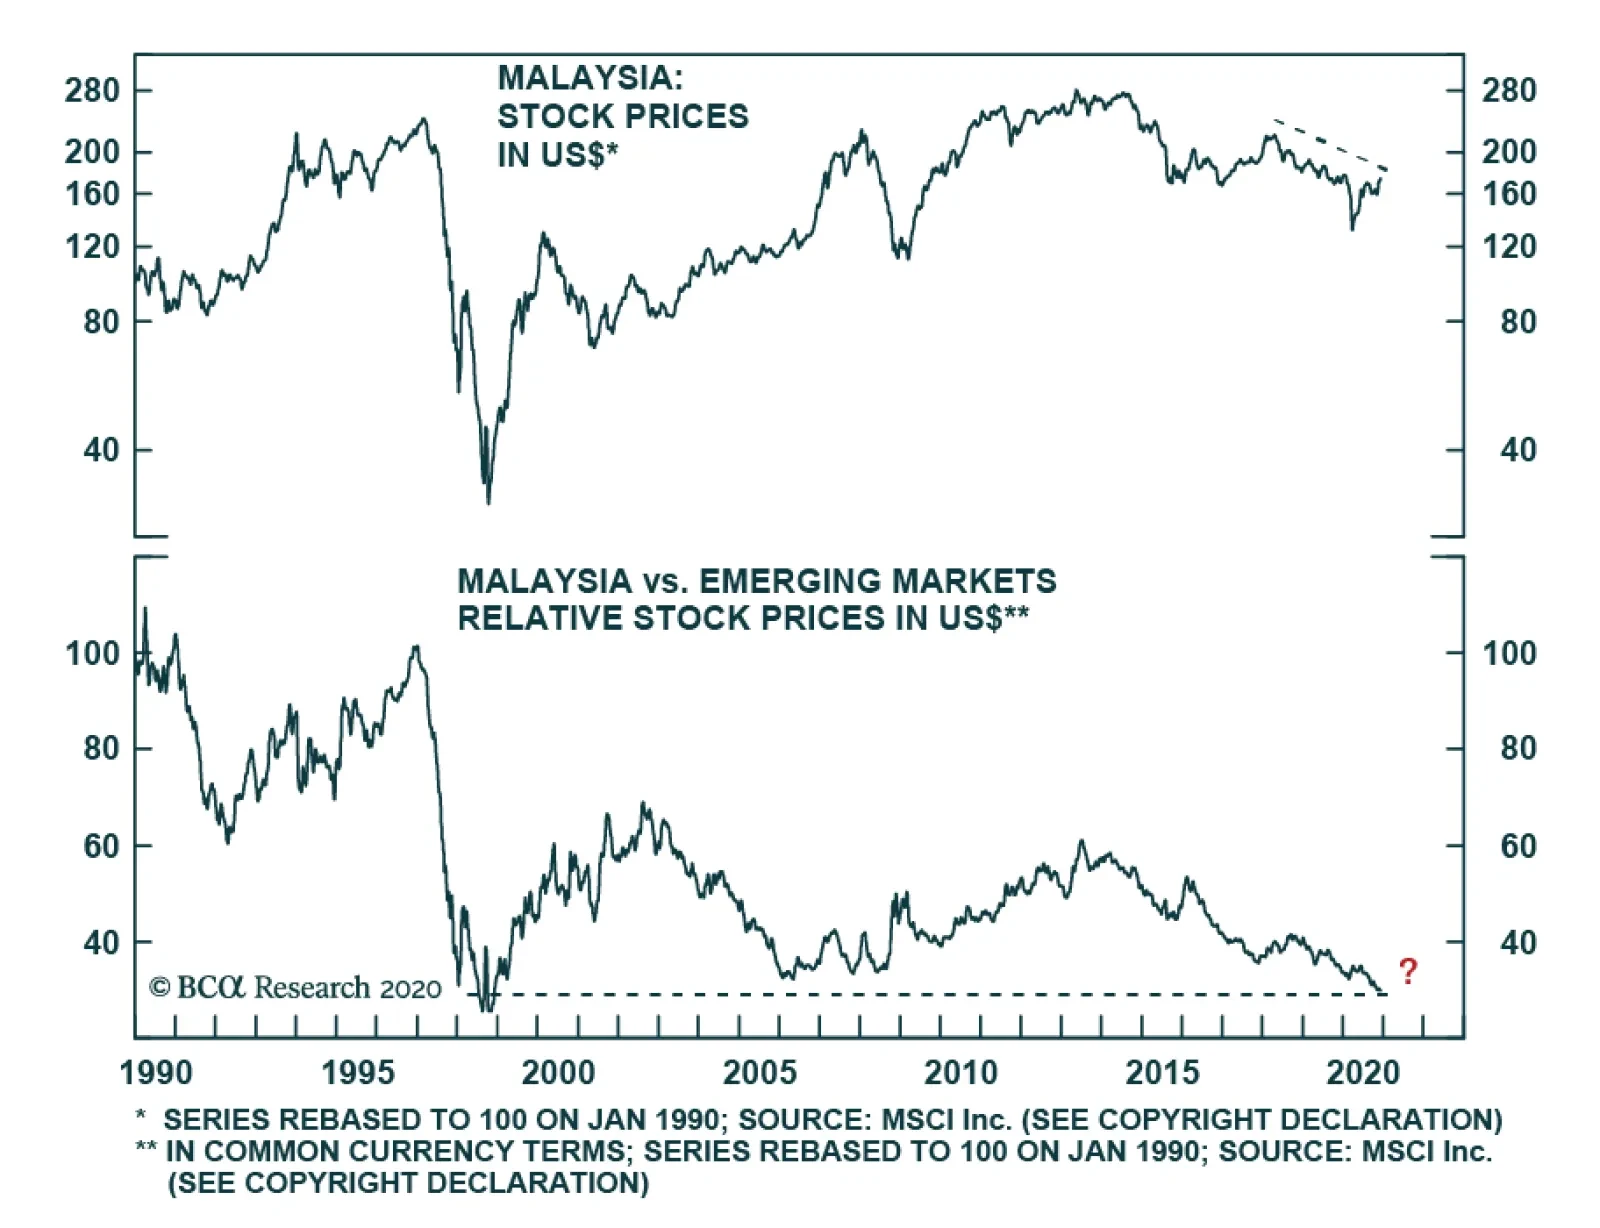
According to BCA Research’s Emerging Markets Strategy service, Malaysian equity underperformance has yet to run its course. Investors should use any rally from oversold positions to downgrade this bourse to underweight. The prolonged bear market in…
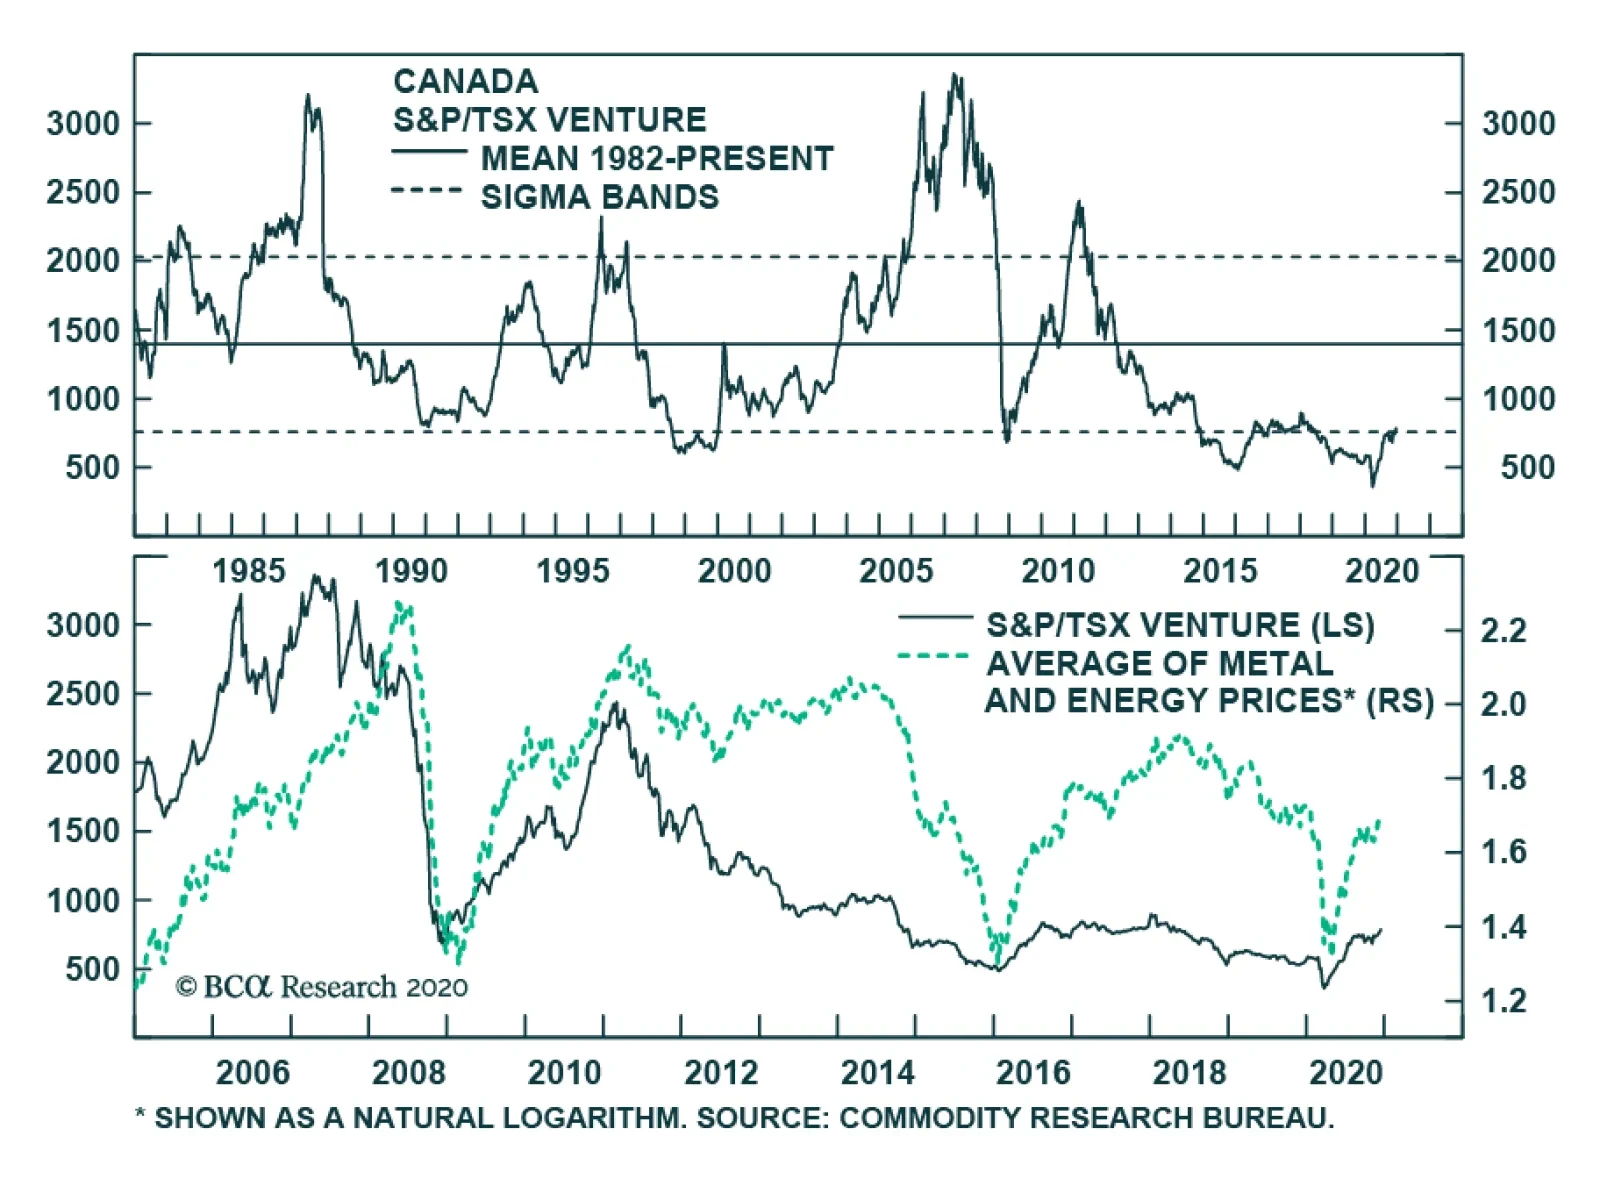
The Canadian TSX/Venture exchange is one of the rare markets in the world trading near all-time lows. Its heavy exposure to commodities and small-cap stocks have been a major handicap this cycle, but now that a rotation out of large-cap stocks is taking…
Dear Client, We are sending you our Strategy Outlook today, where we outline our thoughts on the macro landscape and the direction of financial markets for 2021 and beyond. Next week, please join me for a webcast on Thursday, December 17 at 10:00 AM EST (3:00 PM GMT, 4:00 PM CET, 11:00 PM HKT) where I will discuss the outlook. Our publishing schedule will resume early next year. On behalf of the entire Global Investment Strategy team, I would like to wish you a Merry Christmas, Happy Holidays, and a Healthy New Year! Best regards, Peter Berezin, Chief Global Strategist Highlights Macroeconomic outlook: The global economy will strengthen in 2021 as the pandemic winds down. Inflation will remain well contained for the next 2-to-3 years before moving sharply higher by the middle of the decade. Global asset allocation: Stocks are technically overbought and vulnerable to a short-term correction. Nevertheless, investors should favor equities over bonds in 2021 given the likelihood that earnings will accelerate while monetary policy stays accommodative. Equities: This year’s losers will be next year’s winners. In 2021, international stocks will outperform US stocks, small caps will outperform large caps, banks will outperform tech, and value stocks will outperform growth stocks. Fixed income: Bond yields will rise modestly next year, implying that investors should maintain below average duration exposure. Spread product will outperform safe government bonds. Favor inflation-protected securities over nominal bonds. Currencies: The US dollar will continue to weaken in 2021. The collapse in US interest rate differentials versus its trading partners, stronger global growth, and a widening US trade deficit are all bearish for the greenback. Commodities: Tight supply conditions and a cyclical recovery in oil demand will support crude prices. Investors should favor gold over bitcoin as a hedge against long-term inflation risk. I. Macroeconomic Outlook V Is For Vaccine Chart 1Efficacy Rates Of Seasonal Flu Vaccines Are Well Below Those Of The Covid-19 Vaccines
Strategy Outlook – 2021 Key Views: Navigating A Post-Pandemic World
Strategy Outlook – 2021 Key Views: Navigating A Post-Pandemic World
Ten months after the start of the pandemic, there is a light at the end of the tunnel. Both of the vaccines developed by Pfizer-BioNTech and Moderna using mRNA technology have demonstrated efficacy rates of around 95%. AstraZeneca’s vaccine, produced in collaboration with Oxford University, showed an efficacy rate of 90% in one of its clinical arms. Russia and China have also launched vaccines. The Russian vaccine, Gamaleya, displayed an efficacy rate of 91% based on 22,000 test participants. Such high efficacy rates are on par with the measles and smallpox vaccines, and well above the typical 30%-to-50% success rate for the seasonal flu vaccine (Chart 1). Inoculating most of the world’s population will not be easy. Nevertheless, large-scale vaccine production has already begun. More than half of the professional forecasters enrolled in the Good Judgement Project expect enough doses to be available to vaccinate 200 million Americans (about 60% of the US population) by the end of the second quarter of 2021 (Chart 2). Chart 2Mass Distribution Of Covid-19 Vaccines Expected By Mid-2021
Strategy Outlook – 2021 Key Views: Navigating A Post-Pandemic World
Strategy Outlook – 2021 Key Views: Navigating A Post-Pandemic World
According to opinion polls, public concern about the potential side effects from the vaccines, while still high, has diminished over the past few weeks (Chart 3). Most countries will start by vaccinating health care workers and other at-risk groups. Assuming no major side effects are reported, the successful deployment of the vaccines among health care professionals should bolster confidence within the general public. Chart 3The Public Is Slowly Becoming Less Worried About Covid-19 Vaccines
Strategy Outlook – 2021 Key Views: Navigating A Post-Pandemic World
Strategy Outlook – 2021 Key Views: Navigating A Post-Pandemic World
Vaccines And Growth: A Short-Term Paradox? There is no doubt that the availability of a safe and effective vaccine will bolster economic activity over the medium-to-long term. The short-term impact, however, is ambiguous. On the one hand, vaccine optimism could reduce household precautionary savings. It could also prompt more firms to invest in new capacity. On the other hand, the expectation that a vaccine is coming could motivate people to take even greater efforts to avoid getting sick in the interim. Think about what happens when you take cover under a tree after it starts to rain. Your decision to stay under the tree depends on how long you expect the rain to continue. If the rain will last for only 10 minutes, staying put makes sense. However, if it will rain continuously for the next two days, you are better off going home. You are going to get wet anyway. Who wants to get sick just as the pandemic is winding down? It is like being the last soldier killed on the battlefield. Growth In Europe Suffering More Than In The US… So Far The number of new daily cases has declined by 45% in the EU from the highs reached in the second week of November. That said, progress on the disease front has come at a cost. As Covid infections surged, European governments were forced to reimplement a variety of lockdown measures (Chart 4). Correspondingly, growth indicators have weakened across the region (Chart 5). At this point, it looks highly likely that GDP will contract in the euro area and the UK in the fourth quarter. Chart 4The Latest Viral Surge Led To Lockdowns In Europe
Strategy Outlook – 2021 Key Views: Navigating A Post-Pandemic World
Strategy Outlook – 2021 Key Views: Navigating A Post-Pandemic World
In contrast to Europe, the US economy should expand in the fourth quarter. The Atlanta Fed’s GDPNow model is pointing to growth of 11.2% in Q4, led by a recovery in personal consumption, strength in residential and nonresidential investment, and inventory restocking. Nevertheless, dark clouds are forming. After a short-lived dip in late November, the number of new daily cases in the US is on the rise again. The 7-day average of confirmed new cases has jumped to around 200,000. The Centers for Disease Control (CDC) estimates that for every single case that is caught, seven go undiagnosed.1 This implies that over 11 million people are being infected each week, or about 3% of the US population. With the weather getting colder and the Christmas holiday season approaching, a further viral surge looks probable. Just as in Europe, we may see more lockdowns and more voluntary social distancing in the US over the coming weeks. Building A Fiscal Bridge To A Post-Pandemic World Lockdowns would be less of a problem if governments provided enough income support to struggling households and businesses. Unfortunately, at least in the US, considerable uncertainty remains about whether such support will be forthcoming. After a burst of stimulus earlier this year, US fiscal policy has tightened sharply. Since peaking in April, real disposable personal income has dropped by 9%, reflecting a steep decline in government transfer payments (Chart 6). The latest data suggest that real disposable income will be down in Q4 compared to the preceding quarter. Chart 5Renewed Lockdowns Are Weighing On Economic Activity In The Euro Area
Renewed Lockdowns Are Weighing On Economic Activity In The Euro Area
Renewed Lockdowns Are Weighing On Economic Activity In The Euro Area
Chart 6Less Transfers Mean Less Income
Strategy Outlook – 2021 Key Views: Navigating A Post-Pandemic World
Strategy Outlook – 2021 Key Views: Navigating A Post-Pandemic World
President Trump tried to offset some of the sting from the expiration of emergency unemployment benefits in the CARES Act by diverting funds from the Federal Emergency Management Agency (FEMA) to support jobless workers. However, this money has now run out (Chart 7). Likewise, the resources in the Paycheck Protection Program for small businesses have been depleted, and many state and local governments are facing a cash crunch. Chart 7Drastic Drop In Unemployment Insurance Payments
Drastic Drop In Unemployment Insurance Payments
Drastic Drop In Unemployment Insurance Payments
Chart 8People Are Eager For More Stimulus
Strategy Outlook – 2021 Key Views: Navigating A Post-Pandemic World
Strategy Outlook – 2021 Key Views: Navigating A Post-Pandemic World
The US Congress has been squabbling over a new stimulus bill since May. Ultimately, we think a bill will be passed, potentially as part of a year-end omnibus spending package. Public opinion still very much favors maintaining stimulus. A survey conducted by Pew Research after the election found that about 80% of respondents supported passing a new stimulus package (Chart 8). Similarly, according to a recent NY Times/Siena College poll, 72% of voters supported a hypothetical $2 trillion stimulus package that would extend emergency unemployment insurance benefits, distribute direct cash payments to households, and provide financial support to state and local governments (Table 1). Such a package is basically what the Democrats are proposing. Strikingly, when this package is described in non-partisan terms, even the majority of Republicans are in favor of it. Table 1Even Republicans Want More Stimulus
Strategy Outlook – 2021 Key Views: Navigating A Post-Pandemic World
Strategy Outlook – 2021 Key Views: Navigating A Post-Pandemic World
Peak Chinese Stimulus Even though it originated there, China has weathered the pandemic better than any other major country. Chinese export growth accelerated to 21.1% year-over-year in November. The Caixin manufacturing PMI rose to 54.9 on the month, the strongest reading since November 2010. The service sector PMI increased to a healthy 57.8. The “official” PMIs published by the National Bureau of Statistics also rose. Chinese growth will moderate over the coming months. The magnitude of China’s policy support has peaked, as evidenced by the rise in bond yields and interbank rates (Chart 9). The authorities have also permitted more corporate issuers to default, while tightening rules on online lending. Turning points in Chinese domestic demand and imports tend to lag policy developments by about 6-to-9 months (Chart 10). Thus, the tailwind from Chinese stimulus should fade by the middle of next year, hopefully just in time for the baton to be passed to a more organic, vaccine-driven global growth recovery. Chart 9China: Bond Yields And Interbank Rates Have Been Rising
China: Bond Yields And Interbank Rates Have Been Rising
China: Bond Yields And Interbank Rates Have Been Rising
Chart 10Tailwind From Chinese Stimulus Will Fade By The Middle Of Next Year
Tailwind From Chinese Stimulus Will Fade By The Middle Of Next Year
Tailwind From Chinese Stimulus Will Fade By The Middle Of Next Year
Japan: Near-Term Wobbles Japan is in the midst of its third wave of the pandemic. While not as bad as the latest waves in the US and Europe, it has still been disruptive enough to slow the economy. Although it did tick up in November, the manufacturing PMI remains below the crucial 50 boom/bust line, notably weaker than in other APAC countries. The outlook component of the Economy Watchers Survey fell to 36.5 in November (from 49.1), while the current situation component slid to 45.6 (from 54.5). Nevertheless, there are some encouraging signs. The number of new Covid cases seems to be stabilizing. Machine tool orders rose to 8% year-over-year in November, the first positive print since September 2018. Retail sales have recovered from a low of -14% year-over-year in April to around +6% in October. Broad money growth has reached a record high. The Japanese government is also considering a new ¥73 trillion fiscal stimulus package to fight the pandemic. Global Monetary Policy To Stay Accommodative Chart 11Service And Shelter Inflation Tend To Be Largely Determined By Labor Market Slack
Service And Shelter Inflation Tend To Be Largely Determined By Labor Market Slack
Service And Shelter Inflation Tend To Be Largely Determined By Labor Market Slack
Could a vaccine-led economic recovery cause central banks to remove the punch bowl? We think not. Inflation is likely to rise in the first half of 2021 as the “base effects” from the pandemic-induced drop in prices reverse. However, central banks will see through these short-term oscillations in inflation. Inflation in modern economies is largely driven by services and shelter (goods account for only 25% of the US core CPI and 37% of the euro area core CPI). Both service inflation and shelter inflation tend to be largely determined by labor market slack (Chart 11). In its October 2020 World Economic Outlook, the IMF projected that the unemployment rate in the main developed economies would fall back to its full employment level by around 2025 (Chart 12). While this is too pessimistic in light of the subsequent progress that has been made on the vaccine front, it is probable that unemployment will remain too high to generate an overheated economy for the next 2-to-3 years. Chart 12Unemployment Rate Is Projected To Decline Towards Pre-Covid Lows In The Coming Years
Strategy Outlook – 2021 Key Views: Navigating A Post-Pandemic World
Strategy Outlook – 2021 Key Views: Navigating A Post-Pandemic World
Chart 13Long-Term Inflation Expectations Are Still Subdued
Strategy Outlook – 2021 Key Views: Navigating A Post-Pandemic World
Strategy Outlook – 2021 Key Views: Navigating A Post-Pandemic World
Moreover, despite vaccine optimism, long-term inflation expectations are still below target in most of the major economies (Chart 13). Not only do central banks want inflation to return to target, they want inflation to overshoot their targets in order to make up for the shortfall in inflation in the post-GFC era. Had the core PCE deflator in the US risen by 2% per year since 2012, the price level would be about 3.3% higher than it currently is. In the euro area, the price level is about 9.5% below where it would have been if consumer prices had risen by 2% over this period. In Japan, the price level is 11.6% below target (Chart 14). Chart 14Central Banks Have Missed Their Inflation Targets
Strategy Outlook – 2021 Key Views: Navigating A Post-Pandemic World
Strategy Outlook – 2021 Key Views: Navigating A Post-Pandemic World
II. Financial Markets A. Global Asset Allocation Remain Overweight Equities Versus Bonds On A 12-Month Horizon Equities have run up a lot since the start of November. Bullish sentiment has surged in the American Association of Individual Investors weekly bull-bear poll, while the put-to-call ratio has fallen to multi-year lows (Chart 15). This makes equities vulnerable to a short-term correction. Nevertheless, rising odds of an effective vaccine and continued easy monetary policy keep us bullish on stocks over a 12-month horizon. Stronger economic growth should lift earnings estimates. Stocks have usually outperformed bonds when growth has been on the upswing (Chart 16). Chart 15A Lot Of Bullishness
A Lot Of Bullishness
A Lot Of Bullishness
Chart 16Stocks Rarely Underperform Bonds When The Global Economy Is Strengthening
Stocks Rarely Underperform Bonds When The Global Economy Is Strengthening
Stocks Rarely Underperform Bonds When The Global Economy Is Strengthening
Valuations also favor stocks. As Chart 17 illustrates, the global equity risk premium – which we model by subtracting real bond yields from the cyclically-adjusted earnings yield – remains quite high. Along the same lines, dividend yields are above bond yields in the major markets. Even if one were to pessimistically assume that nominal dividend payments stay flat for the next 10 years, real equity prices would have to fall by 24% in the US for stocks to underperform bonds (Chart 18). In the euro area, real equity prices would need to tumble 32%. In Japan, they would have to drop 20%. Chart 17Equity Risk Premia Remain Elevated
Equity Risk Premia Remain Elevated
Equity Risk Premia Remain Elevated
Chart 18Stocks Would Need To Fall A Lot For Equities To Underperform Bonds
Stocks Would Need To Fall A Lot For Equities To Underperform Bonds
Stocks Would Need To Fall A Lot For Equities To Underperform Bonds
As such, investors should overweight global equities relative to bonds. We recommend a neutral allocation to cash to take advantage of any short-term dip in stock prices. Our full suite of asset allocation and trade recommendations are shown at the back of this report. B. Equity Sectors, Regions, Styles This Year’s Losers Will Be Next Year’s Winners The “pandemic trade” is giving way to the “reopening trade.” We are still in the early innings of this transition. Hence, going into next year, it makes sense to favor stocks that were crushed by lockdown measures but could thrive once restrictions are lifted. Chart 19 shows relative 12-months forward earnings estimates for US/non-US, large caps/small caps, and tech/overall market. In all three cases, the tables have turned: Estimates are now rising more quickly for non-US stocks, small caps, and non-tech sectors. Non-US Stocks To Outperform Stocks outside the US are significantly cheaper than their US peers based on price-to-earnings, price-to-book, price-to-sales, and dividend yields (Chart 20). The macro outlook also favors non-US stocks, which tend to outperform when global growth is strengthening and the US dollar is weakening (Chart 21). Chart 19Relative Earnings Expectations For Non-US Stocks, Small Caps, And Non-Tech Are Improving
Relative Earnings Expectations For Non-US Stocks, Small Caps, And Non-Tech Are Improving
Relative Earnings Expectations For Non-US Stocks, Small Caps, And Non-Tech Are Improving
Chart 20Non-US Stocks Are Cheaper
Non-US Stocks Are Cheaper
Non-US Stocks Are Cheaper
Chart 21Non-US Equities Tend To Outperform Their US Peers When Global Growth Is Improving And The Dollar Is Weakening
Non-US Equities Tend To Outperform Their US Peers When Global Growth Is Improving And The Dollar Is Weakening
Non-US Equities Tend To Outperform Their US Peers When Global Growth Is Improving And The Dollar Is Weakening
As we discuss below, the dollar is likely to depreciate further over the next 12 months. A weaker dollar benefits cyclical sectors of the stock market more than defensives (Chart 22). Deep cyclicals are overrepresented outside the US (Table 2). Being more cyclical in nature, small caps usually outperform when the dollar weakens (Chart 23). Chart 22Cyclicals Tend To Outperform Defensives In A Falling Dollar Environment
Cyclicals Tend To Outperform Defensives In A Falling Dollar Environment
Cyclicals Tend To Outperform Defensives In A Falling Dollar Environment
Table 2Financials Are Overrepresented In Ex-US Indices, While Tech Dominates The US Market
Strategy Outlook – 2021 Key Views: Navigating A Post-Pandemic World
Strategy Outlook – 2021 Key Views: Navigating A Post-Pandemic World
Chart 23Small Caps Also Tend To Outperform When Global Growth Strengthens And The Dollar Weakens
Small Caps Also Tend To Outperform When Global Growth Strengthens And The Dollar Weakens
Small Caps Also Tend To Outperform When Global Growth Strengthens And The Dollar Weakens
Chart 24Banks’ Net Interest Margins Will Receive A Boost
Banks' Net Interest Margins Will Receive A Boost
Banks' Net Interest Margins Will Receive A Boost
Buy The Banks Banks comprise a larger share of non-US stock markets. Stronger growth in 2021 will put upward pressure on long-term bond yields. Since short-term rates will stay where they are, yield curves will steepen. Steeper yield curves will boost banks’ net interest margins (Chart 24). In addition, faster economic growth will put a lid on defaults. Banks have set aside considerable capital for pandemic-related loan losses. Yet, the wave of defaults that so many feared has failed to materialize. According to the American Bankruptcy Institute, commercial bankruptcies are lower now than they were this time last year (Chart 25). Personal loan delinquencies have also been trending down. The 60-day delinquency rate on credit card debt fell to 1.16% in October from 2.02% a year earlier. The delinquency rate for mortgages fell from 1.54% to 0.98%. Only auto loan delinquencies registered a tiny blip higher (Table 3). Chart 25Commercial Bankruptcies Are Well Contained
Strategy Outlook – 2021 Key Views: Navigating A Post-Pandemic World
Strategy Outlook – 2021 Key Views: Navigating A Post-Pandemic World
Table 3Personal Loan Delinquencies Have Also Been Trending Lower
Strategy Outlook – 2021 Key Views: Navigating A Post-Pandemic World
Strategy Outlook – 2021 Key Views: Navigating A Post-Pandemic World
Just A “Value Bounce”? In our conversations with clients, many investors are open to the idea that value stocks are due for a cyclical bounce. However, most still believe that growth stocks will fare best over a longer-term horizon. Such a view is understandable. After all, profit growth is the principal driver of equity returns. If, by definition, growth companies enjoy faster earnings growth, does it not stand to reason that growth stocks will outperform value stocks over the long haul? Well, actually, it doesn’t. What matters is profit growth relative to expectations, not absolute profit growth. If earnings rise quickly, but by less than investors had anticipated, stock prices could still go down. Historically, investors have tended to extrapolate earnings trends too far into the future, which has led them to overpay for growth stocks. Chart 26 demonstrates this point analytically. It features the results of a study by Louis Chan, Jason Karceski, and Josef Lakonishok. The authors sorted companies by projected five-year earnings growth and then compared the analysts’ forecasts with realized earnings. For the most part, they found that there was no relationship between expected profit growth and realized profit growth beyond horizons of two years. In general, the higher the long-term earnings growth estimates, the more likely actual earnings were to miss expectations. Chart 26Investors Tend To Overpay For Growth
Strategy Outlook – 2021 Key Views: Navigating A Post-Pandemic World
Strategy Outlook – 2021 Key Views: Navigating A Post-Pandemic World
The Paradox Of Growth Given the difficulty of picking individual stocks that will consistently surpass earnings estimates, should investors simply allocate the bulk of their capital to sectors such as technology that have the best long-term growth prospects while eschewing structurally challenged sectors such as energy and financials? Again, the answer is not as obvious as it may seem. As Chart 27 illustrates, stocks in industries that experience a burst of output growth do tend to outperform other stocks. However, over the long haul, companies in fast growing industries do not outperform their peers (Chart 28). In other words, stock prices seem to respond more to unanticipated changes in industry growth rather than to the trend level of growth. Chart 27Stocks In Industries That Experience A Burst Of Output Growth Do Tend To Outperform Other Stocks …
Strategy Outlook – 2021 Key Views: Navigating A Post-Pandemic World
Strategy Outlook – 2021 Key Views: Navigating A Post-Pandemic World
Chart 28… But Over The Long Haul, Companies In Fast-Growing Industries Do Not Outperform Their Peers
Strategy Outlook – 2021 Key Views: Navigating A Post-Pandemic World
Strategy Outlook – 2021 Key Views: Navigating A Post-Pandemic World
Explaining Tech Outperformance In this vein, it is useful to examine what has powered the performance of US tech stocks over the past 25 years. Chart 29 shows that faster sales-per-share growth explains less than half of tech’s outperformance since 1996 and none of tech’s outperformance in the period up to 2011. The majority of tech’s outperformance is explained by greater margin expansion and an increase in the P/E ratio at which tech stocks trade relative to the rest of the stock market. Chart 29Decomposing Tech Outperformance
Decomposing Tech Outperformance
Decomposing Tech Outperformance
What accounts for the significant increase in tech profit margins? In two words, the answer is “monopoly power.” Tech companies are particularly susceptible to network effects: The more people who use a particular tech platform, the more attractive it is for others to use it. Facebook is a classic example. Second, tech companies benefit significantly from scale economies. Once a piece of software has been written, creating additional copies costs almost nothing. Even in the hardware realm, the marginal cost of producing an additional chip is tiny compared to the fixed cost of designing it. All of this creates a winner take-all environment where success begets further success. Normally, structurally fast-growing industries attract more competition, which increases the odds that up-and-coming firms will displace incumbents. The growth of tech monopolies has subverted that process, allowing profits to rise significantly. A Tougher Path Forward For Tech A key question for investors is how much additional scope today’s tech monopolies have to expand profits. While it is difficult to generalize, two broad forces are likely to curtail future earnings growth. First, many tech titans have become so big that their future growth will be driven less by their ability to take market share from competitors and more by the overall size of the markets in which they operate. As it is, close to three-quarters of US households have an Amazon Prime account. Slightly over half have a Netflix account. Nearly 70% have a Facebook account. Google commands 92% of the internet search market. Together, Google and Facebook generate about 60% of all online advertising revenue. Second, the monopoly power wielded by tech companies makes them vulnerable to governmental action, including higher taxes, increased regulation, and stronger anti-trust enforcement. Importantly, it is not just the left that wants greater scrutiny of tech companies. According to a recent Pew Research study, more than half of conservative Republicans favor increasing government regulation of the tech sector (Chart 30). Chart 30Conservatives Favor Increased Government Regulation Of Big Tech Companies
Strategy Outlook – 2021 Key Views: Navigating A Post-Pandemic World
Strategy Outlook – 2021 Key Views: Navigating A Post-Pandemic World
We do not expect tech stocks to decline in absolute terms since they still have a variety of tailwinds supporting them. Nevertheless, our bet is that the cyclical shift in favor of value stocks we are seeing now will usher in a period of outperformance for value names that could last for much of this decade. Not only are value stocks exceptionally cheap compared to growth stocks (Chart 31), but as we discuss below, bond yields likely reached a secular bottom this year. This could set the stage for a period of lasting outperformance for value plays. Chart 31Value Stocks Are Extremely Cheap Relative To Growth Stocks
Value Stocks Are Extremely Cheap Relative To Growth Stocks
Value Stocks Are Extremely Cheap Relative To Growth Stocks
C. Fixed Income Position For Steeper Yield Curves As discussed earlier, central banks are unlikely to raise rates over the next 2-to-3 years. In fact, short-term real rates will probably decline further in 2021 as inflation expectations rise towards central bank targets. What about longer-term bond yields? Chart 32 displays the expected path of policy rates in the major developed economies now and at the start of 2020. The chart suggests that there is still scope for rate expectations in the post-2023 period to recover some of the ground they have lost since the start of the pandemic. This implies that bond investors should position for steeper yield curves, while keeping duration risk at below-benchmark levels. They should also favor inflation-linked securities over nominal bonds. Chart 32Policy Rate Expectations Remain Below Pre-Pandemic Levels
Policy Rate Expectations Remain Below Pre-Pandemic Levels
Policy Rate Expectations Remain Below Pre-Pandemic Levels
Avoid “High Beta” Government Bond Markets The highest-yielding bond markets tend to have the highest “betas” to the general direction of global bond yields (Chart 33). This means when global bond yields are rising, higher-yielding markets such as the US usually experience the biggest selloff in bond prices. Chart 33High-Yielding Bond Markets Are The Most Cyclical
High-Yielding Bond Markets Are The Most Cyclical
High-Yielding Bond Markets Are The Most Cyclical
This pattern exists because faster growth has a more subdued impact on rate expectations in economies such as Europe and Japan where the neutral rate of interest is stuck deep in negative territory. For example, if stronger growth lifts the neutral rate in Japan from say, -4% to -2%, this would still not warrant raising rates. In contrast, if stronger growth lifts the neutral rate from -1% to +1% in the US, this would eventually justify a rate hike. As such, we would underweight US Treasurys in global government bond portfolios. We expect the 10-year Treasury yield to increase to around 1.3%-to-1.5% by the end of 2021, which is above current expectations of 1.15% based on the forward curve. Conversely, we would overweight European and Japanese government bond markets. After adjusting for currency-hedging costs, US Treasurys offer only a small yield pickup over European and Japanese bonds but face a much greater risk of capital losses as rate expectations recover (Table 4). Table 4Bond Markets Across The Developed World
Strategy Outlook – 2021 Key Views: Navigating A Post-Pandemic World
Strategy Outlook – 2021 Key Views: Navigating A Post-Pandemic World
BCA’s global fixed-income strategists have a neutral recommendation on Canadian and Australian bonds. While Canadian and Australian yields are also “high beta,” both the BoC and the RBA are very active purchasers in their domestic markets. Stay Overweight High-Yield Developed Market Corporate Debt In fixed-income portfolios, we would overweight corporate debt relative to safer government bonds. In an economic environment where monetary policy remains accommodative and growth is rebounding, corporate default rates should remain contained, which will keep spreads from widening. Within corporate credit, we favor high yield over investment grade. Geographically, we prefer US corporate bonds over euro area bonds. The former trade with a higher yield and spread than the latter (Charts 34A & B). Chart 34AFavor High-Yield Bonds Over Investment-Grade ...
Favor High-Yield Bonds Over Investment-Grade ...
Favor High-Yield Bonds Over Investment-Grade ...
Chart 34B… And US Corporates Over Euro Area
... And US Corporates Over Euro Area
... And US Corporates Over Euro Area
One way to gauge the attractiveness of credit is to look at the percentile rankings of 12-month breakeven spreads. The 12-month breakeven spread is the amount of credit spread widening that can occur before a credit product starts to underperform a duration-matched, risk-free government bond over a one-year horizon. For US investment-grade corporates, the breakeven spread is currently in the bottom decile of its historic range, which is rather unattractive from a risk-adjusted perspective. In contrast, the US high-yield breakeven spread is currently in the 62nd percentile, which is quite enticing. In the UK, high-yield debt is more appealing than investment grade, although not quite to the same extent as in the US. In the euro area, both high-yield and investment-grade credit are fairly unattractive (Chart 35). Chart 35Corporate Bond Breakeven Spread Percentile Rankings
Corporate Bond Breakeven Spread Percentile Rankings (I)
Corporate Bond Breakeven Spread Percentile Rankings (I)
Outside the corporate sector, our US bond strategists like consumer ABS due to the strength of household balance sheets. They also see value in municipal bonds. However, they would avoid MBS, as prepayment risks are elevated in that sector. EM credit should also benefit from the combination of stronger global growth and a weaker US dollar. Long-Term Inflation Risk Is Underpriced As noted earlier in the report, inflation is unlikely to rise significantly over the next three years. Beyond then, a more inflationary environment is probable. Chart 36 shows that the wage-version of the Phillips curve in the US is alive and well. It just so happens that over the past three decades, the labor market has never had a chance to overheat. Something always came along that derailed the economy before a price-wage spiral could develop. This year it was the pandemic. In 2008 it was the Global Financial Crisis. In 2000 it was the dotcom bust and in the early 1990s it was the collapse in commercial real estate prices following the Savings and Loan Crisis. Admittedly, only the pandemic qualifies as a true “exogenous” shock. The prior three recessions were endogenous in nature to the extent that they were preceded by growing economic imbalances, laid bare by a Fed hiking cycle. One can debate the degree to which the global economy is suffering from imbalances today, but one thing is certain: no major central bank is keen on raising rates anytime soon. Central banks want higher inflation. They are likely to get it. D. Currencies, Commodities, And Yes, Bitcoin Dollar Bear Market To Continue In 2021 The dollar faces a number of headwinds going into next year. First, interest rate differentials have moved significantly against the greenback. At the start of 2019, US real 2-year rates were about 190 basis points above rates of other developed economies; today, US real rates are around 60 basis points lower than those abroad. In fact, as Chart 37 shows, the trade-weighted dollar has weakened less than one would have expected based on the decline in interest rate differentials. This suggests that there could be some “catch-up” weakness for the dollar next year even if rate differentials remain broadly stable. Chart 36Is The Phillips Curve Really Dead?
Is The Phillips Curve Really Dead?
Is The Phillips Curve Really Dead?
Chart 37A Relatively Muted Decline In The Dollar Given The Move In Real Yield Differentials
A Relatively Muted Decline In The Dollar Given The Move In Real Yield Differentials
A Relatively Muted Decline In The Dollar Given The Move In Real Yield Differentials
Second, the US dollar is a counter-cyclical currency, meaning that it tends to move in the opposite direction of the global business cycle (Chart 38). If the global economy strengthens next year thanks to an effective vaccine, the dollar should weaken. Chart 38The Dollar Is A Countercyclical Currency
The Dollar Is A Countercyclical Currency
The Dollar Is A Countercyclical Currency
Chart 39USD Remains Overvalued
Strategy Outlook – 2021 Key Views: Navigating A Post-Pandemic World
Strategy Outlook – 2021 Key Views: Navigating A Post-Pandemic World
Third, the US dollar remains about 13% overvalued based on Purchasing Power Parity (PPP) exchange rates (Chart 39). This overvaluation is also reflected in the large US current account deficit, which rose in the second quarter to the highest level since 2008 and is on track to swell even further in the second half of the year. Technicals Are Dollar Bearish Admittedly, many investors are now bearish on the dollar. Shouldn’t one be a contrarian and adopt a bullish dollar view? Not necessarily. In most cases, being contrarian makes sense. However, this does not apply to the dollar. The dollar is a high-momentum currency (Chart 40). When it comes to trading the dollar, it pays to be a trend follower. Chart 40The Dollar Is A High Momentum Currency
Strategy Outlook – 2021 Key Views: Navigating A Post-Pandemic World
Strategy Outlook – 2021 Key Views: Navigating A Post-Pandemic World
One of the simplest and most profitable trading rules for the dollar is to go long the greenback when it is trading above its moving average and go short when it is trading below its moving average (Chart 41). Today, the trade-weighted dollar is trading below its 3-month, 6-month, 1-year, and 2-year moving averages. Along the same lines, the dollar performs best when sentiment is bullish and improving. In contrast, the dollar does worse when sentiment is bearish and deteriorating, as it is now (Chart 42). Chart 41Being A Contrarian Doesn’t Pay When It Comes To Trading The Dollar (I)
Strategy Outlook – 2021 Key Views: Navigating A Post-Pandemic World
Strategy Outlook – 2021 Key Views: Navigating A Post-Pandemic World
Chart 42Being A Contrarian Doesn’t Pay When It Comes To Trading The Dollar (II)
Strategy Outlook – 2021 Key Views: Navigating A Post-Pandemic World
Strategy Outlook – 2021 Key Views: Navigating A Post-Pandemic World
The bottom line is that both fundamental factors – interest rate differentials, global growth, valuations, current account dynamics – and technical factors – moving average rules and sentiment – all point to dollar weakness next year. Top Performing Currencies In 2021 EUR/USD is likely to rise to 1.3 by the middle of next year. The ECB does not want a stronger currency, but with euro area interest rates already in negative territory, there is not much it can do. The Swedish krona, as a highly cyclical currency, should strengthen against the euro. In contrast, the Swiss franc, a classically defensive currency, will weaken against the euro. It is more difficult to forecast the direction of the pound given uncertainty about ongoing Brexit talks. The working assumption of BCA’s geopolitical team is that Prime Minister Boris Johnson has sufficient economic and political incentives to arrive at a trade deal, a parliamentary majority to get it approved, and a powerful geopolitical need to mollify Scotland. This bodes well for sterling. The yen is a very defensive currency. Thus, in an environment of strengthening global growth, the yen is likely to trade flat against the dollar, and in the process, lose ground against most other currencies. We are most bullish about the prospects for EM and commodity currencies going into next year. China is likely to let its currency strengthen further in return for a partial rollback of tariffs by the Biden administration. A stronger yuan will allow other currencies in Asia to appreciate. Stay Bullish On Commodities And Commodity Currencies The combination of a weaker US dollar and stronger global growth should support commodity prices in 2021. Industrial metals outperformed oil this year, but the opposite should be true next year. Chart 43Oil Prices Are Expected To Recover
Oil Prices Are Expected To Recover
Oil Prices Are Expected To Recover
While the long-term outlook for crude is murky in light of the shift towards electric vehicles, the near-term picture remains favorable due to the cyclical rebound in petroleum demand and ongoing OPEC and Russian supply discipline. BCA’s commodity strategists expect the average price of Brent to exceed market expectations by about $14 in 2021, which should help the Norwegian krone, Canadian dollar, Russian ruble, Mexican peso, and Colombian peso (Chart 43). Favor Gold Over Bitcoin As An Inflation Hedge Gold has traditionally served as the go-to hedge against inflation. These days, however, there is a new competitor in town: bitcoin. In traditional economic parlance, money serves three purposes: as a medium of exchange; as a unit of account; and as a store of value. Both gold and bitcoin flunk the test for the first two purposes. Few transactions are conducted in either gold or bitcoin. It is even rarer for prices of goods and services to be set in ounces of gold or units of bitcoin. Gold arguably does better as a store of value. It has been around for a long time and if all else fails, it can always be melted down and turned into nice jewelry. Bitcoin’s Achilles Heel Bitcoin’s defenders argue that the cryptocurrency does serve as a store of value because one day, it will reach a critical mass that will make it a viable medium of exchange and a functional unit of account. Yet, this argument is politically naïve. Countries with fiat currencies derive significant benefits from their ability to create money out of thin air that can then be used to pay for goods and services. In the US, this “seigniorage revenue” amounts to over $100 billion per year. The existence of fiat currencies also gives central banks the power to set interest rates and provide liquidity backstops to the financial sector. Bitcoin’s ability to facilitate anonymous transactions is also its Achilles heel. The widespread use of bitcoin would make it more difficult for governments to tax their citizens. All this suggests that bitcoin will never reach a critical mass where it becomes a viable medium of exchange or functional unit of account. Governments will step in to ban or greatly curtail its usage before then. And without the ability to reach this critical mass, bitcoin’s utility as a store of value will disappear. Hence, investors looking for some inflation protection in their portfolios should stick with gold. Peter Berezin Chief Global Strategist peterb@bcaresearch.com Footnotes 1 Heather Reese, A. Danielle Iuliano, Neha N. Patel, Shikha Garg, Lindsay Kim, Benjamin J. Silk, Aron J. Hall, Alicia Fry, and Carrie Reed, “Estimated incidence of COVID-19 illness and hospitalization — United States, February–September, 2020,” Clinical Infectious Diseases (Oxford Academic), November 25, 2020. Global Investment Strategy View Matrix
Strategy Outlook – 2021 Key Views: Navigating A Post-Pandemic World
Strategy Outlook – 2021 Key Views: Navigating A Post-Pandemic World
Special Trade Recommendations This table provides trade recommendations that may not be adequately represented in the matrix on the preceding page.
Strategy Outlook – 2021 Key Views: Navigating A Post-Pandemic World
Strategy Outlook – 2021 Key Views: Navigating A Post-Pandemic World
Current MacroQuant Model Scores
Strategy Outlook – 2021 Key Views: Navigating A Post-Pandemic World
Strategy Outlook – 2021 Key Views: Navigating A Post-Pandemic World
Highlights Brexit no-deal vs. deal = 1.28 vs. 1.37 on GBP/USD. Any break-out into the high 1.30s is a tactical sell – because the bigger driver of GBP/USD is the global stock market, which is due a breather. The medium-term direction of EUR/USD is gently higher… …yet the best expression of this is not through EUR/USD per se, but through a 50:50 combination of the defensive CHF/USD and the cyclical SEK/USD. Underweight technology versus healthcare. Fractal trade: Long RUB/ZAR. Feature Chart of the WeekWhat's Driving Pound/Dollar? Hint: It's Not Brexit
What's Driving Pound/Dollar? Hint: It's Not Brexit
What's Driving Pound/Dollar? Hint: It's Not Brexit
Brexit is the story that refuses to go away. In the four and a half years since Britons voted to leave the EU, Americans have managed to elect and then reject a president. But as we write, four and a half years of negotiation have still not managed to deliver a UK/EU trade deal. Perhaps, in true European style, a deal will materialise at the eleventh hour, fifty-ninth minute, and fifty-ninth second. The Big Brexit Decisions Have Already Been Made Yet the recent haggling over a free trade deal is a sideshow, a choice between the most minimalist of deals, or no deal. The much bigger decisions on the UK/EU economic and political relationship have already been made. The recent haggling over a UK/EU free trade deal is a sideshow. The UK will end the free movement of people, leave the customs union and single market, and will have the scope to set its own rules, regulations, and standards. In response to these much bigger decisions, foreign direct investment (FDI) into the UK has fully adjusted, which is to say, slumped. Hence, the pound has largely absorbed Brexit and reverted to its traditional dependence on the direction of global equities (Chart of the Week and Chart I-2). This traditional dependence exists because the value of the UK stock market and other risk-assets is outsized relative to the UK economy. Additionally, the UK stock market is over-weighted to economically sensitive sectors. This makes the pound ultra-sensitive to equity and other risk-asset portfolio inflows and outflows (Chart I-3). Chart I-2Brexit Has Become Less Important For The Pound
Brexit Has Become Less Important For The Pound
Brexit Has Become Less Important For The Pound
Chart I-3FDI Has Adjusted For Brexit, So Portfolio Flows Once More Drive The Pound
FDI Has Adjusted For Brexit, So Portfolio Flows Once More Drive The Pound
FDI Has Adjusted For Brexit, So Portfolio Flows Once More Drive The Pound
Having said that, Brexit developments can still cause deviations from the pound’s established relationship with global equities. For example, the escalation and resolution of tensions over the Withdrawal Agreement last year resulted in a 4 cent (3.5 percent) discount and then a 4 cent premium in pound/dollar within a 1.22-1.30 range. Applying the same framework to the current Brexit tensions, the equivalent range would be 1.28-1.37. But to repeat, the bigger driver of pound/dollar is the direction of global equities, and as we explain later, equities may be due a breather. If, for example, stocks corrected by 10 percent, cable could easily retest 1.25. Hence, any break-out of cable into the high 1.30s is a tactical selling opportunity. The ECB Is Exhausted This week, the ECB will once again dip into its alphabet soup of policy weapons: PEPP, TLTRO, APP, NIRP. Not forgetting the potent, and yet unused, OMT. The unfortunate thing is that these instruments have done all they can. They are exhausted. Weapons that provide liquidity to solvent but illiquid banks are exhausted. The ECB’s weapons can tighten the gap between the EONIA (interbank) lending rate and the ECB deposit facility rate. If the EONIA rate is elevated, it means that the interbank lending market is dysfunctional. But right now, EONIA is deeply negative and little different to the ECB deposit facility. Meaning that there is no liquidity shortage in the banking system, and there is little more that the ECB weapons can do on this front (Chart I-4). Weapons that provide liquidity to solvent but illiquid sovereign borrowers are exhausted. The ECB’s weapons can tighten the gap between a periphery bond yield, say Italy, and a core bond yield, say France. If periphery yields are elevated, it means that periphery sovereigns might be struggling for market funding. But right now, 2-year yields in Italy are deeply negative and little different to those in France. Meaning that there is no liquidity shortage among euro area sovereign borrowers, and there is little more that the ECB weapons can do on this front (Chart I-5). Weapons that depress interest rates along the entire term-structure are exhausted. The ECB’s weapons can depress the level of short-term and long-term euro area interest rates. But right now, both the deposit facility rate and the euro area 7-10 year bond yield are deeply negative. Meaning that euro area interest rates are within touching distance of the lower bound along the entire term-structure, and there is little more that the ECB weapons can do on this front (Chart I-6). Chart I-4Ample Liquidity For Euro Area Banks
Ample Liquidity For Euro Area Banks
Ample Liquidity For Euro Area Banks
Chart I-5Ample Liquidity For Euro Area Sovereigns
Ample Liquidity For Euro Area Sovereigns
Ample Liquidity For Euro Area Sovereigns
Chart I-6Euro Area Interest Rates Cannot Go Much Lower
Euro Area Interest Rates Cannot Go Much Lower
Euro Area Interest Rates Cannot Go Much Lower
Some people counter that the ECB is not out of ammunition. It could just buy government debt in the primary market – meaning, print money for government spending. In theory, yes, but this would constitute fiscal easing, and it would require a major rewriting of the central bank mandate including a likely loss of independence. To repeat, in terms of pure monetary easing, the ECB is exhausted, and this carries important implications for the euro, and the euro’s inverse – the dollar. The broad level of the dollar index (DXY) depends on the US versus euro area long-duration bond yield spread. The broad level of the dollar index (DXY) depends on the US versus euro area long-duration bond yield spread (Chart I-7). Given that the ECB’s monetary easing is exhausted, the spread cannot widen from the euro area side, it can only narrow. Chart I-7In The Long Term, The Dollar Index (DXY) Tracks The US Vs. Euro Area Bond Yield Spread
In The Long Term, The Dollar Index (DXY) Tracks The US Vs. Euro Area Bond Yield Spread
In The Long Term, The Dollar Index (DXY) Tracks The US Vs. Euro Area Bond Yield Spread
From the US side, the spread could move symmetrically, at least in theory. But as we explain in the next section, the ability of risk-assets to tolerate higher bond yields is very limited. This imposes a de facto asymmetry on US yield direction to the downside – a fact reinforced by the Federal Reserve’s recent strategic review which explicitly made its reaction function asymmetric. The central bank will be thick-skinned to reflationary shocks, but trigger-happy to the slightest further deflationary shock. And the biggest risk of a deflationary shock comes from the elevated valuations in financial markets. The upshot is that the medium-term direction of the euro versus the dollar is gently higher. But the caveat is that this will be punctuated by sharp countertrend euro sell-offs during periods of market stress, as occurred in March. During such dislocations, equity portfolio flows flee to haven assets and markets, which boosts the dollar, yen, and Swiss franc. The compelling proof is that in 2020 the broad dollar index has traded as the perfect mirror-image of the stock market (Chart I-8). Chart I-8In The Short Term, The Dollar Is A Mirror-Image Of The Stock Market
In The Short Term, The Dollar Is A Mirror-Image Of The Stock Market
In The Short Term, The Dollar Is A Mirror-Image Of The Stock Market
Hence, the best expression of medium-term euro appreciation version the dollar is not through the euro per se, but through a 50:50 combination of the defensive Swiss franc and the cyclical Swedish krona. Tech Stocks Are Exhausted Three weeks ago, in Sell Stocks If the Bond Yield Rises By 0.3 Percent, we pointed out that the (earnings) yield premium on tech stocks versus the 10-year T-bond yield was just 0.3 percent above a 2.5 percent lower threshold that had signalled four previous ‘tipping points.’ In the intervening three weeks, a 5 percent rally in tech stocks combined with a 0.1 percent rise in the bond yield has taken tech stocks to this tipping point (Chart I-9). Chart I-9Tech Stock Valuations Are At A Tipping Point
Tech Stock Valuations Are At A Tipping Point
Tech Stock Valuations Are At A Tipping Point
Previous flirtations with this tipping point in February 2018, October 2018, April 2019, and January 2019 resulted in an exhaustion or, worse, a correction, in tech stocks – and by extension in the overall market. In this regard, note that the stock market had already peaked in mid-January this year well before the pandemic devastated it in mid-February. Independently signalling an exhaustion of the tech rally, at least in relative terms, the 130-day fractal structure of technology versus healthcare is also at its tipping point of fragility. Again, previous flirtations with this tipping point have resulted in an exhaustion, or reversal, in relative performance. This is because a fragile fractal structure implies excessive trending and a potential liquidity shortage, requiring a price reversal to match sell and buy orders (Chart I-10). Chart I-10Tech Versus Healthcare Performance Is At A Tipping Point
Tech Versus Healthcare Performance Is At A Tipping Point
Tech Versus Healthcare Performance Is At A Tipping Point
Investment does not present certainties. It only presents probabilities which you must play to your advantage. The combination of two independent indicators that suggest that the tech rally is fragile implies a higher than even chance of an exhaustion or correction in the sector in the coming months. Which would then spread to the aggregate market. One thing that might mitigate this is if bond yields backed down again. Therefore, for the time being, we are not making an absolute recommendation, just a relative recommendation between two growth sectors. Underweight technology versus healthcare. On a 6-month horizon, underweight technology versus healthcare. Fractal Trading System* This week’s recommended trade is long RUB/ZAR, whose long downtrend is now at a 130-day fractal reversal point. The profit-target and symmetrical stop-loss is set at 5 percent. The rolling 12-month win ratio now stands at 59 percent.
RUB/ZAR
RUB/ZAR
When the fractal dimension approaches the lower limit after an investment has been in an established trend it is a potential trigger for a liquidity-triggered trend reversal. Therefore, open a countertrend position. The profit target is a one-third reversal of the preceding 13-week move. Apply a symmetrical stop-loss. Close the position at the profit target or stop-loss. Otherwise close the position after 13 weeks. * For more details please see the European Investment Strategy Special Report “Fractals, Liquidity & A Trading Model,” dated December 11, 2014, available at eis.bcaresearch.com. Dhaval Joshi Chief European Investment Strategist dhaval@bcaresearch.com Fractal Trading System* Cyclical Recommendations Structural Recommendations Closed Fractal Trades Trades Closed Trades Asset Performance Currency & Bond Equity Sector Country Equity Indicators Bond Yields Chart II-1Indicators To Watch - Bond Yields
Indicators To Watch - Bond Yields
Indicators To Watch - Bond Yields
Chart II-2Indicators To Watch - Bond Yields
Indicators To Watch - Bond Yields
Indicators To Watch - Bond Yields
Chart II-3Indicators To Watch - Bond Yields
Indicators To Watch - Bond Yields
Indicators To Watch - Bond Yields
Chart II-4Indicators To Watch - Bond Yields
Indicators To Watch - Bond Yields
Indicators To Watch - Bond Yields
Interest Rate Chart II-5Indicators To Watch - Interest Rate Expectations
Indicators To Watch - Interest Rate Expectations
Indicators To Watch - Interest Rate Expectations
Chart II-6Indicators To Watch - Interest Rate Expectations
Indicators To Watch - Interest Rate Expectations
Indicators To Watch - Interest Rate Expectations
Chart II-7Indicators To Watch - Interest Rate Expectations
Indicators To Watch - Interest Rate Expectations
Indicators To Watch - Interest Rate Expectations
Chart II-7Indicators To Watch - Interest Rate Expectations
Indicators To Watch - Interest Rate Expectations
Indicators To Watch - Interest Rate Expectations
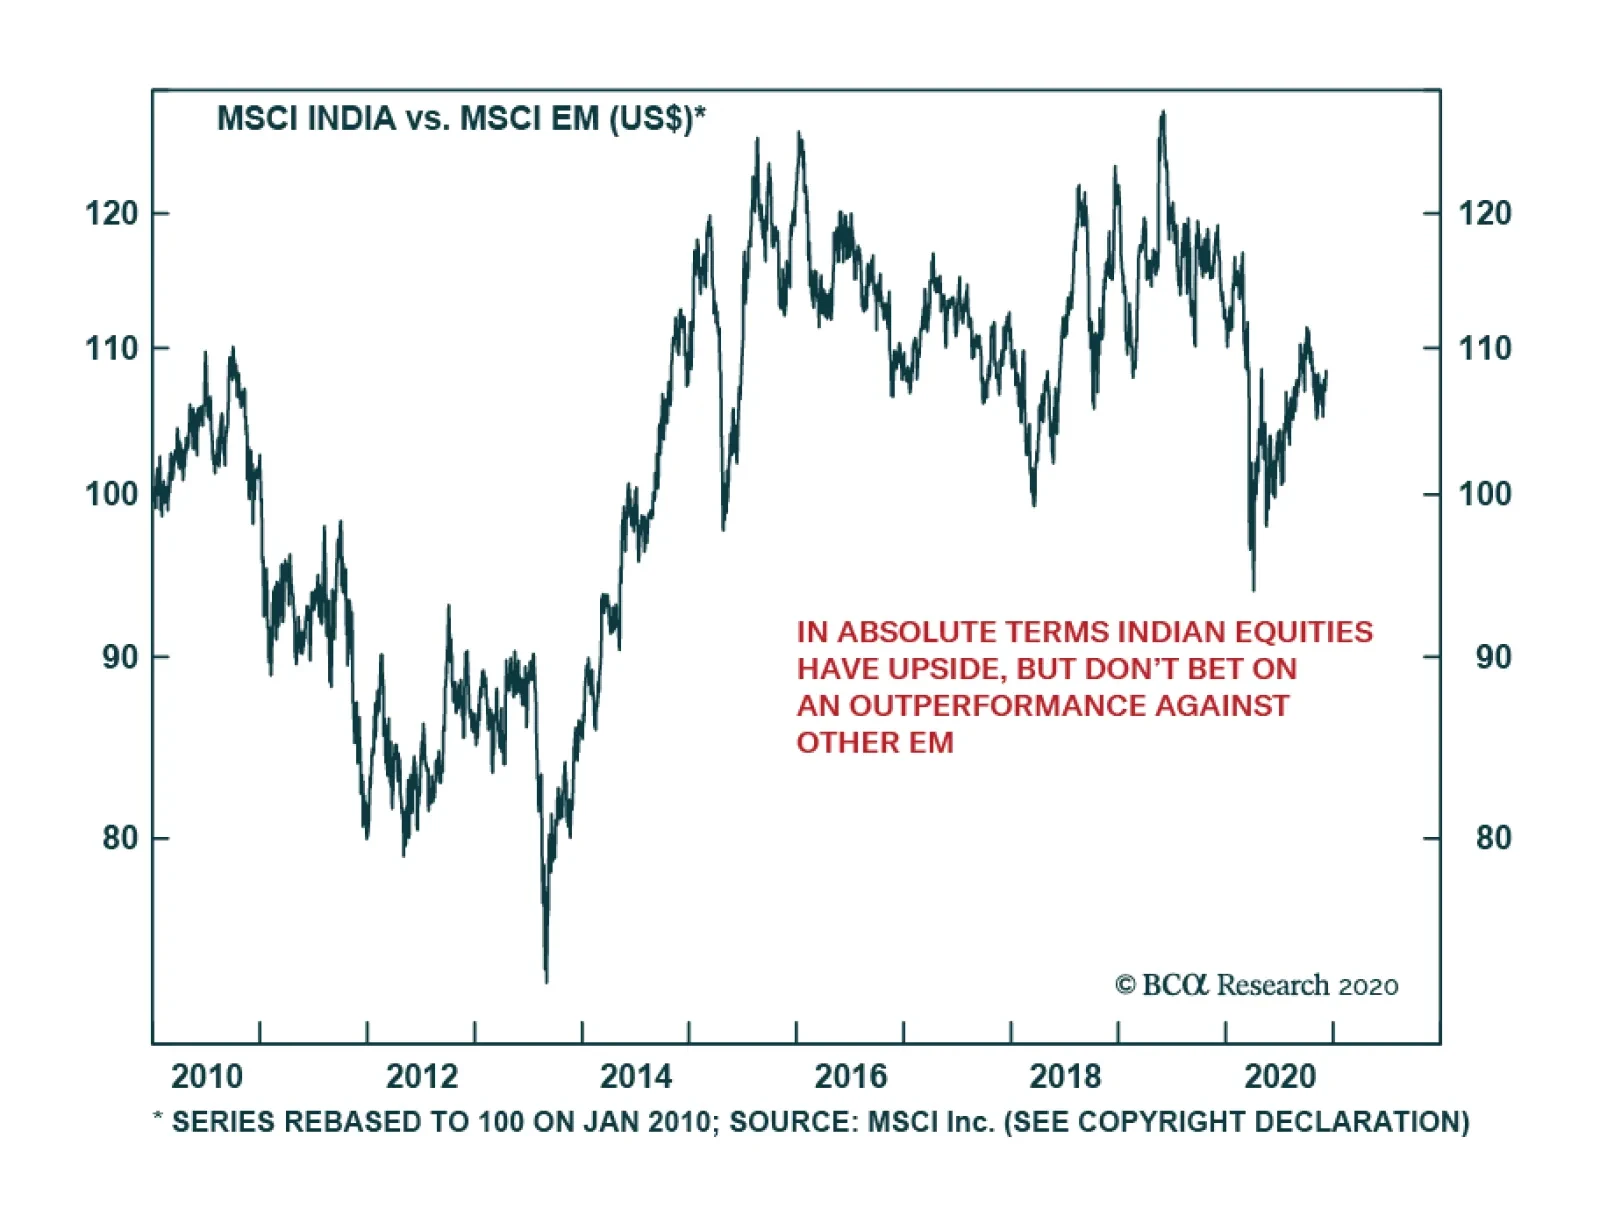
Indian equities have outperformed emerging markets since Q2, rising more than 40% between April and September. However, their relative performance has since slumped. While Indian stocks can rise in absolute terms next year, they are unlikely to…
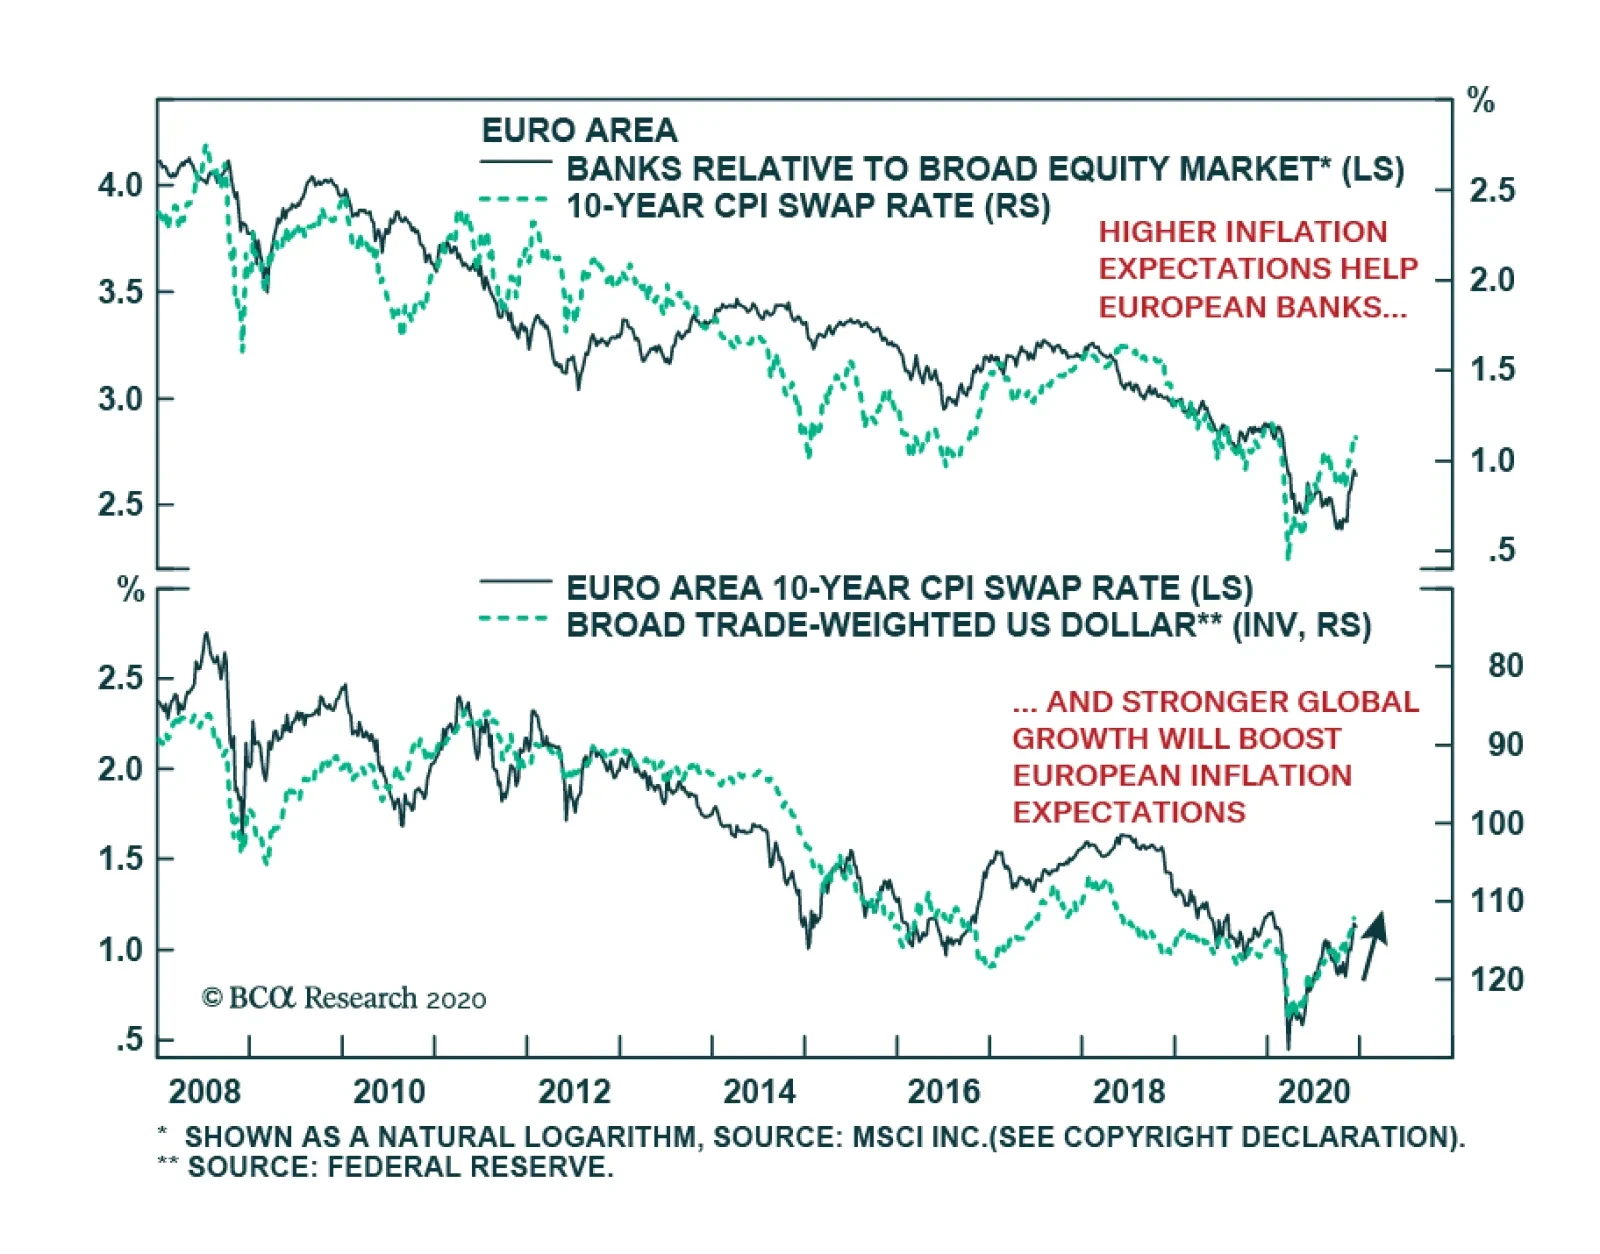
The performance of the Eurozone’s banks relative to the broad market follow the evolution of European inflation expectations. This relationship reflects many links. First, higher inflation expectations point toward higher nominal GDP growth, which at the…