Equities
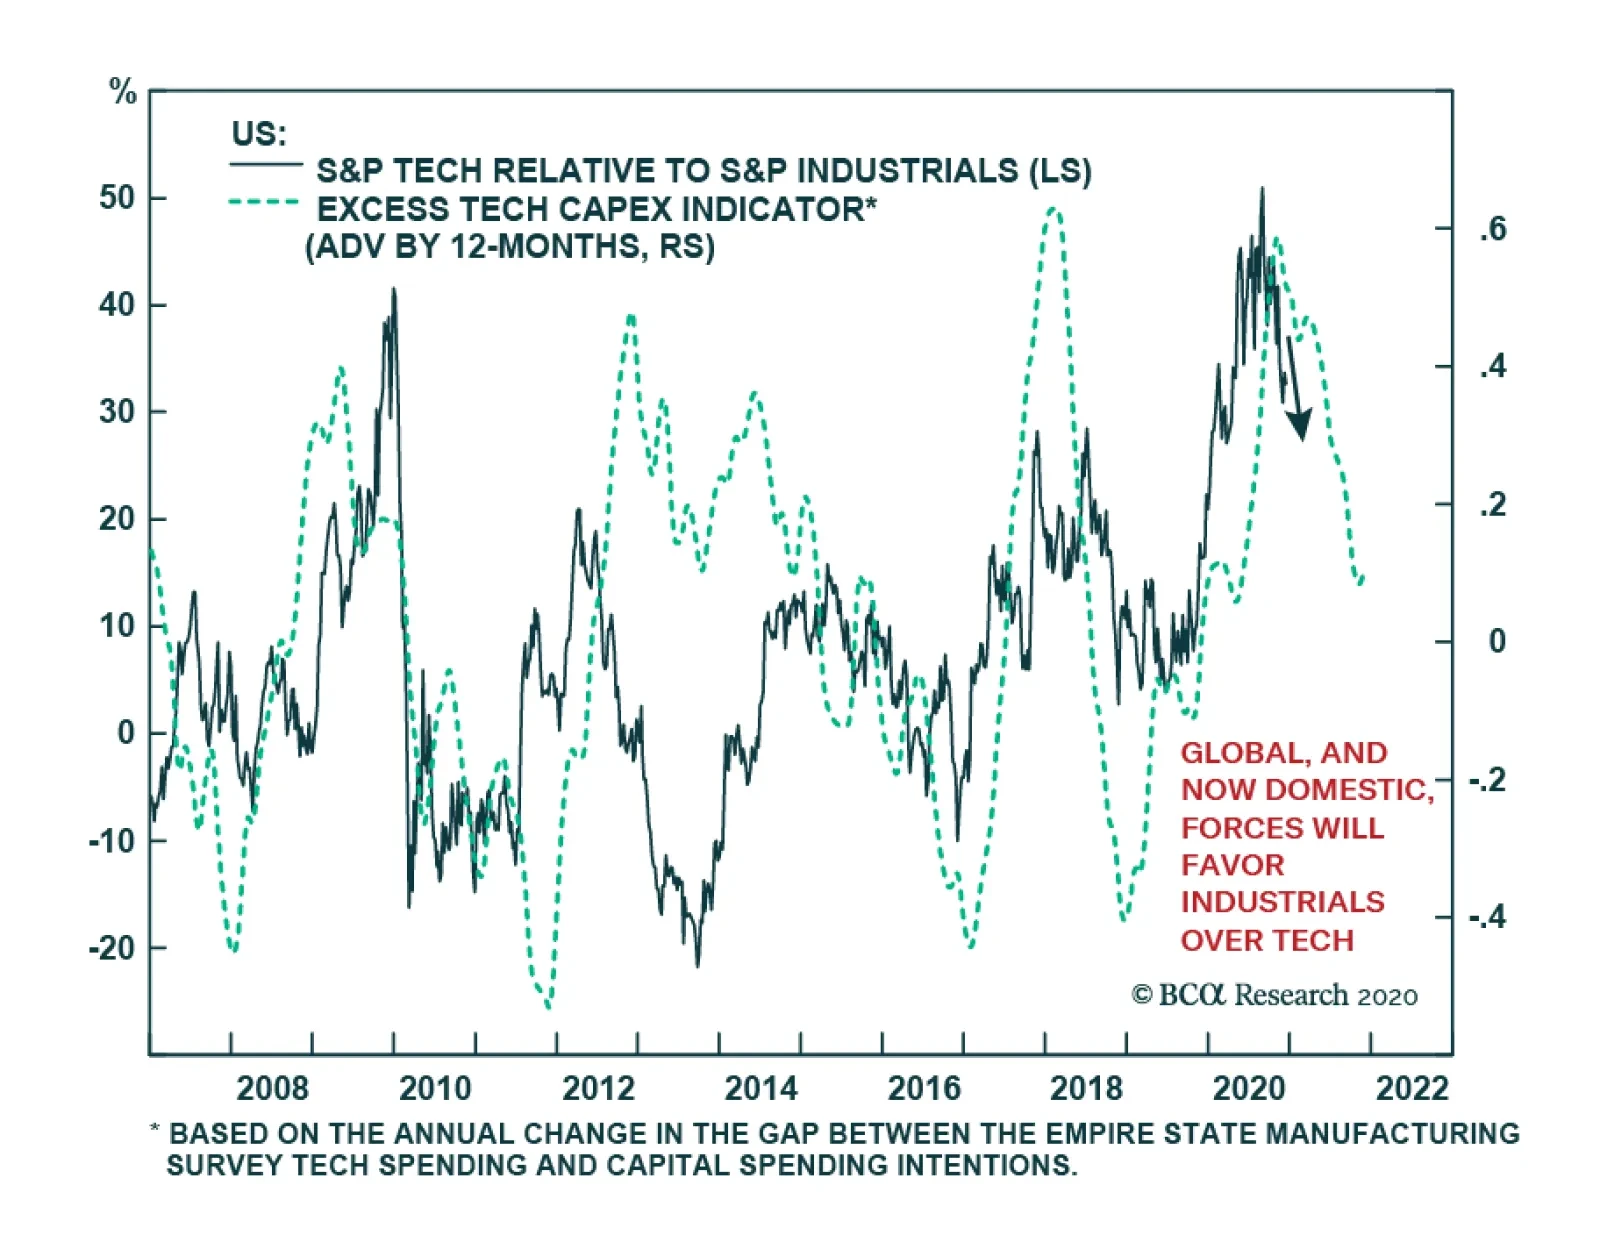
The case to overweight traditional cyclical equities like industrials at the expense of tech equities is becoming stronger. The premise behind this recommendation is multifaceted. Industrial equities trade at a large discount to tech stocks but a catalyst…

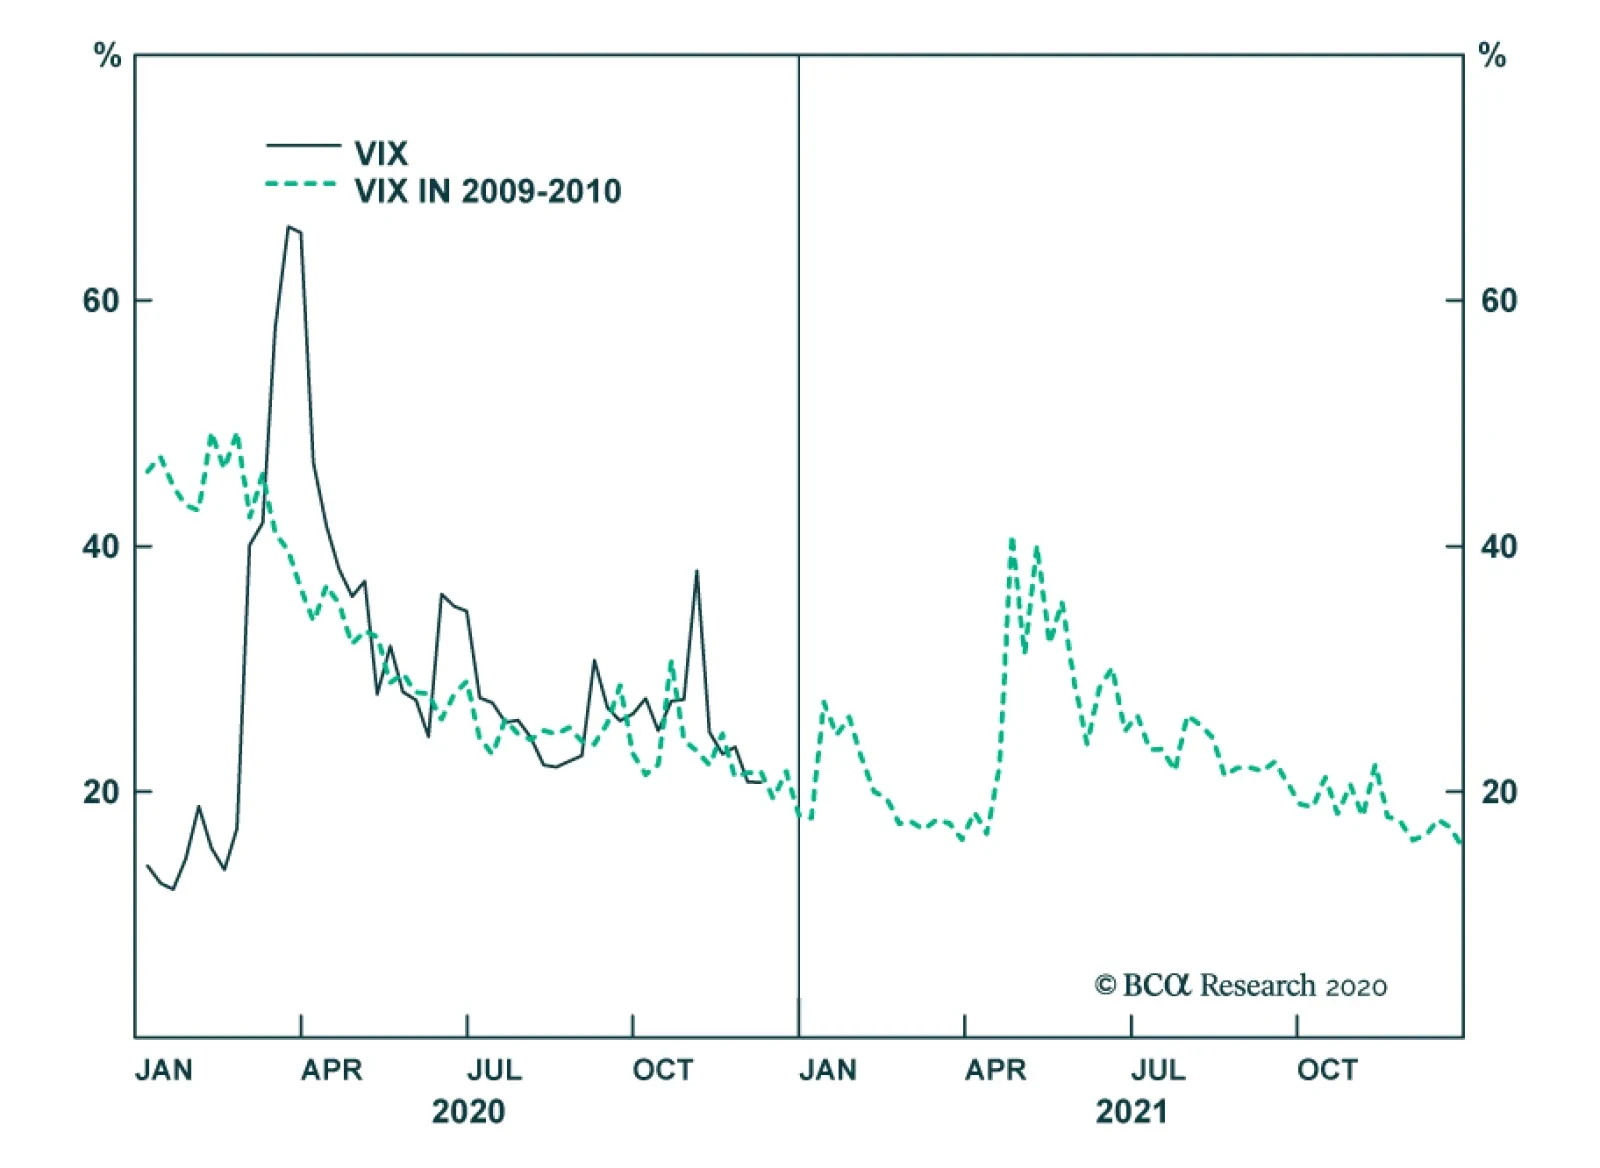
In the latest Strategy Report we published our high-conviction calls for the year 2021 comprising four overweights and three underweights. We want to hedge our high-conviction calls with a long VIX futures position for the June 16, 2021 expiry. We are spending $25.3 to go long and are comfortable paying up for insurance when the SPX is at all-time highs and there is a risk of some growth disappointment in the next six months. The chart below draws a parallel with the March 2009 SPX lows and plots the VIX in 2009 and 2010. While the path of least resistance is lower for volatility, sporadic surges are typical in the year following recessions. The S&P 500 also troughed in March 2020 and if history is an accurate guide, the path to SPX 4,000 will be rocky next year. As a reminder, the S&P 500 suffered a 16% correction in May 2010 and the VIX spiked higher Bottom Line: We went long the VIX June 2021 futures as a small hedge to overweight equity positions.
Buy VIX Futures As A Hedge
Buy VIX Futures As A Hedge
Dear Client, Next week I will be presenting our 2021 outlook on China at our last webcasts of the year "China 2021 Key Views: Shifting Gears In The New Decade". The webcasts will take place next Wednesday, December 16 at 10:00AM EST (English) and at 9:00 AM Beijing/HK/Taipei time, 12:00 PM Australian Eastern time (Mandarin). In addition, our final weekly publication for 2020 will be on Wednesday, December 16, 2020. Best regards, Jing Sima, China Strategist Highlights Chinese policymakers have shifted their focus from supporting economic growth at all costs to risk management. The trend will likely gather speed in 2021. A deceleration in credit growth next year is almost a certainty. While policymakers will be data dependent and the slowdown will be managed, our baseline scenario suggests a decline of approximately three percentage points in credit impulse in 2021. Chinese stocks could still trend higher in Q1, but prices will falter as the market starts to price in a tighter policy environment and slower profit growth in 2H21. We recommend a tactical neutral stance in both the onshore and offshore markets. We continue to favor Chinese government bonds on a cyclical basis, while gyrations in the onshore corporate bond market will endure for at least the next six months. Feature China’s economic growth momentum has strengthened in recent months, but the nation’s policy stance has also turned more hawkish. As set out in the 14th Five-Year Plan, 2021 will mark the beginning of a new era in which policymakers will switch gears from building a "moderately prosperous society" to becoming a "great modern socialist nation.” The pivot means China’s top officials may tolerate slower economic growth, implement tougher financial and industry regulations, and accelerate structural reforms by allowing more bankruptcies and industry consolidations. As we pointed out in our November 4, 2020 Strategy Report,1 external challenges combined with a stronger domestic leadership will allow China to initiate more meaningful reforms in the next decade than in the past ten years. The reforms will strengthen our structural view on China’s economy and financial assets, but this restructuring will create headwinds for growth in the short to medium term. Therefore, investors should maintain low expectations for Chinese growth and financial asset prices. In 2021, credit growth will decelerate, regulations will be tightened and the “old economy” will moderate in the second half of the year. We will discuss four main themes in our outlook for 2021. Key Theme #1: Macro Policy: Turning More Hawkish Government officials recently stepped up mention of financial risk containment in their public announcements, along with tightened industry regulations. Many market commentators are downplaying the risk of a tighter policy in 2021, citing China’s fragile recovery and a weak global economy. However, the current environment resembles the policy backdrop in late 2016/early 2017 when President Xi Jinping began his financial deleveraging campaign. Our policy framework suggests that China currently faces fewer constraints than in 2016/2017. Thus, the odds are high that the leaders will turn their tough rhetoric into action in the next six to twelve months. Importantly, despite low year-over-year GDP growth, the pace of China’s domestic economic recovery has been faster than in 2016 (Chart 1). The PMIs in both the manufacturing and service sectors have been above the 50 percent boom-bust threshold for nine consecutive months (Chart 2). The laggards in the economy - manufacturing investment and household consumption - have been consistently improving (Chart 3). Bond yields have climbed sharply, but given that corporate bond issuance only accounts for 10% of total social financing, the economic impact from rising corporate bond yields has been more than offset by the large number of government bonds issued (Chart 4). Moreover, the recovery in China’s export sector and current account balance has fared surprisingly well this year, propelled by the global demand for medical supplies and stay-at-home electronic goods (Chart 5). Portfolio inflows also have been strong, fueling a rapid appreciation in the RMB. Chart 1Current Economic Recovery In Better Shape Than In 2016
Current Economic Recovery In Better Shape Than In 2016
Current Economic Recovery In Better Shape Than In 2016
Chart 2PMI Remains Strong
PMI Remains Strong
PMI Remains Strong
Chart 3The Laggards Are Catching Up
The Laggards Are Catching Up
The Laggards Are Catching Up
Chart 4Large Fiscal Stimulus More Than Offset Tighter Monetary Stance
Large Fiscal Stimulus More Than Offset Tighter Monetary Stance
Large Fiscal Stimulus More Than Offset Tighter Monetary Stance
Chart 5Exports Surged
Exports Surged
Exports Surged
Chart 6Chinese Business Cycle Upswing Still Has Steam
Chinese Business Cycle Upswing Still Has Steam
Chinese Business Cycle Upswing Still Has Steam
Looking forward, China’s economic recovery should continue for at least another two quarters due to this year’s credit expansion. Economic activities usually lag the turning points in credit growth by six to nine months (Chart 6). Moreover, headline economic data in 1H21 should be impressive, given the deep slump in domestic output during the same period in 2020. The strengthening economic data will provide China’s leadership with a long-awaited opportunity to focus on risk management. Chart 7A Mild Deflation Will Not Stop Policymakers From Reining In Stimulus
A Mild Deflation Will Not Stop Policymakers From Reining In Stimulus
A Mild Deflation Will Not Stop Policymakers From Reining In Stimulus
Furthermore, the ongoing deflation in the ex-factory prices should not stop the authorities from scaling back policy support. It is worth noting that Xi’s administration doubled down on squeezing shadow banking activity in early 2017 when the CPI was decelerating; the PPI turned positive only due to a low base factor from deep contractions in 2016 (Chart 7). In this vein, as long as the deceleration in both the CPI and PPI does not drastically worsen, we think that policymakers will see less need to reflate the economy. China’s external environment will be less challenging in 2021 than in 2016/2017. Geopolitical tensions are set to ease, at least temporarily, with US President-elect Joe Biden taking office in January. This contrasts with 2016/2017 when President Xi began his financial deleveraging campaign despite increasing strain from then newly-elected President Donald Trump. In hindsight, Xi’s intention may have been to solidify China’s financial sector in preparation for a trade war with the US. The same logic can be applied to our view for next year: Xi will accelerate structure reforms to mitigate risk in the domestic economy before the Biden administration turns its focus to China. We do not think the Communist Party’s 100th anniversary next year will prevent Xi from adopting a hawkish policy bias either. Xi plowed ahead with tightening financial regulations in 2017 even as the ruling Communist Party Committee (CPC) was preparing for a generational leadership reshuffle. In the past two years, the escalation in US-China tensions has strengthened Xi’s power in the CPC and Chinese society. The recent large number of changes in provincial CPC leaders should help Xi to further consolidate his centralized power over local governments. All signs indicate that both the domestic and external landscapes should provide Xi with even more room to undertake reforms in 2021 compared with 2017. Key Theme #2: Stimulus: Deceleration Ahead A deceleration in both credit growth and fiscal support in 2021 is almost a certainty in light of the more hawkish tone by Chinese policymakers. Chart 8 shows that between 2017 and 2019, policymakers came close to stabilizing the macro leverage ratio, but the progress was more than reversed this year due to the pandemic. If policymakers are to allow the increase in the 2021 debt-to-GDP ratio to be within the range of the past four years, then credit may expand at a rate slightly above nominal GDP growth in 2021 (assuming nominal output growth at around 10-11% next year). This scenario, which is our baseline view, is in line with recent statements from the PBoC, which calls for aligning credit growth with nominal GDP in 2021. Our calculation suggests that credit impulse will reach around 29% of next year’s GDP, about 2 to 3 percentage points lower than in 2020 (Chart 9). Chart 8Financial Deleveraging Efforts Erased By COVID-19
Financial Deleveraging Efforts Erased By COVID-19
Financial Deleveraging Efforts Erased By COVID-19
Chart 9Credit Growth Will Decelerate In 2021
Credit Growth Will Decelerate In 2021
Credit Growth Will Decelerate In 2021
Even if the PBoC keeps its official policy rate (i.e. the 7-day interbank repo rate) steady, tightening regulations and repricing credit risk will lead to higher funding costs and a lower appetite for borrowing (Chart 10). Banking regulators have made it clear that some of the one-off easing measures from this year, such as the extension of loan payments (through March 2021) and the delay of macro-prudential assessments (through end-2021), will end next year. Financial institutions will need to slow the pace of their asset balance sheet to comply with these regulations. The regulatory pressures will lead to de facto deleveraging. On the fiscal front, we expect the large budget deficit to remain intact next year. Targeted stimulus through subsidies and tax cuts to support household consumption and small businesses will likely continue. Government spending in the new economy sectors such as semiconductor and tech-related infrastructure will even accelerate. However, the new-economy infrastructure investment is estimated to only account for about 1% of China’s total capital formation, having limited impact on the overall economy.2 Chart 10Higher Funding Costs Will Discourage Corporate Borrowing
Higher Funding Costs Will Discourage Corporate Borrowing
Higher Funding Costs Will Discourage Corporate Borrowing
Chart 11Fiscal Boost For Infrastructure Will Scale Back
2021 Key Views: Shifting Gears In The New Decade
2021 Key Views: Shifting Gears In The New Decade
The proceeds from the large number of the local government special purpose bonds (SPBs) this year will continue to provide tailwinds for infrastructure investment into Q1 2021. However, as the laggards in the economic recovery catch up and government tax revenue improves next year, 2021 quotas for government general and SPBs are likely to be scaled back, reining in expenditure growth in the traditional infrastructure sector (Chart 11). Finally, investors should watch for signs of further hawkishness from China’s leaders at the Central Economic Work Conference this December and the National People’s Congress next March. While we expect policymakers to be data dependent and keep a controlled deceleration in credit and economic growth, risks of a policy overkill cannot be ruled out. A more bearish scenario would be if policymakers decide to fully revert the pace of debt accumulation to the average rate in 2017-2019. In this case, credit impulse in 2021 could fall by more than 5 percentage points compared with 2020 (Scenario 2 in Chart 9 on Page 6). Key Theme #3: Chinese Equities: Position For A Peak In Prices This year’s cyclical (6- to 12 months) call to overweight Chinese stocks within a global portfolio has panned out. In the next 12 months, the risks in Chinese stocks relative to global benchmarks are to the downside; Chinese stocks are vulnerable to setbacks in policy support next year, in both absolute and relative terms. We are closing the following trades: Long MSCI China Index/Short MSCI All Country World Index, for a 1.5% profit; Long MSCI China A Onshore Index/Short MSCI All Country World Index, for a 5.6% profit; Long MSCI China Ex-TMT/Short MSCI Global EX-TMT, for a 0.7% loss; Long Investable Materials/Short broad investable market, for a 5.6% profit; and Long Onshore Materials/Short broad A-Share market, for a 9.3% profit. Chart 12Onshore Equity Market Investors Will Start To Price In Slower Profit Growth In 2H21
Onshore Equity Market Investors Will Start To Price In Slower Profit Growth In 2H21
Onshore Equity Market Investors Will Start To Price In Slower Profit Growth In 2H21
In absolute terms, Chinese onshore stocks on an aggregate level could still inch higher in the next quarter, supported by an improving business and profit cycle (Chart 12). However, in Q2 the market may start to price in slower economic and profit growth in 2H21, erasing the gains from the first quarter. The resilient performance in Chinese stocks against a tightening policy backdrop in 2017 is not likely to repeat itself next year. Current valuations in both China’s onshore and offshore equity markets are higher than at the end of 2016; the price-to-forward earnings ratios in both markets this year have breached the peak levels achieved in 2017 (Chart 13A and 13B). Recovering earnings in the next year will help to digest the currently elevated valuations, i.e. the market has already priced in a substantial post-pandemic profit recovery and investors’ focus will soon switch to a more pessimistic outlook for corporate earnings in 2H21. Chart 13AInvestable Stocks Are More Expensive Now Than Prior To The Last Tightening Cycle
Investable Stocks Are More Expensive Now Than Prior To The Last Tightening Cycle
Investable Stocks Are More Expensive Now Than Prior To The Last Tightening Cycle
Chart 13BA-Shares Are Less Expensive, But Valuations Still Elevated
A-Shares Are Less Expensive, But Valuations Still Elevated
A-Shares Are Less Expensive, But Valuations Still Elevated
Additionally, a property market boom in 2017 boosted the stock performance of real estate developers and related sectors in the supply chain (Chart 14). Policies have already turned much more restrictive in the past month, and deleveraging pressures faced by property developers may weigh on both the sector’s profit growth and stock performance in the next six to twelve months.3 The investable market may not be insulated from tighter domestic policies either. Recent anti-trust regulations in China could create headwinds for mega-cap technology stocks in the near term. Global investors will demand a higher risk premium for China’s tech sector than in the past, as the rich valuations of tech stocks pose more downside risks in a less friendly policy environment (Chart 15). Chart 14Housing Boom In 2017 Also Helped Sustain A Bull Market Back Then
Housing Boom In 2017 Also Helped Sustain A Bull Market Back Then
Housing Boom In 2017 Also Helped Sustain A Bull Market Back Then
Chart 15Valuations In Chinese Tech Stocks Are Elevated
Valuations In Chinese Tech Stocks Are Elevated
Valuations In Chinese Tech Stocks Are Elevated
Chart 16A Policy Overkill Will Significantly Raise Prob Of A Earnings Contraction In 12 Months
A Policy Overkill Will Significantly Raise Prob Of A Earnings Contraction In 12 Months
A Policy Overkill Will Significantly Raise Prob Of A Earnings Contraction In 12 Months
Furthermore, if we presume a policy overkill with more aggressive deleveraging and a further appreciation in the RMB in 2021, our model shows a significant increase in the probability of a profit growth contraction in the next 12 months (Chart 16). In this scenario, selloffs in Chinese stock prices may start in Q1, a risk that cannot be ruled out. In relative terms, Chinese stocks will likely underperform global equities. It is doubtful that the impressive outperformance in Chinese investable stocks throughout 2017 will be repeated in 2021. Chinese equities have benefited from the successful containment of China’s COVID-19 situation in the past year (Chart 17). As breakthroughs in vaccines make the pandemic less threatening to the global economy, Chinese risk assets relative to global ones will become less appealing. Global cyclical stocks, particularly European and Japanese equities, should benefit from improvements in business activities and relatively low valuations (Chart 18). Chart 17Chinese Equities Have Benefited From A Better Control Of COVID-19 This Year...
Chinese Equities Have Benefited From A Better Control Of COVID-19 This Year...
Chinese Equities Have Benefited From A Better Control Of COVID-19 This Year...
Chart 18...But Vaccines Will Give A Boost To Other Markets Next Year
...But Vaccines Will Give A Boost To Other Markets Next Year
...But Vaccines Will Give A Boost To Other Markets Next Year
Importantly, despite strong inflows this year from foreign investors to China’s bond market, foreign portfolio flows into China’s onshore equity market have been less than one-third of that in 2019 (Chart 19). Looking ahead, global investors will be less keen to support Chinese stocks, based on the expectation of tighter onshore liquidity conditions and less buoyant economic growth. Chart 19Foreign Investors Have Not Been So Keen On Chinese Risky Assets This Year
Foreign Investors Have Not Been So Keen On Chinese Risky Assets This Year
Foreign Investors Have Not Been So Keen On Chinese Risky Assets This Year
Everything considered, we anticipate that Chinese A-shares and investable stocks will start descending in Q2 in absolute terms. Their performance relative to global equities will also peak. We recommend a neutral stance on both bourses in the next three months to minimize the downside risks. Key Theme #4: Chinese Bonds: Favor Onshore Government Over Corporate Bonds We continue to recommend a cyclical long position in Chinese government bonds within a global fixed-income portfolio. However, we are closing our long Chinese onshore corporate bond trade for now, for a 17% gain (Chart 20). The large interest rate differential between yields in Chinese bonds versus those in other major developed nations should remain intact into the new year. The yield on the short-duration government notes will continue to trend higher in 1H21, based on the prospect of tighter monetary policy. The yield on long-dated bonds will also escalate as the outlook for the economy continues to improve. We are pricing in a 70BPs increase in the 1-year government bond yield and a 40BPs rise in the yield of the 10-year bond from their current levels (Chart 21). Chart 20Handsome Returns On Chinese Government Bonds
Handsome Returns On Chinese Government Bonds
Handsome Returns On Chinese Government Bonds
Chart 21Our Projections On Government Bond Yield Hikes Next Year
Our Projections On Government Bond Yield Hikes Next Year
Our Projections On Government Bond Yield Hikes Next Year
Chart 22RMB Appreciation Will Continue In 2021, But At A Slower Pace Than This Year
RMB Appreciation Will Continue In 2021, But At A Slower Pace Than This Year
RMB Appreciation Will Continue In 2021, But At A Slower Pace Than This Year
The ongoing appreciation in the RMB will also make Chinese government bonds attractive to global investors. The speed of the gain in the RMB against the US dollar may slow in 2021, but the economic fundamentals do not yet suggest that this trend will reverse. Relative growth and interest rates between China and the US will probably narrow and the geopolitical tailwinds affecting the RMB following the Biden win in the US election will subside in the new year (Chart 22). However, China's strong export sector should still support a record high trade surplus and provide a floor to the Chinese currency against the USD. Chinese onshore corporate bonds have undergone a major shakeout in the domestic corporate bond market in the past month. A slew of state-owned enterprise (SOE) bond defaults has pushed up the yields on the lower-rated corporate bond by nearly 40BPs in one month. In our view, the recent panic selloff in the onshore corporate bond market is overdone and domestic corporate bonds are starting to look attractive on a cyclical basis. Bloomberg data shows that the value of defaulted bonds in the first three quarters of this year is in fact much lower than in the past two years: it dropped to 85Bn RMB from 142Bn RMB defaults in 2019 and the default of 122Bn RMB in 2018. Bondholders have been spooked by the fact that the Chinese local government and top financial regulators allow defaults by state-backed firms. The policy change to shift risk to the markets should result in a continuation of risk-off sentiment among investors, inducing selling pressure in the domestic corporate bond market in the near term. However, on a cyclical basis, such selloffs could present good buying opportunities. While we expect China’s onshore corporate bond defaults to be higher in 2021, the default rate remains below the global average (Chart 23). As we pointed out in our previous report, since 2017 Chinese onshore corporate bonds have been priced with a significantly higher risk premium than their global peers, which in our view is overdone (Chart 24). Chart 23Chinese Corporate Bond Default Rate Lower Than Global Average...
Chinese Corporate Bond Default Rate Lower Than Global Average...
Chinese Corporate Bond Default Rate Lower Than Global Average...
Chart 24...And Much Lower Than Their Risk Premiums Imply
...And Much Lower Than Their Risk Premiums Imply
...And Much Lower Than Their Risk Premiums Imply
Chart 25Chinese Corporate Bonds Can Bring Better Returns Once The Peak Intensity In Policy Tightening Passes
Chinese Corporate Bonds Can Bring Better Returns Once The Peak Intensity In Policy Tightening Passes
Chinese Corporate Bonds Can Bring Better Returns Once The Peak Intensity In Policy Tightening Passes
In addition, Chart 25 shows that the total returns on Chinese onshore corporate bonds briefly declined in 2017 when the government’s financial de-risking efforts intensified. It sequentially rebounded in 2018, suggesting a turnaround in investors’ sentiment after the first cleanup wave in the corporate sector. As such, while we do not favor Chinese onshore corporate bonds in the next six months, on a 12-month horizon, conditions could become more favorable to initiate a long position. Jing Sima China Strategist jings@bcaresearch.com Footnotes 1Please see China Investment Strategy Report "The 14th Five-Year Plan: Meaningful Transformations Ahead," dated November 4, 2020, available at cis.bcaresearch.com 2Please see China Investment Strategy Special Report "Chinese Economic Stimulus: How Much For Infrastructure And The Property Market?" dated March 25, 2020, available at cis.bcaresearch.com 3Please see China Investment Strategy Special Report "China: The Implications Of Deleveraging By Property Developers," dated October 21, 2020, available at cis.bcaresearch.com Cyclical Investment Stance Equity Sector Recommendations
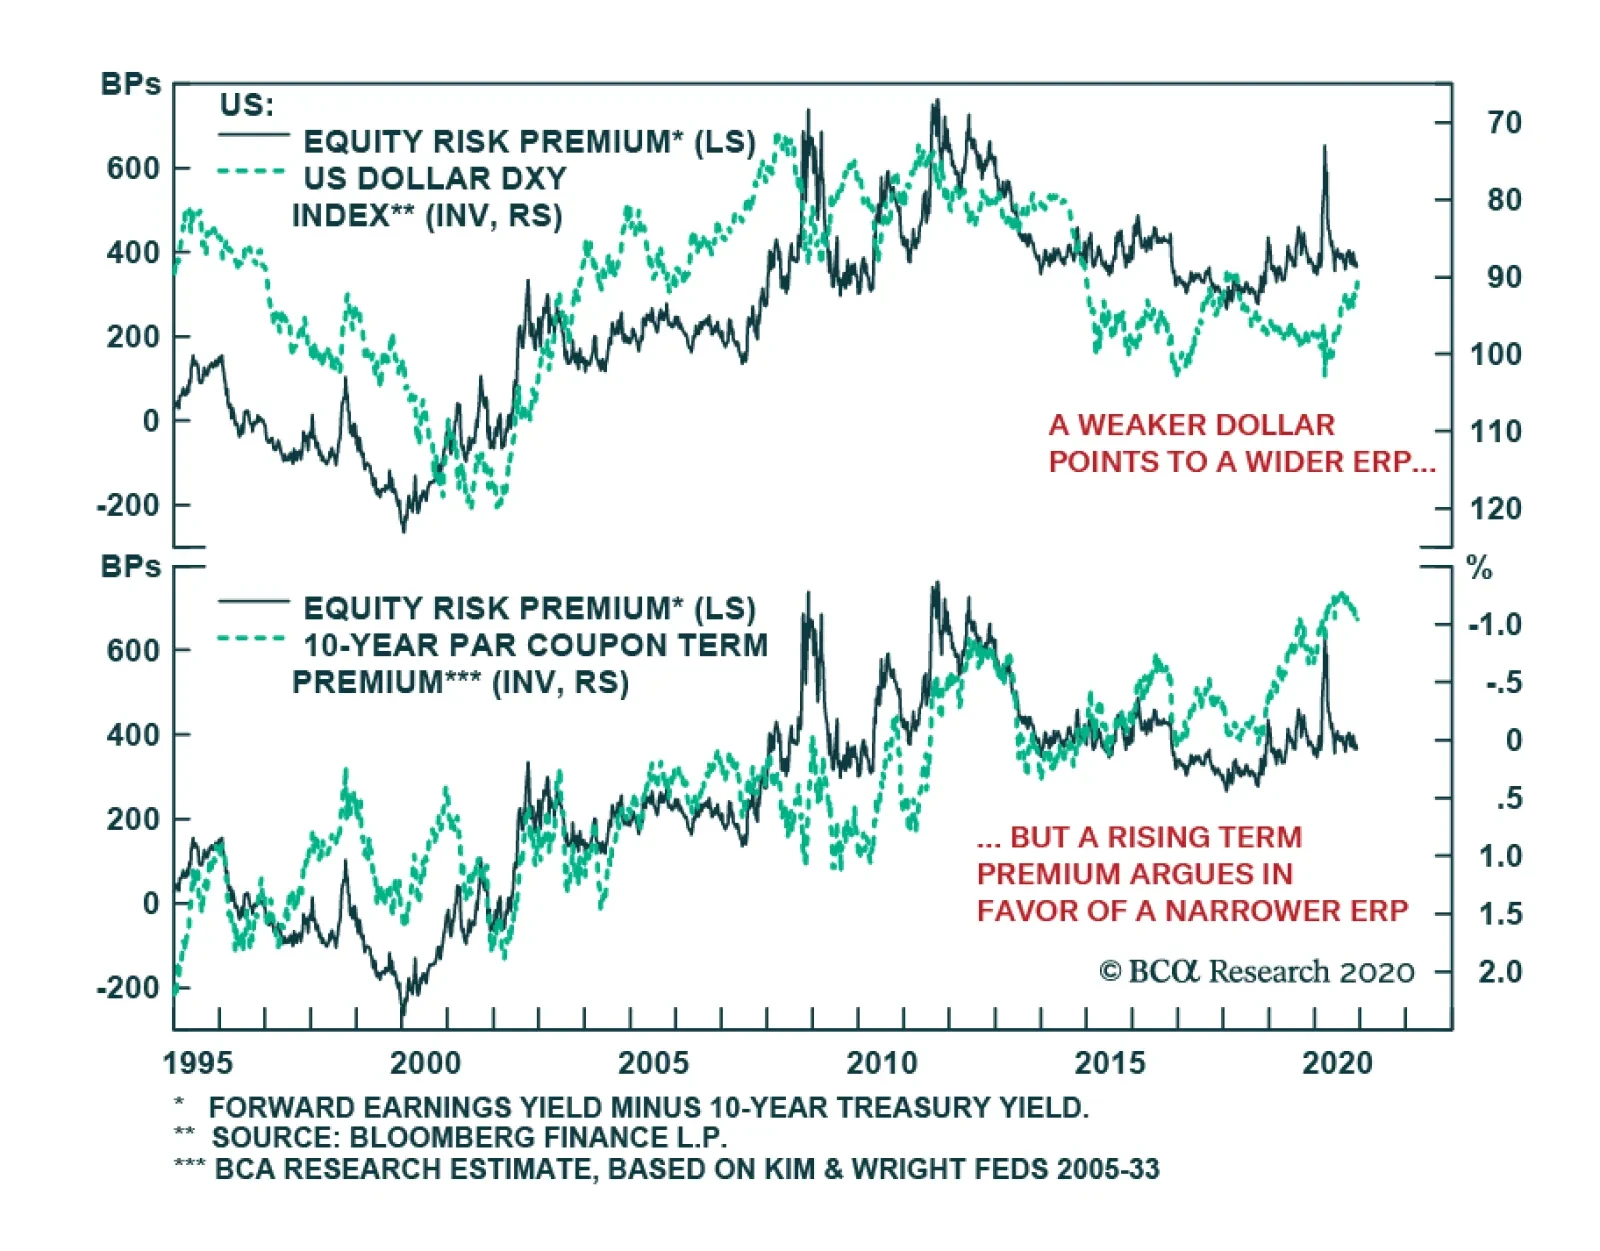
A crucial question for stocks next year will be the direction of the equity risk premium (EPR). BCA Research expects Treasury yields to move towards 1.2% to 1.5%, which should not topple equity prices if earnings improve along with the global economic…
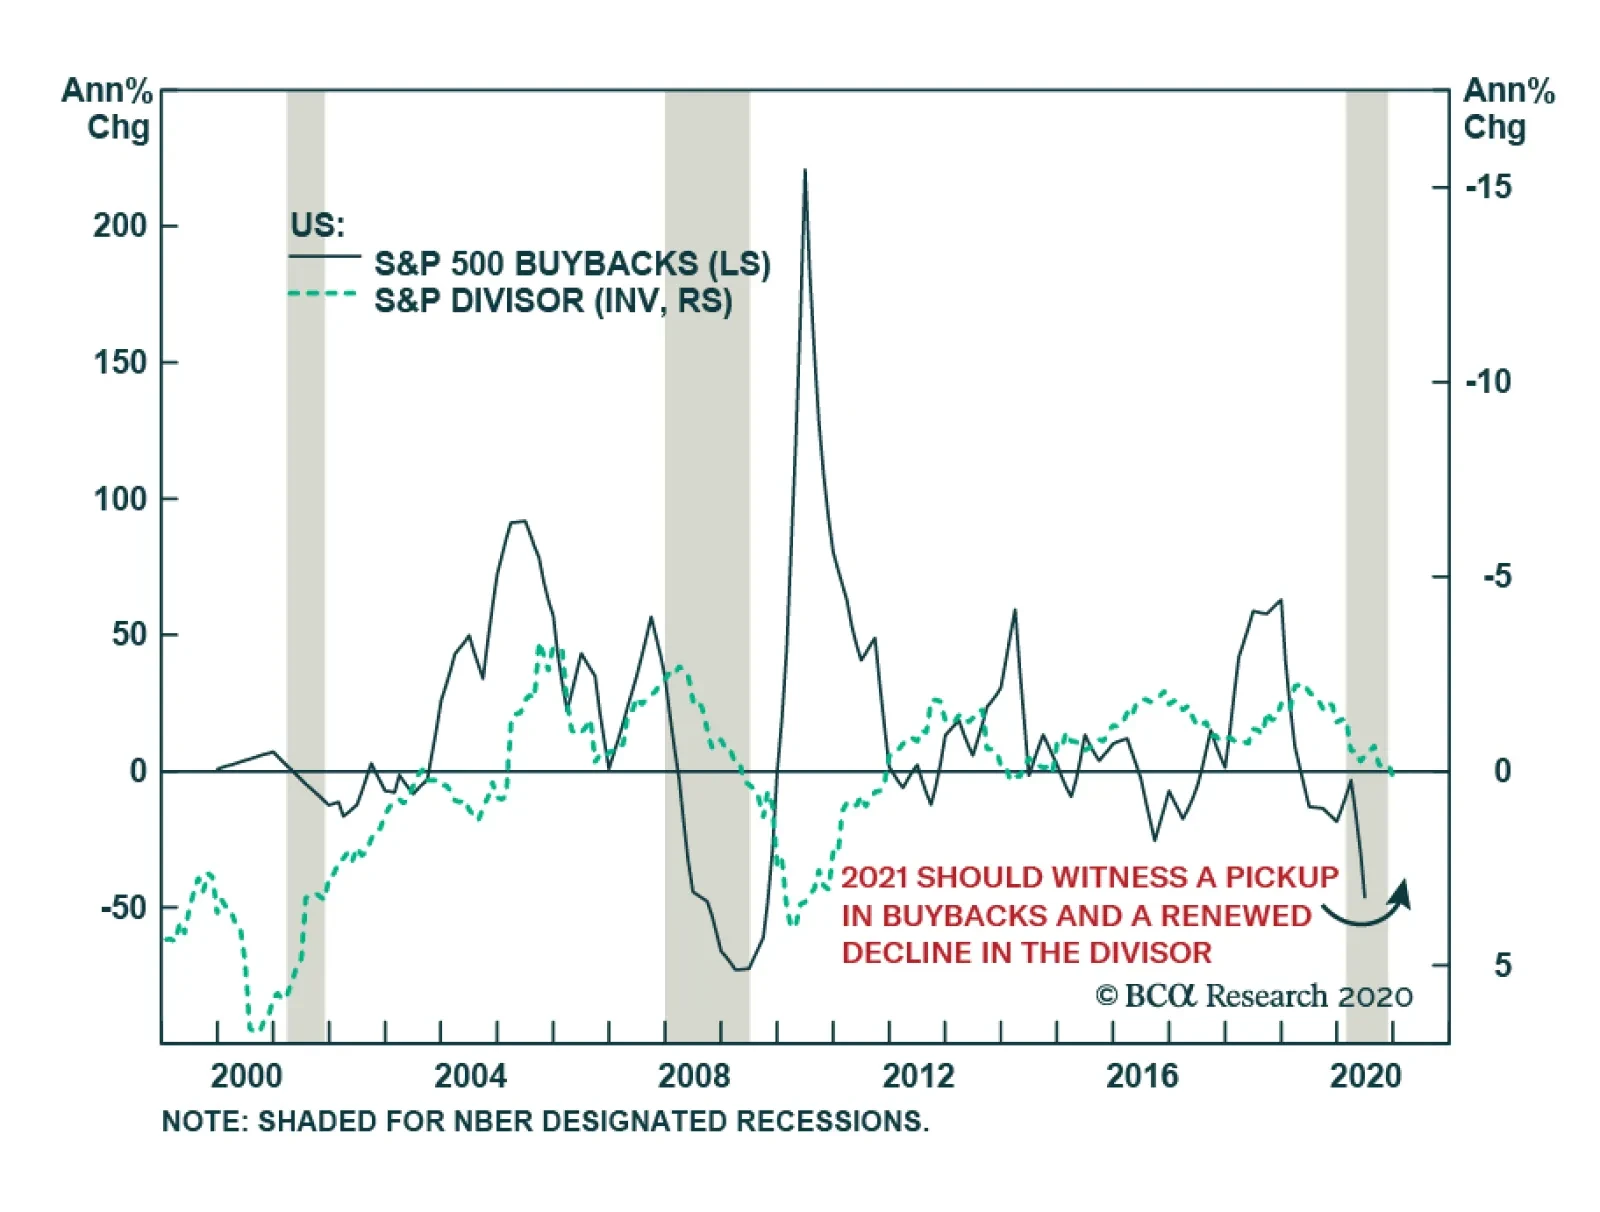
S&P 500 Divisor Will Remerge As A Tailwind To EPS Growth
…
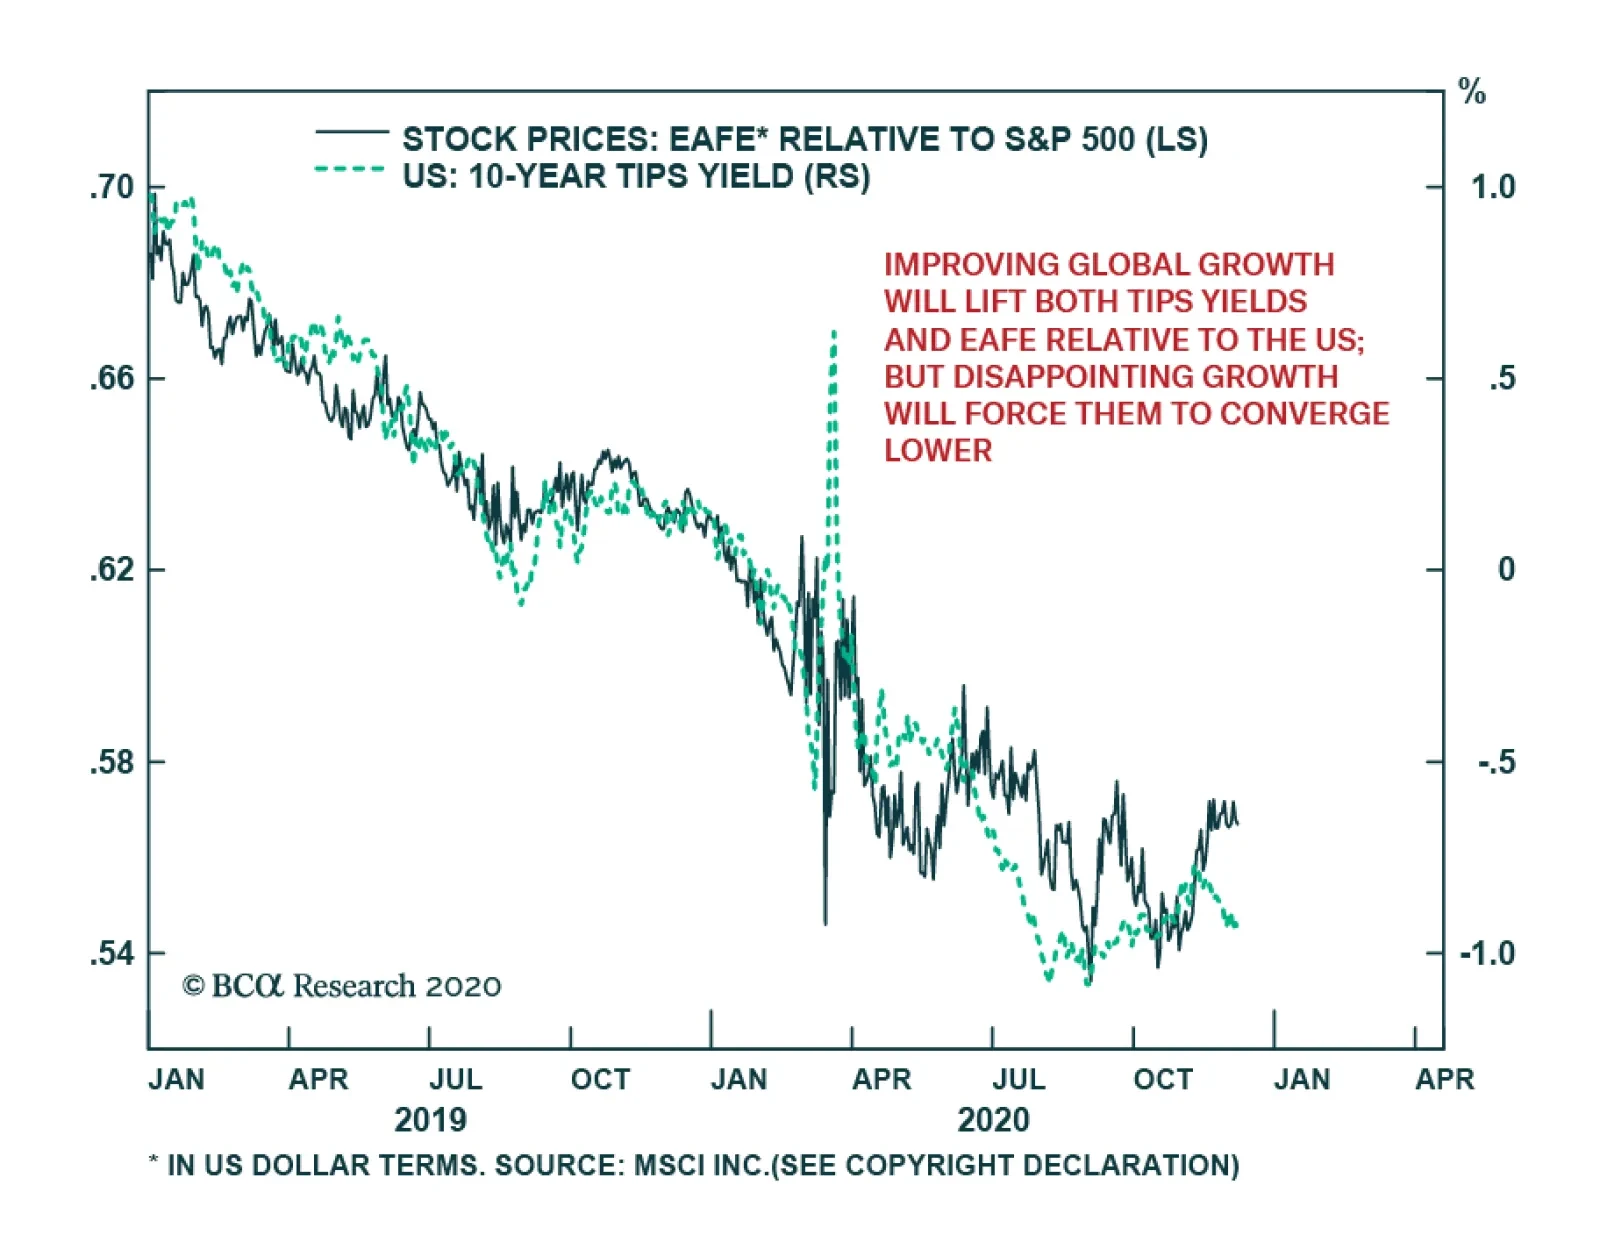
Over the past two years, the performance of EAFE equities relative to the US has tightly followed real bond yields. This is because both the relative performance of foreign equities and real interest rates are extremely sensitive to the global economic…
2020 will soon be history and on the eve of the New Year, it is instructive to update our presidential cycle and SPX returns research. Encouragingly, still elevated policy uncertainty will likely continue to recede next year and act as a tonic to equity returns. The chart shows the S&P 500’s performance in the first year of a presidential cycle. The market rallies 8% and 6% on a median and average basis, respectively. With regard to the range of outcomes, since 1952 the healthiest rally can net more than 30% in gains, while bear markets have also pushed SPX returns down 30%. Our sense is that 2021 will turn out to resemble 2013 or 2017 rather than 2001 or 2009. Currently, our end-2021 SPX 4,000 target (first introduced in our November 9 Special Report) represents a 17% gain from the Election Day and falls within the historical return norm. Bottom Line: Our cyclically sanguine broad equity market view remains intact.
New Presidential Cycle Begins
New Presidential Cycle Begins
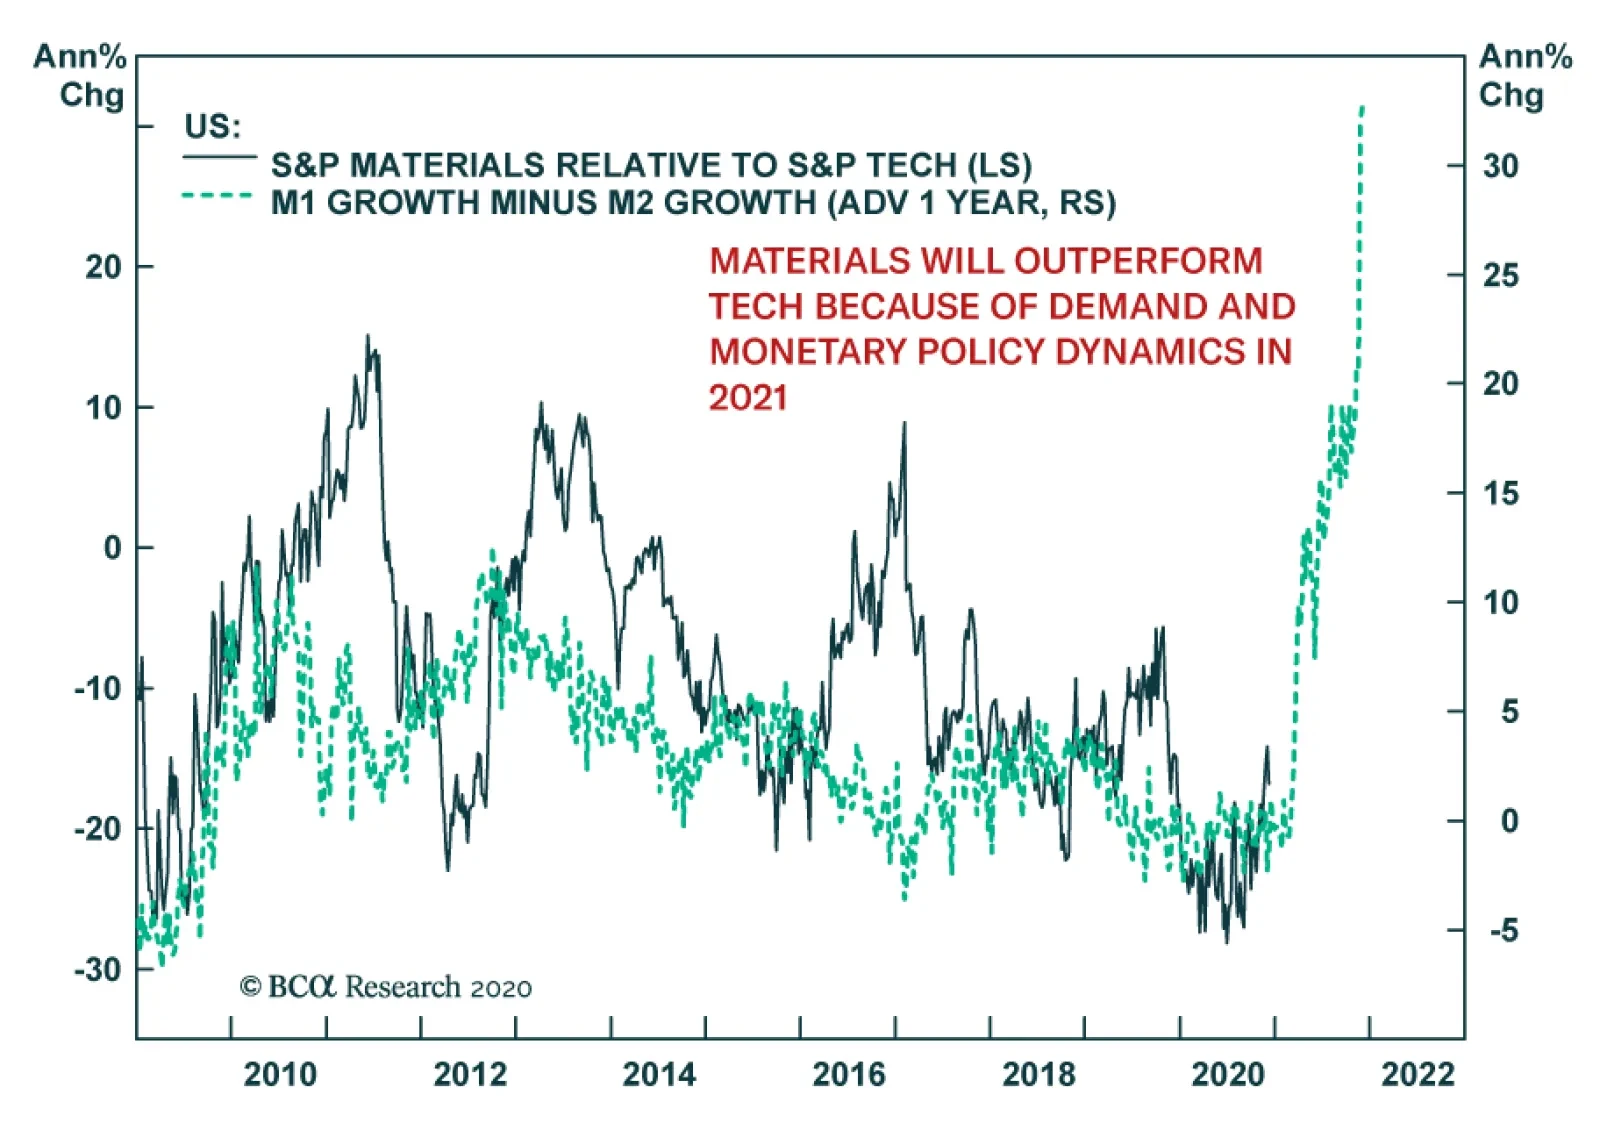
Historically, both materials and tech stocks are classified as cyclical sectors. This year, tech equities have followed the business cycle a lot less closely than material equities, as demand for tech goods and services surged during the first wave of the…
BCA Research’s US Equity Strategy service recommends that investors go long the VIX June 2021 futures as a small hedge to protect long equity positions. We want to hedge our overweight exposures with a long VIX futures position for the June 16, 2021…
Dear client, Next Monday December 14, 2020 we will be hosting our last webcasts for the year “From Alpha To Omega With Anastasios”, one at 10am EST for our US, European and Middle Eastern clients and one at 8pm EST for our Asia Pacific, Australia and New Zealand clients; our final weekly publication for 2020 will be on Monday December 21, 2020 where we will highlight our top charts of the past year. Kind Regards, Anastasios Highlights Portfolio Strategy Our high-conviction overweight calls comprise four “Back-To Work” beneficiaries, and a hedge. In marked contrast, all of our high-conviction underweights are focused on “COVID-19 Winners” that should lose some of their luster next year. Recent Changes Upgrade the S&P real estate sector to overweight, today. Feature Favorable Macro Backdrop Easy monetary and loose fiscal policies will remain intact and sustain flush liquidity conditions next year. As a result, the global economy will continue to gain traction. Importantly, early-August marked a critical economic inflection point. Gold prices peaked and 10-year real and nominal yields troughed (yields shown inverted, top & middle panels, Chart 1). The bullion and bond markets corroborated the economic recovery that equities and the ISM manufacturing surveys sniffed out in late-spring. This is important for cementing the bull market in equities which is predicated on a durable economic recovery. In other words, the rise in real yields serves as a green light for further stock gains as it signals that the economy is on the recovery path. The bottom panel of Chart 1 also highlights that non-US equity markets started sporting accelerating profit growth expectations in August. Eurozone and other ex-US bourses zoomed past the US EPS growth trajectory as the latter reached a plateau. Chart 1Inflection Point
Inflection Point
Inflection Point
This gives us confidence that 2021 will be a bumper year for SPX profits and help carry the market higher near our 4,000 target. As a reminder, on November 9 in a Special Report, we lifted our EPS estimate to $168 for calendar 2021 and introduced an end-2021 SPX target of 4,000 (Chart 2). Chart 2Earnings Will Do The Heavy Lifting In 2021
Earnings Will Do The Heavy Lifting In 2021
Earnings Will Do The Heavy Lifting In 2021
Two Risks To Monitor Nevertheless, the bond market represents a risk to our sanguine equity market view. Simply put, if the 10-year US Treasury yield stalls, then it will also stop the rotation trade in its tracks. The budding improvement in the Chinese and EM economic cycles will likely be sustainable next year, consistent with the Chinese four-year cycles of the past twenty years (Chart 3). Each up-cycle has typically been driven by credit expansion and capital spending, on the back of fiscal and monetary easing. These conditions are in place once again. Chart 3Follow The Chinese Four-year Cycle
Follow The Chinese Four-year Cycle
Follow The Chinese Four-year Cycle
We recently showed that China’s fiscal easing will likely continue to grease the wheels of global trade into mid-2021 and thus debase the greenback (Chart 4), but will likely run out of steam in the back half of next year. Thus, China’s reflation going on hiatus is another key risk we will monitor in 2021 that could serve as a growth scare catalyst and reset stocks. Chart 4Laggard Deep Cyclicals Have The Upper Hand
Laggard Deep Cyclicals Have The Upper Hand
Laggard Deep Cyclicals Have The Upper Hand
Year In Review 2020 is a year to forget as far as the coronavirus human toll is concerned; the economic and EPS recessions, while short lived, were deep. The COVID-19-inflicted wounds, especially to services industries the world over, were deep and there will be severe scarring. Early in the year, equities felt the COVID-19 tremor and collapsed 35% from the February 19 highs, but extremely aggressive monetary and fiscal policy responses filled the void and were the dominant themes in the ensuing recovery that saw the SPX vault to all-time highs. Our portfolio was resilient and was able to absorb the COVID-19 shock as we were bulletproofing it in the back half of 2019 and early-2020 for a recession owing largely to the yield curve inversion. Importantly, we were not dogmatic and on March 16 we turned cyclically bullish. This eventually culminated into the March 23 Strategy Report where we penned 20 reasons to start buying stocks and coincided with the trough in the SPX. This cyclical shift in our view from bearish-to-bullish aided our portfolio performance as we started adding cyclical exposure and trimming defensive exposure in order to benefit from the immense monetary and fiscal policy responses. Early on, we deemed these macro forces were forceful enough to really turn things around and we remained bullish on a cyclical time horizon. All in all, our trades produced alpha to the tune of 425bps. While our pair trades were sub-par (as is custom we are closing the remaining today), our high-conviction trades and cyclical portfolio moves recorded solid gains (please see the final tally below). Ray Of Light Encouragingly, there is light at the end of the tunnel, as a number of vaccines will become available late this year and/or early in 2021. This is great news for the economy and for stocks. We have positioned the portfolio to benefit from the reopening of the economy and the vaccine will act as an accelerant as our flagship publication posited last week while documenting BCA’s upbeat Outlook for 2021. Our portfolio enjoys a cyclical-over-defensive bent, has a small cap bias and we remain committed to the “Back-To-Work” basket versus the “COVID-19 Winners” basket (Chart 5). In the short-term, equities have discounted a lot of good news, which is likely to steal from next year’s returns. However, as populations get inoculated and large parts of the global economy reopen, a virtuous cycle of increasing consumer and business confidence would boost investment and GDP and prove a boon for corporate profits. Already the rally is broadening out with the value line arithmetic and geometric indexes outshining the SPX (Chart 6). An active ETF (RVRS:US) that has a reverse weighting to US large caps is also besting the S&P 500 and signals that more gains are in store in the New Year, especially for the still beaten down deep cyclical laggards. Chart 5Stick With The Reopening Trade
Stick With The Reopening Trade
Stick With The Reopening Trade
Chart 6Rally Is Broadening Out, And That’s Healthy
Rally Is Broadening Out, And That’s Healthy
Rally Is Broadening Out, And That’s Healthy
More Overweights Than Underweights As is custom every year, this Strategy Report introduces our high-conviction calls for 2021. This year we have four overweights, a bonus volatility trade on the long side, three underweights, and a bonus structural trade that we add to our trades of the decade first introduced in mid-December 2019. Our overweights comprise three “Back-To-Work” beneficiaries, a great rotation trade and a hedge. All of our underweights are focused on “COVID-19 Winners” that should lose some of their luster next year. Finally, this year we take a page out of Byron Wien’s annual “10 surprises” list and offer our clients three “also rans”, which got close but ultimately failed to make our high-conviction list. Anastasios Avgeriou US Equity Strategist anastasios@bcaresearch.com Overweight Hotels (Back-To-Work Theme) The recent positive vaccine news is a key reason we are warming up to this consumer discretionary sub group. While neither lodging nor cruise line vacationing will return to their previous peaks any time soon, both industries will survive and thus should no longer be priced for bankruptcy. One key industry demand determinant is confidence. Consumer sentiment has staged a W-shaped recovery. It is still flimsy, but the vaccine efficacy news should catapult confidence higher in the coming quarters. The implication is that the wide gulf between consumer confidence and relative share prices will narrow via a catch up phase in the latter (top panel, Chart 7). Moreover, the ISM non-manufacturing survey is on a sling shot recovery following the bombed out spring readings. This rebound also suggests that the path of least resistance is higher for lodging stocks (second panel, Chart 7). Our hotel demand indicator does an excellent job in encapsulating all these different forces and forecasts an enticing lodging services demand backdrop into 2021 (third panel, Chart 7). Already, consumer outlays on hotels are staging a comeback, albeit from an extremely depressed level. The upshot is that an earnings-led bounce is in the cards (fourth panel, Chart 7). Finally, washed out technicals and extremely alluring valuations provide an attractive reward/risk tradeoff at the current juncture (bottom panel, Chart 7). Bottom Line: The S&P hotels, resorts & cruise lines index is a high-conviction overweight. The ticker symbols for the stocks in this index are: BLBG: S5HOTL – MAR, HLT, CCL, RCL, NCLH. Chart 7Buy Hotels
Buy Hotels
Buy Hotels
Overweight Real Estate (Back-To-Work Theme) Boost the S&P real estate sector all the way to overweight today, in order to benefit from the looming full reopening of the economy on the back of the vaccine’s arrival. We have been bearish this niche S&P sector and delivered alpha to our portfolio both via the cyclical and high-conviction underweights this year. Nevertheless, we do not want to overstay our welcome and the time is ripe for a bullish commercial real estate (CRE) stance. The bearish story is well known, but some bullish undertones are widely neglected. The rebound in relative share prices is substantially trailing the 2009 episode, when REITs outshined the SPX by 65% one year following the March 2009 trough. Currently, on a similar SPX advance from the March 2020 lows, REITs are lagging the S&P 500 by 22% (top panel, Chart 8). As large parts of CRE have been at the epicenter of the pandemic, any return to even semi-normalcy in 2021 should see these beaten down stocks sling shot passed the SPX. When the fiscal package finally passes, it will likely serve as a fresh reflationary bridge to support the economy. The proverbial “kicking the can down the road” will thus lift some uncertainty hanging over CRE landlords receiving rents and also via banks not foreclosing distressed properties which would have further depressed CRE prices. CRE prices will likely recover in the New Year as vulture funds and opportunistic investors are already bargain hunting. Tack on the likely refinancing lifeline bankers will extend to CRE debt originators (middle & bottom panels, Chart 8) and such a backdrop will loosen the noose around distressed property landlords. Bottom Line: Boost the S&P real estate sector to an above benchmark allocation and add it to the high-conviction overweight call list. Chart 8Upgrade Real Estate To Overweight
Upgrade Real Estate To Overweight
Upgrade Real Estate To Overweight
Overweight Industrials (Back-To-Work Theme) Add the S&P industrials sector to the high-conviction overweight list. Emerging markets (EM) and China represent the key source for the sector’s buoyancy. The EM manufacturing PMI clocking in at 53.9 hit an all-time high (top panel, Chart 9). China’s PMIs are also on a similar trajectory, and the Chinese Citi economic surprise index has swung a whopping 277 points from -239 to +38 over the past nine months (second panel, Chart 9). The upshot is that US industrials stocks should outperform when China and the EM are vibrant. Peering over to the currency market, the debasing of the US dollar should also underpin industrials stocks via the export relief valve. A depreciating greenback also lifts the commodity complex and hence industrials equities that are levered to the extraction of commodities and other derivative activities (middle panel, Chart 9). Capex intentions are firming and CEO confidence is upbeat for the coming six months. The ISM manufacturing new orders-to-inventories ratio is corroborating the budding recovery in the soft data. Green shoots are also evident in hard data releases. Durable goods orders are on the verge of expanding anew (fourth panel, Chart 9). Sell-side analysts have never been more pessimistic with regard to the sector’s long-term EPS growth rate that is penciled in to trail the broad market by almost 800bps (bottom panel, Chart 9)! This bearishness is contrarily positive as a little bit of good news can go a long way. Bottom Line: The S&P industrials sector is a high-conviction overweight. Chart 9Overweight Industrials
Overweight Industrials
Overweight Industrials
Overweight Small Caps At The Expense Of Large Caps (Rotation Trade) Recent vaccine efficacy announcements have paved the way for a sustainable great rotation trade into small caps and out of large caps. One of the key small size bias drivers is the delta in sector composition between the small and large cap indexes. The relative gap in deep cyclicals alone is 13% as we highlighted in recent research. Relative share prices remain far apart from the budding recovery in the commodity complex including Dr. Copper’s flirtations with seven-year highs. Thus, the small caps catch up phase has a long ways to go (top & fourth panels, Chart 10). The financials sector gulf is also significant, with small caps’ exposure relative to their large cap brethren clocking in at over 700bps. Already, the yield curve is steepening and there are high odds of a selloff in the bond market as the economy continues to reopen (third panel, Chart 10). In addition, easy fiscal policy is a tonic to the small/large share price ratio. As a flood of money enters the economy with a slight lag, small caps will continue to make up ground lost during the early stages of the pandemic (fiscal balance shown inverted, second panel, Chart 10). Not only is fiscal stimulus providing a lifeline to debt-burdened small caps, but also the Fed’s opening up of the monetary spigots has pushed fixed income investors out the risk spectrum. Thus, the proverbial “kicking the can down the road” is boosting the allure of small cap stocks (junk spread shown inverted, bottom panel, Chart 10). Bottom Line: A small size bias is a high-conviction call for 2021. Chart 10Prefer Small Caps To Large Caps
Prefer Small Caps To Large Caps
Prefer Small Caps To Large Caps
Long VIX June 2021 Expiry Futures (Hedge Trade) We want to hedge our overweight exposures with a long VIX futures position for the June 16, 2021 expiry. We are spending $25.3 to go long and are comfortable paying up for insurance when the SPX is at all-time highs and there is a risk of some growth disappointment in the next six months. Chart 11 draws a parallel with the March 2009 SPX lows and plots the VIX in 2009 and 2010. While the path of least resistance is lower for volatility, sporadic surges are typical in the year following recessions. The S&P 500 also troughed in March 2020 and if history is an accurate guide, the path to SPX 4,000 will be rocky next year. As a reminder, the S&P 500 suffered a 16% correction in May 2010 and the VIX spiked higher. Positioning remains lopsided with both VIX put/call ratios (volume and open interest) at historically high levels, underscoring investor complacency. Net speculative futures positions as a percent of open interest are also probing multi-year lows, corroborating the complacent options data. Finally, the equity volatility curve has flipped from a 10% backwardation to a steep contango in the past month with the 3rd month now trading at a 25% premium to spot VIX; such a complacent level typically warns of a looming spike in the VIX. Bottom Line: Go long the VIX June 2021 futures as a small hedge to overweight equity positions. Chart 11Go Long VIX Futures As A Hedge
Go Long VIX Futures As A Hedge
Go Long VIX Futures As A Hedge
Underweight Homebuilders (COVID-19 Winner Theme) We deem that most, if not all, of the good news (low mortgage rates, low inventories, high demand, work-from-home reality, all-time highs on the overall NAHB housing sentiment survey) is already priced in galloping homebuilders stock prices and exuberant expectations. While being contrarian is fraught with danger, because more often than not the herd is right, there is a key macro driver that gives us confidence to be bearish homebuilders: interest rates. If our economic reopening thesis proves accurate next year, then the COVID-19 winners – homebuilders included – will take the back seat. Historically, interest rates and relative share prices have been inversely correlated and a steep selloff in the bond market is bad news for homebuilding stocks (top panel, Chart 12). On the operating housing front, some cracks are forming. New home sales, while brisk in absolute terms, are losing out to existing housing sales and homebuilders have resorted to price concessions in order to drive volumes (second & third panels, Chart 12). Profit margins are at the highest level since the subprime crisis and are vulnerable to a squeeze, not only from lower selling prices, but also from rising input costs. Framing lumber comprises roughly 15% of a new home’s commodity related costs and lumber prices have been expanding all year long (bottom panel, Chart 12). Bottom Line: Put the S&P homebuilding index to the high-conviction underweight call list. The ticker symbols for the stocks in this index are: BLBG: S5HOME – LEN, PHM, DHI, NVR. Chart 12Avoid Homebuilders
Avoid Homebuilders
Avoid Homebuilders
Underweight Pharma (COVID-19 Winner Theme) The S&P pharmaceutical index is a high-conviction underweight for 2021. On the macro front, the Fed’s ZIRP bodes ill for defensive pharma equities. The Fed was uncharacteristically quick this recession to drop rates to the lower zero bound to reflate the economy. As a result, safe haven equities, Big Pharma included, typically trail the broad market as the economy gets out of the ER and into the recovery room (second panel, Chart 13). Importantly, relative pharmaceutical profits are highly counter cyclical: they rise at the onset of recession and collapse as the economy heals. Currently, as the world economy has transitioned to a V-shaped recovery, the reopening of the economy into the New Year will continue to knock the wind out of relative pharma profitability. Similarly, an appreciating greenback has historically been synonymous with pharma outperformance and vice versa (third panel, Chart 13). Keep in mind, Big Pharma make the lion’s share of their profits domestically, further cementing the positive correlation with the US dollar. This local profit sourcing represents one of the main reasons why politicians on both sides of the aisle are after domestic pharma profits. Pharma prices are on the cusp of contracting. Importantly, President Trump’s late-July executive order “to allow importation of certain prescription drugs from Canada” among other provisions is a direct blow to the profit prospects of Big Pharma (bottom panel, Chart 13). Bottom Line: We are cognizant that the COVID-19 vaccine will lift Big Pharma, but only temporarily, as cyclical forces will more than offset the positive vaccine news. The S&P pharmaceuticals index is a high-conviction underweight. The ticker symbols for the stocks in this index are: BLBG – S5PHARX: JNJ, PFE, MRK, LLY, BMY, ZTS, CTLT, MYL, PRGO. Chart 13Sell Pharma
Sell Pharma
Sell Pharma
Underweight Consumer Staples (COVID-19 Winner Theme) Countercyclical consumer staples stocks served their purpose and supported our portfolio in the front half of 2020. Now that vaccines are coming, we are adding the S&P consumer staples sector to the high-conviction underweight call list. The current macro backdrop underscores that the path of least resistance is lower for relative share prices. Not only is the ISM manufacturing survey on fire, but also, consumer confidence is forming a trough (ISM manufacturing shown inverted, second panel, Chart 14). One of the factors that will drive relative earnings lower is the weaker US dollar. As a reminder, the S&P consumer staples sector derives approximately 32% of its sales from abroad, which is 10 percentage points lower than the S&P 500. As a consequence, on a relative basis, staples stocks benefit much less than the rest of the market from a falling currency (third panel, Chart 14). Our relative macro earnings model does an excellent job in encapsulating all these moving parts and paints a dark profit picture for this GICS1 sector in the New Year (fourth panel, Chart 14). Bottom Line: The S&P consumer staples sector is a high-conviction underweight. Chart 14Underweight Consumer Staples
Underweight Consumer Staples
Underweight Consumer Staples
Short NASDAQ 100 / Long S&P 500 (Secular 10-year Call) We first wrote about the extreme market cap concentration in January when we were cautioning investors of an SPX drawdown and drew parallels with the dotcom era. Back in late-1999/early-2000 the top 5 stocks comprised 18% of the S&P 500. In July we delved deeper and split the S&P 500 in the S&P 5 versus the S&P 495 to highlight the extraordinary narrow returns since 2015. Such extreme concentration in a handful of tech titan stocks is clearly unsustainable. The bullish case for tech is well documented and understood; the COVID-19 pandemic acted as an accelerant to the technological adoption of the new remote working realities. However, $2tn valuations (AAPL, MSFT & AMZN) make little sense to us, especially if there is little earnings follow through and most of the returns are explained by multiple expansion. In all likelihood, the easy money has been made. Going back to the early 1970s is instructive in order to put the tech juggernaut into proper perspective. Every decade or so there have been clearly defined booms and busts in US tech stocks (Chart 15). Schumpeter’s “creative destruction” forces are undoubtedly at play. What is interesting is that not only have tech stocks likely stalled near the dotcom era peak, but also they have been outperforming since the end of the GFC (i.e. roughly a decade); they are due for at least a breather. If history rhymes, we have entered a new bust cycle and the tech sector’s underperformance will play out over the coming decade. Bottom Line: We are compelled to add to our structural trades and recommend investors underweight the tech sector on a ten-year time horizon via the short QQQ / long SPY exchange traded funds which offer the most liquidity. Chart 15Short QQQ / Long SPX For The Next Decade
Short QQQ / Long SPX For The Next Decade
Short QQQ / Long SPX For The Next Decade
Also Rans Within consumer discretionary, automobiles & auto parts & components piqued our interest from the long side. These stocks would greatly benefit from a reopening economy as a semblance of normality returns sometime next year. Nevertheless, two key factors kept us at bay. First, similar to homebuilders, this index has gone vertical since the March lows, besting the SPX by a factor of 2:1 (top panel, Chart 16). We maintain exposure via our “Back-To-Work” basket with GM, but even this auto manufacturer is up 50% since the September 8, 2020 inception. Finally, TSLA is about to enter the SPX at a stratospheric valuation that would dominate the automobile sub group. This is eerily reminiscent of YHOO’s SPX inclusion in late-1999 that led the dotcom bubble peak by four months. The parallel is making us nervous, therefore we are staying patiently on the sidelines. On the underweight side we wanted to include the niche S&P semi equipment index, but opted not to as the Bitcoin mania has really pushed these stocks to the stratosphere (middle panel, Chart 16). In addition, this chip sub-group has one of the highest export exposures in the SPX with a large slice of foreign revenue originating in China. Hence, news of a Biden presidency also served as a catalyst to propel them higher (i.e. at the margin, a less hawkish president on the Sino/American trade war). We really struggled with global gold miners (GDX:US). Our initial thinking was to downgrade them to underweight (from currently neutral), which is consistent with global growth reaccelerating and interest rates rising. However, we missed the boat when it set sail in early August (bottom panel, Chart 16). Now, the gold bearish trade is gaining momentum and has become a consensus trade as big macro investors (Tudor and Druckenmiller among others) are shifting toward Bitcoin and have been vociferous about their positioning. Thus, we preferred to remain on the sidelines with a benchmark allocation. Chart 16Three “Also Rans”
Three “Also Rans”
Three “Also Rans”
Footnotes Current Recommendations Current Trades Strategic (10-Year) Trade Recommendations
2021 High-Conviction Calls
2021 High-Conviction Calls
Size And Style Views October 26, 2020 Favor small over large caps July 27, 2020 Overweight cyclicals over defensives June 11, 2018 Long the BCA Millennial basket The ticker symbols are: (AAPL, AMZN, UBER, HD, LEN, MSFT, NFLX, SPOT, TSLA, V). January 22, 2018 Favor value over growth