Euro Area

Investors should go long US treasuries and stay overweight defensive versus cyclical sectors, large caps versus small caps, and aerospace/defense stocks. Regionally we favor the US, India, Southeast Asia, and Latin America, while disfavoring China, Taiwan, Hong Kong, eastern Europe, and the Middle East.
This week’s <i>Global Investment Strategy</i> report titled Fourth Quarter 2022 Strategy Outlook: A Three-Act Play discusses the outlook for the global economy and financial markets for the rest of 2022 and beyond.
Executive Summary EU Metal Industry Under Threat
EU Energy Crisis, Strong USD Imperil Bloc’s Metals Industry
EU Energy Crisis, Strong USD Imperil Bloc’s Metals Industry
Russia’s threat to cut off all remaining exports of natural gas to the EU via Ukraine will further imperil the bloc’s struggling metals industry, particularly aluminum smelting – where half of its capacity already has been shut – and zinc refining. The EU will have to prioritize energy security over its renewable-energy goals, given the challenges its manufacturing industries will confront for the next 3-5 years. Surging imports of raw copper concentrates and unwrought metal will consolidate the global dominance of China’s copper refiners, which sharply increased their treatment and refining charges this week. The US likely will see more investment in metals mining and refining on the back of the EU distress, which realistically cannot be addressed until gas and power prices fall to levels that allow them to sustain their operations. Bottom Line: Ongoing supply shocks to the EU’s base-metals industry will force the bloc to prioritize energy security over its renewable-energy goals. This will drive the bloc’s demand for liquified natural gas (LNG) and oil higher, even after short-term measures to increase LNG intake and distribution capacity are completed over the next 2-3 years. We expect the equities of oil and gas producers to outperform metals miners over this period. After being stopped out, we will be re-instating our long XOP ETF position at tonight’s close. Feature Earlier this month, Eurometaux, the EU metals lobbying group, published a memo to the European Commission drawing attention to “Europe’s worsening energy crisis and its existential threat to our future.”1 This is not hyperbole. At the heart of the industry’s woes is a chronic shortage of energy – in any form – for industrial use. Utilities are signing long-term LNG supply contracts to address this shortage, but they can expect to wait 3-4 years or more before gas arrives on Europe’s shores.2 Spot and one-off cargoes will become available over that time, but most of the existing LNG production is under long-term contract. Oil, coal, and nuclear energy are available for power generation, industrial applications and space-heating, and they increasingly are being used in the bloc, but these too are constrained.3 Measures to address the chronic energy shortage hammering the EU base-metals industry will take years to effect, and could come too late to meaningfully preserve existing refining capacity, which has been contracting for years (Chart 1).4 Most of the EU’s metals production is accounted for by aluminum, copper and zinc, which are extremely energy intensive, copper only less so (Chart 2). The surge in LNG prices following Russia's invasion of Ukraine propelled electricity prices higher, given gas is the marginal fuel for EU power generation (Chart 3). This crushed zinc and aluminum refining. Half of the EU’s aluminum smelter capacity – ~ 1mm MT – will be curtailed or shuttered this year, according to European Aluminum.5 Chart 1EU Metal Industry Under Threat
EU Energy Crisis, Strong USD Imperil Bloc’s Metals Industry
EU Energy Crisis, Strong USD Imperil Bloc’s Metals Industry
Chart 2EU Metals Are Extremely Energy Intensive
EU Energy Crisis, Strong USD Imperil Bloc’s Metals Industry
EU Energy Crisis, Strong USD Imperil Bloc’s Metals Industry
Chart 3EU Power Price Surge Crushes Metals Refining
EU Energy Crisis, Strong USD Imperil Bloc’s Metals Industry
EU Energy Crisis, Strong USD Imperil Bloc’s Metals Industry
The surge in European electricity prices and the resulting curtailment or shuttering of zinc refining paced the 2.6% y/y decline in global output in 1H22, which took global production down to 6.77mm MT, according to the International Lead and Zinc Study group. Europe accounts for ~ 15% of global zinc refining.6 Refined zinc consumption fell 3% y/y in 1H22 to 6.74mm MT. China Bingeing On Copper Global refined copper output in the January – July 2022 period slightly outpaced usage – with 3% growth in the former and 2.6% growth in the latter, according to the International Copper Study Group (ICSG). On the back of this report, we lowered our expected supply growth estimate to 3% this year, (Chart 4). This brings our estimate for total supply down by ~400k MT vs. our previous iteration to 25.3mm MT. We are keeping our estimate of 2023 supply growth rate at ~ 4.5%. Our copper demand estimate is a function of real GDP estimated by the World Bank, and remains at just under 26mm MT and 27.2 mm MT for 2022 and 2023 respectively. As a result of the lower 2022 production growth rate, our forecasted copper deficit has widened to ~ 605k tons in 2022 and 480k tons in 2023. The mismatch in supply and demand levels will keep inventories in China and the West under pressure (Charts 5A and 5B). Chart 4Copper Supply Estimate Lowered
Copper Supply Estimate Lowered
Copper Supply Estimate Lowered
Chart 5AChinese Copper Inventories Continue To Draw
Chinese Copper Inventories Continue to Draw
Chinese Copper Inventories Continue to Draw
Chart 5BAs Do Stocks In The West
As Do Stocks In The West
As Do Stocks In The West
China’s imports of copper condensates – the raw material used to make refined copper – surged to 16.65mm tons over January – August 2022, up 9% y/y. Imports of unwrought and semi-fabricated copper were up 8% over the same period at 3.9mm MT, according to Mysteel.com. As is to be expected, treatment and refining charges at Chinese smelters also moved higher: for 3Q22, refiners were charging $93/MT, up $13 from 2Q22 levels and $23/MT from 4Q21, according to Reuters. These charges increase when raw-material supplies increase, and vice versa. This is meant to be a floor charged for refining concentrates to produce refined copper. Real USD Matches US PPI After Re-Opening In an unusual turn of events, the USD Real Effective Exchange Rate (REER) has been moving higher along with the US Producer Price Index for all commodities. This trend started as the global economy accelerated its re-opening in 2021 (Chart 6). The USD has a profound affect on commodity prices: Most globally traded commodities are denominated in USD, funded in USD and invoiced in USD. This is the channel through which the Fed’s monetary policy impacts commodity buyers ex-US. A stronger dollar means commodities in local-currency terms are more expensive, and vice versa. It also means production costs in states that do not peg their currencies to the USD go down, and vice versa. Chart 6Real USD Gains With US PPI During Reopening
Real USD Gains With US PPI During Reopening
Real USD Gains With US PPI During Reopening
Given the USD’s elevated level, copper prices in local-currency terms will continue to face a massive headwind on the demand side, and a massive tailwind on the production side. For households and firms buying commodities, or durable goods with a lot of metals in them (copper, stainless steel, etc.), Fed policy has a direct effect on how their budgets get allocated.7 In the short and long run macroeconomic variables such as the USD influence copper prices by increasing the cost of copper ex-US when the dollar rallies, and vice versa. Fundamental variables like tight inventories, which arise when demand is consistently above supply, impart an upward price bias to the copper forward curve (backwardation increases as inventories decrease). Domestic economic factors matter, too. Copper prices have been pummeled by the meltdown of China’s property sector, which has been the growth engine for the country’s economy, accounting for ~ 30% of its copper demand. The USD has remained well bid following Russia’s invasion of Ukraine, presenting a powerful headwind to commodity prices in general. This is particularly true for refined copper, given China accounts for more than 50% of total global consumption. China’s RMB dropped 11.4% vs. the USD from the start of the year to now. This has not stood in the way of a sharp increase in imports of the copper ore and refined metal this year, despite the country’s weak economic performance. Given China’s property-market slowdown and its zero-tolerance COVID-19 policy and its attendant lockdowns, it is difficult to pinpoint a cause for its increased copper demand. It may be opportunistic purchasing – buying the metal when prices are far lower than their peak earlier this year – or it could signal a post-Communist Party Congress increase in economic activity (e.g., more fiscal stimulus hitting the system) officials are preparing for. Investment Implications The EU’s metals-refining sector faces existential challenges as a result of the bloc’s energy crisis. Significant employers – not just the metal refiners – will be confronting limited energy supply and higher costs for years, given the tightness in conventional energy markets – oil, gas and coal. The renewable-energy sector also faces daunting challenges, as a result of difficulties faced by metals refiners and the energy crisis they presently confront. It is worthwhile noting that none of the renewables technology is possible without metals. Given the abundant lessons re reliance on a single supply source Russia’s invasion of Ukraine has provided, we expect investment in US metals mining and refining to increase, as consumers of copper, aluminum and zinc seek to diversify away from Chinese dominance of this sector. This will take time to build out, just as the increase in LNG supplies will take time. This likely will keep a bid under the USD, as manufacturing, mining and refining capex investment shifts to the US. We expect the EU’s drive to secure conventional energy will drive the bloc’s demand for liquified natural gas (LNG) and oil higher, even after currently planned short-term measures to increase LNG intake and distribution capacity are completed over the next 2-3 years. After being stopped out this past week, we will be re-instating our long XOP ETF position on tonight’s close, consistent with our view. Robert P. Ryan Chief Commodity & Energy Strategist rryan@bcaresearch.com Ashwin Shyam Research Analyst Commodity & Energy Strategy ashwin.shyam@bcaresearch.com Commodities Round-Up Energy: Bullish. European Commission President Ursula von der Leyen proposed additional economic sanctions against Russia yesterday including extending price caps on oil to third countries, following the call-up of reserves in Russia last week, and a veiled threat to use nuclear weapons against Ukraine. In a related matter, Gazprom, the state-owned gas producer and trading company, threatened to cut off the remaining gas sales to Europe via Ukraine – close to half the ~ 80mm cm /d still being sold via pipeline to the continent (Chart 7). It is apparent the EU has been anticipating a full shut-off of Russian pipeline gas shipments, which likely motivates von der Leyen’s proposal. Any proposal to increase sanctions on Russia would have to be unanimously approved. Base Metals: Bullish. In a boost to prospective Chile copper production, a BHP executive indicated he expects regulatory uncertainties in the largest copper producing state to ease. BHP mentioned earlier this year that legal certainty in Chile would be key to investing over USD 10 billion in the state. Earlier this month, Chilean voters rejected a constitution, which, among other things, could have curtailed mining operation by including new taxes and environmental regulations. Precious Metals: Neutral. In their Q2 platinum balances report, the World Platinum Investment Council (WPIC) expects FY 2022 surplus to rise more than 50% vs. its Q1 estimates to 974k oz. Weak platinum ETF demand resulting from a strong USD and rising interest rates is expected to outweigh operational constraints in South African and North American mining operations. Bolstering supply is the fact that Russian platinum – which constitutes ~11% of global supply – has been reaching buyers. However, this security of supply may not last. Once buyers’ long-term contracts for Russian platinum end, as in the case with aluminum, companies may self-sanction, turning to the spot market and other producing states instead. For palladium, SFA Oxford sees the metal's surplus dropping to ~92% y/y, as demand is expected to increase and production is forecast to fall (Chart 8). Chart 7
EU Energy Crisis, Strong USD Imperil Bloc’s Metals Industry
EU Energy Crisis, Strong USD Imperil Bloc’s Metals Industry
Chart 8
Palladium Balances Expected To Drop
Palladium Balances Expected To Drop
Footnotes 1 Please see Europe’s non-ferrous metals producers call for emergency EU action to prevent permanent deindustrialisation from spiralling electricity and gas prices, posted by Eurometaux 6 September 2022. 2 See, e.g., Exclusive: German utilities close to long-term LNG deals with Qatar, sources say published by reuters.com 20 September 2022. 3 For additional discussion, please see Energy Security Rolls Over EU's ESG Agenda, which we published 28 July 2022. It is available at ces.bcaresearch.com. 4 Please see Agenda for a resilient European metals supply for the green and digital transitions, posted by Eurometaux in mid-2020. 5 Please see Reconciling growth and decarbonisation amidst the energy crisis, posted by European Aluminium May 2022. 6 Please see Column: European smelter hits mean another year of zinc shortfall published by reuters.com 17 May 2022. 7 Please see "Global Dimensions of U.S. Monetary Policy" by Maurice Obstfeld, which appeared in the February 2020 issue of International Journal of Central Banking for an in-depth discussion and analysis. Investment Views and Themes Strategic Recommendations Trades Closed in 2022
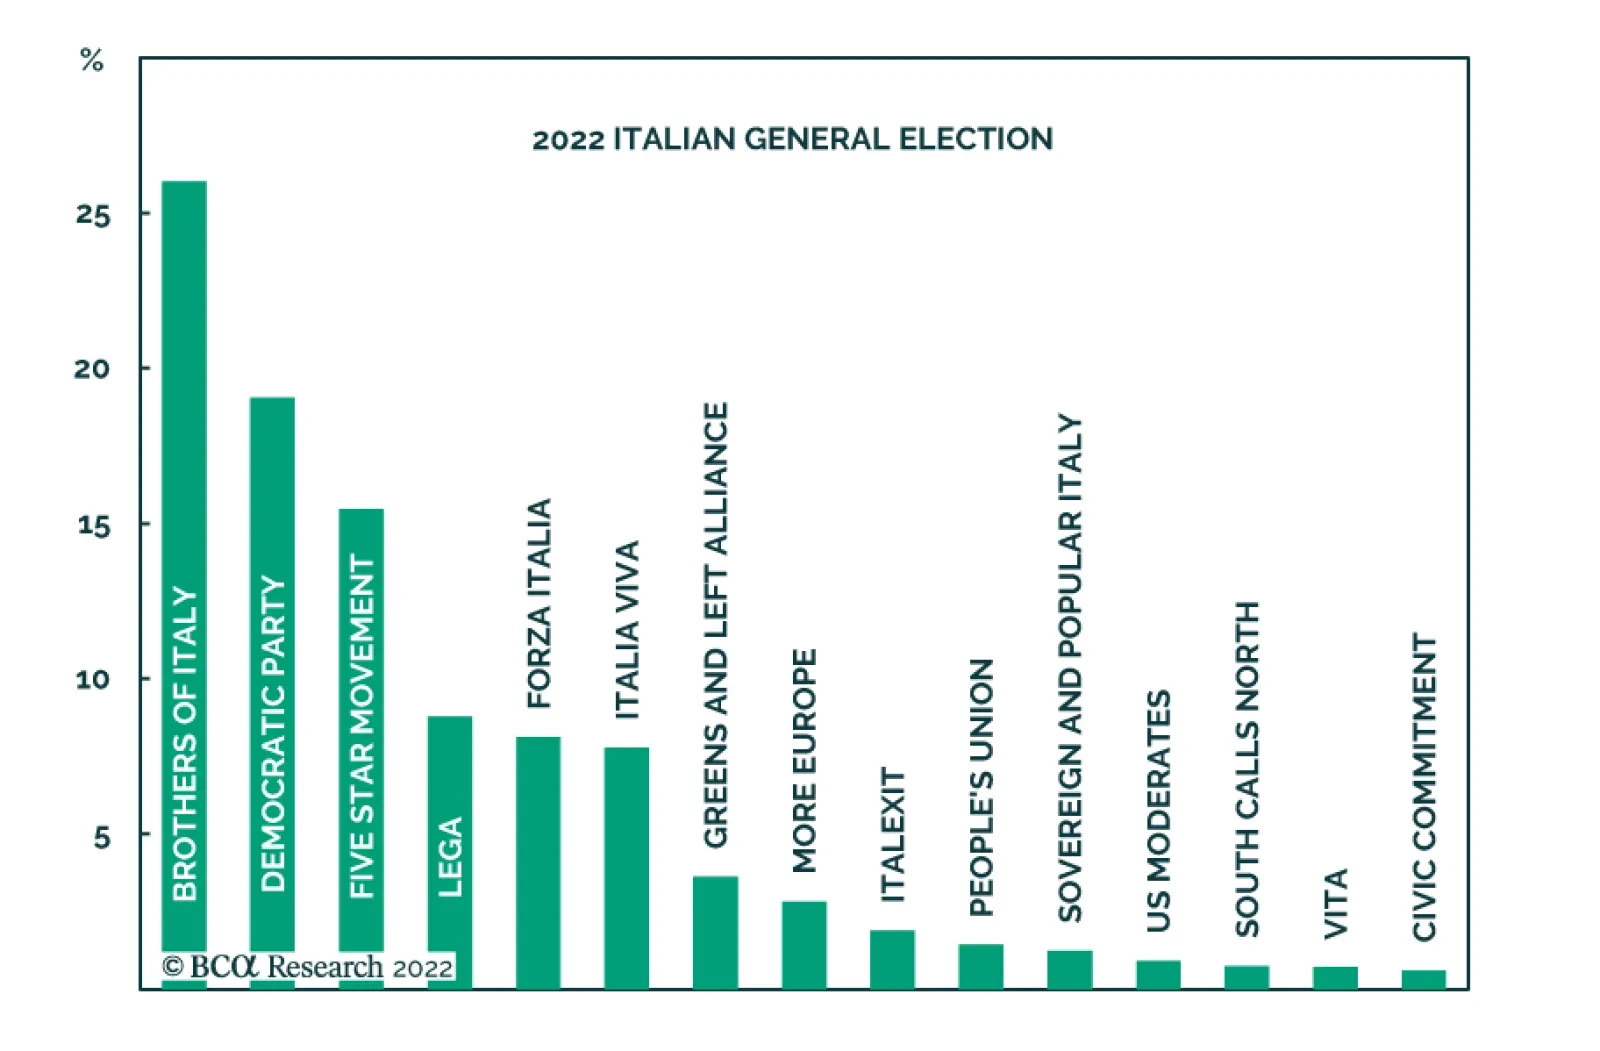
Italy’s right-wing coalition led by Giorgia Meloni of the far-right Brothers of Italy party –which also includes the League and Forza Italia – secured 44% of the vote in Sunday’s general election. Italian government bond yields rose 21bps on Monday following…
Executive Summary What To Do With The Euro?
What To Do With The Euro?
What To Do With The Euro?
The outlook for European assets is uniquely muddled. European energy prices will remain elevated, but the worst of the adjustment is already behind us. The global economy is teetering on the edge of a recession and weak global growth is historically very negative for European assets. However, European valuations and earnings forecasts already discount an extremely severe outcome for global growth. A hawkish Fed should support the dollar, but investors increasingly realize foreign central banks are fighting inflation equally aggressively. The dollar already anticipates a global recession. Meantime, European credit offers a large spread pickup over sovereigns and even appears as a decent alternative to equities. Within a credit portfolio, we adopt a more cautious approach towards European investment grade bonds (IG) relative to their US counterpart. Instead, we recommend favoring UK IG over Euro Area IG as well as Swedish IG relative to US IG. Recommendations INCEPTION DATE RETURN SINCE INCEPTION (%) COMMENT Set a stop buy at EUR/USD 0.9650 with a stop-loss at 0.9400 9/26/2022 Bottom Line: Investors should maintain a modest long position in equities in European portfolios, with a preference for defensive stocks over cyclicals. The conditions are falling in place to buy the euro tentatively. Following the hawkishness that transpired from the Fed press conference and revised forecasts last week, EUR/USD plunged below 0.99 and hit a 20-year low. Moreover, President Vladimir Putin’s announcement of a broader mobilization of the Russian army is stoking fears that the Ukrainian conflict will only be prolonged. The prospects of a lengthier war and greater energy market shock are raising further worries for Europe’s growth outlook, which weighs on European asset prices, notably the euro and the pound. The odds of a global financial accident are on the rise. Global central banks have joined the Fed and are relentlessly tightening global monetary and financial conditions. Moreover, the surging dollar is adding to global risks by raising the cost of capital around the world. This is a very fragile situation and the odds of a global recession have jumped significantly. Against this backdrop, investors should continue to overweight defensive equities at the expense of cyclical stocks. The euro also has more downside, but we are issuing a tentative stop-buy at EUR/USD 0.9650 with a stop at 0.9400. Credit remains a safer alternative to European stocks. The Evolving European Energy Backdrop Chart 1All About The Gas
All About The Gas
All About The Gas
The surge of natural gas and electricity prices since the fall of 2021 has been one of the main drivers of the underperformance of European assets and the fall in the euro (Chart 1). While the medium-term outlook for European energy prices remains fraught with risk, the near-term prospects have improved. Following a surge from €77.4/MWh in June to €340/MWh on August 26, one-month forward natural gas prices at the Dutch Title Transfer Facility (TTF) have declined 45% to €187/MWh. These wild gyrations reflect the evolution of both the natural gas flows from Russia, which have fallen from 3,060Mcm to 599 Mcm today, and the rapid buildup of natural gas inventories across the European Union. The good news is that the costly efforts to rebuild European gas inventories have been successful. EU-wide inventories are at 85.6% capacity, achieving its 80% storage objective well before November. Germany has gone even further, with storage use now standing at 90% of capacity. This large stockpile, along with the re-opening of coal power plants and consumption curtailment efforts, should allow Europe to survive the winter without Russian energy imports, as long as the temperatures are not abnormally cold. The absence of a summer dip in Norwegian gas exports and the surge in LNG flows to Europe have partially replaced the missing Russian inflows, thus helping Europe rapidly rebuild its natural gas inventories (Chart 2). This success was a consequence of elevated European natural gas prices, which have allowed Europe to absorb LNG flows from the rest of the world (Chart 3). Chart 2No Restocking Without LNG
No Restocking Without LNG
No Restocking Without LNG
Chart 3LNG Flowed Toward High Prices
LNG Flowed Toward High Prices
LNG Flowed Toward High Prices
So far, the European industrial sector has managed to adjust better than expected to the jump in the price of natural gas, a crucial energy input. Take Germany as an example. For the month of August, Germany’s consumption of natural gas by the industrial sector fell 22% below the 2018-2021 average (Chart 4, top panel), while PPI moved up vertically. Yet, industrial output is only down 5% year-on-year and industrial capacity utilization stands at 85%, which is still a level that beats two thirds of the readings recorded between 1990 and this the most recent quarter (Chart 4, bottom panel). The adjustment will be uneven across various industries, with those most voracious of natural gas likely to experience a declining share of Europe’s gross value added. Using the German example once again, we can see that the chemicals, basic metal manufacturing, and paper products sectors are the most at risk from higher natural gas prices and most likely therefore to suffer the most from gas rationing this winter (Chart 5). Chart 4A Surprisingly Successful Transition
A Surprisingly Successful Transition
A Surprisingly Successful Transition
Chart 5The Three Sectors Most At Risk
Is Europe About To Be Crushed?
Is Europe About To Be Crushed?
Going forward, important changes are likely to take place that will allow the European economy to continue to survive on diminished Russian gas flows: European natural gas prices will remain elevated compared to the rest of the world to attract LNG flows to the region. Importantly, Europe’s capacity to absorb these flows keeps increasing, as more re-gasification ships are docked around the continent. Moreover, North America is building more facilities to export LNG to Europe. Chart 6Nuclear Energy's Contribution Will Rebound
Nuclear Energy's Contribution Will Rebound
Nuclear Energy's Contribution Will Rebound
Nuclear electricity production will rebound. Currently, the EU’s nuclear production is around 43.2TWh, well below the normal 60TWh to 70TWh winter levels, driven mostly by the collapse in French production from 35TWh to 18TWh (Chart 6). This decline in nuclear electricity generation has accentuated the upward pressure on European natural gas and electricity prices. One of the key objectives of the nationalization of EDF by the French government is to accelerate the maintenance of France’s ageing nuclear power plants and allow a return to more normal production levels by the winter. The role of natural gas in European household’s energy mix will decline. Currently, EU households are the largest natural gas consumers and account for 41% of the bloc’s gas consumption (Chart 7). It will be easier to replace their natural gas consumption over time with other sources of energy than it will be to cut the industrial sector’s consumption extensively. As a result, even if European natural gas imports are permanently below 2021 levels, the industrial sector will not bear the brunt of the adjustment. Chart 7Households To Be Displaced
Is Europe About To Be Crushed?
Is Europe About To Be Crushed?
These developments imply that natural gas prices have limited downside. However, we believe that the worst of the spike in prices is behind us, at least over the near term. The reason is that the inelastic buying created by the inventory re-stocking exercise since May 2022 is ending. In fact, the German Federal Minister for Economic Affairs and Climate Action, Robert Habeck, declared last week that his country would no longer purchase gas at any price. Chart 8The Most Painful Part Of The Adjustment Is Over
The Most Painful Part Of The Adjustment Is Over
The Most Painful Part Of The Adjustment Is Over
If prices stabilize around €200/MWh, European industrial activity will continue to face a headwind, but the worst of the adjustment process will be in the rearview mirror as natural gas inflation recedes (Chart 8). Ultimately, capitalist systems are dynamic, and it is this rapid change in price that causes the most pain. In other words, the impoverishment of the European private sector has already happened. Steady states are easier to manage. Moreover, if natural gas prices eventually follow the future’s curve (this is a big “if”), the picture for Europe will improve considerably. One additional mitigating factor should ease the pain being experienced by the European private sector. Fiscal policy is responding very aggressively to the current energy crisis. So far, EU countries and the UK have allocated more than €500 billion to protect their private sectors against higher energy costs (Chart 9) and the UK just announced tax cuts of £45 billion. This is in addition to the disbursement of €150 billion from the NGEU funds in 2023. Moreover, the European commission is planning to modify the EU fiscal rules to abandon annual structural deficit targets and for debt sustainability to be evaluated over a ten-year period. Chart 9Massive Fiscal Support
Is Europe About To Be Crushed?
Is Europe About To Be Crushed?
Bottom Line: The worst of Europe’s adjustment to higher energy prices is now behind us. However, European energy prices will remain elevated, which will continue to put Europe at a handicap compared to the rest of the world. Bad News From The Rest Of The World The worst of Europe’s energy crisis is behind us, but the world is teetering toward a recession, which will hurt the trade- and manufacturing-sensitive European economy. Chart 10A Global Recession This Way Comes
A Global Recession This Way Comes
A Global Recession This Way Comes
The tightening in global financial conditions created by the surge in the dollar and by the jump in global yields is pushing the US Manufacturing ISM and the Euro Area PMIs toward the low-40s, which is consistent with a recession (Chart 10). The problem does not stop there. Global central banks have become solely focused on fighting inflation. For 2023, the FOMC’s dot plot forecasts both an interest rate rise to 4.6% and a 0.7% increase in the unemployment rate. This is tantamount to the Fed telling the market that it will increase interest rates as a recession emerges to repress inflation. Not to be undone, European central banks are also rapidly increasing their policy rates, even as they also forecast an imminent deterioration in domestic growth conditions. Quickly tightening policy in a slowing growth environment, especially as the dollar hits a 20-year high, is a recipe for a financial accident and a global recession. Chart 11No Help From China
No Help From China
No Help From China
Moreover, China’s economy is still unable to create a positive offset to the deterioration in global monetary and financial conditions. The marginal propensity of China’s private sector to consume remains in a downtrend, hampered by the country’s zero-COVID policy and the continuing meltdown in real estate activity (Chart 11). Furthermore, the most rapid decline in the yuan exchange rate in 5 years is imparting an additional downside risk to the global economy. European stocks are uniquely exposed to these threats. Europe overweights deep cyclicals, which are currently squeezed by the deteriorating global growth outlook. The message from the collapse in FedEx’s stocks on very poor guidance is particularly ominous: this company has a much closer correlation with the Dow Jones Euro STOXX 50 than with the S&P 500 (Chart 12). European share prices are already factoring in much of the bad news. Valuations are significantly less expensive than they once were. The Shiller P/E ratio of European equities and their equity risk premium stand at the same levels as those in the 1980s. This is in sharp contrast to the US (Chart 13). Chart 12FedEx's Gloomy Delivery
FedEx's Gloomy Delivery
FedEx's Gloomy Delivery
Chart 13Low CAPE In Europe
Low CAPE In Europe
Low CAPE In Europe
Table 1A Deep Downgrade To European Earnings
Is Europe About To Be Crushed?
Is Europe About To Be Crushed?
European forward earnings have also already done considerable work adjusting downward. Excluding energy, 2022 and 2023 forward EPS are down 10.3% and 11.9% since their peak, respectively (Table 1). But inflation flatters earnings growth and European large-cap indices are dominated by multinational firms, which implies that looking at earnings in USD terms makes more sense. In both real and USD terms, 2022 and 2023 forward EPS, excluding energy, are already down 25% and 26.4%, respectively. These adjustments are in line with previous recessions. The counterargument is that analysts still expect positive earnings growth in 2023 relative to 2022. However, at 4%, this increase in expected earnings is still well below inflation and 6% below the average expected growth in forward earnings recorded over the past 35 years (Chart 14). Additionally, a global recession could put further downward pressure on energy prices in Europe, which would create an additional cushion under European earnings in 2023 The implication here is that it still makes sense to be modestly long European equities in absolute terms, especially for investors with an investment horizon of twelve months or more. However, we cannot be complacent, as the risk of an additional selloff is still too large for comfort. As a result, for now investors should only garner a small exposure to European equities and do so while favoring defensive names over cyclical ones (Chart 15). Chart 14Weak Forward Earnings Growth
Weak Forward Earnings Growth
Weak Forward Earnings Growth
Chart 15Continue To Favor Defensive Names
Continue To Favor Defensive Names
Continue To Favor Defensive Names
Bottom Line: European stocks must still contend with the growing threat of a global recession catalyzed by tighter financial conditions and aggressive global central banks. The good news is that they already discount considerable pessimism, as illustrated by their low valuations and downgraded forward earnings. Consequently, investors can continue to nibble at European equities, but do so to a limited degree and by favoring defensive stocks over cyclical ones, at least for now. The Euro Dilemma On the back of the very hawkish Fed meeting and the announcement of Russia’s broadened military mobilization, the EUR/USD broke below the 0.99 support level and fell under 0.98, a level we judged in the past as very attractive on a six-to-nine months basis. Obviously, Fed Chair Jerome Powell’s reaffirmation of the FOMC’s war on inflation is a major boost to the dollar. The momentum property of the greenback implies that it has room to rally further in the near term. This narrative, however, overlooks the fact that the Fed is not the only central bank intent on fighting inflation, no matter the cost. The Norges Bank, the Riksbank, the ECB, and even the SNB have all showed their willingness to move aggressively against inflation. While the BoE only increased rates by 50bps last week, its communication suggested that an at least 75bps increase would be due at the November meeting, when the MPC publishes its Monetary Policy report that will incorporate the impact of the budget measures announced by new British Prime Minister, Liz Truss. Chart 16The Rest Of The World Is Catching Up To The Fed
The Rest Of The World Is Catching Up To The Fed
The Rest Of The World Is Catching Up To The Fed
As a result, market interest rate expectations are climbing in the US, but they are rising even faster in Europe, albeit from a lower base. However, the decline in the expected rate of interest in the US relative to Europe and in the number of expected hikes in the US relative to Europe are consistent with a sharp decline in the DXY in the coming months (Chart 16). Due to its 80% weight in European currencies, a weaker DXY implies a rebound in the EUR, GBP, CHF, NOK, and SEK against the USD. Chart 17Surprising European Resilience
Surprising European Resilience
Surprising European Resilience
Moreover, there could be room for expected interest rate differentials to narrow further against the dollar. The analysis we published two weeks ago shows that, even when the different nonfinancial private debt loads are accounted for, the gap in the US and Eurozone r-star stands at 1%. However, the spread between the Fed funds rate’s upper bound and the ECB Deposit Rate is 2%. The gap between the July 2023 US and Eurozone OIS is 1.7%. Since European inflation may prove more stubborn than that of the US in the near term, there is scope for the expected interest rate gap to narrow further, especially as the Euro Area final domestic demand is surprisingly more robust than that of the US (Chart 17). What about global growth? The view that the global economy is about to experience a recession is consistent with a stronger dollar, since the greenback is an extremely countercyclical currency. However, the DXY’s 25% rally since January 2021 already prices in such an outcome (Chart 18). Similarly, the euro is trading again at 2002 levels, which is also in line with a global recession with deep negative repercussions for the Eurozone. Additionally, the Euro has fallen 21% since May 2021, which compares to the 21.4% fall in 2008, the 20% decline in 2010, the 18% plunge in 2011/12 and the 24% collapse in 2014/15; yet EUR/USD is much cheaper now than in any of those instances. Moreover, the wide difference between the competitiveness of Germany and that of the rest of the Euro Area has now faded, which means that a major handicap against the euro has disappeared (Chart 19). Chart 18The Dollar Already Foresees A Recession
The Dollar Already Foresees A Recession
The Dollar Already Foresees A Recession
Chart 19Normalizing Eurozone Internal Competitiveness
Normalizing Eurozone Internal Competitiveness
Normalizing Eurozone Internal Competitiveness
This does not mean that the euro is not without risk. First, since the major euro collapse began in June 2021, EUR/USD breakdowns have been followed by average declines of 3.6%, ranging from 2.7% to 4.2%. Since the dollar is a momentum currency, it is unlikely that this time will be different. Second, if the tightening in global policy does cause a financial accident, the dollar will catch one last major bid that could push EUR/USD toward 0.9. As a result, to mitigate the danger, we recommend setting a stop-buy in the euro at EUR/USD 0.965 or 2.6% below the breakdown level of 0.9904. This position comes with a stop-loss at 0.94. For now, we would view this bet as a tactical position if it were triggered. Bottom Line: While a hawkish FOMC is very positive for the dollar, markets now expect foreign central banks to catch up to some extent with the Fed. This process is dollar bearish. Additionally, while a global recession would be supportive of the greenback, the USD already discounts this scenario. Instead, Europe is proving surprisingly resilient, which could soon create a tailwind for EUR/USD. Set a stop-buy at EUR/USD 0.965, with a stop-loss at 0.94. Market Update: European Credit After Central Bank Week For investors concerned with the left-tail risk in European equities, European credit offers a credible alternative in the near term. This asset class is also attractive relative to European government bonds. Taken together, the Fed, the ECB, the BoE, the Riksbank, the Norges Bank, the SNB, and the BoC have tightened policy by 475bps over the past month (Chart 20). Moreover, the SNB’s hike closed the chapter of negative rates in Europe. But make no mistake – there will be a second chapter. Until then, European corporate bond yields have risen enough to offer attractive spreads over duration-matched government bonds and to challenge the earnings yield provided by equities (Chart 21). Besides, the volatility observed in equity markets over the past few months makes the European corporate bond more appealing. Chart 20Central Bank Week
Is Europe About To Be Crushed?
Is Europe About To Be Crushed?
Chart 21Push Back Against TINA Argument
Push Back Against TINA Argument
Push Back Against TINA Argument
In the Euro Area, BB-rated bonds, which are the highest credit quality and largest tranche within the high-yield space, are particularly attractive. They sport a 6.6% YTM, at a spread of 480bps over 3-year German government bond yields. This compares to an equity earnings yield of 7.4% (Chart 21, top panel). In other European corporate bond markets, there is no need to go down in credit quality. Yields-to-maturity for investment grade corporate bonds in the UK, Sweden, and Switzerland provide appealing alternatives to equities, with shorter duration still. This is especially true in Sweden, where the equity earnings yield has collapsed and is now only 60bps above Swedish IG yield, with substantially greater risk. Meanwhile, the spread pickup offered by Swiss IG over Swiss government bonds of similar duration is at its widest in more than ten years (Chart 21, bottom panel). Chart 22Heed The Message From OIS Curve Differentials
Heed The Message From OIS Curve Differentials
Heed The Message From OIS Curve Differentials
This week, we turn neutral on European credit versus US credit. Back in March, we made the case that European credit would outperform its US counterpart in response to a more hawkish Fed than the ECB. Since then, European IG outperformed US IG by 1% on a total return basis. However, with the Fed funds rate at 3.25%, traders now expect more monetary policy tightening from the ECB, which often corresponds to an underperformance of Euro Area credit relative to that of the US (Chart 22, top panel). On the other hand, Swedish IG is expected to outperform US IG over the next six months (Chart 22, bottom panel). Mathieu Savary, Chief European Strategist Mathieu@bcaresearch.com Jeremie Peloso, Editor/Strategist JeremieP@bcaresearch.com Tactical Recommendations Cyclical Recommendations Structural Recommendations
Executive Summary Central banks are aggressively tightening policy around the world. Their ability to rein in inflation without causing a recession depends upon the level of the real neutral rates. Australia, Canada, New Zealand, and Sweden have elevated r-stars, but the picture changes drastically when their large debt loads are factored in. While real policy rates remain below r-star across DM economies for now, a more rapid decline in supply-driven inflation would correct this situation. Consequently, a global recession does not constitute our base case for the next six months, although it is a growing threat. The ECB is front-loading interest rate increases while it can, but the destination of travel is not changing significantly. Global R-Star
Neutral Rates Around The World
Neutral Rates Around The World
Bottom Line: The global r-star varies greatly around the world and debt sustainability concerns weigh on the real neutral rates of Australia, Canada, New Zealand, and Sweden. The US economy remains best capable of handling higher interest rates. Chart 1Rising Global Inflation
Rising Global Inflation
Rising Global Inflation
Inflation around G10 economies has been very strong and much more durable than originally hoped. As a result, inflation now averages 7.1% on a headline CPI basis and 4.6% based on core CPI across among G10 economies (Chart 1). Central banks are tightening policy aggressively to prevent this elevated inflation from becoming entrenched. Essentially, they are aiming to avert the emergence of the kind of inflationary mentality that prevailed in the 1970s, which caused stubborn inflation during that decade. This exercise is fraught with difficulty. The objective is to achieve a policy setting that is slightly above the neutral rate of interest, but not too much so. On the one hand, keeping policy too accommodative will increase the chances that an inflationary mentality will emerge; on the other hand, if policy is tightened too much, a recession will become unavoidable and deflationary risks will escalate. A sense of where the neutral rate for major economies lies is therefore necessary to draw that line in the sand. To do so, we estimate the real neutral rate of interest for major DM economies using the methodology we introduced seven weeks ago, when we evaluated the neutral rates for the major Eurozone economies. This exercise shows that, at the current level of interest rates and inflation, policy among major economies remains accommodative. However, if inflation decelerates sharply in the coming months in response to declining global supply constraints and lower commodity prices, the recent increase in policy rates will have already gone a long way to normalizing monetary policy around the world. A Simple Approach The methodology we use is based on the approach developed by Holston, Laubach, and Williams (HLW) to estimate the neutral real interest rate – or “r-star.” Specifically, we run regressions between the real interest rates in the US, Japan, the UK, New Zealand, Canada, Australia, Sweden, and Switzerland versus trend GDP growth and current account balances, which approximate the savings-investment balance. Mimicking the HLW methodology, the inflation expectations used to extract real interest rates from nominal short rates reflect an adaptative framework whereby inflation expectations are a function of the ten-year moving average of core CPI.1 Table 1Unadjusted R-Stars
Neutral Rates Around The World
Neutral Rates Around The World
The results are shown in Table 1. New Zealand, Australia, and Canada have the highest real-neutral rate of the major economies. They have had stronger growth over the past 20 years because of their rapid population growth caused by high immigration rates. Moreover, their commodity-based economies and their booming construction sectors pushed up investment rates, which requires high interest rates to attract sufficient savings to finance. Sweden and the US follow. These two economies have lower population growth rates than the commodity producers; nonetheless, they outperform Japan and the other European nations in the survey on that dimension. Moreover, they fare comparatively well in terms of productivity growth, which implies that their trend growth – a key driver of the neutral rate – is also higher than that of the UK, Japan, Switzerland, or the Euro Area. The US’s r-star shows up as being slightly below what would be expected based on its potential GDP growth. This surprising outcome most likely reflects the role of the dollar in global FX reserves and its standing at the core of the global financial system. These two characteristics of the greenback create an important demand for dollar-denominated assets that is dissociated from US domestic economic fundamentals. This additional demand biases downward the US real neutral rate and suggests that weak trend growth abroad and global excess savings remain important forces for US financial markets. Chart 2Japan's Dissociated Real Rates
Japan's Dissociated Real Rates
Japan's Dissociated Real Rates
Japan displays a surprisingly elevated real neutral rate of 0.1%. This result reflects the limitation of the approach. Japanese interest rates have been at zero since the late 1990s and real rates have been negatively correlated with inflation because of this nominal rigidity (Chart 2). However, while Japanese inflation has averaged a paltry 0.2% since 1997, it has nonetheless fluctuated with commodity prices and global economic activity. As a result, real rates have been essentially dissociated from Japanese domestic drivers. Hence, an empirical approach based on the evolution of domestic economic variables yields poor results for Japan. Instead, the lack of inflation when public debt has increased by 200% of GDP over the past 32 years and Japan’s large net international investment position imply that its r-star is inferior to that of the other countries in the sample, and thus should lie below -1%. For the Eurozone, we use the average result of our July study, which estimated the neutral rates of Germany, France, Italy, and Spain independently. Germany flatters this estimate since its real neutral rate stands near 0%. An average, excluding Germany, would be closer to -0.5%, or well below the US r-star. Meanwhile, the Swiss r-star is depressed by both a low population growth and the Swiss exceptional savings generation, as highlighted by its current account surplus that has averaged 8% of GDP over the past 20 years. Finally, the UK’s r-star stands at the bottom of the pack. The UK’s productivity growth has been very poor over the past ten years, averaging 0.7% per annum. This points to a weak potential GDP for that economy. Moreover, the hurdles to UK growth have only increased in recent years with the implementation of Brexit, which is hurting the availability of labor in the country, while putting the UK at an even greater disadvantage in European markets, its largest export destination. What About Debt? This approach to estimating r-star ignores a key dimension: debt sustainability. If we factor in this crucial variable, the level of interest rates causing economic activity to decelerate changes drastically for many countries. Chart 3Massive Real Estates Bubbles
Massive Real Estates Bubbles
Massive Real Estates Bubbles
Since 2000, real estate prices have surged by 280%, 220%, 170%, and 200% in New Zealand, Canada, Australia, and Sweden, respectively. These gains dwarf the house price appreciation observed in the US, the UK, Japan, or Germany (Chart 3, top panel). This outperformance of house prices is particularly problematic because it does not reflect more rapid underlying cash-flow growth from the assets. Instead, the main driver of the stronger house prices in New Zealand, Canada, Australia, and Sweden has been the explosion of their price-to-rent and price-to-income ratios (Chart 3, bottom two panels). Rising real estate prices boosted economic activity relative to the underlying trend GDP of these countries. As a result, the long-term growth numbers of these four nations potentially overstate their underlying rate of growth. Even more importantly, real estate prices and activity are extremely sensitive to interest rates. Therefore, the risk of bursting bubbles in New Zealand, Canada, Australia, and Sweden limits how high interest rates may rise there without causing growth to plunge and deflationary spirals to emerge. Chart 4Rapidly Rising Debt Loads
Rapidly Rising Debt Loads
Rapidly Rising Debt Loads
The accumulation of debt in these four countries accentuates the threats to growth created by real estate activity. The private-sector debt of New Zealand, Canada, Australia, and Sweden has risen much more quickly than has been the case in Germany and the US (Chart 4). Ultimately, these debt burdens create major headwinds against higher interest rates and suggest that the effective r-star of these nations lies well below the estimates constructed using only trend growth and the savings/investment balance. Table 2Drastic Changes Once Debt Is Accounted For
Neutral Rates Around The World
Neutral Rates Around The World
To account for the private-sector leverage, we estimated new debt-adjusted r-stars. The impact of high debt loads on r-star estimates is evident in Table 2. The average real neutral rate of New Zealand, Australia, and Canada drops from 1.9% to -1.9%. In fact, Australia and Canada would sport the lowest r-star estimates of the nations under study. Sweden’s neutral rate also experienced a big decline from 0.6% to 0.2%. The US r-star estimate is also lowered by the addition of debt metrics in its equation, declining from 0.2% to -0.4%. The Eurozone average r-star experiences a significant decrease as well, driven mostly by Spain and France. The Swiss economy also sports a large private debt load, and its r-star is therefore curtailed from -0.75% to -1.3%. Finally, Japan’s r-star estimate barely changes, which confirms that the approach does not work well for that country. The greatest drawback of the method is that it is backward-looking. The main force that has brought down the global r-star over the past 20 years is the collapse in trend growth among most advanced economies (Chart 5). Consequently, neutral rates could improve from their current low levels if trend growth were to pick up in the coming years. On the positive side, the current age of the capital stock in both Europe and the US is extremely advanced (Chart 6), which suggests that a capex upturn is likely. Such an upturn would boost productivity and lift the r-star among most major economies. On the negative side, the growth of human capital is deteriorating as educational attainment stalls among most DM nations. The decline in the growth rate of human capital is a large threat to productivity over the coming decades. These problems are magnified in the Eurozone, as its high degree of economic fragmentation, lack of common fiscal policy, and higher regulatory burden create further handicaps to trend growth. Chart 5R-star And Global Growth
R-star and Global Growth
R-star and Global Growth
Chart 6A Capex Revival?
A Capex Revival?
A Capex Revival?
Bottom Line: Estimating the real neutral rates for the global economy often relies on trend growth and the savings/investment balance. However, such an approach often misses the vulnerability to higher interest rates created by high private-sector indebtedness. If this constraint is considered, the high r-star recorded in countries like New Zealand, Australia, or Canada is reduced dramatically. The US r-star also declines but significantly less so. As we already showed seven weeks ago, the same phenomenon is also visible in the Eurozone, albeit driven by France and Spain, not Germany or Italy. Investment Implications There are three main conclusions from the analysis above. First, the risk of a financial accident in commodity-producing economies is growing increasingly large. On the one hand, economies like New Zealand, Australia, and Canada are buoyed by the recent surge in commodity prices, with agricultural prices up 90% since their 2020 lows, metal prices up 68%, and energy prices up 340% since April 2020. On the other hand, the inflationary pressures created by robust commodity sectors invite the RBNZ, the RBA, and the BoC to lift interest rates quickly, which is hurting massively indebted private sectors. Already, in response to the 275bps and 300bps of hikes implemented by the RBNZ and the BoC, house prices in New Zealand have begun to buckle, down 12% and since their more recent peaks, and they are expected to plunge by as much as 25% in Canada by the end of next year. Chart 7NZD And CAD At A Disadvantage
Neutral Rates Around The World
Neutral Rates Around The World
This suggests that non-commodity equities in Canada, Australia, and New Zealand, especially financials, could experience significant periods of underperformance, both against their domestic equity benchmark and global market averages. Additionally, while the NZD, AUD, and CAD all benefit from improving terms of trades, the potential for domestic weakness is such that these currencies are likely to lag their historical sensitivity to commodity price fluctuations. In fact, according to BCA’s foreign exchange strategist, the New Zealand and Canadian dollars are among the most expensive currencies in the G10 (Chart 7), and thus, it is likely to underperform other pro-cyclical currencies once the USD bull market reverses. Second, the neutral rate in the US has risen by 200bps relative to the rest of the world over the past seven years. The US economy has undergone a long deleveraging period in the wake of the GFC, which means that its private-debt-to-GDP ratio has declined relative to other advanced economies. Consequently, the vulnerability of the US economy to higher interest rates has decreased, even if relative US trend growth has not improved meaningfully. The market implications of this pickup in the neutral rate are manifold. To begin with, it allows US rates to rise further relative to other DM economies. BCA’s Global Fixed Income Strategy team continues to underweight US Treasurys in global fixed-income portfolios, especially relative to German Bunds (Chart 8). As a corollary, it also means that US financials are likely to continue to outperform their foreign peers, especially Canadian and Australian ones which will bear the brunt of the negative consequences of their debt bubbles. The increase in the US r-star relative to the rest of the world has been a key contributor to the dollar rally. It helps explain why the recent dollar strength has not hurt relative profit growth (Chart 9). However, the dollar is trading at a 32% premium to its purchasing power parity, or the same overvaluation as in 1985 and 2001. Thus, with the worsening US balance of payment picture, the US dollar is vulnerable to an eventual improvement in global growth next year. Chart 8US Rate Differentials Have Upside
Neutral Rates Around The World
Neutral Rates Around The World
Chart 9The US Fares Better
The US Fares Better
The US Fares Better
Chart 10Easy Or Not?
Easy Or Not?
Easy Or Not?
Finally, despite the recent increase in rates, the high level of inflation recorded around the world implies that real policy rates are still well below r-star for major global economies, whether one uses actual inflation or the smooth formulation recommended by the HLW paper (Chart 10). This suggests that a recession is unlikely, especially in the US. The recession threat is higher in Europe but has little to do with policy. It is mostly a consequence of the massive terms of trade shock caused by the sudden jump in European energy prices in the wake of the Ukrainian war. However, because policy remains accommodative even in Europe, it follows that the Eurozone economy will rebound quickly once the worst of the energy shock is over next spring. Some humility is required. It is hard to gauge how much of the inflation surge over the past 18 months reflects supply factors. If inflation suddenly becomes much weaker because the easing in supply constraints has a greater-than-anticipated impact on inflation, real interest rates would jump rapidly around the world. In this scenario, policy rates could rise quickly and overtake r-star. This would mean that the disinflation impulse could rapidly morph into an outright deflationary environment, which implies that the odds of a deflationary bust like the one experienced in 1921 is greater than the market currently prices in. Bottom Line: The debt-fueled real estate bubbles in the dollar-bloc economies suggests that they are at a greater risk of a financial accident than the US or the Eurozone. As a result, their financial sector looks vulnerable. Meanwhile, the higher US r-star compared to that of the rest of the world will continue to support higher yields in the US rather than in Europe or Japan. This phenomenon has been hugely positive for the US dollar, but it has likely run its course. Finally, global real interest rates remain below r-star estimates. Hence, the current slowdown is likely to prove to be a mid-cycle slowdown and Europe will rebound quickly from a potential recession caused by the recent surge in its energy prices. The ECB Joins The 75bps Club Last week, the ECB increased interest rates by 75bps, which brought its deposit rate to 0.75%. Interestingly, the euro did not rally much in response to this policy decision, even though it has not been fully discounted by the market. At first glance, the lack of responsiveness from European assets seems strange, especially since the vote for a 75bps rate hike was unanimous. The ECB is taking advantage of strong economic numbers to push up rates rapidly. The Eurozone Q2 GDP growth was robust at 0.6%, while the unemployment rate hit an all-time low of 6.6%. Meanwhile, inflation continues to beat consensus forecasts, with Eurozone core CPI and headline CPI standing at 4.3% and 9.1%, respectively in August. Chart 11Big ECB Revisions
Big ECB Revisions
Big ECB Revisions
The market believes that more rapid interest rate hikes now will not translate into a much higher terminal rate, with the expected rates for June 2023 moving from 2.2% on September 7th to 2.4% after last Thursday’s decision. The ECB may have increased its inflation forecasts for the whole horizon, but it has also brought down GDP forecasts to 0.9% and 1.9% in 2023 and 2024, respectively (Chart 11). Moreover, ECB President Christine Lagarde went out of her way to telegraph to investors that the number of upcoming hikes was finite. The jumbo hike does not spell the start of a euro rally—for now. First, the lack of major change in the ECB’s terminal deposit rate is more important than the more rapid pace of hikes for the remainder of 2022. Second, the Fed is also lifting rates faster than investors expected ahead of the Jackson Hole meeting three weeks ago. Third, the euro remains vulnerable to any flare-ups in the energy market. True, natural gas and electricity prices have recently fallen, but the situation in Ukraine continues to be highly fluid, which suggests that volatility will linger in the energy market over the coming weeks. Despite the near-term hurdles, the euro’s medium-term outlook is brightening. We are gaining confidence in our thesis that energy prices will peak once natural gas inventories have reached approximately 90% by November. Additionally, the support of the Governing Council’s doves for a 75bps hike suggests that they received something in exchange for their votes. In our view, this “something” is an activation of the Transmission Protection Instrument (TPI) before year-end. The TPI activation will allow for a normalization of the risk premia in the Italian debt market and will support the ECB’s ability to increase interest rates further down the road, despite the much lower r-star in Italy, Spain, and France than in Germany (Table 3). Table 3The Eurozone’s Different R-Stars Will Force The TPI’s Activation
Neutral Rates Around The World
Neutral Rates Around The World
Bottom Line: The ECB may have delivered a jumbo hike last week, but its market impact was muted. Investors understand full well that the ECB is taking advantage of the recent bout of robust economic activity to front-load interest rate increases ahead of a likely economic contraction in Q4 2022 and Q1 2023. As a result, the terminal rate estimates have scarcely moved. Ultimately, we expect the ECB deposit rate to settle between 1.5% and 2% in the summer of 2023. While the move may not provide much of a boost to the euro in the near term, conditions are falling into place for a euro rally later this year. Mathieu Savary, Chief European Strategist Mathieu@bcaresearch.com Footnotes 1 For the US, we opted for core PCE, since it is the benchmark inflation measure the Federal Reserve uses.
Executive Summary Cheap But Challenged
Cheap But Challenged
Cheap But Challenged
European equities have bottomed in absolute terms, but they are still underperforming US ones. Eurozone equities are very cheap compared to US ones, but their profitability remains inferior. Five problems continue to hang over the relative performance of European stocks. The first problem is the Chinese and global growth outlook. The second problem is the natural gas crisis. The third problem is Europe’s expanding liquidity risk. The fourth problem is the weak euro. The fifth problem is Europe’s structural profitability weaknesses. Bottom Line: European stocks may be inexpensive, but too many problems are hanging over their profit outlook. As a result, European shares are unlikely to outperform until natural gas prices peak and the ECB activates the TPI. Until then, continue to underweight European stocks in global equity portfolios. European assets are on sale. Equities are trading at multigenerational lows against their US counterparts. Meanwhile, the euro is back below parity and embedding a 30% discount to purchasing power parity against the US dollar. These observations suggest that European stocks are very attractive relative to their US counterparts — but are they? Related Report European Investment StrategyQuestions From The Road On July 4, 2022, we turned positive on European stocks in absolute terms. Nonetheless, we expected US stocks to outperform because of their larger weighting toward defensive and growth names, which derive greater benefit from lower rates, especially when economic activity remains vulnerable. At this point, we maintain this stance. European valuations are appealing, but the entry point is still not right because the global environment continues to be hostile to the relative performance of European equities. Attractive Valuations Anyway you cut it, European stocks are much less expensive than their US counterparts. In theory, these attractive valuations imply higher long-term rates of return in European markets compared to US ones. Chart 1Cheap European Stocks
Cheap European Stocks
Cheap European Stocks
Based on the MSCI indices, the relative forward P/E ratio of Eurozone shares is 25% below that of US stocks, or the deepest discount in more than 20 years (Chart 1, top panel). European shares should naturally sport lower valuations than US ones due to sectoral biases. However, even when we adjust for those sectoral differences, European stocks stand out as exceptionally cheap. A P/E ratio calculated by giving equal weights to all the sectors in both Europe and the US reveals that, outside of the COVID-19 selloff, the European valuation discount has never been lower in the post-dotcom bubble era (Chart 1, bottom panel). Comparing individual sector performances to earnings reinforces that European stocks are uniquely inexpensive compared to US ones. Since 2018, the relative prices of most European sectors compared to their US competitors have underperformed relative earnings (Chart 2). Chart 2ABroad-based Cheapness
Broad-based Cheapness
Broad-based Cheapness
Chart 2BBroad-based Cheapness
Broad-based Cheapness
Broad-based Cheapness
The problem with valuations is that they can be misleading. If European earnings continue to underperform US ones, European equities are likely to underperform further. And, whether we adjust or not for sector composition, European earnings remain in a pronounced downtrend compared to US profits, which is driving relative performance (Chart 3). Perhaps there is hope for European earnings, but, in the short term, we doubt it. European earnings expectations have been downgraded already, with 2022 and 2023 earnings excluding the energy sector, already down 10% and 12% respectively since their February peak (Chart 4). However, five problems are likely to lead to a greater downgrade relative to the US in the coming months. They are the following: the Chinese and global growth difficulties, the energy market’s ructions, the European liquidity risk, the weakness in the euro, and Europe’s structural lack of profitability. Chart 3Earnings Are In The Driving Seat
Earnings Are In The Driving Seat
Earnings Are In The Driving Seat
Chart 4Downward Revisions Have Begun
Downward Revisions Have Begun
Downward Revisions Have Begun
Bottom Line: Compared to the US, European stocks are very cheap. However, European stocks will only begin to outperform once investors see reasons to upgrade European relative earnings. For now, too many problems continue to place Europe’s profit outlook at a disadvantage. Problem 1: Chinese And Global Growth Chart 5Europe Is More Cyclical than the US
Europe Is More Cyclical than the US
Europe Is More Cyclical than the US
The performance of European equities relative to that of US stocks tracks the evolution of the global manufacturing PMI (Chart 5). This makes sense. Europe’s economy and markets are more specialized in the manufacturing sector, whether consumer or capital goods. Consequently, European earnings are also more geared to the fluctuations of global industrial activity and Chinese imports. Today, China remains one of the major risks to European stocks. Despite efforts by Beijing to stabilize growth, the private sector continues to retrench. The zero-tolerance toward COVID creates a powerful brake on animal spirits as lockdowns shift from one city to the next. Most crucially, the real estate sectors’ woes show no end in sight. Floor spaces sold, started, and completed are contracting at double-digit paces and real estate investment is declining at a 12% annual rate (Chart 6 top and second panels). Moreover, the 47% annual contraction in land purchases indicates that the situation will not improve soon. Consequently, consumer loan growth will decelerate further (Chart 6, bottom panel). While authorities are trying to manage the economic slowdown, they are still too concerned with real estate speculation to push as aggressively as the Chinese economy needs. Even the recent 19-point package from the State Council came with a warning that, although “the foundation of economic recovery is not solid,” Beijing will avoid “resorting to massive stimulus or compromising longer-term interests.” In this context, it is likely that China’s marginal propensity to consume will remain weak, that Chinese yields will decline further, and that the CNY will experience additional weaknesses. All these developments are consistent with a deeper underperformance of European equities (Chart 7). Chart 6China's Real Estate Industry Is Sick
China's Real Estate Industry Is Sick
China's Real Estate Industry Is Sick
Chart 7Weak China = Weak Europe
Weak China = Weak Europe
Weak China = Weak Europe
Looking at the global economy offers little hope. A weak China weighs on EMs’ growth prospects. Moreover, the strong dollar invites EMs’ central banks to tighten domestic liquidity and financial conditions, which historically results in lower growth. This softer economic activity ultimately hurts European earnings more than US ones and causes Eurozone shares to underperform US ones (Chart 8). Beyond EMs, the leading indicators of global economic activity do not inspire much confidence either. Arthur Budaghyan, BCA’s Emerging Market chief strategist, often highlights the downside risk to global exports, which would generate an underperformance of European earnings relative to those of the US. In fact, Taiwanese export orders, which lead global exports, are contracting anew. So is the Global Leading Economic Indicator (Chart 9). Ultimately, the tightening in global policy rates is doing what it should do: slowing global growth. Chart 8EM FCIs Matter To Europe's Relative Performance
EM FCIs Matter To Europe's Relative Performance
EM FCIs Matter To Europe's Relative Performance
Chart 9Clouds Over The Global Economy
Clouds Over The Global Economy
Clouds Over The Global Economy
Bottom Line: The weakness in Chinese economic activity is not over yet. Global growth will also continue to suffer as global exports are set to weaken considerably in the coming months. Together, these forces will hurt the earnings prospects of Europe compared to the US. Problem 2: The Energy Market Chart 10Pricey Nat Gas And Electricity
Pricey Nat Gas And Electricity
Pricey Nat Gas And Electricity
Let’s be more specific here: natural gas continues to weigh more on Europe’s earnings prospects than those of the US. European natural gas prices have surged, even when compared to US ones. As a result, electricity prices have also increased across the Eurozone’s main economies (Chart 10). This is deeply negative for domestic economic activity and hurts the competitiveness of European businesses. Consequently, as long as natural gas prices climb higher, European profitability will deteriorate relative to that of US firms. Unsurprisingly, investors are deeply aware of these dynamics. The more natural gas prices rise, the greater European equities underperform. In fact, since mid-2021, Dutch natural gas prices have become the single best explanatory variable for the relative performance of European stocks (Chart 11). Natural gas is likely to remain a problem for European equities until the beginning of the winter. We are currently in the peak period of upward pressure on natural gas prices in Europe. Relentless inventory buildup introduced an inelastic buyer to the market, which is propelling natural gas prices to new heights even though consumption is receding (Chart 12, top panel). In response to these efforts, European natural gas inventories have hit 80% of capacity and are set to rise to 90% by November, even though Russian flows have collapsed (Chart 12, bottom two panels). However, in November, natural gas prices are likely to peak. The re-stocking effort will be completed, coal power will fill in many gaps, and selective conservation efforts will allow most industries and heating to function. Chart 11Europe vs US = Nat Gas
Europe vs US = Nat Gas
Europe vs US = Nat Gas
Chart 12The Worse Is Now
The Worse Is Now
The Worse Is Now
Bottom Line: The surge in natural gas prices is the key force currently hurting the relative performance of Eurozone equities. However, this negative dynamic is likely to fade in the winter because the current price jump reflects inventory building. By November, inventories will be at the 90% of capacity targeted by the European Commission and coal power will fill the remaining production gap. Until then, natural gas prices will continue to hurt European profit margins. Problem 3: European Liquidity Risk Chart 13Unhinged Credit Markets
Unhinged Credit Markets
Unhinged Credit Markets
European equities are also hurt by an increase in risk premia relative to the US. Italian spreads continue to show upside and European junk spreads are widening compared to US ones (Chart 13). This problem could remain saliant in the coming months. The ECB is tightening policy in an economy already fettered by a severe energy shock. This process increases risk aversion. Moreover, because European inflation is likely to prove more sticky than that of the US this fall, this development will continue to hurt the price of European assets compared to US ones. Chart 14A Key Vulnerability
A Key Vulnerability
A Key Vulnerability
The imbalances in the Euro Area create a further source of liquidity risk. The TARGET2 balances remain extremely large, which indicates that Dutch, Luxembourg, and German savings continue to finance France, Spain, and Italy (Chart 14, top panel). However, the import-boosting impact of high energy costs and the negative effects of weaker global growth on exports are likely to worsen the current account balance of the Eurozone, including that of Germany, which acts as the Eurozone’s banker (Chart 14, bottom panel). The decreasing savings of Germany and the Netherlands in conjunction with the wide difference in neutral rates between Germany and France, Italy and Spain increase the odds that peripheral spreads will widen further in the short term. However, this too is likely to be a temporary risk that ebbs after the winter. First, as we wrote four weeks ago, the differences in neutral rates will force the ECB to activate the TPI before year-end. Second, once energy prices peak, the downward pressure on European gross savings will also ease, which will restore liquidity conditions in European credit markets. Bottom Line: The combination of an ECB tightening policy in a weak economy as well as TARGET2 imbalances and declining savings increase the likelihood of a liquidity shortage in European debt markets. Tremors in the credit market would translate into further underperformance of European equities relative to US ones. Problem 4: The Weak Euro At first glance, the weak euro is positive for European equities since it subsidizes profitability. However, in a context in which costs of production are rising faster in Europe than in the US, this benefit is elusive. The weak euro is not translating into greater pricing power for European firms. The increase in producer prices supercharged by higher natural gas prices (among others) is not met by a commensurate rise in consumer prices. The same is true in the US, but to a much lesser extent; as a result, the ratio of CPI to PPI is declining in Europe relative to the US. Chart 15A Weak Euro Reflects Poor Pricing Power
A Weak Euro Reflects Poor Pricing Power
A Weak Euro Reflects Poor Pricing Power
This lack of pricing power is an important driver of the weakness in the euro. EUR/USD closely tracks the evolution of the CPI-to-PPI ratio in Europe relative to the US (Chart 15). This confirms that a weaker euro is not helping the relative performance of European shares because it indicates a problem with the comparative profitability of European businesses. It also implies that the euro will weaken as long as Dutch natural gas prices are rising (Chart 15, bottom panel). Historically, a weak euro is associated with underperforming European equities. At the most basic level, a depreciating euro arithmetically derails the common-currency performance of European shares. Moreover, because a falling euro is often linked to poor rates of return in the Euro Area, it corresponds to periods when investors prefer foreign shares to European ones. For now, we see a large left tail in short-term distributions of the EUR/USD’s returns, even if the long-term prospects of the euro are brighter. This also signifies that the euro will remain a hurdle for the relative performance of European shares in the coming weeks. Bottom Line: The lack of pricing power of European firms weighs on the profitability of Eurozone businesses compared to that of US ones and on the euro. As long as this problem persists, the euro will suffer, which implies additional weaknesses in the relative performance of European shares. Problem 5: Europe Structurally Poor Profitability Chart 16Europe's Structural Profitability Problem
Europe's Structural Profitability Problem
Europe's Structural Profitability Problem
Since 2008, the EPS of the Eurozone MSCI benchmark have collapsed 73% compared to those of the US index. Moreover, this fall has followed a nearly straight line. This poor performance reflects an underlying structural challenge to European profitability. Europe’s low profit growth follows poor returns on assets. At first glance, lower levels of stock repurchases explain some of the underperformance of European earnings. However, the lower propensity of European firms to conduct buybacks mirrors their poor profitability. As Chart 16 highlights, European firms have much lower RoEs, RoAs, profit margins, and asset utilization rates than their US counterparts. The low profitability of European shares is multifaceted. To a large degree, it corresponds to the Eurozone’s anemic growth, whereby nominal as well as real GDP per capita continue to lag those of the US (Chart 17). This weak per-capita GDP is a consequence of the meager underlying productivity of the Euro Area. Many elements cause Europe’s lower productivity growth. The two most obvious culprits are the region’s greater economic fragmentation and its heavier regulatory burden when compared to the US. But also, the return on investment is much lower in Europe (Chart 17, bottom panel). The lower European return on investment is more complex. A key driver is the greater degree of misallocated capital in Europe than in the US. Europe’s capital stocks, especially in the periphery, represents a much greater share of GDP than it does in the US (Chart 18). A larger capital stock increases the odds that some previous capex was misallocated. Moreover, the greater prevalence of small businesses in Europe compared to the US also increases the likelihood of redundant and misallocated capital. Poor capital allocation hurts investment returns and productivity. Chart 17Weak Growth = Weak ROI
Weak Growth = Weak ROI
Weak Growth = Weak ROI
Chart 18Too Much Capital
Too Much Capital
Too Much Capital
Another reason for Europe’s poor profitability has nothing to do with productivity and tepid growth. European industries are less concentrated than US ones (Chart 19). Lower concentration means higher competition between businesses, which erodes markups and returns on assets. Chart 19Smaller Profitability Moats In Europe
Too Early To Overweight Europe
Too Early To Overweight Europe
None of Europe’s structural weaknesses in relation to profitability has been addressed. Consequently, this drag on the relative performance of Euro Area equities remains firmly in place, which warrants a significant discount in European equity valuations relative to US ones. Bottom Line: The last problem for European shares is the structural under profitability of the Eurozone. Because of lower productivity, misallocated capital, and lower industry concentration, European firms offer permanently weaker returns on assets than US businesses. Their disadvantage remains unaddressed, which suggests that structural forces are unlikely to generate a re-rating of European shares any time soon. Investment Implications Conditions are still not supportive for an outperformance of European equities relative to US ones. European stocks may have already bottomed in absolute terms and they are very cheap compared to US shares, but Euro Area earnings are set to underperform further. European stocks cannot beat US stocks until most of the five headwinds impacting Europe come to pass. The deceleration in Chinese and global growth, the surge in Dutch natural gas prices, the growing liquidity risk in the Eurozone, the collapse of EUR/USD, and the structural impediments to European profitability are just too strong collectively to allow Europe’s attractive valuation to crystalize into immediate high returns. Nonetheless, we cannot be dogmatic. Before year-end, we expect three of these variables to become favorable for European stocks. Namely, we anticipate the natural gas crisis to reach its apex around November 2022, the ECB to activate the TPI, which will tackle the budding illiquidity in European credit markets, and the euro to bottom. Hence, we are in the late stage of this year’s underperformance of European equities. An opportunity to upgrade Europe is around the corner – we are just not there yet. Even after all the cyclical and short-term negatives ebb, one key hurdle for European stocks will remain intact: the structural under profitability. This force suggests that periods of outperformance of European stocks are likely to be short-lived and that, as long as the profitability gap remains open, the structural relative bear market in European stocks will persist. Bottom Line: It is still too early to overweight European equities. Euro Area stocks are much cheaper than their US counterparts, but too many headwinds continue to blow that are likely to weigh on relative performance. Only after European natural gas prices peak will Europe enjoy a period of outperformance. This is unlikely to happen until this winter. Mathieu Savary, Chief European Strategist Mathieu@bcaresearch.com Tactical Recommendations Cyclical Recommendations Structural Recommendations
Executive Summary Our negative view on the summer rally is coming to fruition, with equities falling back on the negative geopolitical, macro, and monetary environment. China is easing policy ahead of its full return to autocratic government this fall. Yet the Fourth Taiwan Strait Crisis has only just begun. Tensions can still deal nasty surprises to global investors. It is essential to verify that relations will thaw after the US midterm and Chinese party congress is critical. Russia continues to tighten energy supply as predicted. Ukraine’s counter-offensive is pushing back the time frame of a ceasefire deeper into next year. Putin may declare victory and quit while he is ahead – but Russia will not be forced to halt its invasion until commodity prices fall significantly. Sweden’s election will not interfere with its NATO bid; Australia’s new government will not re-engage with China; Malaysia’s election will be a positive catalyst; South Africa’s political risks are reawakening; Brazil’s risks are peaking; Turkey remains a leading candidate for a negative “black swan” event. China’s Confluence Of Domestic And Foreign Political Risk
China's Confluence Of Domestic And Foreign Political Risk
China's Confluence Of Domestic And Foreign Political Risk
Asset Initiation Date Return LONG GLOBAL DEFENSIVES / CYCLICALS EQUITIES 2022-01-20 17.4% Bottom Line: Investors should stay defensive in the short run until recession risks and geopolitical tensions abate. Feature Last week we visited clients across South Africa and discussed a broad range of global macro and geopolitical issues. In this month’s GeoRisk Update we relate some of the key points in the context of our market-based quantitative risk indicators. While we were traveling, US-Iran negotiations reached a critical phase. A deal is said to be “closer” but we remain pessimistic (we still give 40/60 odds of a deal). The important point for investors is that the supply side of global oil markets will remain tight even if a deal is somehow agreed, whereas it will get much tighter if a deal is not agreed. China’s rollout of 1 trillion yuan ($146 billion) in new fiscal stimulus and rate cuts (5 bps cut to 1-year Loan Prime Rate and 15 bps cut to 5-year LPR) is positive on the demand side and supports our key view in our 2022 annual outlook that China would ease policy ahead of the twentieth national party congress. However, it is still the case that China is not providing enough stimulus to generate a new cyclical rally. Second quarter US GDP growth was revised slightly upwards but was still negative. Russia tightened control of European energy, as expected, increasing the odds of a European recession. Europeans are getting squeezed by rising energy prices, rising interest rates, and weak external demand. China Eases Policy Ahead Of Return To Autocracy China is facing acute political risk in the short term but it is also delivering more stimulus to try to stabilize the economy ahead of the twentieth national party congress this fall (Chart 1). The People’s Bank of China cut the benchmark lending rate by (1-year LPR) by 5 basis points, while authorities unveiled fiscal spending worth 1 trillion renminbi. Chart 1China's Confluence Of Domestic And Foreign Political Risk
China's Confluence Of Domestic And Foreign Political Risk
China's Confluence Of Domestic And Foreign Political Risk
After the party congress, the regime is likely to “let 100 flowers bloom,” i.e. continue with a broad-based policy easing to secure the recovery from the Covid-19 shock. This will include loosening social restrictions and aggressive regulations against industrial sectors like the tech sector. It should also include some diplomatic improvements, especially with Europe. But it is only a short term (12-month) trend, not a long-term theme. Related Report Geopolitical StrategyRoulette With A Five-Shooter China’s return to autocratic government under General Secretary Xi Jinping is a new, negative, structural factor and is nearly complete. Xi is highly likely to secure another decade in power and promote his faction of Communist Party stalwarts and national security hawks. The period around the party congress will be uncertain and dangerous. The exact makeup of the next Politburo could bring some surprises but there is very little chance that Xi and his faction will fail to consolidate power. The nomination of an heir-apparent is possible but of limited significance since Xi will not step down anytime soon or in a regular, predictable manner. Larger stimulus combined with power consolidation could spur greater risk appetite around the world, as it would portend a stabilization of growth and policy continuity. However, China’s underlying problems are structural. The manufacturing and property bust can be delayed but not reversed. China’s foreign policy will continue to get more aggressive due to domestic vulnerability, prompting foreign protectionism, export controls, sanctions, saber-rattling, and the potential for military conflict. Bottom Line: Investors should use any rally in Chinese assets over the coming 12 months as an opportunity to sell and reduce exposure to China’s historic confluence of political and geopolitical risk. Fourth Taiwan Strait Crisis Only Beginning The Fourth Taiwan Strait Crisis has only just begun. The previous three crises ranged from four to nine months in duration. The current crisis cannot possibly abate until November at earliest. Taiwan’s political risk will stay high and we would not buy any relief rally until there is a firm basis for believing tensions have fallen (Chart 2). Chart 2Taiwan: The Fourth Taiwan Strait Crisis
Taiwan: The Fourth Taiwan Strait Crisis
Taiwan: The Fourth Taiwan Strait Crisis
If this year’s crisis were driven by US and Chinese domestic politics – the US midterm election and China’s party congress – then both Presidents Biden and Xi Jinping would already have achieved what they want and could proceed to de-escalate tensions by the end of the year – i.e. before somebody really gets hurt. The two leaders could hold a bilateral summit in Asia in November and agree to uphold the one China policy and status quo in the Taiwan Strait. We have given a 40% chance to this scenario, though we would still remain pessimistic about the long-term outlook for Taiwan. But if this year’s crisis is driven by a change in US and Chinese strategic thinking as a result of Russia’s invasion of Ukraine and China’s rising domestic instability, then there will not be a quick resolution on Taiwan. The crisis would grow next year, increasing the risk of aggression or miscalculation. We have given a 60% probability to this scenario, of which full-scale war comprises 20 percentage points. Bottom Line: Our geopolitical risk indicator for Taiwan spiked and Taiwanese equities rolled over relative to global equities as we expected. However, our oldest trade to capture the high long-term risk of a war in the strait – long Korea / short Taiwan – has performed badly despite the crisis. South Korea: China Stimulus A Boon But Not Geopolitics US-China rivalry – and the thawing of Asia’s once-frozen conflicts – is also manifest on the Korean peninsula, where the limited détente between the US and North Korea negotiated by President Donald Trump and Kim Jong Un has fallen apart. South Korea’s situation is not as risky as Taiwan’s but it is nevertheless less stable than it appears (Chart 3). Chart 3South Korea: Lower Geopolitical Risk Than Taiwan
South Korea: Lower Geopolitical Risk Than Taiwan
South Korea: Lower Geopolitical Risk Than Taiwan
South Korea resumed its full-scale joint military exercise with the US, the Ulchi Freedom Shield, from August 22 to September 1. The drills involve amphibious operations and a carrier strike group. Full-scale drills were scaled down or cancelled under the Trump and Moon Jae-In administrations with the hopes of facilitating diplomacy and reducing tensions on the peninsula. North Korea was to discontinue ballistic missile tests and threats to the United States. But after the 2020 election neither Washington nor Pyongyang considered itself bound by this agreement. This year the US went forward with Ulchi Freedom even though regional tensions were sky-high because of House Speaker Nancy Pelosi’s visit to Taiwan and the De-Militarized Zone in Korea. The US is flagging its regional interests and power bases. North Korea is increasing the frequency of missile tests this year and is likely to conduct an eighth nuclear test. On August 17, it fired two cruise missiles towards the Yellow Sea. Pyongyang does not want to be ignored amid so many other geopolitical crises. It is emboldened by the fact that Russia and China will not be voting with the US for another round of sanctions at the United Nations Security Council due to the war in Ukraine and tensions over Taiwan. On August 11, South Korea responded to China’s insistence that the new government should abide by the “Three No’s,” i.e. three negatives that the Moon administration allegedly promised China: no additional deployments of the US’s Terminal High-Altitude Area Defense (THAAD) system, no Korean integration into US-led missile defense, and no trilateral military alliance with the US and Japan. Korea’s Foreign Minister Park Jin told reporters upon his return from China that the three no’s were “neither an agreement nor a promise.” South Korea’s new and conservative President Yoon Suk-yeol is unpopular and gridlocked at home but he is using the opportunity to reassert Korean national interests, including the US military alliance. Tension with the North and cold relations with China are coming at a time when the economy is slowing down. Korean GDP grew by 0.7% in Q2 2022 on a quarter-on-quarter basis, supported by household and government spending, while exports and investments shrank. Roughly a quarter of Korean exports go to China, its biggest trading partner. Korean exports to China have suffered due to China’s economic woes but cold relations could bring new economic sanctions, as China has hit South Korea before over THAAD. With the Yoon administration planning to bring the fiscal deficit back to below 3% of GDP next year, and a broader backdrop of weak Chinese and global demand, it is hard to find bright corners in the Korean economy in the near term. With Yoon’s basement level approval rating, he will resort to foreign policy to try to revive his political capital. Saber rattling and tough talk with North Korea and China will increase tensions in an already hot region – geopolitical risk is bound to stay high on the back of the Taiwan crisis. Bottom Line: On a relative basis, due to the ironclad US security guarantee, South Korea is safer than Taiwan. Investors wanting exposure to Chinese economic stimulus, electric vehicles, and semiconductors should go long South Korea. But some volatility is likely because the North’s eighth nuclear test will occur in the context of high and rising regional tensions. Australia: Stimulus Is Positive But No “Thaw” With China Australia is blessed with strong geopolitical fundamentals but it is seeing a drop in national security and economic security due to the deterioration of China relations. Domestic political turmoil is one of the consequences (Chart 4). Most recently Australia has been roiled by the revelation that former Prime Minister Scott Morrison secretly ran five ministries during the pandemic: the ministries of Home, Treasury, Finance, Resources, and Health. Chart 4Australian Geopolitical Risk Limited
Australian Geopolitical Risk Limited
Australian Geopolitical Risk Limited
After an investigation and review by the Solicitor General Stephen Donaghue, Morrison’s action was determined to be legal, although highly inappropriate and inconsistent with the principles of responsible governance. Morrison’s appointments to these ministries were approved by the Governor General but the announcement or publication of appointments has always been the prerogative of the government of the day. One might think that this investigation is merely politically motivated but the Solicitor General is an apolitical position unlike the Attorney General, and Donaghue had been serving with Morrison, guiding him about the constitutionality of a vaccine mandate during the pandemic. The new Labor Party government of Prime Minister Anthony Albanese has vowed to be more transparent and will seek to enshrine a transparency measure into the law. Its political capital will improve, which is helpful for its ability to achieve its chief election promises. With the change of the government, it was hoped that there would be a thaw in the Australia-China relationship. China is Australia’s largest export destination and it erected boycotts against certain Australian exports in 2020 in response to Prime Minister Morrison’s inquiry into the origin of Covid-19. Hence Australia’s new defense minister, Richard Marles, met with his Chinese counterpart, General Wei Fenghe, on the sideline of the Shangri-La Dialogue in Singapore in June, which rekindled the hope that a thaw might happen. Yet a thaw is unlikely for strategic reasons, as highlighted by the Fourth Taiwan Strait Crisis, the Biden administration’s retention of former President Trump’s tariffs, and Australia’s fears of China’s rising influence in the Pacific Islands. The US and Australia are preparing for a long-term policy of containing China’s ambitions. A few days after his election, Prime Minister Albanese flew to Tokyo to attend a meeting of the Quadrilateral Security Dialogue (the Quad), sending a signal that there will be policy continuity with respect to Australian foreign policy. On May 26, Chinese fighter jets flew closely to an Australian surveillance plane on its routine operation and released aluminum chaffs that were ingested by the P8’s engines. An Australian warship, the HMAS Parramatta, was tracked by a People’s Liberation Army nuclear power submarine and multiple aircrafts on its way back from Vietnam, Korea, and Japan as part of its regional presence deployment in June. Currently Australia is hosting the Pitch-Black military exercise, with 17 countries participating. This exercise will last for three weeks – focusing on air defense and aerial refueling. It will also see the German air force with 13 military aircrafts deployed to the Indo-Pacific region for the very first time. They will be stopping in Japan after the exercise. As Australia’s policy towards China is unlikely to change, geopolitical risk will remain elevated. On the economic front, Australia’s misery index is at the highest point since 2000, with an unemployment rate at 3% and inflation at 6%. GDP growth in the first quarter was 0.8% compared to 3.6% in Q4 2021, propped up by government and household consumption while investment and exports contracted. The good news for the government is that it is inheriting this negative backdrop and can benefit from cyclical improvements in the next few years. Since the Labor government lacks a single-party majority in the Senate (where it must rely on the Greens and independents), it will be difficult for the government to raise new taxes. So far, Albanese has indicated that the budget to be tabled in October will focus on pre-election promises, which includes childcare, healthcare, and energy reforms. At worst, Australian government spending will stay flat, but it is unlikely to shrink considering Labor’s narrow control of the House of Representatives. Australian equities have not outperformed those of developed market peers despite high industrial metal prices. The stock market’s weak performance is attributable to the stumbling Chinese economy (Chart 5). Australian exports to China in June are still down 14% from June of last year. Chinese economic woes will be a headwind to Aussie growth and equity markets until next year, when Chinese stimulus efforts reach their full effect. Chart 5Australian Equities Have Yet to Benefit from Industrial Metal Prices
Australian Equities Have Yet to Benefit from Industrial Metal Prices
Australian Equities Have Yet to Benefit from Industrial Metal Prices
On the other hand, the value of Australian natural gas and oil exports in June grew by 118% and 211% respectively (Chart 6), compared to June of last year. Chart 6Geopolitics: A Boon and Bane to Aussie Growth
Geopolitics: A Boon and Bane to Aussie Growth
Geopolitics: A Boon and Bane to Aussie Growth
Bottom Line: As China will continue stimulating the economy and global energy markets will remain tight, investors should look for opportunities in Aussie energy and materials stocks. Malaysia Closes A Chapter … And Opens A Better One? Rarely do we get to revisit our positive outlook on Malaysia – a Southeast Asian state with an ability to capitalize on the US break-up with China. On August 23, the embattled ex-prime minister of Malaysia, Najib Razak, lost his final appeal at the Federal Court in Putrajaya after being found guilty in 2020 for abuse of power, criminal breach of trust, and money laundering tied to Malaysia’s sovereign wealth fund, 1MDB. The high court instructed that he serves his 12-years prison sentence immediately, becoming the first prime minister to be imprisoned in the country’s 60-years plus of history. Political risk has weighed on the Malaysian economy for almost a decade starting with the contentious 2013 general election, which saw the collapse of non-Malay voter support for the ruling party. Then came the 2015 Wall Street Journal bombshell about 1MDB, and then the 2018 general election that resulted in Malaysia’s first change of government since independence. The pandemic also led to political crisis in 2020. Each crisis resulted in a successive weakening of animal spirits and ever lower investments, resulting in Malaysia’s loss of competitiveness (Chart 7). Malaysia’s cheap currency was unable to increase its competitiveness, due to the low investments in the economy, and reflected higher political risks in the country (Chart 8). Chart 7Political Risk Undermines Competitiveness
Political Risk Undermines Competitiveness
Political Risk Undermines Competitiveness
Chart 8Cheap Currency Reflects Political Risk
Cheap Currency Reflects Political Risk
Cheap Currency Reflects Political Risk
Nonetheless this entire saga has proved that Malaysia’s legal system is independent and that its political system is capable of holding policymakers accountable. The next general election will come in a matter of months and recent state elections bodes well for the institutional ruling party, the United Malay National Organization (UMNO), and its coalition, Barisan Nasional. The coalition is managing to claw back support from the Malay and non-Malay voters. The opposition had the bad luck of ruling during the pandemic and its rocky aftermath, which has helped to rehabilitate the traditional ruling party. We have long seen Malaysia as a potential opportunity. But we would advise investors to wait until the new election is held and a new government takes power before buying Malaysian equities. With the conclusion of its decade-long 1MDB saga, we would turn more bullish if the next election produces a sizeable and enduring majority, if the use of racial and sectarian rhetoric tones down, and if the governing coalition pursues pro-competitiveness policies. Bottom Line: Structurally, Malaysia is one of the largest exporters of semiconductors and will benefit from the US’s shift away from China and attempt to reconstruct supply chains so they run through the economies of allies and partners. Russia: Escalating To De-Escalate? Russia increased the number of active military personnel in a move that points to an escalation of the conflict with Ukraine and the West, even as Ukraine wages a counter-offensive against Russia in Crimea and elsewhere. The time frame for a ceasefire has been pushed further into next year. As long as the war escalates, European energy relief will be elusive. Our risk indicators will rise again (Chart 9). Chart 9Russia: Geopolitical Risk To Rise Again, Ceasefire Pushed Back Into Next Year
Russia: Geopolitical Risk To Rise Again, Ceasefire Pushed Back Into Next Year
Russia: Geopolitical Risk To Rise Again, Ceasefire Pushed Back Into Next Year
Ukraine will not be able to drive Russians out of territory in which they are entrenched. It would need a coalition of western powers willing to go on the offense, which will not happen. Russia is also threatening to cut off the Zaporizhzhia nuclear power plant, ostensibly removing one-fifth of Ukraine’s electricity. Once the Ukrainian counter-offensive grinds to a halt, a stalemate will ensue, incentivizing ceasefire talks – but not until then. The Europeans will have to support Ukraine now but will become less and less inclined to extend the war as they get hit with recession. Russia says it is prepared for a long war but that kind of rhetoric is necessary for propaganda purposes. The truth is that Russia does not have great success with offensive wars. Russia usually suffers social instability in the aftermath. The best indicator for the duration of the war is probably the global oil price: If it collapses for any reason then Russia’s war machine will fall short of funds and the Kremlin will probably have to accept a ceasefire. This what happened in 2014-15 with the Minsk Protocols. Putin will presumably try to quit while he is ahead, i.e. complete the conquest and shift to ceasefire talks, while commodity prices are still supportive and Europe is economically weak. If commodity prices fall, Russia’s treasury dries up while Europe regains strength. So while military setbacks can delay a ceasefire, Russia should be seen as starting to move in that direction. The deal negotiated with Turkey and the United Nations to ship some grain from Odessa is not reliable in the short run but does show the potential for future negotiations. However, a high conviction on the timing is not warranted. Also, the US and Russia could enter a standoff over the US role in the war, or NATO enlargement, at any moment, especially ahead of the US midterm election. Bottom Line: Ukraine’s counteroffensive and Russia’s tightening of natural gas exports increases the risk to global stability and economic growth in the short run, even if it is a case of “escalating tensions in order to de-escalate” later when ceasefire talks begin. Italy: Election Means Pragmatism Toward Russia Italy’s election is the first large crack in the European wall as a result of Russia’s cutoff of energy. The party best positioned for the election – the right-wing, anti-establishment party called the Brothers of Italy – will have to focus on rebooting Italy’s economy once in power. This will require pragmatism toward Russian and its natural gas. Regardless of whether a right-wing coalition obtains a majority or the parliament is hung, Italian political risk will stay high in the short run (Chart 10). Chart 10Italy: Election Brings Uncertainty, Then Economic Stimulus
Italy: Election Brings Uncertainty, Then Economic Stimulus
Italy: Election Brings Uncertainty, Then Economic Stimulus
Although the center-left Democratic Party (PD) is narrowing the gap with the Brothers of Italy in voting intentions, it is struggling to put together an effective front against the right-wing bloc. After its alliance with the centrist Azione party and +Europa party broke down, PD’s chance of winning has become even slimmer. Even if the alliance revives, the center-left bloc still falls short of the conservative parties. Together, the right-wing parties account for just 33% of voting intentions (Democrats at 23%, Greens and Left Alliance at 3%, Azione and +Europa at 7%). By contrast, the right-wing bloc has a significant lead, with 46% of the votes (Brothers of Italy at 24%, Lega at 14%, Forza Italia at 8%). They also have the advantage of anti-incumbency sentiment amid a negative economic backdrop. Unless some sudden surprises occur, a right-wing victory is expected, with Giorgia Meloni becoming the first female prime minister in Italy’s history. This has been our base case scenario for the past several months. But what does a right-wing government mean for the financial markets? In an early election manifesto published in recent weeks, the conservative alliance pledged full adhesion to EU solidarity and dropped their previous euroskepticism. This helps them get elected and is positive for investors. However, there are also clouds on the horizon: In the same manifesto, the right-wing parties pledged to lower taxes for families and firms, increase welfare, and crack down on immigration. These programs will add to Italy’s huge debt pile and eventually lead to conflicts with the ECB and other EU institutions. In the manifesto, they stated that if elected, they would seek to amend conditions of Italy’s entitlement to the EU Recovery Fund, as the Russia-Ukraine war has changed the context and priorities significantly. This could potentially put the EU’s grants and cheap loans at risk. Under the Draghi government, Italy has secured about 67 billion euros of EU funds. According to the schedule, Italy will receive a further 19 billion Euros recovery funds in the second half of 2022, if it meets previously agreed upon targets. The new government will try to accept the funds and then make any controversial policy changes. On Russia, the conservative parties claimed that Italy would not be the weak link within EU. They pledged respect for NATO commitments, including increasing defense spending. Both Meloni and her Brothers of Italy have endorsed sending weapons to support Ukraine. Still, we think that due to Italy’s historical link with Russia and the need to secure energy supplies, the new government would be more pragmatic toward Russia. On China, Meloni has stressed that Italy will look to limit China’s economic expansion if the right-wing alliance wins. She stated that “Russia is louder at present and China is quieter, but [China’s] penetration is reaching everywhere.” China will want to use diplomacy to curb this kind of thinking in Europe. Meloni also stated that she would not seek to pursue the Belt and Road Initiative pact that Italy signed with China in 2019. In short, we stand firm on our recommendation of underweighting Italian assets at least until a new government is formed. Europe Gets Its Arm Twisted Further The United Kingdom is going through a severe energy, water, and inflation crisis – on top of the long backlog at the National Health Service – as it stumbles through the aftermath of Covid-19 and Brexit. The Conservative Party’s leadership contest is a distraction – political risk will not subside after it is resolved. The new Tory leader will lack a direct popular mandate but the party will want to avoid an early election in the current economic context, creating instability. The looming attempt at a second Scottish independence referendum will also keep risks high, as the outcome this time may be too close to call (Chart 11). Chart 11UK: Tory Leaders A Sideshow, Risks Will Stay High
UK: Tory Leaders A Sideshow, Risks Will Stay High
UK: Tory Leaders A Sideshow, Risks Will Stay High
Germany saw Russia halt natural gas flows through Nord Stream 1 as the great energy cutoff continues. As we have argued since April, Russia’s purpose is to pressure the European economies so that they are more conducive to a ceasefire in Ukraine. Germany will evolve quickly and will improve its energy security faster than many skeptics expect but it cannot do it in a single year. The ruling coalition is also fragile, even though elections are not due anytime soon (Chart 12). Chart 12Germany: Geopolitical Risk Still Rising
Germany: Geopolitical Risk Still Rising
Germany: Geopolitical Risk Still Rising
France’s political risk will also remain high (Chart 13), as domestic politics will be reckless while President Emmanuel Macron and his allies only control 43% of the National Assembly in the aftermath of this year’s election (Chart 14). Chart 13France: Lower Geopolitical Risk Than Germany
France: Lower Geopolitical Risk Than Germany
France: Lower Geopolitical Risk Than Germany
Chart 14Macron Will Focus On Foreign Policy
Odds And Ends (A GeoRisk Update)
Odds And Ends (A GeoRisk Update)
Spain is likely to see its coalition destabilized and early elections, much like Italy this year (Chart 15). Chart 15Spain: Early Elections Likely
Spain: Early Elections Likely
Spain: Early Elections Likely
Sweden, along with Finland, will be joining NATO, which became clear back in April. In this sense it is at the center of Russia’s conflict with the West over NATO enlargement, so we should take a quick look at the Swedish general election on September 11. Currently the left-wing and right-wing blocs are neck and neck in the polls. While the current Social Democrat-led government may well fall from power, Sweden’s new pursuit of NATO membership is unlikely to change. The right-wing parties in Sweden are in favor of joining NATO. The two parties that oppose NATO membership are the left-wing Green and Left Party. The Social Democrats were pro-neutrality until the invasion of Ukraine and since May have spearheaded Swedish accession to NATO. The pro-neutrality bloc currently holds 43 seats in the 349-seats Riksdag. It has a supply-and-confidence arrangement with the current government and is currently polling at 13%. If it was willing and able to derail Sweden’s NATO bid, it would already have happened. So the general election in Sweden is unlikely to stop Sweden from joining. However, Russia does not want Sweden to join and the entire pre- and post-election period is ripe for “black swan” risks and negative surprises. One thing that could change with the election is Sweden’s immigration policy. The Social Democrats are pro-immigration (albeit pro-integration), while the right-wing bloc is less so. Sweden has received a great many asylum seekers since the Syrian refugee crisis in 2015 and will be receiving more from Ukraine and Russia (Chart 16). Chart 16Asylum Seekers to Surpass 2015 Refugee Crisis
Asylum Seekers to Surpass 2015 Refugee Crisis
Asylum Seekers to Surpass 2015 Refugee Crisis
Our Foreign Exchange Strategist Chester Ntonifor points out that the increase in asylum seekers could augment Swedish labor force and increase its potential growth in the long run, while in the short run it could increase demand in the domestic economy. But an increase in demand could also exacerbate inflation in Sweden, especially considering how much the Riksbank is behind the curve vis-à-vis the ECB. Our European Investment Strategy recommends shorting EUR/SEK as Sweden is less vulnerable to Russian energy sanctions. Sweden produces most of its energy from renewable sources. Relative to Europe, Canada faces a much more benign political and geopolitical environment (Chart 17). However, within its own context, it will continue to see more contentious domestic politics as interest rates rise on a society with high household debt and property prices. The post-Covid-19 period will undermine the Justin Trudeau government over time, though it is not facing an election anytime soon. Canada continues to benefit from North America’s geopolitical advantage, though quarrels with China will continue, including over Taiwan, and should be taken seriously. Aside from any China shocks we expect Canadian equities to continue to outperform most global bourses. Chart 17Canada: Low Geopolitical Risk But Not Happy
Canada: Low Geopolitical Risk But Not Happy
Canada: Low Geopolitical Risk But Not Happy
South Africa: The Calm Before The Storm South Africa’s economy remains in a low growth trap, which is contributing to rising political risk (Chart 18). Electricity shortages continue to dampen economic activity. Other structural issues like 33.9% unemployment, worsening social imbalances, and a split in the ruling party threaten to cause negative policy surprises. Chart 18South Africa: Institutional Ruling Party At Risk
South Africa: Institutional Ruling Party At Risk
South Africa: Institutional Ruling Party At Risk
The South African economy has failed to translate growth outcomes into meaningful economic development, leaving low-income households (the median voter) increasingly disenfranchised, burdened, and constrained. Last year’s civil unrest was fueled by economic hardships that persist today. Without a significant and consistent bump to growth, social and political risks will continue to rise. Low-income households remain largely state dependent. Fiscal austerity has already begun to unwind, well before the 2024 election, in a bid to shore up support and quell rising social pressures (Chart 19). Chart 19South Africa: Fiscal Easing Ahead Of 2024 Vote
South Africa: Fiscal Easing Ahead Of 2024 Vote
South Africa: Fiscal Easing Ahead Of 2024 Vote
The fact that the social scene is relatively quiet for now should not be seen as a sign of underlying stability. For example, two of the largest trade unions led a nationwide labor strike last week – while we visited clients in the country! – but failed to “shut down” the country as advertised. Labor union constituents noted the ANC’s economic failures, demanded immediate economic reform, and advocated for a universal basic income grant. This action blew over but the election cycle is only just beginning. Looking forward to the election, President Cyril Ramaphosa’s ANC is still viewed more favorably than the faction led by ex-President Jacob Zuma, but Ramaphosa has suffered from corruption allegations recently that have detracted attention from his anti-corruption and reform agenda and highlighted the party’s shortcomings once again. The ANC’s true political rival, the far-left Economic Freedom Fighters (EFF), have so far failed to capitalize on the weak economic backdrop. The EFF is struggling with leadership battles, thus failing to attract as many soured ANC voters as otherwise possible. If the Economic Freedom Fighters refocus and install new leadership, namely a leader that better reflects the tribal composition of the country, the party will become a greater threat to the ANC. But the overall macro backdrop is a powerful headwind for the ANC’s ability to retain a parliamentary majority. Global macro tailwinds that supported local assets in the first half of the year are experiencing volatility due to China’s sluggish growth and now stimulus efforts. Cooling metals prices and slowing global growth have weighed on the rand and local equity returns. But now China is enacting more stimulus. China is South Africa’s largest trading partner, so the decision to ease policy is positive for next year, even though China’s underlying structural impediments will return in subsequent years. This makes it hard to predict whether South Africa’s economic context will be stable in the lead-up to the 2024 election. As long as China can at least stabilize in the post-pandemic environment in 2023, the ANC will not face as negative of a macro environment in 2024 as would otherwise be the case. Investors will need to watch the risk of political influence on the central bank. Recently the ANC resolved to nationalize the central bank. Nationalization is mostly about official ownership but a change in the bank’s mandate was also discussed. However, to change the bank’s mandate from an inflation target to an unemployment target, the ANC would need to change the constitution. Constitutional change requires a two-thirds vote in parliament, a margin the ANC does not hold. Constitutional change will become increasingly difficult if the ANC sheds more support in the 2024 general election, as expected. Bottom Line: Stay neutral on South Africa until global and Chinese growth stabilize. Political risk is rising ahead of the 2024 election but it is not necessarily at a tipping point. Brazil And Turkey: Election Uncertainty Prevails We conclude with two brief points on Brazil and Turkey, which both face important elections – Brazil immediately and Turkey by June 2023. Both countries have experienced different forms of instability as emerging middle classes face economic disappointment, which has led to political challenges to liberal democracy. Brazil – President Jair Bolsonaro’s popular support is rallying into the election, as expected, but it would require a large unexpected shift to knock former President Lula da Silva off course for re-election this October (Chart 20). Brazil’s first round vote will be held on October 2. If Lula falls short of the 50% majority threshold, then a second round will be held on October 30. Bolsonaro faces an uphill battle because his general popularity is weak – his support among prospective voters stands at 35% compared to Lula at 44% today and Lula at 47% when he left office in 2010. Meanwhile the macroeconomic backdrop has worsened over the course of his four-year term. Bolsonaro will contest the election if it is close so Brazil could face significant upheaval in the short run. Chart 20Brazil: Risk Will Peak Around The Election
Brazil: Risk Will Peak Around The Election
Brazil: Risk Will Peak Around The Election
Turkey – President Recep Erdogan’s approval rating has fallen to 41%, while his disapproval has risen to 54%. It is a wonder his ratings did not collapse sooner given that the misery index is reaching 88%, with headline inflation at 78%. Having altered the constitution to take on greater presidential powers, Erdogan will do whatever it takes to stay in power, but the tide of public opinion is shifting and his Justice and Development Party is suffering from 21 years in power. Erdogan could interfere with NATO enlargement, the EU, Syria and refugees, Greece and Cyprus, North Africa and Libya, or Israel in a way that causes negative surprises for Turkish or even global investors. Turkey will be a source of “black swan” risks at least until after the general election slated for June 2023 (Chart 21). Chart 21Turkey: A Source Of 'Black Swans'
Turkey: A Source Of 'Black Swans'
Turkey: A Source Of 'Black Swans'
We will revisit each these markets in greater detail soon. Matt Gertken Chief Geopolitical Strategist mattg@bcaresearch.com Jesse Anak Kuri Associate Editor Jesse.Kuri@bcaresearch.com Guy Russell Senior Analyst GuyR@bcaresearch.com Yushu Ma Research Analyst yushu.ma@bcaresearch.com Strategic Themes Open Tactical Positions (0-6 Months) Open Cyclical Recommendations (6-18 Months) Regional Geopolitical Risk Matrix Geopolitical Calendar
Executive Summary Russia’s Crude Oil Output Will Fall
EU Russian Oil Embargoes, Higher Prices
EU Russian Oil Embargoes, Higher Prices
Russia will have to lower oil production to ensure output it hasn’t placed with non-EU buyers does not tax its limited storage facilities, ahead of the bloc’s December 5 embargo. The EU’s insurance/reinsurance ban on ships carrying Russian material also commences in December. It will profoundly affect Russian output, if fully implemented. Russian and Chinese firms will expand ship-to-ship transfers on the high seas, along with external processing and storage services to mask crude and product exports. The EU embargos will force Russia to shut in ~ 1.6mm b/d of output by year-end, rising to 2mm b/d in 2023, by our reckoning. Gas-to-oil switching in Europe will boost distillate and residual fuel demand by ~ 800K b/d this winter. Chinese policymakers will be compelled to deploy greater fiscal and credit support to reverse weakening GDP. Tighter monetary policy in DM economies will dampen aggregate demand. Bottom Line: EU embargoes on Russian oil imports will significantly tighten markets, and lift Brent to $119/bbl by year-end. This has a 60% chance of being offset by ~ 1mm b/d of Iranian oil exports in 2023, in our estimation. We are maintaining our Brent forecast at $110/bbl on average for this year, and $117/bbl next year. WTI will trade $3-$5/bbl lower. At tonight’s close we are re-establishing our long COMT ETF position. Risks remain to the upside. Feature Chart 1Russia’s Crude Oil Output Will Fall
EU Russian Oil Embargoes, Higher Prices
EU Russian Oil Embargoes, Higher Prices
Following an unexpected increase in production during June and July, Russia will have to begin reducing its oil output ahead of the implementation of the EU’s embargo on its seaborne crude oil imports, which kicks on December 5. EU, UK and US shipping insurance and reinsurance sanctions also are scheduled to be implemented in December. If fully implemented, ~ 2.3mm b/d of seaborne imports of Russian crude oil will be excluded from EU markets by year-end. Come February, another 800k b/d of refined products will be embargoed. On the back of these lost sales, and production that cannot be loaded on ships due to insurance/reinsurance bans, we expect Russian production to fall ~ 2mm b/d by the end of next year (Chart 1).1 As noted in previous research, a goodly chunk of Russian crude continues to go to China and India. Together, these two states accounted for just over 40% of Russia’s crude sales last month – ~ 1.9mm b/d of a total of ~ 4.5mm b/d. This is down from just under 45.5% in May, according to Reuters. Both China and India have benefited from discounted prices of ~ 30% vs. Brent, which is a powerful inducement to buy. Asia accounts for more than half of Russia’s seaborne crude oil sales, according to Bloomberg data. Related Report Commodity & Energy StrategyTighter Oil Markets On The Way Whether China and India can maintain these purchases depends on whether ships taking oil to them can get their cargoes insured. Both states have domestic insurance providers, and, in the case of the latter, long-standing trade relationships going back decades. Other Asian economies do not have such financial infrastructure. Still, this is a high concentration of sales to two buyers. In addition, press reports indicate China spent $347mm to secure tankers to conduct high-risk ship-to-ship (STS) transfers of Russian crude in the Atlantic Ocean.2 Similar STS transfers have been used to move ~ 1.2mm b/d of Iranian and Venezuelan crude oil, most of which ends up in China, according to Lloyds. Base Case Sees Markets Balance In our base case analysis, markets remain relatively balanced going into winter. On the supply side, we expect core OPEC 2.0 – the Kingdom of Saudi Arabia (KSA) and the United Arab Emirates (UAE) – to continue to provide crude to the markets subject to their spare-capacity constraints (Chart 2, top panel). KSA likely will be producing close to 11mm b/d by year-end – vs its current output of 10.6mm b/d output presently – and the UAE will be close to 3.5mm b/d, vs 3.1mm b/d at present. KSA’s max capacity is 12mm b/d, while the UAE’s is 4mm b/d; both will want to maintain spare capacity to offset unexpected exogenous supply shocks next year. These two states account for most of the spare capacity in the world (Chart 3). The rest of OPEC 2.0 will continue to struggle to maintain its production, which makes the core producers’ spare capacity critically important (Chart 2, bottom panel). Chart 2Core OPEC 2.0 Will Increase Supply
EU Russian Oil Embargoes, Higher Prices
EU Russian Oil Embargoes, Higher Prices
Chart 3Spare Capacity Concentrated In Core OPEC 2.0
EU Russian Oil Embargoes, Higher Prices
EU Russian Oil Embargoes, Higher Prices
Outside of OPEC 2.0, we are expecting the largest contribution to global supply will continue to come from US shale production (Chart 4). Shale-oil output in the top 5 US basins is expected to increase ~540K b/d this year, and next. This will take shale output to slighly above 7.5mm b/d and account for 76% of Lower 48 production in the States this year. Next year, we are expecting US Lower 48 production to rise 700K b/d, and for total US crude output to go to 12.8mm b/d, a new record. Chart 4US Remains Top Non-OPEC 2.0 Supplier
US Remains Top Non-OPEC 2.0 Supplier
US Remains Top Non-OPEC 2.0 Supplier
This winter we are expecting an uptick in oil demand – particularly for distillates like gasoil and diesel in Europe, as EU firms switch from natural gas to oil on the margin. We expect this will add 800K b/d of demand over the winter months (November through March), which will lift our overall demand estimate 150k b/d this year, and 20K b/d next year – +2.19mm b/d vs +2.04mm b/d, and 1.82mm b/d vs. 1.80mm b/d next year. Chinese year-on-year oil demand growth remains negative. January-July 2022 demand was 15.24mm b/d vs 15.34mm b/d in 2021, continuing a string of y/y contractions. The two other major economic pillars of global oil demand – the US and Europe – show positive y/y growth of 800K b/d each over the same period. Global demand in 1H22 recovered to 98% of its pre-COVID-19 level – even with China’s negative y/y growth – while supply recovered to 96% of its pre-pandemic level, according to the International Energy Forum (IEF). Over most of the forecast period, we estimate global balances will continue to show the level of supply below that of demand, which will lead to continued physical deficits (Chart 5). Refined-product inventories increased by 34mm barrels in 1H22, while crude-oil stocks fell 23mm barrels. Global crude and product inventories are ~ 460mm barrels below their five-year average, which includes pandemic demand destruction, the IEF reported. We continue to expect inventories to remain below their 2010-14 average, which we prefer to track – it excludes the market-share wars of 2015-17 and that of 2020, and the pandemic’s effects on inventories (Chart 6). This will revive the backwardation in Brent and WTI prices, particularly if the loss of Russian barrels is larger than we expect this year and next. This could be dampened if the US resumes its SPR releases after they’ve run their course in October. Chart 5Global Market Balanced, But Slight Deficits Will Persist
Global Market Balanced, But Slight Deficits Will Persist
Global Market Balanced, But Slight Deficits Will Persist
Chart 6OECD Inventories Below 5Y Average
OECD Inventories Below 5Y Average
OECD Inventories Below 5Y Average
Investment Implications Our analysis indicates markets are mostly balanced going into winter (Table 1). That said, the balance of risks remains to the upside ahead of the EU’s embargoes on Russian crude and product imports, and the EU/UK/US insurance/reinsurance bans on providing cover for vessels carrying Russian material. This all is highly contingent on the extent to which the EU and its allies follow through on these punitive actions imposed on Russia in retaliation for its invasion of Ukraine. Table 1BCA Global Oil Supply - Demand Balances (MMb/d, Base Case Balances) To Dec23
EU Russian Oil Embargoes, Higher Prices
EU Russian Oil Embargoes, Higher Prices
The removal from the market of some 2mm b/d of Russian oil production due to the various EU embargoes – even if it is offset by the return of 1mm b/d of Iranian exports on the back of a deal with the US – will push crude oil prices higher and inventories lower (Chart 7).3 Chart 7Brent Price Expectation Unchanged, But Demand Shifts To Winter
Brent Price Expectation Unchanged, But Demand Shifts To Winter
Brent Price Expectation Unchanged, But Demand Shifts To Winter
Given these views, we remain long the oil and gas producer XOP ETF, which is up 19.5% since we re-established it on July 5, and, at tonight’s close, will be re-establishing our COMT ETF, to take advantage of higher energy and commodity prices and increasing backwardation in oil markets as inventories draw. Robert P. Ryan Chief Commodity & Energy Strategist rryan@bcaresearch.com Ashwin Shyam Research Analyst Commodity & Energy Strategy ashwin.shyam@bcaresearch.com Paula Struk Research Associate Commodity & Energy Strategy paula.struk@bcaresearch.com Commodities Round-Up Energy: Bullish US distillate inventories – diesel and heating oil mostly – were up less than 1% for the week ended 12 August 2022, according to the US EIA. US distillate inventories stood at 112mm barrels. This did nothing to reverse the deep drawdown in distillate inventories of 18.5% y/y, which, along with European stocks, refiners are attempting to rebuild going into the 2022-23 winter. We expect natgas-to-oil switching this winter to add 800k b/d of demand to the market over the Nov-Mar winter season. Most of this demand will be for distillates, in our view, given its dual use as a fuel for industrial applications and household space-heating. Distillate demand could be higher this winter, if a La Niña produces colder-than-normal temperatures. The US Climate Prediction Center gives the odds of such an outcome 60% going into the 2022-23 winter. This would lift ultra-low-sulfur diesel futures in the US and gasoil futures in Europe higher as inventories draw (Chart 8). Base Metals: Bullish Copper prices dropped on weaker-than-expected Chinese macroeconomic data for July, although the fall was bounded by the People’s Bank of China’s decision to cut interest rates. According to US CFTC data, copper trading volumes are lower than pre-pandemic levels, as hedge funds' net speculative positions turned negative beginning in May and have mostly remained in the red since then. Low trading volumes will result in copper prices being highly susceptible to macroeconomic events, especially those occurring in China. Precious Metals: Neutral Gold prices are facing difficulty overcoming market expectations of high interest rates for the rest of this year (Chart 9). The bearish influence of tightening monetary policy and a strong USD has the upper hand on the supportive effect of recession risks, inflation, and geopolitical uncertainty for gold prices. Recent strength in US stock markets - which historically is inversely correlated with gold prices - following better-than-expected earnings, also contributed to recent gold price weakness. Chart 8
EU Russian Oil Embargoes, Higher Prices
EU Russian Oil Embargoes, Higher Prices
Chart 9
Investors Expect Fed Tightening To Give Way To An Easing Cycle In 2023
Investors Expect Fed Tightening To Give Way To An Easing Cycle In 2023
Footnotes 1 Please see Oil: It Ain't Over Till It's Over, which we published 11 August 2022, for additional discussion. NB: We discuss the differences between our view and that of our Geopolitical Strategy service regarding a deal between the US and Iran, which returns 1mm b/d of crude oil exports to the market. We give 60% odds to such a deal, while our colleagues at the GPS service assign a 40% probability to it. In our base case modeling presented herein, we expect these barrels to return to the market by 2Q23, perhaps sooner. 2 Please see Anonymous Chinese shipowner spends $376m on tankers for Russian STS hub published by Lloyd’s List 9 August 2022. The report notes, “All the ships are aged 15 years or older, precluding them from chartering by most oil majors, as well being unable to secure conventional financing, suggesting the beneficial owner is cash rich. The high seas logistics network offers scant regulatory and technical oversight as crude cargoes loaded on aframax tankers from Baltic Russian ports are transferred to VLCCs mid-Atlantic for onward shipment to China. One cargo has been tracked to India.“ 3 Please see Oil: It Ain't Over Till It's Over, which we published 11 August 2022, for additional discussion. NB: We discuss the differences between our view and that of our Geopolitical Strategy service regarding a deal between the US and Iran, which returns 1mm b/d of crude oil exports to the market. We give 60% odds to such a deal, while our colleagues at the GPS service assign a 40% probability to it. In our base case modeling presented herein, we expect these barrels to return to the market by 2Q23, perhaps sooner. Investment Views and Themes Strategic Recommendations Trades Closed in 2022
Listen to a short summary of this report. Executive Summary Chart 1The Dollar Has Broken Below The First Line Of Support
The Dollar Has Broken Before The First Line Of Support
The Dollar Has Broken Before The First Line Of Support
The softer CPI print in the US boosted growth plays and pushed the DXY index below its 50-day moving average (Feature Chart). This suggests CPI numbers will remain the most important print for currency markets in the coming weeks and months. If US inflation has peaked, then the market will price a less aggressive path for Fed interest rates, which will loosen support for the dollar. At the same time, other G10 central banks are still seeing accelerating inflation. This will keep them on a tightening path. This puts the DXY in a tug of war. On the downside, the Fed could turn less hawkish. On the other hand, currencies such as the EUR, GBP and even SEK face high inflation but deteriorating growth. This will depress real rates. Within this context, the most attractive currencies are those with relatively higher real rates, and a real prospect of a turnaround in growth. NOK and AUD stand out as potential candidates. Our short EUR/JPY trade has been performing well in this context. Stick with it. RECOMMENDATIONS INCEPTION LEVEL inception date RETURN Short EUR/JPY 141.20 2022-07-21 3.29 Bottom Line: Our recommended strategy is a neutral dollar view over the next three months, until it becomes clear inflation has peaked and global growth has bottomed. Feature The DXY index peaked at 108.64 on July 14 and has dropped to 105.1 as we go to press. There have been two critical drivers of this move. First, the 10-year US Treasury yield has fallen from 3.5% to 2.8%. With this week’s all important CPI release, which showed a sharp deceleration in the headline measure, bond yields may well stabilize at current levels for a while. Second, the drop in energy prices has boosted the JPY, SEK and EUR, which are heavily dependent on imported energy. Related Report Foreign Exchange StrategyA Montreal Conversation On FX Markets Another development has been happening in parallel – as US inflation upside surprises have crested, so has the US price impulse relative to its G10 counterparts (Chart 1). To the extent that this eases market pricing of a hawkish Fed (relative to other G10 central banks), it will continue to diminish upward pressure on the dollar. Much will depend on the incoming inflation prints both in the US, and abroad. With the DXY having broken below its 50-day moving average, the next support level is at 103.6. This is where the 100-day moving average lies, which the dollar tested twice this year before eventually bouncing higher (Chart 2). The next few sections cover the important data releases over the last month in our universe of G10 countries, and implications for currency strategy. What is clear is that most foreign central banks are committed to their tightening campaign, which argues for a neutral stance towards the DXY for now. Chart 1US Inflation Momentum Has Rolled Over
US Inflation Momentum Has Rolled Over
US Inflation Momentum Has Rolled Over
Chart 2The Dollar Has Broken Below The First Line Of Support
The Dollar Has Broken Below The First Line Of Support
The Dollar Has Broken Below The First Line Of Support
US Dollar: Consolidation Chart 3The Conditions For A Fed Hike Remain In Place
The Conditions For A Fed Hike Remain In Place
The Conditions For A Fed Hike Remain In Place
The dollar DXY index is up 10% year to date. Over the last month, the DXY index is down 2.1% (panel 1). Incoming data continues to make the case for a strong dollar. Job gains are robust. In June, the US added 372K jobs. The July release was even stronger at 528K jobs. This pushed the unemployment rate to a low of 3.5% (panel 2). Wages continue to soar. Average hourly earnings came in at 5.2% year-on-year in July. The Atlanta Fed wage growth tracker continues to edge higher across all income cohorts (panel 3). The June CPI print was above expectations at 9.1% for headline, with core at 5.9%. The July print for headline that came out this week was 8.5%, below expectations of 8.7%. At 5.9%, the core measure is still well above the Fed’s target (panel 4). June retail sales remained firm, but consumer sentiment continues to weaken. While the University of Michigan current conditions index increase from 53.8 to 58.1 in June, this is well below the January 2020 level of 115. Correspondingly, the Conference Board consumer confidence index fell from 98.7 to 95.7 in July. On June 17, the Fed increased interest rates by 75bps, as expected. The US entered a second consecutive quarter of GDP growth contraction in Q2, falling by an annualized 0.9%. The ISM manufacturing index was flat in July suggesting Q3 GDP is not starting on a particularly strong foot. The Atlanta Fed Q3 GDP growth tracker is, however, printing 2.5%. Unit labor costs are soaring, rising 10.8% in Q2. This is sapping productivity growth, which fell 4.6% in Q2. The key for the dollar’s outlook is the evolution of US inflation and the labor market. For now, inflation remains sticky, and wages are rising. Meanwhile, labor market conditions remain robust. This will keep the Fed on a tightening path in the near term. We initially went short the DXY index but were stopped out. We remain neutral in the short term, though valuation keeps us bearish over a long-term horizon. The Euro: A European Hard Landing Chart 4The Euro Is At Recession Lows
The Euro Is At Recession Lows
The Euro Is At Recession Lows
The euro is down 9.2% year to date. Over the last month, the euro is up 2.7%, having faced support a nudge below parity. Incoming data continues to suggest weak economic conditions, with a stagflationary undertone: The ZEW Expectations Survey for July was at -51.1, the lowest reading since 2011 (panel 1). The current account remains in a deficit, at -€4.5bn in May. Consumer confidence continues to plunge. The July reading of -27 is the worst since the 2020 Covid-19 crisis (panel 2). Despite the above data releases, the ECB surprised markets by raising rates 50bps. CPI continues to surprise to the upside. The preliminary CPI print for July came in at 8.9%, well above the previous 8.6% print. PPI in the euro area was at 35.8% in June, a slight decline from the May reading (panel 3). The German Ifo business expectations index fell to 80.3 in July. Historically, that has been consistent with a manufacturing PMI reading of 45 (panel 4). The Sentix confidence index stabilized in August but remains very weak at -25.2. This series tends to be trending, having peaked in July last year. We will see if the next few months continue to show stabilization. The ECB mandate dictates that it will continue to fight soaring inflation. As such, it may have no choice but to generate a Eurozone-wide recession. This is the key risk for the euro since it could push EUR/USD below parity again. We continue to sell the EUR/JPY cross. In a risk-off environment, EUR/JPY will collapse. In a risk-on environment, like this week, the yen can still benefit since it is oversold. Meanwhile, investors remain overwhelmingly bearish (panel 5). The Japanese Yen: Quite A Hefty Rally Chart 5Some Green Shoots In Japan
Some Green Shoots In Japan
Some Green Shoots In Japan
The Japanese yen is down 13.4% year-to-date, the worst performing G10 currency (panel 1). Over the last month, the yen is up 3.3%. Incoming data in Japan has been worsening as the rising number of Covid-19 cases is hitting mobility and economic data. According to the Eco Watcher’s survey, sentiment among small and medium-sized Japanese firms deteriorated in July. Current conditions fell from 52.9 to 43.8. The outlook component also declined from 47.6 to 42.8. Machine tool order momentum, one of our favorite measures of external demand, continues to slow. Peak growth was at 141.9% year-on-year in May last year. The preliminary reading from July was at 5.5% (panel 2). Labor cash earnings came in at 2.2% year-on-year, a positive sign. Household spending also rose 3.5%. Rising wages could keep inflation momentum rising in Japan (panel 3). On that note, the Tokyo CPI report for July was also encouraging, with an increase in the core-core measure from 1% to 1.2%. The Tokyo CPI tends to lead nationwide measures. The labor market remains robust. Labor demand exceeds supply by 27%. The Bank of Japan kept monetary policy on hold on July 20th, a policy move that makes sense given incoming data. The BoJ still views a large chunk of inflation in Japan as transitory. For inflation to pick up, wages need to rise. While they are rising, inflation expectations remain well anchored, suggesting little rationale for the BoJ to shift (panel 4). That said, the yen is extremely cheap after being the best short this year (panel 5). British Pound: Coiled Spring Below 1.20? Chart 6Cable Is Vulnerable
Cable Is Vulnerable
Cable Is Vulnerable
The pound is down 9.8% year to date. Over the last month, the pound is up by 2.5%. Sterling broke below a soft floor of 1.20, but quickly bounced back and is now sitting at 1.22, as sentiment picked up (panel 1). We find the UK to have an even bigger stagflation problem than the eurozone. CPI came in at 9.4% in June. The RPI came in at 11.8%. PPI was at 24%. All showed an acceleration from the month of May (panel 2). Nationwide house price inflation has barely rolled over unlike other markets, increasing from 10.7% in June to 11% in July. The Rightmove national asking price was 9.3% higher year-on-year in July, compared to 9.7% in June (panel 3). Meanwhile, mortgage approvals have been in steady decline over the last two years, which points toward stagflation. Retail sales excluding auto and fuel fell 5.9% year-on-year in June, the weakest reading since the Covid-19 crisis. Consumer confidence is lower than in 2020 (panel 4). Trade data continues to be weak, which has dipped the current account towards decade lows (panel 5). The external balance is the biggest driver of the pound, given the huge deficit. The above environment has put the BoE in a stagflationary quagmire. Last week, they raised rates by 50 bps suggesting inflation is a much more important battle than growth. Politically, the resignation of Prime Minister Boris Johnson, and broader difficulties for the Conservative Party, is fueling sterling volatility. We are maintaining our long EUR/GBP trade as a bet that at 1.03, the euro has priced in a recession (well below the 2020 lows), but sterling has not. On cable, 1.20 will prove to be a long-term floor but it will be volatile in the short term. Australian Dollar: A Contrarian Play Chart 7Relatively Solid Domestic Conditions In Australia
Relatively Solid Domestic Conditions In Australia
Relatively Solid Domestic Conditions In Australia
The AUD is down 2.3% year-to-date. Over the last month, the AUD is up 5.3%. AUD is fast approaching its 200-day moving average. If that is breached, it could signal that the highs of this year, above 76 cents, are within striking distance (panel 1). Inflation is accelerating in Australia. In Q2, the inflation reading was 6.1%, while the trimmed-mean and weighted-median measures were above the central bank’s 1-3% band (panel 2). As a result, the RBA stated the benchmark rate was “well below” the neutral rate. It increased rates by an additional 50bps in August, lifting the official cash rate to 1.85%. Further rate increases are likely. There are a few reasons for this. First, labor market conditions are the most favorable in decades. In June, unemployment reached 3.5%, its lowest level in 50 years, against a consensus of 3.8% (panel 3). The participation rate also increased to 66.8% in June from 66.7%, which has pushed the underutilization rate to multi-decade lows (panel 4). Despite this, consumer confidence continued its decline in August, dropping to 81.2 from 83.8. A pickup in Covid-19 cases and high consumer prices are the usual suspects. Beyond the labor market, monetary policy seems to be having the desired effect. Demand appears to be slowing as retail sales grew 0.2% month-on-month in June from 0.9%. Home loan issuance declined by 4.4% in June, driven by a 6.3% decline in investment lending. House price growth continued to decline in July, particularly in densely populated regions like Sydney and Melbourne. The manufacturing sector remains strong, with July PMI coming in at 55.7, suggesting the RBA might just be achieving a soft landing in Australia. The external environment was largely favorable for the AUD in June, as the trade balance increased substantially by A$17.7bn with commodities rallying early in the month. However, commodity prices are rolling over. The price of iron for example, is down 24% from its peak in June. This will likely weigh on the trade balance going forward (panel 5). A weakening external environment are near-term headwinds for the AUD, but we will be buyers on weakness (panel 6). New Zealand Dollar: Least Preferred G10 Currency Chart 8Near-Term Risks To NZD
Near-Term Risks To NZD
Near-Term Risks To NZD
The NZD is down 6.1% this year. Over the last month, it is up 5% (panel 1). The Reserve Bank of New Zealand raised its official cash rate (OCR) in July by 50bps to 2.5%, in line with market expectations. Policymakers maintained their hawkish stance and guided towards increased tightening until monetary conditions can bring inflation within its target range of 1-3%. Inflation rose in Q2 to 7.3% from a 7.1% forecast, largely driven by rising construction and energy prices (panel 2). As of the latest data, monetary policy appears to be continuing to have the desired effect on interest rate sensitive parts of the economy. REINZ home sales declined 38.1% year-on-year in June. Home price growth continues to roll over (panel 3). The external sector continues to slow. Dairy prices, circa 20% of exports, saw a 12% drop in early August after remaining flat in July. The 12-month trailing trade balance remains in deficit. This is most likely due to a substantial slowdown in Chinese economic activity, given that China is an important trade partner with New Zealand. What is important is that the RBNZ’s “least regrets” approach seems to be working. Despite a cooling economy, sentiment seems to be stabilizing. ANZ consumer confidence improved to 81.9 in July from 80.5. Business confidence also improved to -56.7 from -62.6 (panel 4). Ultimately, the NZD is driven by terms of trade, as well as domestic conditions (panels 1 and 5). Thus, short-term headwinds from a deteriorating external sector do not make us buyers of the currency for now, though a rollover in the dollar will help the kiwi. Canadian Dollar: Lower Oil, Hawkish BoC Chart 9The BoC Will Stay On A Hawkish Path
The BoC Will Stay On A Hawkish Path
The BoC Will Stay On A Hawkish Path
The CAD is down 1.2% year to date. Over the last month, it is up 1.8%. The Canadian dollar did not fully catch up to oil prices on the upside. Now that crude is rolling over, CAD remains vulnerable, unless the dollar continues to stage a meaningful decline (panel 1). Canadian data has been rather mixed over the last month. For example: There have been two consecutive months of job losses. This is after a string of positive job reports. In July, Canada lost 31K jobs. In June, it lost 43K. The reasons have been mixed, from women dropping out of the labor force, to lower youth participation (the participation rate fell), but this is a trend worth monitoring (panel 2). CPI growth remains elevated and is accelerating both on headline and core measures(panel 3). Building permits and housing starts have started to roll over, as house price inflation continues to lose momentum. June housing starts were at 274K from 287.3K. June building permits also fell 1.5% month-on-month though annual inflation is still outpacing house price growth (panel 4). The Canadian trade balance is improving, hitting a multi-year high of C$5.05 bn in June. This has eased the need for foreign capital inflows. The BoC raised rates 100bps in July, the biggest interest rate increase in one meeting among the G10. Unless the labor market continues to soften, the BoC will continue to focus on inflation, which means more rate hikes are forthcoming. The OIS curve is pricing a peak BoC rate of 3.6% in 9 months (panel 5). Two-year real rates are still higher in the US compared to Canada. And the loonie has lost the tailwind from strong WCS oil prices. As such, unless the dollar softens further, the loonie will remain in a choppy trading pattern like most of this year. Swiss Franc: A Safe Haven Chart 10The Franc Will Remain Strong Against The Euro For Now
The Franc Will Remain Strong Against The Euro For Now
The Franc Will Remain Strong Against The Euro For Now
CHF is down 3.2% year-to-date and up 4.3% in the past month. The Swiss franc has been particular strong against the euro, with EUR/CHF breaching parity (panel 1). Switzerland remains an island of relative economic stability in the G10. Although slowing, the manufacturing PMI was a healthy 58 in July. The trade surplus was up to CHF 2.6bn in June, despite a strong franc. While most European countries are preparing for a tough winter with energy rationing, prospects for Switzerland, which derives only 13% of its electricity from natural gas, look more favorable. Still, as a small open economy, Switzerland is feeling the impact of global growth uncertainty. The KOF leading indicator dropped to 90.1 in August with a sharp decline in the manufacturing component. This broader measure suggests the relative resilience of the manufacturing sector might not last long (panel 2). Consumer confidence also fell to the lowest level since the onset of the pandemic. Swiss headline inflation stabilized at 3.4% in July. The core measure rose slightly to the SNB’s 2% target (panel 3). The UBS real estate bubble index rose sharply in Q2, suggesting inflation is not only an imported problem. Labor market conditions also remain tight, with the unemployment rate at 2%, a two-decade low. The SNB will continue to embrace currency strength while inflation risks persist (panel 4), as can be seen by the decline in sight deposits and FX reserves (panel 5). The market is still pricing in another 50 bps hike in September although August inflation data that comes out before the meeting will likely be critical for that decision. CHF is one of the most attractive currencies in our ranking. Despite the recent outperformance, CHF is still down year-to-date against the dollar. A rise in safe-haven demand, and a possible energy crunch in winter will be supportive, especially against the euro. Norwegian Krone: Oil Fields Are A Jewel Chart 11NOK Will Reap Dividends From Energy Exports
NOK Will Reap Dividends From Energy Exports
NOK Will Reap Dividends From Energy Exports
NOK is down 7.4% year-to-date and up 7.1% over the last month. It is also up 4.2% versus the euro, despite softer oil prices (panel 1). Inflation in Norway continues to accelerate. In July, CPI grew 6.8% year-on-year, above the market consensus and the Norges Bank’s forecast. Underlying inflation jumped sharply to an all-time high of 4.5%, compared to the Bank’s 3.2% forecast made just over a month ago (panel 2). These figures are adding pressure on the central bank to increase the pace of interest rate hikes, with 50bps looking increasingly likely at the meetings in August and September. NOK jumped on the inflation news. The housing market is starting to show signs of slowing with prices down 0.2% on the month in July, the first decrease since December. This, together with household indebtedness (panel 3), makes the task of policy calibration challenging. Our bias is that a persistently tight labor market and strong wage growth (panel 4) will allow the bank to focus on inflation. Economic activity remains robust in Norway but is softening. The manufacturing PMI fell to 54.6 in July, while industrial production was down 1.7% month-over-month in June. Consumer demand remains frail with retail sales and household consumption flat in June from the previous month. On a more positive note, trade surplus remains near record levels and is likely to stay elevated as high European demand for Norwegian energy is likely to last at least through the winter (panel 5). As global risk sentiment picked up, the krone became the best performing G10 currency over the past month. If the risk appetite reverses, the currency is likely to feel some turbulence. Swedish Krona: Cheap, But No Catalysts Yet Chart 12SEK = EUR On Steroids
SEK = EUR On Steroids
SEK = EUR On Steroids
SEK is down 10% year-to-date and up 5.6% over the past month. The vigorous rebound highlights just how oversold the Swedish krona is (panel 1). The Swedish economy grew 1.4% in Q2 from the previous three months, rebounding from a 0.8% contraction in the first quarter. This is impressive, given high energy prices and a slowdown in global economic activity. Going forward, growth is likely to slow. In July, the services and manufacturing PMIs declined, and consumer confidence fell sharply to the lowest reading in almost 30 years. Retail sales were down 1.2% month-on-month in June. The housing market is also feeling the pain of rising borrowing costs (panel 2). The Riksbank’s latest estimate sees a 16% decline in prices by the end of next year. For now, inflation is still accelerating in Sweden. CPIF, the Riksbank’s preferred measure, increased from 7.2% to 8.5% in June. Headline inflation rose from 7.3% to 8.7% (panel 3). Headline inflation is likely to decline in July, given the drop in the price component of the PMIs, but inflation will remain well above target. This will keep real rates weak (panel 4). This suggests that the Riksbank is facing the same conundrum as the ECB: accelerate policy tightening and tip the economy towards recession or remain accommodative and risk inflation becoming more entrenched. Our bias is that the Riksbank is likely to frontload rate hikes as currently priced in the OIS curve, with a 50 bps hike in September, ahead of major labor union wage negotiations (panel 5). Much like the NOK, the Swedish krona rebounded strongly in the past month on global risk-on sentiment. Fundamentally, the krona remains more vulnerable to external shocks due to higher energy dependency and a strong dollar. Chester Ntonifor Foreign Exchange Strategist chestern@bcaresearch.com Artem Sakhbiev Research Associate artem.sakhbiev@bcaresearch.com Thierry Matin Research Associate thierry.matin@bcaresearch.com Trades & Forecasts Strategic View Cyclical Holdings (6-18 months) Tactical Holdings (0-6 months) Limit Orders Forecast Summary