Euro Area

Executive Summary Loss Of Russian Production Will Lift Brent
Loss Of Russian Production Will Lift Brent
Loss Of Russian Production Will Lift Brent
With German imports of Russian oil close to 10% of its total requirements – following an impressive decline from 35% pre-invasion – we expect the EU to declare an embargo on Russian oil imports this week or next. Smaller states – e.g., Hungary and Slovokia – will be granted embargo waivers; their import volumes will not affect the EU effort. Russia will be forced to shut in ~ 1.6mm b/d of production, rising to 2mm b/d next year (vs. pre-invasion levels). Demand will fall as Brent prices surpass $120/bbl by 2H22, in our revised base case. Prices above $140/bbl are likely if Russia immediately halts EU oil exports. Our revised forecast calls for Brent to average $113/bbl this year, and $122/bbl next year. WTI will trade $3/bbl lower. Per earlier threats, Russia will cut EU natgas exports following the EU embargo. Benchmark euro natgas prices will go back above €225/MWh, and trigger an EU recession. Bottom Line: An EU embargo on Russian oil imports is close. Brent crude will rally above $120/bbl by 2H22, with $140/bbl or higher likely, depending on how quickly Russia reacts to the EU oil embargo. Eurozone natgas will trade above €225/MWh again. We remain long the S&P GSCI index, the COMT ETF, and the XOP and CRAK ETFs to retain exposure to higher prices. We are getting long 1Q23 ICE Brent futures and 4Q22 TTF futures at tonight's close. Feature Related Report Commodity & Energy StrategyDie Cast By EU: Inflation, Recession Risks Rise The stage is set for the EU to announce an embargo on Russian oil imports this week or next. Odds of an EU embargo being declared sooner rather than later increased, in our view, in the wake of Germany's success in cutting Russian oil imports by more than half in a very short period – from ~ 35% prior to Russia's invasion of Ukraine on 24 February to ~ 12% earlier this month (Chart 1). Further reductions in Russian oil imports we expect from Germany will make it easier for the EU's largest economy to walk away from Russian crude and product imports sooner rather than later.1 Other EU member states already stand with Germany on the issue of an embargo on Russian imports. Those that do not – Hungary and Slovakia, e.g. – do not import Russian oil on a scale that can meaningfully derail EU solidarity on the embargo, which means waivers for these states can be expected to keep the embargo on track. In addition, four of the Five-Eyes states – the US, UK, Australia and Canada – already have imposed embargoes on Russian oil imports. Chart 1EU Energy Import Dependency (2021)
EU Energy Import Dependency (2021)
EU Energy Import Dependency (2021)
Russian Shut-ins Will Tighten Supply The immediate fallout of the EU embargo will be to accelerate the rate at which Russia is forced to shut in production, as increasing volumes of its oil remain stranded on the water looking for a home. We reckon 1mm b/d or so of Russian crude oil output already has been cut. This will continue to increase. Russia will be forced to shut in ~ 1.6mm b/d of crude output this year, rising to 2mm b/d next year (averages vs. pre-invasion levels), in our modelling. This takes Russian oil production down to 8.4mm b/d this year, on average, and 8.0mm b/d next year.2 As more and more Russian crude is shut in, the pipelines carrying Urals and Eastern Siberia-Pacific Ocean (ESPO) crude from the Siberian oil fields to ports will fill, along with inventory in the ports where ships are loaded for export. When storage and pipelines fill, the only alternative Russian producers will have will be to shut in crude and condensate production. While some states obviously will benefit from the increasing availability of Russian crude on offer at 30% discounts or more – e.g., India and China – there is a limit as to how much surplus Russian output they can take in. China, in particular, will not want to jeopardize long-term contracts with key suppliers – e.g., the Kingdom of Saudi Arabia (KSA) – nor will India, which will limit the total volumes both are willing to take from Russia longer term. Security of supply becomes an increasingly important consideration as Russia's oil output continues a long-term decline going forward: Costs were rising prior to Russia's invasion of Ukraine from 2008 to 2019. Falling drilling efficiency and production, were accompanied by rising water cuts – i.e., the amount of water being produced drilling for oil – in Russia's largest fields, which rose to as high as 86%. Shutting production from these older fields will force hard choices as to whether these fields are ever revived.3 Demand Will Be Stressed Shortly after Russia invaded Ukraine, the country's Energy Ministry Alexander Novak warned the EU it would cut off natural gas pipeline supplies being sent to the continent, in retaliation for embargoing oil imports.4 Oil exports of close to 5mm b/d accounted for just under half of Russia's revenue from energy exports last year, with OECD Europe representing half of that amount.5 For Russia, oil exports are far more important than gas exports, which will incline it to immediately cut pipeline flows to Europe as soon as an oil embargo is announced. For the EU, natgas exports from Russia are critical to the economies of its member states (Chart 2). The EU imported ~ 155 bcm of natgas from Russia in 2021, or just over 40% of its total natgas consumption. Germany's share amounted to 45 bcm, or 45% of domestic gas use . If, as we expect, the EU is close to announcing its oil embargo on Russia, an immediate retaliation from Moscow in the form of a cutoff of pipeline exports to the EU most likely will follow. This will throw the EU into a recession, as natgas prices surge. Chart 2Losing Russia's Natgas Will Be Painful For EU
Oil, Natgas Prices Set To Surge
Oil, Natgas Prices Set To Surge
Revised Forecast Reflects Falling Russian Output We are revising our Brent forecast and crude oil balances in line with our expectation Russian oil output will decline meaningfully. As noted above, we now expect Russian crude oil output to fall to 8.4mm b/d this year and 8.0mm b/d in 2023. This pushes non-core OPEC 2.0 production – which now includes Russia – lower, as a result (Chart 3). We moved Russia out of the core OPEC 2.0 producer group, given the production declines we expect this year and next, and into the "Other Guys" group. Our base case demand reflects a shift in OECD vs. non-OECD consumption estimates, with the OECD gaining incrementally, while EM demand (via non-OECD consumption) falls incrementally (Chart 4). Chart 3Falling Russia Output Pushes Non-Core OPEC 2.0 Output Lower
Oil, Natgas Prices Set To Surge
Oil, Natgas Prices Set To Surge
Chart 4DM Demand Shifts Higher, EM Shifts Lower
DM Demand Shifts Higher, EM Shifts Lower
DM Demand Shifts Higher, EM Shifts Lower
The lower EM demand growth reflects weaker China oil consumption resulting from the country's zero-COVID policy. In addition, because we expect Russia to act quickly on cutting off EU natgas exports, benchmark TTF natgas prices will move back above €225/MWh. Higher oil and natgas prices in the EU will lead to recession later this year. How quickly this shows up depends on how quickly Russia reacts to an EU oil embargo. In addition, a strong USD – bid higher by global economic uncertainty and safe-haven demand – will pushing the local-currency costs of refined products like gasoline, diesel and jet fuel higher, also will contribute to lower EM demand (Chart 5). Chart 5USD Remains Well Bid
Oil, Natgas Prices Set To Surge
Oil, Natgas Prices Set To Surge
In our base case, we expect a tighter market on balance (Chart 6). Oil inventories remain under pressure, owing to falling as Russian output and declines in production outside core OPEC 2.0 and the US (Chart 7). We cannot rule out additional SPR releases from the US or IEA to offset tightening global inventories. Chart 6Global Balances Tighten
Global Balances Tighten
Global Balances Tighten
Chart 7Inventories Draw As Supply Tightens
Inventories Draw As Supply Tightens
Inventories Draw As Supply Tightens
Our forecast for Brent this year has been lifted on the back of a much stronger expectation of an EU oil embargo against Russia. This will result in 2mm b/d of Russian production being shut in by next year, which will not be fully replaced (Table 1). We are lifting our Brent forecast to $110/bbl for 2022, and $115/bbl for next year as a result (Chart 8). Chart 8Loss Of Russian Production Will Lift Brent
Loss Of Russian Production Will Lift Brent
Loss Of Russian Production Will Lift Brent
Table 1BCA Global Oil Supply - Demand Balances (MMb/d, Base Case Balances) To Dec23
Oil, Natgas Prices Set To Surge
Oil, Natgas Prices Set To Surge
Investment Implications An EU embargo on Russian oil imports is close at hand, in our view. Brent crude will rally above $120/bbl by 2H22, with $140/bbl or higher possible, depending on Russia's reaction to the EU oil embargo. We expect Brent prices to average $113/bbl this year, and $122/bbl in 2023. WTI will trade $3/bbl lower on average. Eurozone natgas will trade above €225/MWh again and stay at elevated levels, likely moving higher following a Russian cutoff of natgas supplies to the continent. This will throw the EU into recession. We remain long the S&P GSCI index, the COMT ETF, and the XOP and CRAK ETFs to retain exposure to higher prices. We are getting long 1Q23 ICE Brent futures and TTF natgas futures at tonight's close. A word of caution is in order: We are assuming Russia will follow through on its threat to shut off natgas exports to the EU in the event of an embargo against importing its oil is declared. This, we believe, is Russia's red line. If the EU fails to declare an embargo, or if Russia fails to follow through on its threat to cut off gas supplies in the wake of an EU oil embargo of its exports we will have to re-assess our outlook. Robert P. Ryan Chief Commodity & Energy Strategist rryan@bcaresearch.com Ashwin Shyam Research Analyst Commodity & Energy Strategy ashwin.shyam@bcaresearch.com Paula Struk Research Associate Commodity & Energy Strategy paula.struk@bcaresearch.com Commodities Round-Up Energy: Bullish European natural gas inventories are building at a rapid rate, as competition from Asia – typically led by Chinese demand – remains weaker than in previous seasons. EU natgas storage stood at ~446 MWh as of May 16, 2022, the latest available reports indicate (Chart 9). The EU has weathered two extremely difficult winters in 2020-21 and 2021-22. Natgas storage levels were drawn hard to meet space heating demand, which, owing to a winter energy crisis in China at the time, forced European buyers into a competition for liquified natural gas (LNG) during the former period. Following unexpected spring-summer demand in 2021 when cold weather lingered in Europe and wind power generation fell sharply, storage owners again were hard pressed to secure LNG to rebuild storage levels going into this past winter, which caused European TTF natgas prices to soar, as demand surged (Chart 10). With the threat of a cutoff of Russian natgas hanging over the EU, there is a singular focus right now on getting storage as full as possible ahead of next winter. The EU aims to replace two-thirds of Russian gas imports before yearend. Precious Metals: Bullish The Fed has adopted a more hawkish rhetoric, as it acts more aggressively to reduce US inflation. Interest rates have increased from near-zero levels in March to 0.75%, and BCA’s US Bond strategy service expects two more 50 bps rate hikes in June and July. Post July, rate hikes will depend on the Fed’s assessment of inflation, inflation expectations and financial conditions. The Fed faces the risk of either remaining behind the inflation curve or sparking a recession in case it’s either not hawkish enough, or too hawkish. Base Metals: Bullish High power prices in Europe will continue to plague refined base metals production in the continent and keep refined metal prices buoyed. LME Europe aluminum stocks are close to 17-year lows. In China – whose metal smelters were also hit by high power prices in 2021 – aluminum smelting has revived, with the country reportedly producing a record amount of primary aluminum in April. Lockdowns, however, have reduced economic activity, demand for the metal and its domestic price. China has taken advantage of this arbitrage opportunity, sending most of its primary aluminum exports to Europe. This aluminum price spread between the two states has contributed to China’s steady rise in primary aluminum exports this year, after having exported nearly none in 2020 and 2021. Chart 9
Oil, Natgas Prices Set To Surge
Oil, Natgas Prices Set To Surge
Chart 10Dutch Title Transfer Facility Going Down
Dutch Title Transfer Facility Going Down
Dutch Title Transfer Facility Going Down
Footnotes 1 German officials have stated the country will wind down all oil imports from Russia by year end, even if the rest of the EU does not join it in an embargo. We highly doubt Germany will act alone, given the support an embargo already has received from EU member states. Please see Germany to Stop Russian Oil Imports Regardless of EU Sanctions, published by bloomberg.com on May 15, 2022. 2 Our expectation for shut-in volumes is lower than the IEA's, which sees Russia being forced to shut in 3mm b/d of production by 2H22. We continue to monitor this closely via satellite and reporting services and will adjust our estimates as needed. Obviously, if the IEA is correct oil markets will tighten even more than we expect. 3 Please see "The Future of Russian Oil Production in the Short, Medium, and Long Term," published by the Oxford Institute for Energy Studies in September 2019. The OIES study notes production in Russia's highest-producing area – the Khanty-Mansi Autonomous (KMA) district – actually fell 15% between 2008-19, even as drilling activity surged 66%. While output in 2018 rose due to intensified oil recovery (IOR), the OIES noted that the water cut rose sharply in 2018 as well in the KMA district. 4 Please see Russia warns of $300 oil, threatens to cut off European gas if West bans energy imports, published by cnbc.com on March 8, 2022. The article notes Novak threatened to close the Nord Stream 1 pipeline delivering gas to Germany in retaliation for an EU oil embargo. Almost three-quarters of Russia's natgas exports were sent to Europe prior to its invasion of Ukraine. Natgas export revenues accounted for $62 billion of the $242 billion funding Russia's budget last year, while crude oil revenues made up $180 billion (just under 75%). 5 Please see Die Cast By EU: Inflation, Recession Risks Rise, which we published on May 5, 2022. It is available at ces.bcaresearch.com. Investment Views and Themes Recommendations Strategic Recommendations Trades Closed in 2022
Executive Summary UK Stocks Are Close To A Bottom
UK Stocks Are Close To A Bottom
UK Stocks Are Close To A Bottom
The UK economic outlook has greatly deteriorated. Weak global growth and punishing energy inflation will cause activity to contract over the next 12 months. Cost-push pressures will drag inflation above 10% in 2022. Moreover, demand-pull inflation highlights problems with the supply-side of the economy. UK yields have downside relative to those in the Euro Area. GBP/USD will bottom once global stock prices find a floor. EUR/GBP possesses more upside. UK stocks will enjoy a structural tailwind relative to their Eurozone counterparts as a result of a secular bull market in commodity prices. Nonetheless, UK equities are likely to underperform in the second half of 2022. UK small-cap stocks are massively oversold compared to large-cap shares; however, a peak in energy inflation must take place for small-cap equities to stage a rebound. TACTICAL INCEPTION DATE RETURN SINCE INCEPTION (%) COMMENT Overweight UK Gilts Within European Fixed-Income Portfolios 05/16/2022 Cyclical Buy European Healthcare Equities / Sell UK Healthcare Equities 05/16/2022 Tactical Buy European Financials Equities / Sell UK Financials Equities 05/16/2022 Tactical Bottom Line: British Gilts will outperform because of the weakness in UK economic activity, but the trade-weighted pound will remain under pressure. The performance of UK large-cap names is mostly independent from the state of the British economy. The commodity secular bull market will create a potent tailwind for this market. However, a better entry point lies ahead. The Bank of England’s (BoE) latest policy meeting was a cold shower for market participants and their aggressive interest rate pricing in the SONIA curve. Money markets expected a peak in the Bank Rate of 2.7% in 2023, but the BoE’s new Market Participants Survey is calling for it to peak at 1.75% before easing off to 1.5% in 2024. The UK economy is in trouble. Inflation is high and broad-based, which explains why investors are pricing in such an aggressive path for the Bank Rate. Yet, economic activity is weakening and could even contract in early 2023. The BoE clearly puts more weight on growth than investors do. What are the implications of the inflation, growth, and policy outlook for British assets? BCA has upgraded its view on UK bonds to overweight within global fixed income portfolios. We expect more softness in the pound versus the euro. UK large-cap stocks will continue to trade in line with energy dynamics, which means it is still too early to buy British small-cap equities. In the meantime, UK financial and healthcare names will underperform their Euro Area counterparts. Growth To Weaken Further The -0.1% month-over-month GDP contraction in March underscores that UK economic activity has already decelerated sharply. However, the deterioration is only starting. Most sectors of the economy show ominous signs for the quarters ahead. Consumer Sector The biggest hurdle facing UK consumers, like most of their European neighbors, is the surge in inflation, particularly energy and food prices. Safety nets are looser than on the continent, and UK households’ real disposable income are contracting sharply. The impact of this weakening of activity is already visible. UK consumer confidence is falling in line with the knock to real disposable income (Chart 1, top panel). Moreover, real retail sales have already slowed sharply, and the BRC Like-For-Like Retail Sales measure is contracting on an annual basis (Chart 1, bottom panel). As a result, the outlook for consumption is worsening. Ofgem, the UK gas and electricity market regulator, lifted its energy price cap by 54% on April 1st and plans to increase it again by an expected 40% in October. Consequently, the BoE anticipates the share of households’ disposable income spent on energy to hit 7.7% by the end of the year — its highest level since the early 1980s (Chart 2). Chart 1Falling Real Incomes Hurt
Falling Real Incomes Hurt
Falling Real Incomes Hurt
Chart 2Intensifying Energy Drag
Intensifying Energy Drag
Intensifying Energy Drag
The savings cushion developed during the pandemic will not be enough to prevent weaker retail sales. More than 40% of households plan to dip into their existing savings and curtail their savings rate; however, UK excess savings skew heavily toward the richer households. Poorer households with low savings are the ones who spend the largest share of their income on energy (Chart 3), and they are also the ones with a higher marginal propensity to consume. Thus, the knock to these households portends further weakness in consumption volumes. Chart 3The Poor Are Hit Harder
Is UK Stagflation Priced In?
Is UK Stagflation Priced In?
Chart 4No Salvation From Housing
No Salvation From Housing
No Salvation From Housing
Housing is unlikely to save the day. While house prices and housing transactions are robust (Chart 4, top panel), mortgage approvals are declining rapidly and average sales per chartered surveyors are also softening (Chart 4, bottom panels), which suggests housing activity will slow. Rising mortgage rates are a problem. Since January, the quoted rates on mortgages with 90% LTV and 75% LTV are up 65bps and 70bps, respectively, which is hurting housing marginal demand. Moreover, 20% of the UK’s mortgage stock carries variable rates, which further hurts aggregate demand. Business Sector The business sector is also feeling the crunch from rapidly rising energy and input costs. It also dreads the deterioration in consumer sentiment and its implication for future final demand. Chart 5Dwindling Capex Outlook
Dwindling Capex Outlook
Dwindling Capex Outlook
Business confidence is falling abruptly. The CBI Inquiry Business Optimism measure has fallen to its lowest level since the beginning of the pandemic in 2020, when the UK GDP was contracting at a 21% annualized rate (Chart 5). Unsurprisingly, the collapse in business confidence prompted a rapid slowdown in CAPEX. The BoE’s Agents Survey reports that 40% of UK firms have unsustainably low profit margins because of rising input prices and partial pass-through. As a result of financial stress, further capex weakness is likely in the coming quarters. The impact on overall activity of these expanding worries is evident. UK industrial production has slowed very sharply and is now a meager 0.7% on an annual basis. The situation will degrade. Export growth remains strong, which is helping the business sector; however, the rapid slowdown in global industrial production indicates that UK exports will follow suit (Chart 5, second panel). This will have a knock-on effect on corporate profits (Chart 5, bottom panel), which will depress capex further. Other Considerations Chart 6No Offset From The Government
No Offset From The Government
No Offset From The Government
The problems of the private sector may be encapsulated in one indicator. After a surge that boosted GDP, the UK’s nonfinancial private sector’s credit impulse is rapidly contracting (Chart 6), which confirms that risks to activity are building. The public sector will not provide an offset. According to the IMF Fiscal Monitor’s projections, the UK’s fiscal thrust will equal -3.3% of GDP in 2022 and -1.4% in 2023, even after the small giveaways from Chancellor Rishi Sunak’s Spring Statement (Chart 6, bottom panel). Together, these developments confirm our view that UK GDP may also flirt with a recession in the coming 12 months. Bottom Line: The UK economy is facing potent headwinds and activity is set to contract over the coming quarters. Surging energy costs are hurting household consumption and businesses are cutting investment. This time around, government spending is unlikely to come to the rescue, at least not until further pain is inflicted on the UK’s private sector. The BoE expects output to contract in early 2023, with which we agree. Inflation: The Worst Of Both Worlds UK headline inflation is likely to move into double digits territory before year-end. Worrisomely, it will also be more stubborn than that of the Eurozone, because it goes beyond higher food and energy input costs. Essentially, the UK suffers from both the cost-push inflation plaguing the rest of Europe and the demand-pull inflation witnessed in the US. Chart 7Continued Pass-Through
Is UK Stagflation Priced In?
Is UK Stagflation Priced In?
The UK’s cost-push inflation will worsen in the second half of the year and could lift headline CPI above 10% by Q4 2022. Its main driver will be the Ofgem’s second energy cap increase scheduled for October, which is expected to increase household energy costs by 40%. Companies will also try to pass through a greater proportion of their rising costs to their consumers to protect their depleted margins. So far, the BoE’s Agents Survey reveals that on average, UK firms have passed through 80% of their non-labor input cost increases (Chart 7, top panel). In all the sectors surveyed, expected price increases are set to accelerate compared to the past 12 month and may even reach 14% in the manufacturing sector and 8% in the consumer goods sector (Chart 7, bottom panel). Demand-pull inflation is also present in the UK, unlike the rest of Europe, with core CPI at 5.7%, high service inflation, and rapidly rising wage growth. The key problem is an overheating labor market exacerbated by labor supply problems. By the end of 2021, the UK recorded 600 thousand inactive people more than before the pandemic, or individuals who are of working age but outside of the labor force and not seeking a job. This has compressed the labor participation rate to 63%, or the lowest level since the 2011-2012 period (Chart 8). So far, not even rapid wage gains have incentivized these persons to seek employment. The impact of Brexit further curtails the supply of labor. Since the pandemic began, the size of the working age population has decreased by 100 thousand as EU citizens have moved back home (Chart 8, second panel). Labor demand, however, is not weak. Job vacancies have surged to an all-time high of 1.3 million, or a ratio of one job vacancy per unemployed worker. Moreover, according to the BoE’s Agents Survey, the proportion of firms reporting recruitment difficulties is extremely elevated (Chart 8, third panel). As a result of weak labor supply but strong labor demand, wages are rising rapidly (Chart 8, bottom panel), with the KPMG/REC Indicator of pay higher than 6%. Chart 8Labor Market Tightness
Labor Market Tightness
Labor Market Tightness
Chart 9Poor Productivity Weighs On Trend GDP
Poor Productivity Weighs On Trend GDP
Poor Productivity Weighs On Trend GDP
Rapidly increasing wages and underlying inflation are indicative of a greater malaise. UK GDP is still 3.6% below its pre-COVID trend, while US GDP has already moved past its previous peak. Yet, wages and underlying inflation are just as strong in both economies. This suggests that the UK trend GDP has slowed more than in the US and that aggregate demand is colliding more rapidly with the constraint created by a weaker potential GDP. Labor supply is not the only culprit behind the slowdown in UK’s trend GDP. Since Brexit, UK capex has been particularly weak, which has depressed productivity growth and suppressed trend GDP further (Chart 9). Bottom Line: The BoE expects UK headline CPI inflation to move above 10% before the end of the year. We agree with this assessment. Cost-push inflation will remain strong in response to additional increases in regulated energy prices this fall and greater pass-through from businesses. Meanwhile, the labor market is overheated because of weak labor supply and surging job vacancies. The UK core inflation is likely to be sticky as Brexit weighs on the country’s trend GDP, which causes aggregate demand to surpass aggregate supply easily. Investment Implications The investment implications of the UK’s weak growth and strong inflation outlook are far reaching. Fixed Income Implications BCA’s Global Fixed Income Strategy service upgraded UK government bonds to overweight from underweight in their global fixed income portfolios. We heed this message and move to overweight UK Gilts relative to German Bunds within European fixed income portfolios. Chart 10The BoE's Dovish Justification
The BoE's Dovish Justification
The BoE's Dovish Justification
The BoE’s forecast calls for a deeply negative output gap as well as a rising rate of unemployment in 2023 and 2024. According to the BoE’s model, these dynamics will weigh on headline CPI next year (Chart 10). We take the BoE at its word when it communicated a gentler pace of rate hikes than was anticipated by the SONIA curve. The BoE believes that the weakness in the UK’s trend GDP growth weighs on the country’s neutral rate of interest. Thus, there is a limited scope before higher interest rates hurt economic activity. Since the BoE already foresees a poor growth outcome and weaker inflation next year, this view of the neutral rate logically results in a shallow path of interest rate increases. In other words, the BoE is not the Fed. This view prompts our fixed income colleagues to expect the SONIA curve to move toward the gentler rhythm of interest rate hikes proposed by the BoE. As a corollary, it implies that Gilt yields have more downside. More specifically, BCA sees room for UK-German yields spreads to narrow. Investors have expected the BoE to be significantly more hawkish than the European Central Bank (ECB), and a partial convergence in expected interest rate paths is likely. Moreover, UK yields have a higher beta than German ones. As a result, the current wave of risk aversion driven by global growth fears should cause an outperformance of UK government bonds compared to German ones. Currency Market Implications The outlook for GBP/USD depends on the evolution of overall market conditions. If risk assets remain under pressure, so will Cable. Chart 11Cable And EM Stocks
Cable And EM Stocks
Cable And EM Stocks
A durable bottom in GBP/USD will coincide with a rebound in EM equities (Chart 11). The correlation between these two assets most likely reflects the UK’s current account deficit of 2.8% of GDP in 2021. Large external financing needs render the currency very sensitive to global liquidity conditions and thus, to the dollar’s trend and global risk aversion, as is the case with EM assets. Peter Berezin, BCA Chief Global Strategist, expects global stocks to rebound in the near future, which will lift EM equities in the process. Interestingly, GBP/USD does not correlate with the relative performance of EM shares. Thus, a rebound in Cable does not contradict BCA’s Emerging Market Strategy service’s view that EM stocks are likely to underperform further in the coming months. Chart 12A Big Handicap For the GBP vs the EUR
A Big Handicap For the GBP vs the EUR
A Big Handicap For the GBP vs the EUR
BCA’s Foreign Exchange strategy team sees further upside in EUR/GBP, toward the 0.9 level. 2-year yield differentials between the UK and Germany are likely to narrow in response to the downgrade of the SONIA curve. Importantly, the wide UK current account deficit necessitates higher real interest rates to prop the pound against the euro because the Eurozone current account surplus stands at 2.3% of GDP. However, neither the 2-year nor 10-year real rates are higher in the UK than they are in the Euro Area (Chart 12). Additionally, even the nominal yield premium of UK bonds vanishes once they are hedged into euros. UK hedged 2-year bonds yield 50bps less than their German counterparts, and 10-year Gilts offer 80bps less than Bunds, which limits continental inflows into the UK. Equity Market Implications UK stocks are pro-cyclical, and their absolute performance will bottom in tandem with global equities. The near-term outlook for global equities remains clouded by the confluence of global growth fears, a weaker CNY, and tighter monetary policy around the world. Meanwhile, UK stocks are very cheap, trading at a forward P/E ratio of 11. They are tactically oversold and are lagging forward earnings (Chart 13). Relative to global equities, the performance of UK stocks will continue to track that of global energy firms compared to the broad market. The heavy exposure of UK large-cap indices to oil and gas stocks has been a major asset since energy shares have become market darlings (Chart 14). Chart 13UK Stocks Are Close To A Bottom
UK Stocks Are Close To A Bottom
UK Stocks Are Close To A Bottom
Chart 14UK Large-Caps Are About Oil
UK Large-Caps Are About Oil
UK Large-Caps Are About Oil
At the time of writing, Sweden and Finland have yet to officialize their membership application to NATO, but BCA’s Geopolitical Strategy team assigns a high probability to this outcome. Russia will not stand idly by, especially as the EU threatens to cut their oil imports. Consequently, a deeper energy embargo is increasingly likely, which should prompt a temporary but violent rally in oil and natural gas prices. This process should sustain a few more weeks of outperformance from UK large-cap shares relative to the rest of the world. Chart 15The UK vs The Eurozone: Cheap But Overbought
The UK vs The Eurozone: Cheap But Overbought
The UK vs The Eurozone: Cheap But Overbought
Structurally, UK equities are likely to remain well supported. A pullback in relative performance later this year is possible once oil prices ease off as BCA’s Commodity and Energy team expects. However, the oil market will stay tight for years to come because of the investment dearth observed since 2014-2015, when OPEC 2.0 started its market-share war. According to Bob Ryan, BCA’s Chief Commodity Strategist, it will take years of high returns in the sector to attract the capital needed to lift energy capex enough to line up supply with demand. Thus, energy remains a structurally favored sector, which will boost the cheap UK market’s appeal. UK stocks enjoy a structural tailwind relative to Euro Area shares. They remain cheap, because they still trade at a significant historical discount (Chart 15). Moreover, relative earnings are moving decisively in favor of UK stocks, something that is unlikely to change, even if the UK economy contracts. Ultimately, UK large-cap names derive the bulk of their profits from overseas and the structural tailwind of a secular commodity bull market will continue to assert itself on relative profits. Nevertheless, UK shares have also become extremely overbought, which raises the risk of a pullback in the second half of the 2022 (Chart 15, third and fourth panel). The recent outperformance of UK stocks relative to those of the Eurozone has been larger than what sectoral biases explain. An equal-sector weights version of the UK MSCI has outperformed a similarly constructed Euro Area index by 9.6% year-to-date. Chart 16Waiting For Catalysts To A Eurozone Rebound
Waiting For Catalysts To A Eurozone Rebound
Waiting For Catalysts To A Eurozone Rebound
A tactical rectification of the overbought conditions in the performance of UK equities relative to those of the Euro Area will require an ebbing of stagflation fears in the Euro Area (Chart 16, top panel). This implies that investors looking to buy Eurozone equities are waiting for a stabilization in the energy market (that is, waiting for clarity about Sweden’s and Finland’s NATO decision as well as Russia’s response). It also means that the Chinese economy must stabilize, since Eurozone equities are more sensitive to the evolution of the Chinese credit impulse than UK ones (Chart 16, second panel). Nonetheless, BCA’s Global Fixed Income Strategy team’s view on UK-German spreads is consistent with an eventual tactical pull back in the relative performance of UK stocks vis-à-vis Euro Area ones (Chart 16, bottom panel). Two pair trades make attractive vehicles to bet on an underperformance of UK stocks relative to those of the Euro Area in the second half of 2022. The first one is to sell UK financials at the expense of Euro Area financials. Historically, a decline in UK Gilt yields relative to their German equivalent strongly correlates with an underperformance of UK financials (Chart 17). The second one is to sell UK healthcare names relative to those in the Eurozone. The relative performance of healthcare shares has greatly outpaced relative earnings and is now hitting a critical resistance level (Chart 18). Moreover, UK healthcare firms are exceptionally overbought relative to their Euro Area competitors. Importantly, those two trades display little correlation to the broad market trend. Chart 17Challenges To UK Financials
Challenges To UK Financials
Challenges To UK Financials
Chart 18UK Healthcare: Running Ahead Of Itself
UK Healthcare: Running Ahead Of Itself
UK Healthcare: Running Ahead Of Itself
Finally, UK small-cap stocks are becoming attractive relative to their large-cap counterparts, although the timing remains risky. Unlike the internationally focused large-cap indices, small-cap shares are a direct bet on the health of the UK domestic economy. Hence, small- and mid-cap names have massively underperformed the FTSE-100 as market participants sniffed out the poor outlook for UK economic activity (Chart 19). They are now extremely oversold relative to large-cap names and their overvaluation has been corrected. The main problem with small-cap shares is the lack of a catalyst to rectify their oversold conditions. The most likely candidate for such a reversal would be a peak in energy inflation, considering it stands at the crux of the headwinds that UK consumption and growth face. However, energy CPI will not peak until later this fall and thus, the pain on UK households will build until then. As a result, wait for a clear sign that energy inflation recedes before entering a long UK small-cap / short UK large-cap contrarian trade (Chart 20). Chart 19Bombed Out Small-Caps...
Bombed Out Small-Caps...
Bombed Out Small-Caps...
Chart 20…Need A Peak In Energy Inflation
...Need A Peak In Energy Inflation
...Need A Peak In Energy Inflation
Bottom Line: In line with our expectations that UK growth will worsen significantly in the quarters ahead, we follow the BCA Global Fixed Income team and move to overweight UK government bonds within European fixed income portfolios. While we expect GBP/USD will bottom once global risk assets find a floor, BCA’s Foreign Exchange Strategy team also anticipates Sterling to depreciate further relative to the euro. Because of their large energy and materials exposure, UK large-cap equities will enjoy a structural outperformance relative to Euro Area large-cap indices on the back of a secular bull market in commodities. However, a temporary pullback in the UK’s relative performance is likely in the second half of 2022. Selling UK financials and UK healthcare stocks relative to their Eurozone counterparts offers a compelling approach to implement this view. Finally, UK small-caps are oversold relative to large-caps, but we recommend investors wait until energy CPI peaks when a relative rebound may emerge. Mathieu Savary, Chief European Strategist Mathieu@bcaresearch.com Tactical Recommendations Cyclical Recommendations Structural Recommendations
Executive Summary Europe's Largest Import Bill: Oil
Die Cast By EU: Inflation, Recession Risks Rise
Die Cast By EU: Inflation, Recession Risks Rise
The EU crossed the Rubicon this week, proposing to eliminate Russian oil imports within six months. The speed of putting the sanctions into effect, and Russia’s retaliation, will be critical to whether the world endures continued inflationary pressures or whether a global recession ensues. Russia indicated it will launch its own round of sanctions in the near future, which could profoundly affect not only global oil and gas markets, but once again induce input price shocks to electricity markets – which will hit firms and households again with higher prices – and agricultural markets. Turmoil in commodity markets has opened a policy debate over whether the world will be forced to migrate to a new monetary order based on access to commodities and control of commodity flows, which would replace the fiat-money architecture that succeeded the post-WWII Bretton Woods system. This debate draws together numerous trends – the centrality of commodities to price levels and inflation; central-bank policy; failed regulation at commodity exchanges; and commodity scarcity due to weak capex. Bottom Line: Commodity markets are changing rapidly as fundamentals adapt to supply tightness and an extremely erratic demand recovery. However, this does not mark the beginning of a new Bretton Woods era. Markets adapt quickly to changing fundamentals and that will continue. Feature With its proposal this week to ban the import of Russian oil, the EU crossed the Rubicon and now will prepare for an escalation of its economic war with Russia. Oil imports are, by far, the EU's largest energy import expense, and Russia is its largest supplier (Chart 1). Russian natural gas exports to Europe account for 74% of its total natgas exports, although natgas comprises a much smaller share of Russia’s revenue than oil (Chart 2). In a pecuniary sense, oil is far more important, but in an economic sense gas is more meaningful for Europe. Chart 1Europe's Largest Import Bill: Oil
Die Cast By EU: Inflation, Recession Risks Rise
Die Cast By EU: Inflation, Recession Risks Rise
Chart 2Russia's Largest Market: Europe
Die Cast By EU: Inflation, Recession Risks Rise
Die Cast By EU: Inflation, Recession Risks Rise
Russia produced 10.1mm b/d of crude and condensates in 2021. Of the 4.7mm b/d of this that Russia exported, OECD Europe was its largest customer, at 50% of total, according to the US EIA. If Russia's production is curtailed by roughly 1mm b/d this year and next year due to sanctions, we estimate Brent prices could reach $120/bbl. Losing 1.8mm this year and another 700k b/d next year could push Brent prices above $140/bbl (Chart 3). On the natgas side, one-third of the ~ 25 Tcf of Russian production last year was exported via pipeline or as LNG, based on 2021 data from the EIA. This amounted to almost 9 Tcf. Most of this – 74% – was exported via pipeline to the OECD Europe. These are dedicated volumes flowing through Russia's network into Europe. Until the Power of Siberia pipeline is expanded – likely over the next 2-3 years — this gas will not be available for export. Chart 3Losing Russian Oil Exports Will Push Prices Sharply Higher
Losing Russian Oil Exports Will Push Prices Sharply Higher
Losing Russian Oil Exports Will Push Prices Sharply Higher
Oil and gas exports last year accounted for close to 40% of the Russian government's budget. Crude and product revenue last year came in at just under $180 billion, while pipeline and LNG shipments of natgas accounted for close to $62 billion of the Russian government's revenues. Clearly, the stakes are extremely high for Russia if Europe embargoes oil imports. Escalation Of Economic War Russian Energy Minister Alexander Novak last month threatened to shut off Russian exports of natural gas if the EU cut off oil imports. Whether – or how quickly – that threat is acted upon will be critical for Europe. Speculation around the EU's proposal to embargo oil imports of all kinds from Russia centers on the ban becoming effective by the end of this week, with a six-month phase-down of imports.1 It is still possible that the sanctions will be vetoed and revised. But with Germany changing its position and now willing to embargo oil, it is only a matter of time before the majority of the EU cuts off Russian oil imports. In response, Russia will launch its own round of embargoes, which could profoundly affect not only global oil and gas markets, but once again induce input-price shocks to electricity markets – which will hit household budgets and base-metals smelters and refiners – and agricultural markets, given the large share of natgas in fertilizers (Chart 4). It is not difficult to imagine base-metals refining operations closing again in Europe, along with crop-planting delays rising.2 On the back of this collateral damage from the cut-off of Russian oil and gas exports, we would expect inflation and inflation expectations to take another leg up. This comes against a backdrop in which central banks led by the US Fed already have initiated a rate-hiking program to address inflation that is running far hotter than previously forecast. Chart 4Tight Natgas Markets Drive Fertilizer/Grain Prices Higher Power, Fertilizer, Base Metals Could Be Shocked By Russian Cut-Offs
Tight Natgas Markets Drive Fertilizer/Grain Prices Higher Power, Fertilizer, Base Metals Could Be Shocked By Russian Cut-Offs
Tight Natgas Markets Drive Fertilizer/Grain Prices Higher Power, Fertilizer, Base Metals Could Be Shocked By Russian Cut-Offs
Policymakers Reassess Commodities This turmoil in commodity markets has ignited a policy debate over whether the world will be forced to migrate to a new monetary order. The new order, so the argument goes, would be based on access to commodities and control of commodity flows and would replace the fiat-money architecture that succeeded the post-WWII Bretton Woods system. This debate draws together numerous trends – the centrality of commodities to price levels and inflation; central-bank policy; failed regulation at commodity exchanges; non-USD invoicing and funding; and commodity scarcity – particularly in industrial commodities like oil, natgas and metals due to weak capex over almost a decade. The debates around these different crises are being framed around the heightened geopolitical awareness of the critical role of commodities in the language of financial markets. This is a novel innovation; however, it essentially is an argument by analogy and can obfuscate underlying causes and effects. Bretton Woods III In The Offing? Following WW II, the US and other advanced economies launched the Bretton Woods system, under which the US would operate and maintain a commodity-money regime – i.e., the gold standard – that maintained convertability of USD to gold upon demand. This post-World War II Bretton Woods (BW) system – call it BWI – remained in place until the early 1970s and made the USD the preeminent currency in the world during that period. Literally, the system, operated by the Fed, made the USD "as good as gold." That didn't last, as US domestic exigencies – the Vietnam War and the War on Poverty – forced the US to abandon gold-convertibility and adopt a fiat-money system to finance these multiple wars. Nevertheless the dollar retained its centrality to global markets. Call this fiat system BWII. As of 2022, the dollar remains the world’s dominant reserve currency, accounting for ~ 60% of the $12.25 trillion of foreign exchange reserves, according to IMF data (Chart 5).3 As a vehicle currency, it accounts for close to 90% of daily FX trading – amounting to ~ $6 trillion/day of turnover. The dollar also is the preeminent funding and invoice currency. Trade invoicing denominated in USD accounts for 93% of imports and 97% of exports worldwide. Chart 5USD Remains Dominant Reserve Currency
Die Cast By EU: Inflation, Recession Risks Rise
Die Cast By EU: Inflation, Recession Risks Rise
According to the WTO, global trade in 2019 (just before the COVID-19 pandemic) was just shy of $19 trillion (Chart 6). This global dominance of the USD means the dollar’s funding-currency role “mediates the transmission of U.S. monetary policy to global financing conditions.”4 This has been the case for the 23 years since the creation of the euro, including the periods before and after the 2008 global financial crisis. Chart 6USD Dominates World Trade
Die Cast By EU: Inflation, Recession Risks Rise
Die Cast By EU: Inflation, Recession Risks Rise
The dollar’s importance to the global economy has only grown since the BWI era.5 Obstfeld notes US gross external assets and liabilities relative to GDP “grow sharply (but roughly commensurately) up until the global financial crisis, reaching ratios to GDP in the neighborhood of 150 percent. Since then, assets have levelled off but liabilities have continued to grow.” The dollar faces a range of challenges, as we discuss below, but any discussion must begin with its resilience as the top currency – a resilience that spans the creation of the euro, the rise of China, vast US budget and trade deficits, multiple rounds of quantitative easing, and political instability in Washington. A Return To Commodity-Based Money? The full power of the Fed's role at the center of the global monetary system – as a reserve currency and as the preeminent medium for funding and invoicing trade – was revealed following the invasion of Ukraine by Russia. The US froze Russian foreign reserves, denied it access to the international SWIFT payments system, and imposed sanctions on Russian firms and individuals, and anyone trading with them. Following the US actions, Russia's economy was partially frozen out of global trade, banking and finance. Western partners abandoned their Russian investments, taking their capital and technology out of the country. Outside of the sanctions, individual firms such as refiners, shippers and trading companies “self-sanctioned” their dealings with Russia, and refused to handle inbound or outbound Russian commodities. Given the US capability revealed, and the threat posed to other countries should the US sanction them in a likely manner, new risks to the dollar system will emerge. The primacy of the USD, and the Fed's role in maintaining its central banking position to the world, are by no means assured. Indeed, other states – namely China – will try to insulate themselves from similar sanctions. India is apparently willing to trade with Russia in rubles. Saudi Arabia is exploring being paid in RMB for oil exports to China and a wide range of states could increase their acceptance of RMB at least to cover their growing trade with China. China has been pushing hard to have its RMB recognized and used as a global reserve currency, and a trade-invoicing and trade-funding currency. For this to happen, China also would have to allow its currency to become a vehicle currency – i.e., the anchor leg in FX trading. Zoltan Pozsar, a Credit Suisse analyst, recently penned an article exploring the new terrain exposed by the Russian invasion of Ukraine and the US and EU responses.6 For Pozsar, "Commodity reserves will be an essential part of Bretton Woods III, and historically wars are won by those who have more food and energy supplies – food to fuel horses and soldiers back in the day, and food to fuel soldiers and fuel to fuel tanks and planes today." Pozsar avers that his formulation of Bretton Woods III will reverse the disinflation created by globalization, and "serve up an inflationary impulse (de-globalization, autarky, just-in-case hoarding of commodities and duplication of supply chains, and more military spending to be able to protect whatever seaborne trade is left)." These conclusions are similar to conclusions we have reached over the course of the past few years, as it became increasingly apparent that the US was losing geopolitical clout relative to rising powers, mainly China, and that the international system was becoming multipolar and unstable. The Ukraine war confirmed the new environment of Great Power Rivalry. Nation-states will indeed amass and hoard commodities as they will need to gird for battle as this rivalry heats up. Preparation for war and war itself are historically inflationary (Chart 7). Chart 7War And Preparation For War Are Inflationary
War And Preparation For War Are Inflationary
War And Preparation For War Are Inflationary
However, countries still have to pay for commodities in a currency that exporters are willing to receive. Yet the biggest global oil and food exporters depend on the US for their security, except Russia. Even in base metals the US wields extraordinary influence over the non-aligned exporters. These states could reduce their dollar invoicing to cover their share of trade with countries outside the West, but their national security alliances and partnerships imply a hard-to-change view on which economies and currencies will be most stable over the long run. The dollar is again preeminent. China unquestionably wants to diversify away from the dollar. But China’s trade partners will have a limit on how much yuan cash they are willing to hold. If they want to recycle this cash into China’s economy, China must open its capital account. But this would reduce the Communist Party’s control of the domestic economy due to the Impossible Trinity (the yuan would have to float freely). So until China makes this change, the world is stuck in today’s monetary system. By contrast, if China totally closes its system due to domestic or foreign political threats, then the world faces a recession and investors will not be rushing to sell the dollar. For now China is trying to have it both ways: maintaining large foreign exchange reserves while gradually diversifying away from the dollar (Chart 8). China selling off its Treasury holdings and dollar reserves, which began in the aftermath of the Great Recession, is the biggest monetary shift since 1999, when the euro emerged and China’s purchases of Treasuries began to surge due to trade surpluses on the back of its joining the WTO. But there is little basis for China or anyone else to abandon fiat currencies and return to the gold standard. Fiat currencies enable states to control the money supply and hence to try to control their economies and societies. The Chinese are the least likely to abandon fiat currency given their laser focus on employment, manufacturing, and social stability. China is a commodity importer, so that if it seeks to amass commodities as strategic reserves in the midst of a commodity boom, it will pay top price. This means the yuan would need to be kept strong. But in fact China is allowing the yuan to depreciate, as it would face higher unemployment and instability if domestic demand were further suppressed by a rising yuan. China is already undergoing a painful transition away from export orientation – and Beijing has already acknowledged that de-industrialization should slow down because it poses a sociopolitical threat (Chart 9). A monetary revolution that strengthens the yuan at the expense of the dollar would force an immediate conclusion to China’s transition away from export-manufacturing. That would be politically destabilizing. Chart 8China Diversifies from USD - But Closed Capital Account Prevents Global RMB
China Diversifies from USD - But Closed Capital Account Prevents Global RMB
China Diversifies from USD - But Closed Capital Account Prevents Global RMB
Chart 9Stronger RMB Would De-Industrialize China At Great Political Risk
Stronger RMB Would De-Industrialize China At Great Political Risk
Stronger RMB Would De-Industrialize China At Great Political Risk
If China or other countries attempt to create a commodity base for their currencies, but simultaneously try to prevent a fixed exchange rate that constrains their money supply, then there will be little difference from a fiat currency regime. Today’s major reserve currency issuers already possess reserves of physical wealth (e.g. commodities) beneath their flexible monetary policy regimes – this dynamic would not inherently change. Of course, Europe, Japan, and the United Kingdom are the leading providers of reserve currencies outside the US and yet they are relatively lacking in commodity reserves. If global investors begin chasing currencies primarily on the basis of commodity reserves, the USD will not suffer the most, as the United States is a resource-rich country. China’s policy and strategy may become clearer after the twentieth party congress this fall, but most likely the current contradictions will persist. China will want to prolong the period of economic engagmeent with the West for as long as possible even as it prepares for a time when engagement is utterly broken. While China knows that the US will pursue strategic containment, and US-China engagement is over, it also knows that European leaders have a different set of interests. They have enough difficulty dealing with Russia and are not eager to expand their sanctions to China. Yet switching from dollar to euro reserves offers China little protection against sanctions in any major confrontation in the coming years. A radical decision by China to buy high and sell low (realize big losses on Treasuries and buy high-priced commodities) would show that Beijing is expecting Russian-style confrontation with the West immediately, which would scare foreign investors away from China. Net foreign direct investment in China has surged since the downfall of the Trump presidency (Chart 10). But that process would reverse as companies saw China going down Russia’s path and disengaging from the global monetary system. In that context, western governments would also penalize their own companies for investing in a geopolitical rival that was apparently preparing for conflict (while buttressing Russia). In short, private capital will flee countries that abandon the global financial system because that would be an economically inefficient decision taken for reasons of state security, and hence it would imply higher odds of conflict. Wealthy nations see China’s and other emerging markets’ foreign exchange reserves as “collateral” against asset seizures and geopolitical risks: if China reduces the collateral, private capital will feel less secure flowing into China.7 Chart 10If China Abandonds USD To Prepare For Sanctions, FDI Will Reverse
If China Abandonds USD To Prepare For Sanctions, FDI Will Reverse
If China Abandonds USD To Prepare For Sanctions, FDI Will Reverse
Ultimately China will try to wean itself off the dollar – but it will keep doing so gradually to avoid a catastrophic social and economic change at home and abroad. This is continuation of post-2008 status quo. An accelerated shift away from USD will be interpreted by global actors as preparation for war (just like Russia’s shift). This will drive investors to swap Chinese assets for American or other assets. History suggests that USD devaluations followed US wars and budget expansions. Investors should wait until the next US military adventure, in Iran or elsewhere, before expecting massive dollar depreciation. If the US pursues an offshore balancing strategy, as it appears to be doing today, then other countries will become less stable and the dollar will remain appealing as a safe haven. Bottom Line: Russia’s and China’s diversification away from the dollar over the past decade has not caused global flight from the dollar. International trust in the economy and government of Russia and China is not very high. The euro, the viable alternative to the dollar, is less attractive in the face of the Ukraine war and broader geopolitical instability. The path toward monetary revolution is for China to open up its capital account, make its currency convertible, and sell USD assets while appreciating the yuan. Yet China’s leaders have not embarked on this course for fear of domestic instability. In lieu of that, the current monetary regime continues. Robert P. Ryan Chief Commodity & Energy Strategist rryan@bcaresearch.com Matt Gertken Chief Geopolitical Strategist mattg@bcaresearch.com Footnotes 1 Please see Brussels proposes EU import ban on all Russian oil published by ft.com on May 4, 2022 for summary of the EU's export-ban proposals. 2 Please see our report from March 31, 2022 entitled Germany Closer To Rationing Natgas for further discussion. It is available at ces.bcaresearch.com. 3 See Obstfeld, Maurice (2020), Global Dimensions of U.S. Monetary Policy, International Journal of Central Banking, 16:1, pp. 73-132. 4 Obstfeld (2020, p. 113). 5 Obstfeld (2020, p. 77-78). 6 Please see Pozsar, Zoltan (2022), "Money, Commodities, and Bretton Woods III," published by Credit Suisse Economics. 7 For the “collateral” interpretation of US dollar-denominated foreign exchange reserves, see Michael P. Dooley, David Folkerts-Landau, and Peter M. Garber, “US Sanctions Reinforce The Dollar’s Dominance,” NBER Working Paper Series 29943, April 2022, nber.org.
Listen to a short summary of this report. Executive Summary Second Fastest Hiking Cycle Ever?
Monthly Portfolio Update: Can The Fed Achieve A Soft Landing? Hint: It Doesn’t Have A Good Track Record
Monthly Portfolio Update: Can The Fed Achieve A Soft Landing? Hint: It Doesn’t Have A Good Track Record
Can the Fed achieve a soft landing, bringing inflation back to its 2% target without causing growth to slow significantly below trend? It has managed this only once in the past (in 2004). Every other cycle triggered a recession or, at best, a fall in the PMI to below 50. Recession is not a certainty. A higher neutral rate than in the past – partly due to the build-up of household savings – means the economy may be unusually robust this time. But the risk is high. We recommend a neutral weighting in equities, with a tilt to more defensive positioning: Overweight the US, and a focus on quality and defensive growth sectors. China’s slowdown is particularly worrying. We expect the RMB to fall, which will put downward pressure on other Emerging Markets.
Monthly Portfolio Update: Can The Fed Achieve A Soft Landing? Hint: It Doesn’t Have A Good Track Record
Monthly Portfolio Update: Can The Fed Achieve A Soft Landing? Hint: It Doesn’t Have A Good Track Record
Bottom Line: Investors should maintain low-risk portfolio positioning until the outcome of the sharp tightening of financial conditions is clearer. Recommended Allocation
Monthly Portfolio Update: Can The Fed Achieve A Soft Landing? Hint: It Doesn’t Have A Good Track Record
Monthly Portfolio Update: Can The Fed Achieve A Soft Landing? Hint: It Doesn’t Have A Good Track Record
The key to the performance of financial markets over the next year is whether the Fed and other central banks can kill inflation without killing economic growth. This is not impossible. But the risk that aggressive tightening of monetary policy triggers a recession – or at best a sharp slowdown – is high. Investors should maintain relatively low-risk portfolio positioning. If the Fed raises rates in line with what the futures market is projecting – by 286 basis points over the next 12 months – it will be the second fastest tightening on record, after only the “full Volcker” of 1980-1981 (Chart 1). Other central banks, even in countries and regions with much weaker growth than the US, are predicted to tighten almost as aggressively (Table 1). At the same time, the Fed will start to run down its balance-sheet rapidly; we estimate its holdings of US Treasurys will fall by more than $1 trillion by end-2023 (Chart 2). What was the impact on the economy of previous Fed hiking cycles? It varied, but on only one occasion in the past 50 years (2004) was there neither a recession nor a fall of the Manufacturing ISM to below 50 in the two years or so following the first hike (Table 2).1 The ISM (and other global PMIs) falling to below 50 is important because that is typically the dividing line between equities outperforming bonds and vice versa (Chart 3). Chart 1Second Fastest Hiking Cycle Ever?
Monthly Portfolio Update: Can The Fed Achieve A Soft Landing? Hint: It Doesn’t Have A Good Track Record
Monthly Portfolio Update: Can The Fed Achieve A Soft Landing? Hint: It Doesn’t Have A Good Track Record
Table 1Futures Projected Interest Rate Hikes
Monthly Portfolio Update: Can The Fed Achieve A Soft Landing? Hint: It Doesn’t Have A Good Track Record
Monthly Portfolio Update: Can The Fed Achieve A Soft Landing? Hint: It Doesn’t Have A Good Track Record
Chart 2Fed Balance-Sheet Will Shrink Rapidly Too
Fed Balance-Sheet Will Shrink Rapidly Too
Fed Balance-Sheet Will Shrink Rapidly Too
Table 2What Happened To The Economy In Fed Hiking Cycles
Monthly Portfolio Update: Can The Fed Achieve A Soft Landing? Hint: It Doesn’t Have A Good Track Record
Monthly Portfolio Update: Can The Fed Achieve A Soft Landing? Hint: It Doesn’t Have A Good Track Record
Chart 3Will PMIs Fall Below 50?
Will PMIs Fall Below 50?
Will PMIs Fall Below 50?
A recent paper by Alex Domash and Larry Summers showed that, since 1955, when US inflation was above 4% and unemployment below 5%, there was a 73% probability of recession over the next four quarters, and 100% over the next eight quarters (Table 3). On each of the three occasions when inflation was above 5% and unemployment below 4% (as is the case now), recession followed within a year. How could the Fed avoid a hard landing? Inflation could come down quickly, which would allow the Fed to ease back on tightening. As consumption switches back to services from durables, and the supply side succeeds in increasing production, the price of manufactured goods could fall (Chart 4). There were signs of this happening already in March, when US durables prices fell by 0.9% month-on-month. The problem, however, is that because of rising energy costs and lockdowns in China, the supply-side response has been delayed. The fall in semiconductor and shipping costs, which we previously argued would happen this year, is not yet clearly coming through (Chart 5). There are also signs of a price-wage spiral, with US wages rising (with a lag) in line with prices (Chart 6). Table 3This Level of Inflation And Unemployment Usually Leads To Recession
Monthly Portfolio Update: Can The Fed Achieve A Soft Landing? Hint: It Doesn’t Have A Good Track Record
Monthly Portfolio Update: Can The Fed Achieve A Soft Landing? Hint: It Doesn’t Have A Good Track Record
Chart 4Can The Price Of Durables Now Fall?
Can The Price Of Durables Now Fall?
Can The Price Of Durables Now Fall?
Chart 5Supply-Side Recovery Delayed?
Supply-Side Recovery Delayed?
Supply-Side Recovery Delayed?
The economy could be more robust than in the past, leaving it unscathed by higher rates. Our model of the equilibrium level of short-term rates is 3.2%, well above the Fed’s estimate of 2.4% (Chart 7). Our colleague Peter Berezin has argued that the neutral rate could be as high as 4%.2 In particular, the $2 trillion-plus of excess US household savings (equal to 10% of GDP) could support consumption for some years even if real wage growth is negative (Chart 8). However, there are already signs that higher rates are hurting the housing market, the most interest-rate sensitive part of the economy. The average US 30-year fixed-rate mortgage rate has risen to 5.1% from 3.2% since the start of the year. This is negatively impacting home sales and mortgage applications (Chart 9). Moreover, even if the Fed can succeed in raising rates without killing the expansion, the markets – for a while – will worry that it cannot. Chart 6A Price-Wage Spiral?
A Price-Wage Spiral?
A Price-Wage Spiral?
Chart 7Rates Are Still A Long Way Below Neutral
Rates Are Still A Long Way Below Neutral
Rates Are Still A Long Way Below Neutral
Chart 8Excess Savings Could Support The Economy
Excess Savings Could Support The Economy
Excess Savings Could Support The Economy
Chart 9Higher Rates Already Impacting Home Sales
Higher Rates Already Impacting Home Sales
Higher Rates Already Impacting Home Sales
There are clear signs of a slowdown in the global economy. Europe may already be in recession, with sentiment indicators collapsing to recessionary levels (Chart 10). More esoteric indicators, which have historically signaled slowing growth ahead, such as the Swedish new orders/inventories ratio, are also flashing a warning signal (Chart 11). Global financial conditions have tightened at the fastest pace since 2008 (Chart 12). Corporate earnings forecasts have started to be revised down for the first time in this cycle (Chart 13). Chart 10Is Europe Already In Recession?
Is Europe Already In Recession?
Is Europe Already In Recession?
Chart 1111. Signs Of Trouble Ahead
11. Signs Of Trouble Ahead
11. Signs Of Trouble Ahead
Chart 12Financial Conditions Have Tightened Significantly
Financial Conditions Have Tightened Significantly
Financial Conditions Have Tightened Significantly
Chart 13Corporate Earnings Forecasts Being Revised Down
Corporate Earnings Forecasts Being Revised Down
Corporate Earnings Forecasts Being Revised Down
But what of the argument that investors have already turned ultra-pessimistic and that all the bad news is in the price? Global equities are down only 14% from their historic peak, barely in correction territory. It is true that sentiment (historically a contrarian indicator) is very poor, with twice as many respondents to the American Association of Individual Investors’ weekly survey expecting the stock market to fall over the next six months as expect it to rise (Chart 14). But, despite investor pessimism, there are few signs that investors have made their portfolios more defensive. The same AAII survey shows little decline in equity weightings, and no big shift into cash (Chart 15). Chart 14Investors Are Very Pessimistic...
Investors Are Very Pessimistic...
Investors Are Very Pessimistic...
Chart 15...But Haven't Moved More Defensive
...But Haven't Moved More Defensive
...But Haven't Moved More Defensive
Equities: The US is the best house on a tough street. Growth is likely to remain more robust than in the euro area or Japan. The US stock market has a lower beta (Chart 16). And, while the US is more expensive, valuations do not drive the 12-month relative performance of stocks and, anyway, the US premium valuation can be justified by higher ROE and the lower volatility of profits (Chart 17). Emerging markets continue to look vulnerable to the slowdown in China and tighter US financial conditions (Chart 18). We remain underweight. Chart 16US Stocks Are Lower Risk
US Stocks Are Lower Risk
US Stocks Are Lower Risk
Chart 17US Premium Valuation Is Justified
Monthly Portfolio Update: Can The Fed Achieve A Soft Landing? Hint: It Doesn’t Have A Good Track Record
Monthly Portfolio Update: Can The Fed Achieve A Soft Landing? Hint: It Doesn’t Have A Good Track Record
Chart 18Tightening Financial Conditions Are Bad For EM
Tightening Financial Conditions Are Bad For EM
Tightening Financial Conditions Are Bad For EM
Chart 19Consumer Staples Are Defensive
Consumer Staples Are Defensive
Consumer Staples Are Defensive
Chart 20IT Earnings Will Continue To Grow Strongly
IT Earnings Will Continue To Grow Strongly
IT Earnings Will Continue To Grow Strongly
Within sectors, our preference remains for quality and defensive growth. Consumer staples tend to outperform when PMIs are falling (Chart 19) and are supported by attractive dividend yields. Information Technology is a more controversial overweight, given that it is expensive and sensitive to rising rates. Nevertheless, investment in tech hardware and software is likely to continue, giving the sector strong structural earnings growth in coming years (Chart 20). Currencies: The dollar has risen by 7.3% year-to-date driven by interest-rate differentials and the Fed being expected to be more aggressive than other central banks. But we are only neutral, since the Fed will probably not raise rates by as much as the market is pricing in, and because the dollar looks very overvalued (Chart 21). We lower our recommendation on the Chinese yuan to underweight. Interest-rate differentials with the US clearly point to it falling further – also the outcome desired by the authorities to help bolster growth (Chart 22). The likely CNY weakness will put further downward pressure on other EM currencies, particularly in Asia, given their high correlation to the Chinese currency (Chart 23). Chart 21The Dollar Is Very Overvalued
The Dollar Is Very Overvalued
The Dollar Is Very Overvalued
Chart 22Rate Differentials Point To A Weaker RMB...
Rate Differentials Point To A Weaker RMB...
Rate Differentials Point To A Weaker RMB...
Chart 23...Which Is Bad News For Other EM Currencies
...Which Is Bad News For Other EM Currencies
...Which Is Bad News For Other EM Currencies
Fixed Income: With the 10-year US Treasury yield at 2.9% and that in Germany at 0.9%, there is a stronger argument for marginally raising weightings in government bonds. We are neutral on government bonds within the (underweight) fixed-income category. Remember, though, that real yields are still negative: -0.1% in the US and -2.1% in Germany. We do not expect long-term rates to rise much over the next 6-9 months, and so remain neutral on duration. The “golden rule of bond investing” says that government bond returns are driven by whether the central bank is more or less hawkish than expected over the next 12 months (Chart 24). We would expect the Fed to be slightly less hawkish than currently forecast. US high-yield bonds offer an attractive yield pick-up – as long as US growth does not collapse. In a way, HY bonds are like defensive equities, given their high correlation with equities but beta only one-third that of equities (Chart 25). Chart 24Will The Fed Be More Or Less Hawkish Than Expected?
Will The Fed Be More Or Less Hawkish Than Expected?
Will The Fed Be More Or Less Hawkish Than Expected?
Chart 25High Yield Bonds Are Like MinVol Equities
High Yield Bonds Are Like MinVol Equities
High Yield Bonds Are Like MinVol Equities
Chart 26Russian Oil Is Going Cheap
Russian Oil Is Going Cheap
Russian Oil Is Going Cheap
Commodities: Oil prices are likely to fall back to around $90 a barrel by year-end, as demand softens and increased supply (from Saudi Arabia, UAE, and North American shale, and maybe from Venezuela and Iran) enters the market. But the risk is to the upside if this extra supply does not emerge. In particular, possible bans on Russian oil and gas into the European Union (or Russia blocking sales) could disturb the market. It will take time for Russia’s 11 million b/d of oil production, which used to go mainly to Europe, to be rerouted to Asia. This is why the Urals benchmark is at a 30% discount to Brent (Chart 26). The long-term story for industrial commodities remains good, but there is downside risk – especially for iron ore and steel – from China’s slowdown (Chart 27). Gold is an obvious hedge against geopolitical risks and high inflation. But over the past 20 years, it has been negatively correlated to real interest rates and the US dollar, suggesting upside is capped. There is a chance, however, that the relationship between rates and gold breaks down, as it did in the 1970s and 1980s (Chart 28). We, therefore, remain neutral on gold, believing that a moderate holding is a good diversifier for portfolios. Chart 27Chinese Slowdown Is Negative For Commodities
Chinese Slowdown Is Negative For Commodities
Chinese Slowdown Is Negative For Commodities
Chart 28Will Gold Start To Behave As It Did Before 1990?
Will Gold Start To Behave As It Did Before 1990?
Will Gold Start To Behave As It Did Before 1990?
Garry Evans, Senior Vice President Global Asset Allocation garry@bcaresearch.com Footnotes 1 In 2015, the ISM was already below 50 when the Fed hiked in December. 2 Please see Global Investment Strategy Report, “Is A Higher Neutral Rate Good Or Bad For Stocks?” dated March 18, 2022. Recommended Asset Allocation Model Portfolio (USD Terms)
Executive Summary German GeoRisk Indicator
German GeoRisk Indicator
German GeoRisk Indicator
Russia and Germany have begun cutting off each other’s energy in a major escalation of strategic tensions. The odds of Finland and Sweden joining NATO have shot up. A halt to NATO enlargement, particularly on Russia’s borders, is Russia’s chief demand. Tensions will skyrocket. China’s reversion to autocracy and de facto alliance with Russia are reinforcing the historic confluence of internal and external risk, weighing on Chinese assets. Geopolitical risk is rising in South Korea and Hong Kong, rising in Spain and Italy, and flat in South Africa. France’s election will lower domestic political risk but the EU as a whole faces a higher risk premium. The Biden administration is doubling down on its defense of Ukraine, calling for $33 billion in additional aid and telling Russia that it will not dominate its neighbor. However, the Putin regime cannot afford to lose in Ukraine and will threaten to widen the conflict to intimidate and divide the West. Trade Recommendation Inception Date Return LONG GLOBAL DEFENSIVES / CYCLICALS EQUITIES 2022-01-20 14.2% Bottom Line: Stay long global defensives over cyclicals. Feature Chart 1Geopolitical Risk And Policy Uncertainty Drive Up Dollar
Geopolitical Risk And Policy Uncertainty Drive Up Dollar
Geopolitical Risk And Policy Uncertainty Drive Up Dollar
The dollar (DXY) is breaking above the psychological threshold of 100 on the back of monetary tightening and safe-haven demand. Geopolitical risk does not always drive up the dollar – other macroeconomic factors may prevail. But in today’s situation macro and geopolitics are converging to boost the greenback (Chart 1). Global economic policy uncertainty is also rising sharply. It is highly correlated with the broader trade-weighted dollar. The latter is nowhere near 2020 peaks but could rise to that level if current trends hold. A strong dollar reflects slowing global growth and also tightens global financial conditions, with negative implications for cyclical and emerging market equities. Bottom Line: Tactically favor US equities and the US dollar to guard against greater energy shock, policy uncertainty, and risk-aversion. Energy Cutoff Points To European Recession Chart 2Escalation With Russia Weighs Further On EU Assets
Escalation With Russia Weighs Further On EU Assets
Escalation With Russia Weighs Further On EU Assets
Russia is reducing natural gas flows to Poland and Bulgaria and threatening other countries, Germany is now embracing an oil embargo against Russia, while Finland and Sweden are considering joining NATO. These three factors are leading to a major escalation of strategic tensions on the continent that will get worse before they get better, driving up our European GeoRisk indicators and weighing on European assets (Chart 2). Russia’s ultimatum in December 2021 stressed that NATO enlargement should cease and that NATO forces and weapons should not be positioned east of the May 1997 status quo. Russia invaded Ukraine to ensure its military neutrality over the long run.1 Finland and Sweden, seeing Ukraine’s isolation amid Russian invasion, are now reviewing whether to change their historic neutrality and join NATO. Public opinion polls now show Finnish support for joining at 61% and Swedish support at 57%. The scheduling of a joint conference between the country’s leaders on May 13 looks like it could be a joint declaration of their intention to join. The US and other NATO members will have to provide mutual defense guarantees for the interim period if that is the case, lest Russia attack. The odds that Finland and Sweden remain neutral are higher than the consensus holds (given the 97% odds that they join NATO on Predictit.org). But the latest developments suggest they are moving toward applying for membership. They fear being left in the cold like Ukraine in the event of an attack. Russia’s response will be critical. If Russia deploys nuclear weapons to Kaliningrad, as former President Dmitri Medvedev warned, then Moscow will be making a menacing show but not necessarily changing the reality of Russia’s nuclear strike capabilities. That is equivalent to a pass and could mark the peak of the entire crisis. The geopolitical risk premium would begin to subside after that. Related Report Geopolitical StrategyLe Pen And Other Hurdles (GeoRisk Update) However, Russia has also threatened “military-political repercussions” if the Nordics join NATO. Russia’s capabilities are manifestly limited, judging by Ukraine today and the Winter War of 1939, but a broader war cannot entirely be ruled out. Global financial markets will still need to adjust for a larger tail risk of a war in Finland/Sweden in the very near term. Most likely Russia will retaliate by cutting off Europe’s natural gas. Clearly this is the threat on the table, after the cutoff to Poland and Bulgaria and the warnings to other countries. In the near term, several companies are gratifying Russia and paying for gas in rubles. But these payments violate EU sanctions against Russia and the intention is to wean off Russian imports as soon as possible. Germany says it can reduce gas imports starting next year after inking a deal with Qatar. Hence Russia might take the initiative and start reducing the flow earlier. Bottom Line: If Europe plunges into recession as a result of an immediate natural gas cutoff, then strategic stability between Russia and the West will become less certain. The tail risk of a broader war goes up. Stay cyclically long US equities over global equities and tactically long US treasuries. Stay long defense stocks and gold. Stay Short CNY At the end of last year we argued that Beijing would double down on “Zero Covid” policy in 2022, at least until the twentieth national party congress this fall. Social restrictions serve a dual purpose of disease suppression and dissent repression. Now that the state is doubling down, what will happen next? The economy will deteriorate: imports are already contracting at a rate of 0.1% YoY. The manufacturing PMI has fallen to 48.1 and the service sector PMI to 42.0, indicating contraction. Furthermore, social unrest could emerge, as lockdowns serve as a catalyst to ignite underlying socioeconomic disparities. Hence the national party congress is less likely to go smoothly, implying that investors will catch a glimpse of political instability under the surface in China as the year progresses. The political risk premium will remain high (Chart 3). Chart 3China's Confluence Of Domestic And Foreign Risk Weighs On Stocks And Currency
China's Confluence Of Domestic And Foreign Risk Weighs On Stocks And Currency
China's Confluence Of Domestic And Foreign Risk Weighs On Stocks And Currency
While Chairman Xi Jinping is still likely to clinch another ten years in power, it will not be auspicious amid an economic crash and any social unrest. Xi could be forced into some compromises on either Politburo personnel or policy adjustments. A notable indicator of compromise would be if he nominated a successor, though this would not provide any real long-term assurance to investors given the lack of formal mechanisms for power transfer. After the party congress we expect Xi to “let 100 flowers bloom,” meaning that he will ease fiscal, regulatory, and social policy so that today’s monetary and fiscal stimulus can work effectively. Right now monetary and fiscal easing has limited impact because private sector actors are averse to taking risk. Easing policy to boost the economy could also entail a diplomatic charm offensive to try to convince the US and EU to avoid imposing any significant sanctions on trade and investment flows, whether due to Russia or human rights violations. Such a diplomatic initiative would only succeed, if at all, in the short run. The US cannot allow a deep re-engagement with China since that would serve to strengthen the de facto Russo-Chinese strategic alliance. In other words, an eruption of instability threatens to weaken Xi’s hand and jeopardize his power retention. While it is extremely unlikely that Xi will fall from power, he could have his image of supremacy besmirched. It is likely that China will be forced to ease a range of policies, including lockdowns and regulations of key sectors, that will be marginally positive for economic growth. There may also be schemes to attract foreign investment. Bottom Line: If China expands the range of its policy easing the result could be received positively by global investors in 2023. But the short-term outlook is still negative and deteriorating due to China’s reversion to autocracy and confluence of political and geopolitical risk. Stay short CNY and neutral Chinese stocks. Stay Short KRW South Koreans went to the polls on March 9 to elect their new president for a five-year term. The two top candidates for the job were Yoon Suk-yeol and Lee Jae-myung. Yoon, a former public prosecutor, was the candidate for the People Power Party, a conservative party that can be traced back to the Saenuri and the Grand National Party, which was in power from 2007 to 2017 under President Lee Myung-bak and President Park Geun-hye. Lee, the governor of the largest province in Korea, was the candidate for the Democratic Party, the party of the incumbent President Moon Jae-in. Yoon won by a whisker, garnering 48.6% of the votes versus 47.8% for Lee. The margin of victory for Yoon is the lowest since Korea started directly electing its presidents. President-elect Yoon will be inaugurated in May. He will not have control of the National Assembly, as his party only holds 34% of the seats. The Democratic Party holds the majority, with 172 out of 300 seats. The next legislative election will be in 2024, which means that President Yoon will have to work with the opposition for a good two years before his party has a chance to pass laws on its own. President-elect Yoon was the more pro-business and fiscally restrained candidate. His nomination of Han Duck-soo as his prime minister suggests that, insofar as any domestic policy change is possible, he will be pragmatic, as Han served under two liberal administrations. Yoon’s lack of a majority and nomination of a left-leaning prime minister suggest that domestic policy will not be a source of uncertainty for investors through 2024. Foreign policy, by contrast, will be the biggest source of risk for investors. Yoon rejects the dovish “Moonshine” policy of his predecessor and favors a strong hand in dealing with North Korea. “War can be avoided only when we acquire an ability to launch pre-emptive strikes and show our willingness to use them,” he has argued. North Korea responded by expanding its nuclear doctrine and resuming tests of intercontinental ballistic missiles with the launch of the Hwasong-17 on March 24 – the first ICBM launch since 2017. In a significant upgrade of North Korea’s deterrence strategy, Kim Yo Jong, the sister of Kim Jong Un, warned on April 4 that North Korea would use nuclear weapons to “eliminate” South Korea if attacked (implying an overwhelming nuclear retaliation to any attack whatsoever). Kim Jong Un himself claimed on April 26 that North Korea’s nuclear weapons are no longer merely about deterrence but would be deployed if the country is attacked. President-elect Yoon welcomes the possibility of deploying of US strategic assets to strengthen deterrence against the North. The hawkish turn is not surprising considering that North-South relations failed to make any substantive improvements during President Moon’s five-year tenure as a pro-engagement president. South Koreans, especially Yoon’s supporters, are split on whether inter-Korean dialogue should be continued. They are becoming more interested in developing their own nuclear weapons or at the very least deploying US nuclear weapons in South Korea. Half of South Korean voters support security through alliance with the US, while a third support security through the development of independent nuclear weapons. The nuclear debate will raise tensions on the peninsula. An even bigger change in South Korea’s foreign policy is its policy towards China. President-elect Yoon has accused President Moon of succumbing to China’s economic extortion. Moon had established a policy of “three No’s,” meaning no to additional THAAD missiles in South Korea, no to hosting other US missile defense systems, and no to joining an alliance with Japan and the United States. By contrast, Yoon’s electoral promises include deploying more THAAD and joining the Quadrilateral Dialogue (US, Japan, Australia, India). Polls show that South Koreans hold a low opinion of all of their neighbors but that China has slipped slightly beneath Japan and North Korea in favorability. Even Democratic Party voters feel more negative towards China. While negative attitudes towards China are not unique to Korea, there is an important difference from other countries: the Korean youth dislike China the most, not the older generations. Negative sentiment is less tied to old wounds from the Korean war and more related to ideology and today’s grievances. Younger Koreans, growing up in a liberal democracy and proud of their economic and cultural success, have been involved in campus clashes against Chinese students over Korean support for Hong Kong democrats. Negative attitudes towards China among the youth should alarm investors, as young people provide the voting base for elections to come, and China is the largest trading partner for Korea. Korea’s foreign policy will hew to the American side, at risk to its economy (Chart 4). Chart 4South Korean Geopolitical Risk Rising Under The Radar
South Korean Geopolitical Risk Rising Under The Radar
South Korean Geopolitical Risk Rising Under The Radar
President-elect Yoon’s policies towards North Korea and China will increase geopolitical risk in East Asia. The biggest beneficiary will be India. Both Korea and Japan need to find a substitute to Chinese markets and labor, which have become less reliable in recent years. South Korea’s newly elected president is aligned with the US and West and less friendly toward China and Russia. He faces a rampant North Korea that feels emboldened by its position of an arsenal of 40-50 deliverable nuclear weapons. The North Koreans now claim that they will respond to any military attack with nuclear force and are testing intercontinental ballistic missiles and possibly a nuclear weapon. The US currently has three aircraft carriers around Korea, despite its urgent foreign policy challenges in Europe and the Middle East. Bottom Line: Stay long JPY-KRW. South Korea’s geopolitical risk premium will remain high. But favor Korean stocks over Taiwanese stocks. Stay Neutral On Hong Kong Stocks Hong Kong’s leadership change will trigger a new bout of unrest (Chart 5). Chart 5Hong Kong: More Turbulence Ahead
Hong Kong: More Turbulence Ahead
Hong Kong: More Turbulence Ahead
On April 4, Hong Kong’s incumbent Chief Executive, Carrie Lam, confirmed that she would not seek a second term but would step down on June 30. John Lee, the current chief secretary of Hong Kong, became the only candidate approved to run for election, which is scheduled to be held on May 8. With the backing of the pro-Beijing members in the Election Committee, Lee is expected to secure enough nominations to win the race. Lee served as security secretary from when Carrie Lam took office in 2017 until June 2021. He firmly supported the Hong Kong extradition bill in 2019 and National Security Law in 2020, which provoked historic social unrest in those years. He insisted on taking a tough security stance towards pro-democracy protests. With Lee in power, Hong Kong will face more unrest and tougher crackdowns in the coming years, which will likely bring more social instability. Lee will provoke pro-democracy activists with his policy stances and adherence to Beijing’s party line. For example, his various statements to the news media suggest a dogmatic approach to censorship and political dissent. With the adoption of the National Security Law, Hong Kong’s pro-democracy faction is already deeply disaffected. Carrie Lam was originally elected as a popular leader, with notable support from women, but her popularity fell sharply after the passage of the extradition bill and National Security Law, as well as her mishandling of the Covid-19 outbreak. Her failure to handle the clashes between the Hong Kong people and Beijing damaged public trust in government. Trust never fully recovered when it took another hit recently from the latest wave of the pandemic. Putting another pro-Beijing hardliner in power will exacerbate the trend. Hong Kong equities are vulnerable not merely because of social unrest. During the era of US-China engagement, Hong Kong benefited as the middleman and the symbol that the Communist Party could cooperate within a liberal, democratic, capitalist global order. Hence US-China power struggle removes this special status and causes Hong Kong financial assets to contract mainland Chinese geopolitical risk. As a result of the 2019-2020 crackdown, John Lee and Carrie Lam were among a list of Hong Kong officials sanctioned by the US Treasury Department and State Department in 2020. Now, after the Ukraine war, the US will be on the lookout for any Hong Kong role in helping Russia circumvent sanctions, as well as any other ways in which China might further its strategic aims by means of Hong Kong. Bottom Line: Stay neutral on Hong Kong equities. Favor France Within European Equities French political risk will fall after the presidential election, which recommits the country to geopolitical unity with the US and NATO and potentially pro-productivity structural reforms (Chart 6). France is already a geopolitically secure country so the reduction of domestic political risk should be doubly positive for French assets, though they have already outperformed. And the Russia-West conflict is fueling a risk premium regardless of France’s positive developments. Chart 6France's Domestic Political Risk Will Subside But Russian War Will Keep Geopolitical Risk Elevated
France's Domestic Political Risk Will Subside But Russian War Will Keep Geopolitical Risk Elevated
France's Domestic Political Risk Will Subside But Russian War Will Keep Geopolitical Risk Elevated
The French election ended with a solid victory for the political establishment as we expected. President Emmanuel Macron gaining 58% of the vote to Marine Le Pen’s 42%. Macron beat his opinion polling by 4.5pp while Le Pen underperformed her polls by 4.5pp. A large number of voters abstained, at 28%, compared to 25.5% in 2017. The regional results showed a stark divergence between overseas or peripheral France (where Marine Le Pen even managed to get over half of the vote in several cases) and the core cities of France (where Macron won handily). Macron had won an outright majority in every region in 2017. Macron did best among the young and the old, while Le Pen did best among middle-aged voters. But Macron won every age group except the 50 year-olds, who want to retire early. Macron did well among business executives, managers, and retired people, but Le Pen won among the working classes, as expected. Le Pen won the lowest paid income group, while Macron’s margin of victory rises with each step up the income ladder. Macron’s performance was strong, especially considering the global context. The pandemic knocked several incumbent parties out of power (US, Germany) and required leadership changes in others (Japan, Italy). The subsequent inflation shock now threatens to cause another major political rotation in rapid succession, leaving various political leaders and parties vulnerable in the coming months and years (Australia, the UK, Spain). Only Canada and now France marked exceptions, where post-pandemic elections confirmed the country’s leader. The Ukraine war constitutes yet another shock but it helped Macron, as Le Pen had objective links and sympathies with Russian President Vladimir Putin. Macron’s timing was lucky but his message of structural reform for the sake of economic efficiency still resonates in contemporary France, where change is long overdue – at least compared with Le Pen’s proposal of doubling down on statism, protectionism, and fiscal largesse. The French middle class was never as susceptible to populism as the US, UK, and Italy because it had been better protected from the ravages of globalization. Populism is still a force to be reckoned with, especially if left-wing populists do well in the National Assembly, or if right-wing populists find a fresher face than the Le Pen dynasty. But the failure of populism in the context of pandemic, inflation, and war suggests that France’s political establishment remains well fortified by the economic structure and the electoral system. Whether Macron can sustain his structural reforms depends on legislative elections to be held on June 12-19. Early projections are positive for his party, which should keep a majority. Macron’s new mandate will help. Le Pen’s National Rally and its predecessors may perform better than in the past but that is not saying much as their presence in the National Assembly has been weak. Bottom Line: France is geopolitically secure and has seen a resounding public vote for structural reform that could improve productivity depending on legislative elections. French equities can continue to outperform their European peers over the long run. Our European Investment Strategy recommends French equities ex-consumer stocks, French small caps over large caps, and French aerospace and defense. Favor Spanish Over Italian Stocks Chart 7Italian And Spanish Political Risk Will Rise But Favor Spanish Stocks
Italian And Spanish Political Risk Will Rise But Favor Spanish Stocks
Italian And Spanish Political Risk Will Rise But Favor Spanish Stocks
What about Spain? It is still a “divided nation” susceptible to a rise in political risk ahead of the general election due by December 10, 2023 (Chart 7). In the past few months, a series of strategic mistakes and internal power struggles have led to a significant decline in the popularity of Spain’s largest opposition party, the People’s Party. Due to public infighting and power struggle, Pablo Casado was forced to step down as the leader of the People’s Party on February 23, as requested by 16 of the party’s 17 regional leaders. It is yet to be seen if the new party leader, Alberto Nunez Feijoo, can reboot People’s Party. The far-right VOX party will benefit from the People Party’s setback. The latter’s misstep in a regional election (Castile & Leon) gave VOX a chance to participate in a regional government for the very first time. Hence VOX’s influence will spread and it will receive greater recognition as an important political force. Meanwhile the ruling Socialist Worker’s Party (PSOE) faces anger from the public amid inflation and high energy prices. However, Spanish Prime Minister Pedro Sanchez’s decision to send offensive military weapons to Ukraine is widely supported among major parties, including even his reluctant coalition partner, Unidas Podemos. The People’s Party’s recent infighting gives temporary relief to the ruling party. The Russia-Ukraine issue caused some minor divisions within the government but they are not yet leading to any major political crisis, as nationwide pro-Ukraine sentiment is largely unified. The Andalusia regional election, which is expected this November, will be a check point for Feijoo and a pre-test for next year’s general election. Andalusia is the most populous autonomous community in Spain, consisting about 17% of the seats in the congress (the lower house). The problem for Sanchez and the Socialists is that the stagflationary backdrop will weigh on their support over time. Bottom Line: Spanish political risk is likely to spike sooner rather than later, though Spanish domestic risk it is limited in nature. Madrid faces low geopolitical risk, low energy vulnerability, and is not susceptible to trying to leave the EU or Euro Area. Favor Spanish over Italian stocks. Stay Constructive On South Africa The political and economic status quo is largely unchanged in South Africa and will remain so going into the 2024 national elections. Fiscal discipline will weaken ahead of the election, which should be negative for the rand, but the global commodity shortage and geopolitical risks in Russia and China will probably overwhelm any negative effects from South Africa’s domestic policies. Rising commodity prices have propped up the local equity market and will bring in much-needed revenue into the local economy and government coffers. But structural issues persist. Low growth outcomes amid weak productivity and high unemployment levels will remain the norm. The median voter is increasingly constrained with fewer economic opportunities on the horizon. Pressure will mount on the ruling African National Congress (ANC), fueling civil unrest and adding to overall political risk (Chart 8). Chart 8South Africa's Political Status Quo Is Tactically Positive For Equities And Currency
South Africa's Political Status Quo Is Tactically Positive For Equities And Currency
South Africa's Political Status Quo Is Tactically Positive For Equities And Currency
Almost a year has passed since the civil unrest episode of 2021. Covid-19 lockdowns have lifted and the national state of disaster has ended, reducing social tensions. This is evident in the decline of our South Africa GeoRisk indicator from 2021 highs. While we recently argued that fiscal austerity is under way in South Africa, we also noted that fiscal policy will reverse course in time for the 2024 election. In this year’s fiscal budget, the budget deficit is projected to narrow from -6% to -4.2% over the next two years. Government has increased tax revenue collection through structural reforms that are rooting out corruption and wasteful expenditure. But the ANC will have to tap into government spending to shore up lost support come 2024. Already, the ANC have committed to maintaining a special Covid-19 social-grant payment, first introduced in 2020, for another year. This grant, along with other government support, will feature in 2024 and possibly beyond. Unemployment is at 34.3%, its highest level ever recorded. The ANC cannot leave it unchecked. The most prevalent and immediate recourse is to increase social payments and transfers. Given the increasing number of social dependents that higher unemployment creates, government spending will have to increase to address rising unemployment. President Cyril Ramaphosa is still a positive figurehead for the ANC, but the 2021 local elections showed that the ANC cannot rely on the Ramaphosa effect alone. The ANC is also dealing with intra-party fighting. Ramaphosa has yet to assert total control over the party elites, distracting the ANC from achieving its policy objectives. To correct course, Ramaphosa will have to relax fiscal discipline. To this outcome, investors should expect our GeoRisk indicator to register steady increases in political risk moving into 2024. The only reason to be mildly optimistic is that South Africa is distant from geopolitical risk and can continue to benefit from the global bull market in metals. Bottom Line: Maintain a cyclically constructive outlook on South African currency and assets. Tight global commodity markets will support this emerging market, which stands to benefit from developments in Russia and China. Investment Takeaways Stay strategically long gold on geopolitical and inflation risk, despite the dollar rally. Stay long US equities relative to global and UK equities relative to DM-ex-US. Favor global defensives over cyclicals and large caps over small caps. Stay short CNY, TWD, and KRW-JPY. Stay short CZK-GBP. Favor Mexico within emerging markets. Stay long defense and cyber security stocks. We are booking a 5% stop loss on our long Canada / short Saudi Arabia equity trade. We still expect Middle Eastern tensions to escalate and trigger a Saudi selloff. Matt Gertken Chief Geopolitical Strategist mattg@bcaresearch.com Jesse Anak Kuri Associate Editor Jesse.Kuri@bcaresearch.com Yushu Ma Research Analyst yushu.ma@bcaresearch.com Guy Russell Senior Analyst GuyR@bcaresearch.com Footnotes 1 The campaign in the south suggests that Ukraine will be partitioned, landlocked, and susceptible to blockade in the coming years. If Russia achieves its military objectives, then Ukraine will accept neutrality in a ceasefire to avoid losing more territory. If Russia fails, then it faces humiliation and its attempts to save face will become unpredictable and aggressive. Strategic Themes Open Tactical Positions (0-6 Months) Open Cyclical Recommendations (6-18 Months) Regional Geopolitical Risk Matrix Geopolitical Calendar
Dear Client, This week, we present our inaugural report on ESG investing and the global energy transition. Henceforth, we will be publishing this research on the last Thursday of every month. Our principal ESG focus will be on the Environmental aspects of climate change, and the policies and actions undertaken to arrest the rise in the Earth's temperature via decarbonization. To date, the goal of Environmental policy in many jurisdictions – e.g., the US and EU – has been to disincentivize exploration, production, refining and transportation investment in hydrocarbons. At the same time, it has strongly incentivized investment in renewable-power generation. This has produced volatile marginal effects, forcing commodity markets to allocate increasingly scarce energy and metals supplies against a backdrop of increasing demand. It is at this nexus where investment opportunities will emerge. ESG's Social and Governance pillars are slower-moving change agents, with long-duration effects. Human-rights failures can destroy lives and lead to social unrest. Failed corporate governance and national governance can sharply alter firms' abilities and willingness to invest in environmentally responsible resource development. Failure in both dimensions can profoundly affect commodity supply-demand balances, and imperil the energy transition. Much of what passes for ESG measurement and compliance is self-reported – when data are available – and differs little from PR or virtue signaling. This is starting to change. Over the next 2-3 years, we expect a continued increase in government involvement in standardizing ESG reporting – cf, the SEC's recent proposal for reporting Scope 1, 2 and 3 emissions, and an increased focus on carbon pricing, which we believe will require a global carbon tax or carbon-price floor. This will be needed to incentivize investment in renewables and carbon-reduction and -capture technology, given the near-impossibility of harmonizing local and regional carbon-trading schemes. Otherwise climate clubs – i.e., trading blocs comprising states with shared ESG goals – will emerge, which will further fragment global trade. We are hopeful you will find this research useful in your decision making and investing. Bob Ryan Managing Editor, Commodity & ESG Strategy Executive Summary Fossil Fuels Dominate Global Energy Mix
Fossil Fuels Dominate Global Energy Mix
Fossil Fuels Dominate Global Energy Mix
Whether or not the SEC's proposal to disclose Scope 1, 2 and 3 emissions and other risk factors by firms it regulates will be adopted in whole or in part, we are confident it foreshadows deeper government involvement in the ESG arena in the near term in the US and EU. Carbon pricing will become increasingly important in global climate-change policy. We believe this will require a global carbon tax or carbon-price floor to incentivize investment in renewables and carbon-reduction and -capture technology. Failure to agree on at least a carbon price floor over the next 2-3 years almost surely will lead to the formation of climate clubs. In such clubs, like-minded states with similarly rigorous carbon-pricing and ESG disclosure requirements will allow trade among each other, but will levy tariffs against firms in states lacking such policies. Bottom Line: Governments are approaching a reckoning on their commitments to reduce or slow CO2 and greenhouse-gas (GHG) emissions. These are meant to hold the rise in the Earth's temperature to less than 2° C, or to approach the 1.5° C goal of the Paris Agreement. Reporting mandates like the EU's and the SEC's proposed CO2/GHG reports will help, as will increased subsidies and tax support for carbon-capture and hydrogen technology. However, a global carbon tax or carbon-price floor will be required to incentivize the investment needed to meet climate-change goals. Feature Voluntary programs and self-reporting are not reducing the concentration of CO2 and other GHGs fast enough to stay on track to meet Paris Agreement targets of holding the rise in the Earth's temperature to less than 2° C vs, pre-industrial levels, or preferably to 1.5° C. Over the next couple of years, we believe states will have to mandate additional ESG reporting – particularly on CO2 and other GHG emissions – and will require audits of programs and reports connected to GHG emissions, given the scope of what they are trying to accomplish. The EU got the ball rolling on reporting emissions, and now the US SEC is proposing new regulations as well. These will require the firms it regulates to disclose Scope 1, 2 and 3 emissions and other climate-related factors that constitute material risks to revenues and profits.1 Regardless of whether this proposal makes it through the legislative process, firms with operations in the EU will have to comply with similar reporting requirements if similar proposals are approved. Growing Energy Demand Fuels Higher CO2 Emissions World electricity demand – the principal focus of the global energy transition – grew 6% last year, on the back of strong GDP growth and weather-related demand. 2021 saw the highest electricity demand growth recorded by the IEA in the post-GFC recovery that began in 2010, amounting to 1,500 Twh year-on-year. Coal covered more than half of the growth in global electricity demand last year, and has constituted a major chunk of the electricity mix over a longer historical sample. Based on data starting in 2000, the world – primarily EM – has been net positive coal-fired power capacity (Chart 1) which reached an all-time high in 2021 as well, rising 9% y/y, while gas-fired generation grew 2%. The increase in fossil fuel generation pushed CO2 emissions globally up almost 6% to record highs. Renewable generation grew by 6% last year and is expected to meet most of the increase in electricity demand over the 2022-24 period with 8% p.a. growth, according to the IEA. Coal demand surged on the back of robust economic growth and weather-related factors, which helped propel global CO2 emissions to a record high at just over 36 billion MT in 2021, according to the IEA. This reversed the downturn in 2020 caused by the COVID-19 pandemic (Chart 2). Higher methane and nitrous oxide emissions, plus CO2 released by oil and gas flaring, lifted total energy-related GHG emissions to record levels last year as well. Chart 1Coal-Fired Power Has Been A Constant
Looking Through ESG Virtue Signaling
Looking Through ESG Virtue Signaling
Chart 2Fossil Fuels Dominate Global Energy Mix
Fossil Fuels Dominate Global Energy Mix
Fossil Fuels Dominate Global Energy Mix
We find evidence of a long-run relationship between real GDP and carbon dioxide emissions (Chart 3). This likely plays out through cointegration between oil consumption with real GDP, a relationship we exploit when estimating our monthly oil balances. While the income elasticity for emerging economies reliant on manufacturing – e.g., India and China – is positive, for the EU, a bloc of developed nations, that elasticity turns negative. This is consistent with the hypothesis of the Environmental Kuznets Curve, which states that initial increases in GDP per capita are associated with environmental degradation, however, beyond a point, income increases are associated with lower environmental damage.2 Interesting, as well, is the lack of any cointegration between GDP and US CO2 emissions. That may be due to the increased use of natgas vs. coal, and the fact that the energy intensity of US GDP continues to fall. Energy demand levels, including electricity, continues to exceed renewables supply. So even though renewable-energy generation growth is expected to meet 90% of energy demand growth from 2022 to 2024, the accumulation of CO2 and other GHGs will continue keeping the level of pollutants rising over that period. Chart 3CO2 Closely Tied To GDP
CO2 Closely Tied To GDP
CO2 Closely Tied To GDP
Recent research on global CO2 emissions growth for different countries based on historical values for population, GDP per capita and carbon intensity (measured as CO2 emissions per unit of GDP) projects median annual CO2 emissions in 2100 will be 34 Gigatons (Chart 4).3 This is significantly higher than the emissions required to keep temperature increases under 2° C by the end of the forecast period. The forecast is accompanied by four other CO2 emission scenarios provided by the Intergovernmental Panel on Climate Change (IPCC). Chart 4CO2 Projected Increases Overshoot Paris Agreement Targets
Looking Through ESG Virtue Signaling
Looking Through ESG Virtue Signaling
Carbon Tax Needed One of our high-conviction views is governments worldwide need to agree a global carbon tax that can be applied directly to CO2 emissions.4 If a global carbon tax cannot be agreed, a global carbon-price floor also could be used to incentivize the investment needed to meet climate-change goals. An IMF analysis entitled "Five Things To Know About Carbon Pricing" published in September notes: "An international carbon price floor can be strikingly effective. A 2030 price floor of $75 a ton for advanced economies, $50 for high-income emerging market economies such as China, and $25 for lower-income emerging markets such as India would keep warming below 2°C with just six participants (Canada, China, European Union, India, United Kingdom, United States) and other G20 countries meeting their Paris pledges." There may be legitimate grounds for arguing over the point at which the tax is collected – i.e., at the production or consumption stages – but, in our view, this would be far superior (and quicker to implement) than trying to harmonize the different carbon-trading schemes worldwide. In addition, the revenues generated by the tax would allow governments to protect the interests of lower-income constituencies, which are most adversely affected by such regressive taxes. We also have maintained failure to agree a carbon tax of some form over the next 2-3 years almost surely will lead to the formation of climate clubs, a notion pioneered by William Nordhaus, the 2018 Nobel Laurate.5 In Nordhaus's clubs, like-minded states with similarly rigorous carbon-pricing and ESG disclosure requirements will allow trade among each other, but will levy tariffs against firms in states lacking such measures. There is some evidence China already is preparing for this eventuality by limiting the export of high-carbon products to consumer states with strong climate-protection laws. For example, the EU last year rolled out a Carbon Border Adjustment Mechanism (CBAM), which it describes as "a climate measure that should prevent the risk of carbon leakage and supports the EU's increased ambition on climate mitigation, while ensuring WTO compatibility."6 Investment Implications Governments are moving quickly to address shortcoming in existing CO2 and GHG reduction policies. Among other things, the EU and US are proposing mandatory reporting on these emissions covering Scope 1, 2 and 3 emissions. In addition, China is refining its five-year plan to limit high-carbon exports, so that it does not run afoul of the EU's CBAM. We expect more of such measures going forward, as CO2 and GHG emissions continue to accumulate in the atmosphere at a rate that cannot be offset by existing policy. Robert P. Ryan Chief Commodity & Energy Strategist rryan@bcaresearch.com Ashwin Shyam Research Analyst Commodity & Energy Strategy ashwin.shyam@bcaresearch.com Paula Struk Research Associate Commodity & Energy Strategy paula.struk@bcaresearch.com Footnotes 1 Scope 1 covers GHG emissions firms directly generate on their own; Scope 2 applies to emissions indirectly created a purchasing electricity and other forms of energy; and Scope 3 covers indirect emissions produced up and down the firms' supply chain. These are deemed to be material risks that could impact firms' revenues and profitability, hence necessary information for investors and market participants generally. Please see SEC Proposes Rules to Enhance and Standardize Climate-Related Disclosures for Investors, published by the SEC on March 21, 2022. 2 For more information on this, please see ScienceDirect’s page on the Environmental Kuznets Curve. 3 Please see Country-based rate of emissions reductions should increase by 80% beyond nationally determined contributions to meet the 2 degree Celsius target (Liu and Rafter, 2021), published in Nature. 4 Please see Surging Metals Prices And The Case For Carbon-Capture, which we published on May 13, 2021. It is available at ces.bcaresearch.com. 5 Please see Nordhaus, William (2015), "Climate Clubs: Overcoming Free-riding in International Climate Policy," American Economic Review 105:4, pp. 1339–1370. 6 Please see Carbon Border Adjustment Mechanism: Questions and Answers, published by the European Commission on July 14, 2021. See also China issues guidelines under 14th 5-year plan to limit high-carbon product exports, published by S&P Global Platts on April 7, 2022. Platts notes this likely will be China's first FYP to include limits on "high-carbon products from the (refining and petrochemical) industry amid China's carbon neutrality journey. This comes amid expectations that foreign countries may levy tariffs like the EU's Cross Border Adjustment Mechanism, or CBAM, on such products in the future." Investment Views and Themes Recommendations Strategic Recommendations Trades Closed in 2022
Image
Executive Summary Summarizing Our Main Investment Themes In One Chart
Summarizing Our Main Investment Themes In One Chart
Summarizing Our Main Investment Themes In One Chart
Our current strategic recommendations are centered around four key themes: global inflation will slow over the rest of 2022, Europe remains too weak to handle significantly higher interest rates, corporate default risk in the US and Europe is relatively low, and the fundamental backdrop for emerging markets is poor. If we are going to be proven wrong on any of those themes, it will most likely be because global inflation remains high for longer due to resilient commodity prices and lingering supply chain disruptions. A sluggish economy will handcuff the ECB’s ability to raise rates as fast as markets are discounting over the next year. The state of corporate balance sheet health in the developed world is not problematic, on average, even with some sectors taking on more leverage in response to the 2020 COVID downturn. A sustainable rebound in EM markets would require a “perfect storm” combination of events to occur – aggressive China stimulus, a de-escalation of Russia/Ukraine tensions, a weaker US dollar and diminished global inflation pressures. Bottom Line: We remain comfortable with our main fixed income investment recommendations: maintaining neutral global portfolio duration, overweighting core European bonds versus US Treasuries, favoring high-yield corporates over investment grade (both in the US and Europe), and underweighting EM hard currency debt. Feature One of the foundations of a sound medium-term investment process is to allocate capital towards highest conviction views, while constantly assessing - and reassessing - if those views are unfolding as expected. Trades that are not going according to plan may need to be reconstructed, if not exited entirely, to avoid losses. We feel the same way about the investment recommendations highlighted in the pages of our reports, which represent our portfolio, as it were. With this in mind, in this report we identify the four most critical themes underpinning our current main investment recommendations and evaluate the potential risks that our views will not turn out as expected. Theme #1: Global Inflation Will Decline In The Latter Half Of 2022 Our biggest theme for the rest of this year is that global inflation will cool off after the massive acceleration over the past year. Many of our current fixed income investment recommendations across the developed markets – maintaining neutral overall global duration exposure, underweighting global inflation-linked bonds versus nominal government debt, betting against additional yield curve flattening (especially in the US) – are predicated on reduced inflationary pressure on interest rates. Related Report Global Fixed Income StrategyA Crude Awakening For Bond Investors The expectation of lower inflation is based on some easing of the forces that first caused the current inflationary overshoot – booming commodity prices and rapidly accelerating goods prices due to supply-chain disruptions. Already, the commodity price factor is starting to fade, on an annual rate-of-change basis that matters for overall inflation, thanks to more favorable comparisons to the commodity surge in 2021 (Chart 1). The year-over-year growth rate of the CRB index has decelerated from a peak of 54.4% in June 2021 to 19.3% today, even with many commodity prices seeing big increases in response to the Russia/Ukraine war. This is because the increases in commodity prices were even larger one year ago when much of the global economy reopened from COVID-related economic restrictions. Favorable base effect comparisons are not the only reason why commodity inflation has slowed. Commodities are priced in US dollars, and the steady appreciation of the greenback, with the trade-weighted dollar up 5% on an year-over-year basis, has also helped to slow commodity price momentum (Chart 2). Slower global growth, coming off the overheated pace of 2021, has also acted as a drag on overall commodity price inflation (middle panel). Beyond the commodity space, some easing of global supply chain tensions has resulted in indicators of shipping costs seeing meaningful declines even with supplier delivery times still elevated (bottom panel). Chart 1Our Main Strategic Theme: Decelerating Global Inflation
Our Main Strategic Theme: Decelerating Global Inflation
Our Main Strategic Theme: Decelerating Global Inflation
Chart 2Disinflationary Momentum From Commodities Already Underway
Disinflationary Momentum From Commodities Already Underway
Disinflationary Momentum From Commodities Already Underway
A more fundamental factor that should help moderate global inflation momentum this year beyond the commodity/supply chain effects relates to a lack of broad-based global "excess demand", even as the world economy continues to recover from the massive pandemic shock in 2020. The IMF’s latest projections on output gaps – estimates of the amount of spare economic capacity – show that few major developed or emerging market economies are expected to have positive output gaps over 2022 and 2023 (Chart 3). The US is the most notable exception, with an output gap projected to average +1.6% this year and next. Most other developed market countries are projected to have an output gap close to zero. This suggests that the US is facing the most inflationary pressure from an overheating economy, which is why we continue to see the Fed as being the most hawkish major developed market central bank over the next couple of years. Chart 3Few Countries Expected To Have Inflationary Output Gaps In 2022/23
Assessing The Risks To Our Main Views
Assessing The Risks To Our Main Views
Yet even with so much of the macro backdrop supporting our call for slower global inflation in the coming months, there are several potential risks to that view. Chart 4A Risk To Our Lower Inflation View: Resilient Oil Prices
A Risk To Our Lower Inflation View: Resilient Oil Prices
A Risk To Our Lower Inflation View: Resilient Oil Prices
Another war-related upleg in global oil prices Our commodity strategists continue to see oil prices settling down to the low $90s by year-end. Yet oil has seen tremendous volatility since the Ukraine war began as prices had to factor in the potential loss of Russian oil supplies in an already tight crude market. The benchmark Brent oil price briefly hit $140 in the immediate aftermath of the Russian invasion. A similar move sustained over the latter half of 2022 would trigger a reacceleration of oil momentum, putting upward pressure on overall global inflation rates. A renewed bout of energy-induced inflation would push global interest rate expectations, and bond yields, even higher from current levels – a challenge to both our neutral duration stance and underweight bias on global inflation-linked bonds (Chart 4). More supply-chain disruption from China Chinese authorities are clamping down hard on the current COVID wave sweeping across China. The current lockdowns in major cities like Shanghai could shave as much as one percentage point off Chinese real GDP growth for 2022, according to our China strategists. Those same lockdowns in a major transportation and shipping hub like Shanghai are already causing supply chain disruption within China. Supplier delivery times saw big increases in the March PMI data (Chart 5), while the number of cargo ships stuck outside Shanghai has soared. The longer this lasts, the greater the risk that supply chains beyond China would be disrupted, erasing the improvements in global supplier delivery times seen over the past few months. That could keep goods price inflation elevated for longer. Stubbornly resilient services inflation A big part of our lower inflation view is related to a rebalancing of consumer demand in the developed world away from goods towards services as economies move away from COVID restrictions. This implies an easing of the excess demand pressures that have triggered supply shortages for cars and other big-ticket consumer goods. The result would be a sharp slowing of goods price inflation, with the result that overall inflation rates in the major economies would gravitate towards the slower rate of services inflation. The latter, however, is accelerating in the US, UK and Europe (Chart 6) – largely because of soaring housing costs – which raises the risk that overall inflation will fall to a higher floor in 2022 as goods inflation slows. Chart 5Another Risk To Our Lower Inflation View: China Lockdowns
Another Risk To Our Lower Inflation View: China Lockdowns
Another Risk To Our Lower Inflation View: China Lockdowns
Chart 6One More Risk To Our Lower Inflation View: Sticky Service Prices
One More Risk To Our Lower Inflation View: Sticky Service Prices
One More Risk To Our Lower Inflation View: Sticky Service Prices
In the end, we see the balance of risks still tilted towards much slower global inflation this year. However, if we are going to be proven wrong on any of our major investment themes in 2022, it will most likely be because global inflation remains resilient for longer. Theme #2: Europe’s Economy Is Too Fragile To Handle Higher Interest Rates Beyond the global inflation call, our next highest conviction view right now is that markets are overestimating the ECB’s ability to tighten euro area monetary policy. Markets are now pricing in 85bps of ECB rate hikes by the end of 2022, according to the euro area overnight index swap (OIS) curve, which would take policy rates back to levels last seen before the 2008 financial crisis. The war has put the ECB in a difficult spot vis-à-vis its next policy move. High euro area inflation, with annual headline HICP inflation climbing to 7.4% in March and core HICP inflation reaching 2.9%, the highest level of the ECB era dating back to 1996, would justify a move to begin hiking policy interest rates as soon as possible. However, European growth momentum has slowed significantly so far in 2022. Initially this was due to the spread of the Omicron COVID variant that resulted in a wave of economic restrictions. That was followed by the shock of the Russian invasion of Ukraine, that has hit European economic confidence and raised fears that Europe would lose access to Russian energy supplies. Our diffusion indices of individual country leading economic indicators and inflation rates within the euro area highlight the pickle the ECB finds itself in (Chart 7). All countries have headline and core inflation rates above the ECB’s 2% target, yet only 60% of euro area countries have an OECD leading economic indicator that is higher than year ago levels. In the three previous tightening cycles of the “ECB era” since the inception of the euro in 1998, the diffusion indices for both growth and inflation reached 100% - in other words, every euro area economy was seeing faster growth and above-target inflation. Chart 7The ECB Will Have Difficulty Hiking As Much As Expected
The ECB Will Have Difficulty Hiking As Much As Expected
The ECB Will Have Difficulty Hiking As Much As Expected
Chart 8Warning Signs On European Growth
Warning Signs On European Growth
Warning Signs On European Growth
Other economic data are also sending worrying messages. The euro area manufacturing PMI fell to the lowest level since January 2021 in March, while the European Commission consumer confidence index and the ZEW expectations index have plunged to levels last seen during the depths of the 2020 COVID recession (Chart 8). Euro area export growth has also decelerated sharply, with exports to China contracting on a year-over-year basis. Simply put, these are not the kind of growth data consistent with a central bank that needs to begin tightening policy aggressively. The inflation data also does not paint a clean picture for the ECB. ECB President Christine Lagarde has repeatedly noted that the central bank is on the lookout for any “second round effects” from the current commodity-fueled surge in European inflation on more lasting inflationary measures like wages. On that front, European wage growth remains stunningly subdued. European annual wage growth was only 1.6% in Q4/2021, despite the unemployment rate for the whole euro area falling below the OECD’s full employment NAIRU estimate of 7.7% (Chart 9). Unit labor costs only grew at an 1.5% annual rate at the end of 2021, suggesting little underlying pressure on European inflation from wages. Chart 9No Inflationary Pressures From Wages In Europe
No Inflationary Pressures From Wages In Europe
No Inflationary Pressures From Wages In Europe
Chart 10European Bond Yields Discount Too Much ECB Hawkishness
European Bond Yields Discount Too Much ECB Hawkishness
European Bond Yields Discount Too Much ECB Hawkishness
Without a bigger inflation boost from labor costs, the ECB will feel less pressured to begin tightening monetary policy as rapidly and aggressively as markets are discounting – especially if global goods/commodity inflation slows as we expect. We remain comfortable with our overweight recommendation on core European government bonds (Germany and France), both within a global bond portfolio but especially versus the US. The Fed is far more likely to deliver the aggressive rate hikes discounted in money markets compared to the ECB (Chart 10). Theme #3: Corporate Default Risk In The US And Europe Is Relatively Low Another of our main investment themes relates to corporate credit risk. Specifically, we see high-yield debt in the US and Europe as being relatively more attractive than investment grade credit, even in a typically credit-unfriendly environment of tightening global monetary policy and slowing global growth momentum. Our Corporate Health Monitors are highlighting that corporate finances are in relatively good shape on either side of the Atlantic (Chart 11). This is primarily related to strong readings on interest coverage, free cash flow generation and profit margins, all of which are helping to service higher levels of corporate leverage. Defaults are expected to rise over the next year in response to slowing growth momentum, but the increase is projected to be moderate. Moody’s is forecasting the US and European high-yield default rates to be virtually identical, climbing to 3.1% and 2.6%, respectively, by February 2023. Those relatively low default rates, however, are for the aggregate of all high-yield borrowers. Default risks may be higher for some companies and industries that were more severely impacted by the pandemic. Chart 11US/Europe Default Risk Remains Relatively Modest
US/Europe Default Risk Remains Relatively Modest
US/Europe Default Risk Remains Relatively Modest
Chart 12The IMF Sees Fewer Financially Vulnerable Firms
The IMF Sees Fewer Financially Vulnerable Firms
The IMF Sees Fewer Financially Vulnerable Firms
Chart 13Default-Adjusted HY Spreads Still Offer Some Value
Default-Adjusted HY Spreads Still Offer Some Value
Default-Adjusted HY Spreads Still Offer Some Value
An analysis of global private sector debt included in the latest IMF World Economic Report highlighted that companies that suffered the most significant declines in revenues in 2020 also took on greater amounts of debt than companies whose businesses were least impacted by the 2020 growth shock (Chart 12). Industries that were “worst-hit” by COVID also saw significant worsening of debt servicing capability, described by the IMF analysts as the percentage of firms among the “worst-hit” that had interest coverage ratios less than one (middle panel). Importantly, the IMF report noted that the “worst-hit” industries have seen significant improvements in interest coverage since 2020, reducing the number of financially vulnerable firms (those with high debt-to-assets ratios and interest coverage less than one). The IMF analysis uses corporate data from a whopping 71 countries, but the conclusions are like those from our Corporate Health Monitors for the US and Europe – corporate credit quality has improved, on the margin, since the dark days of the 2020 COVID recession for an increasing number of borrowers. Default-adjusted spreads for high-yield bonds in the US and Europe, which subtract expected default losses from high-yield index spread levels, show that high-yield bonds currently offer decent compensation for expected credit losses (Chart 13). This is especially true for European high-yield, where the default-adjusted spread is just below the average level since 2000. This fits with our current recommendation to maintain neutral allocations to both US and European high-yield. We have a bias to favor the latter, however, due to better valuation metrics and a more dovish outlook on ECB monetary policy compared to the Fed. Theme #4: The Fundamental Backdrop For Emerging Markets Is Poor Chart 14The Backdrop Remains Challenging For EM
The Backdrop Remains Challenging For EM
The Backdrop Remains Challenging For EM
We have been negative on emerging market (EM) credit dating back to the latter months of 2021. Specifically, we are now underweight EM USD-denominated debt, both sovereigns and corporates. This is a high-conviction view and one that remains fundamentally supported. A sustainable rebound in EM markets would require a “perfect storm” combination of events to occur – aggressive China policy stimulus, a de-escalation of Russia/Ukraine tensions, a weaker US dollar and diminished global inflation pressures. While we expect the latter to occur in the coming months, there are meaningful risks to that view, as described earlier. Meanwhile, the situation in Ukraine appears to be worsening with Russia pushing the offensive and showing no desire for reengaging talks with Ukraine. Chinese policymakers are starting to respond to slowing Chinese growth, made worse by the COVID lockdowns, with some easing measures on monetary policy. Credit growth has also started to pick up, but the credit impulse remains too weak to warrant a more positive view on Chinese growth and import demand from EM countries (Chart 14). Finally, the US dollar remains well supported by a hawkish Fed and widening US/non-US interest rate differentials. This may be the most critical variable to watch before turning more positive on EM credit, given the strong historical correlation between the US dollar and EM hard currency spreads (bottom panel). For now, the trend of the US dollar remains EM-negative. Concluding Thoughts Chart 15Summarizing Our Main Investment Themes In One Chart
Summarizing Our Main Investment Themes In One Chart
Summarizing Our Main Investment Themes In One Chart
Our four main investment themes, and associated recommendations, are summarized in Chart 15. The credit-related themes – underweighting high-yield bonds in the US and Europe versus investment grade equivalents, and underweighting EM USD-denominated debt – are already performing as expected. The interest rate related themes – slower global inflation and fading European rate hike expectations – should unfold in favor of our recommendations over the balance of 2022. Robert Robis, CFA Chief Fixed Income Strategist rrobis@bcaresearch.com GFIS Model Bond Portfolio Recommended Positioning Active Duration Contribution: GFIS Recommended Portfolio Vs. Custom Performance Benchmark
Assessing The Risks To Our Main Views
Assessing The Risks To Our Main Views
The GFIS Recommended Portfolio Vs. The Custom Benchmark Index Global Fixed Income - Strategic Recommendations* Cyclical Recommendations (6-18 Months)
Assessing The Risks To Our Main Views
Assessing The Risks To Our Main Views
Tactical Overlay Trades
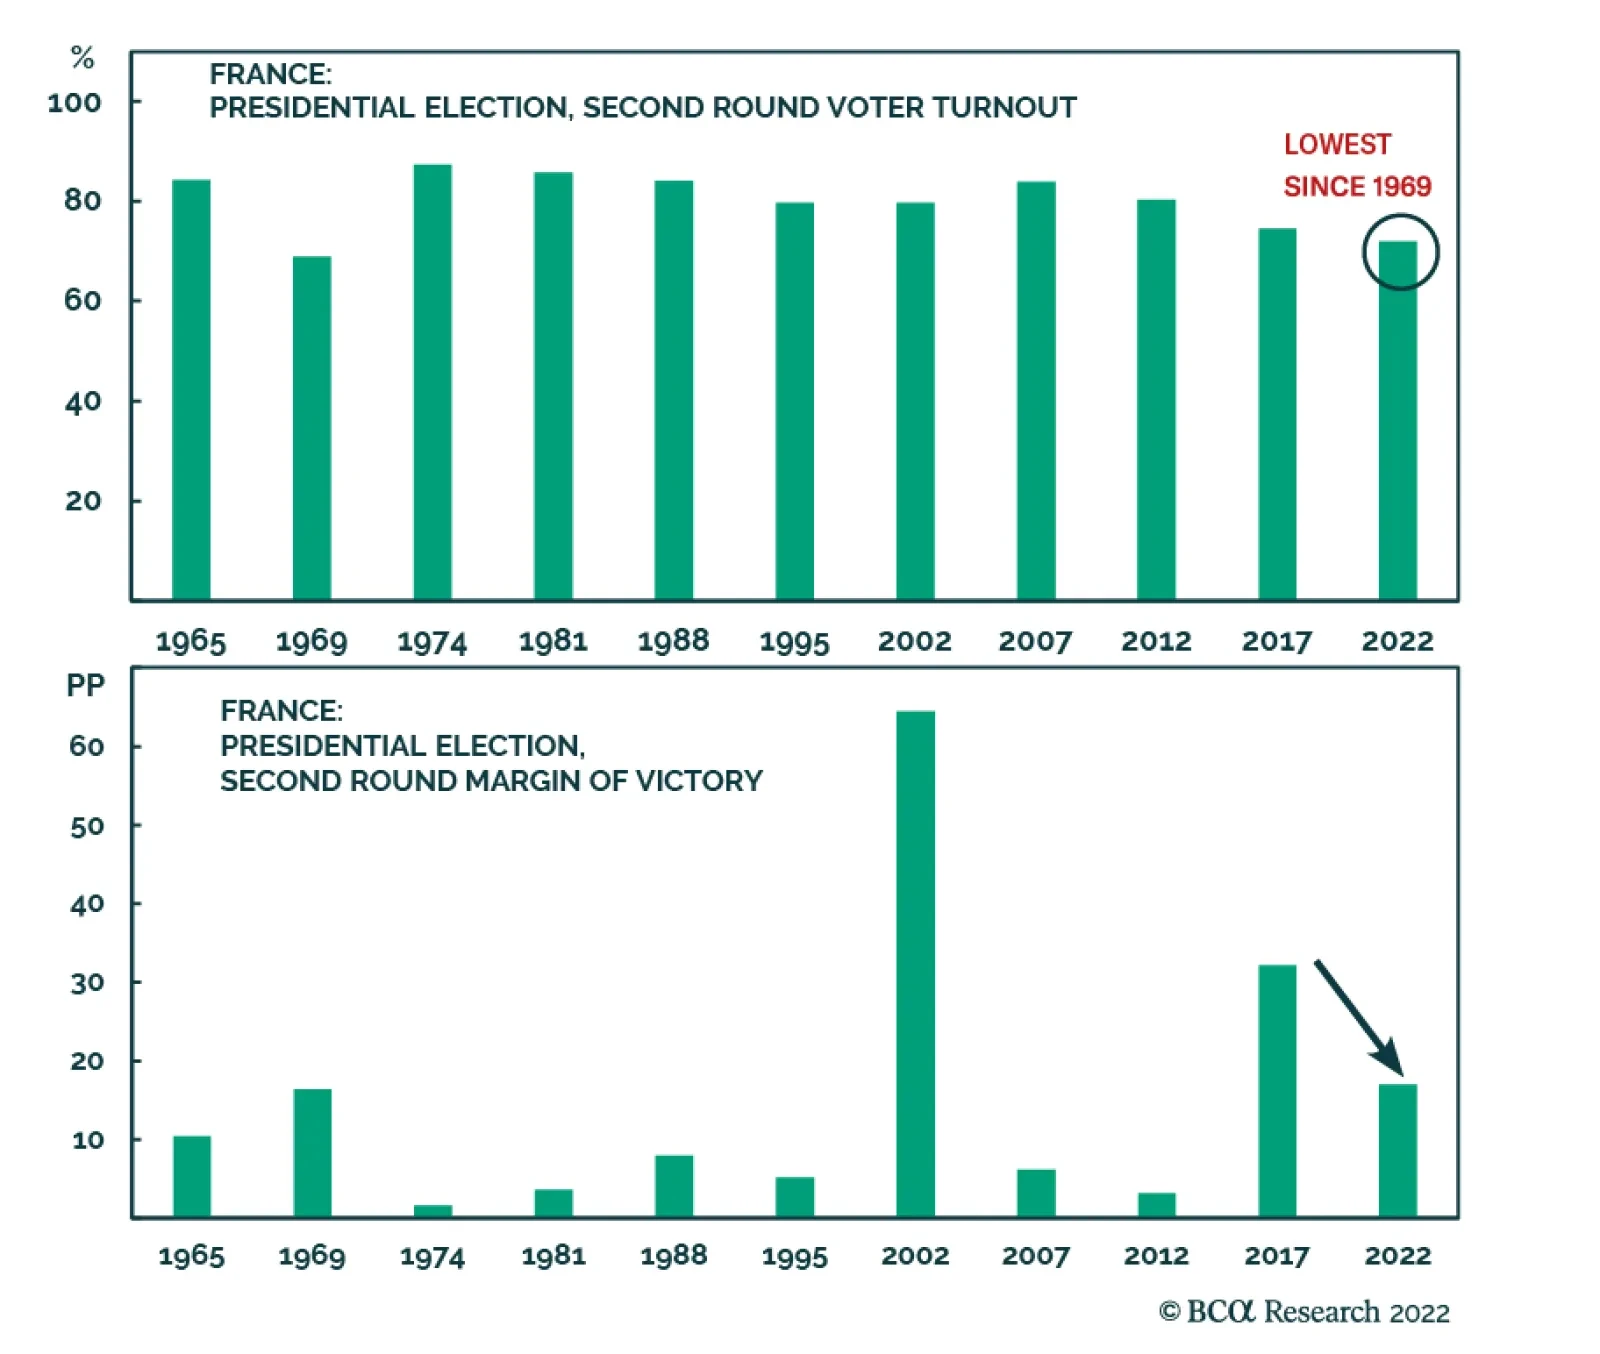
As expected, French President Emmanuel Macron secured a second term in the final round of the French presidential elections on Sunday, beating far-right rival Marine Le Pen by 58.5% to 41.5%. EUR/USD benefitted from a brief relief rally before reversing…
Executive Summary Brent Stable As Demand + Supply Fall
Brent Stable As Demand + Supply Fall
Brent Stable As Demand + Supply Fall
Oil demand growth will slow this year and next by 1.6mm b/d and 1mm b/d, respectively. These expectations are in line with sharp downgrades in World Bank and IMF economic forecasts, which cite pressures from the Ukraine War, COVID-19-induced lockdowns in China, and central-bank policy efforts to contain rising inflation. Lower oil demand will be offset by lower supply from Russia and OPEC 2.0, which now are ~ 1.5mm b/d behind on pledges to restore production taken from the market during the pandemic. In 2022, US production will increase ~750k b/d year-on-year. The strategic relationship between the US and core OPEC 2.0 producers Saudi Arabia and the UAE is fraying. The Core's unwillingness to increase production despite pleas from the Biden administration likely motivated the US’s record SPR release of 180mm barrels (1mm b/d over 6 months). This will be augmented by another 60mm-barrel release of refined products by IEA member states. The EU's threat to stop importing half of Russia's 5mm b/d of oil exports would, if realized, force Russian storage to fill, and lead to production shut-ins. Oil prices would surge to destroy enough demand to cover this loss. Our base-case Brent forecast is at $94/bbl this year and $88/bbl in 2023, leaving our forecast over the period mostly unchanged. Bottom Line: Despite major shifts in global oil supply and demand over the past month, oil markets have remained mostly balanced. We remain long commodity index exposure via the S&P GSCI index, and the COMT ETF. We also are long oil and gas producer exposure via the XOP, and base metals producers via the PICK and XME ETFs. Feature Related Report Commodity & Energy StrategyDesperate Times, Desperate Measures: Aramco And The Saudi Security Dilemma Oil demand and supply growth are weakening on the back of the Ukraine War, COVID-19-induced lockdowns in China, and central-bank efforts to contain rising inflation. We expect global demand growth to slow this year and next by 1.6mm b/d and 1mm b/d, respectively, in line with downgrades in IMF and World Bank global growth forecasts.1 Demand will fall to 100mm b/d on average this year, down from our earlier expectation of 101.5mm b/d published in March. For next year, we expect global oil consumption to come in at 102.2mm b/d, down from our March estimate of 103.2mm b/d (Chart 1). EM consumption, the engine of oil-demand growth, falls to 54.2mm b/d vs. 55.8mm b/d in last month's forecast for 2022 demand. We have been steadily lowering our estimate for 2022 Chinese demand this year due to its zero-tolerance COVID policy and its associated lockdowns, and again take it down 250k b/d in this month's balances to 15.7mm b/d on average. In our estimates, Chinese oil demand grows 2.6% from its 2021 level of 15.3mm b/d. We have been expecting DM oil consumption to flatten out this year, following massive fiscal and monetary stimulus fueling oil demand during and after the pandemic, and continue to expect it to come in at ~ 45.7mm b/d this year. Chart 1Sharply Lower Oil Demand Expected
Sharply Lower Oil Demand Expected
Sharply Lower Oil Demand Expected
Oil Supply Gets Complicated Oil supply will continue to weaken along with demand this year, primarily due to sanctions imposed on Russia by Western buyers following its invasion of Ukraine. Russia's production reportedly was just above 10mm b/d. Estimates of Russian production losses over 2022-23 range from 1mm b/d to as much as 1.7mm b/d over at the US EIA. The outlier here is the IEA, which warns Russian production will fall 1.5mm b/d this month, then accelerate to 3mm b/d beginning in May. In our base-case modeling, we expect Russian output to average 9.8mm b/d in 2022 and 9.9mm b/d next year (Chart 2). Tracking Russia's production became more complicated, as the government this week announced it no longer would be reporting these data. Prices and satellite services will be needed to impute Russia's output in the future. Russia and the Kingdom of Saudi Arabia (KSA) are the putative leaders of OPEC 2.0 (otherwise known as OPEC+). In the wake of Russia's invasion of Ukraine, OPEC, the original cartel led by KSA, continues to maintain solidarity with Russia, referring in its Monthly Oil Market Report (MOMR), for example, to the "conflict between Russian and Ukraine," or the "conflict in Eastern Europe" – not the war in Ukraine. This would suggest KSA and its allies continue to place a high value in maintaining the OPEC 2.0 structure, which has shown itself to be an extremely useful organization for managing production and production declines among non-Core states – i.e., those states outside the Gulf that cannot increase output, or are managing declining production due to lack of capital, labor or both (Chart 3). Chart 2Brent Stable As Demand + Supply Fall
Brent Stable As Demand + Supply Fall
Brent Stable As Demand + Supply Fall
Chart 3OPEC 2.0 Remains Useful To KSA And Russia
War, Lockdowns, Rate Hikes Depress Oil Demand
War, Lockdowns, Rate Hikes Depress Oil Demand
The strategic relationship between core OPEC 2.0 producers capable of maintaining higher production – KSA and the UAE – and the US is fraying. Both states showed no interest in increasing production despite pleas from the Biden administration following Russia's invasion of Ukraine, and have shown a propensity to expand their diplomatic and financial relationships, e.g., exploring oil sales denominated in Chinese RMB, beyond their US relationships.2 This likely motivated the US’s record SPR release of 180mm barrels (1mm b/d over 6 months). This will be augmented by another 60mm-barrel release of refined products by IEA member states. Outside the OPEC 2.0 coalition, we continue to expect higher output from the US, led by shale oil production. According to Rystad Energy, horizontal drilling permits in the Permian basin hit an all-time high in March.3 If these permits are converted into new projects, oil supply growth will be boosted starting 2023. The US government’s recent announcement to lease around 144,000 acres of land to oil and gas companies – in a bid to bring down high US oil prices – also will spur supply growth towards the beginning of next year.4 These bullish factors are balanced out by nearer-term headwinds. Bottlenecks resulting from pent-up demand released following global lockdowns, the Russia-Ukraine crisis, and investor-induced capital austerity means US oil producers will not be able to turn on the taps as quickly this year as they've been able to do in days gone by. Given the near-term bearish factors and longer-term bullish factors, we expect total US crude production to grow slower this year and ramp up at a faster pace the next. US shale output (i.e., Lower 48 states (L48) ex Gulf of Mexico) is expected to average 9.73mm b/d in 2022 and 10.53mm b/d in 2023 (Chart 4). Total US crude supply is expected to average 11.92mm b/d and 12.74mm b/d, respectively, over this period. Additional production increases are expected from Canada, Brazil and Norway. Chart 4Shales Continue To Pace US Onshore Output Increases
Shales Continue To Pace US Onshore Output Increases
Shales Continue To Pace US Onshore Output Increases
Upside Risk Remains KSA's and the UAE's strategy to hold off on production increases despite US entreaties upends one of our expectations – i.e., that these state would increase production as the deficit in OPEC 2.0 output being returned to the market widened. We are coming around to the idea this could represent a desire to diversify their exposure to USD payments and assets, which, as Russia's invasion of Ukraine demonstrated, can become liabilities in an economic war. This also would begin to reduce the heavy reliance KSA and the UAE place on the US vis-à-vis defending its interests.5 Lastly, we would observe KSA's and the UAE's spare capacity is being husbanded closely, given it constitutes most, if not all, of OPEC 2.0's 3.4mm b/d of spare capacity (Chart 5). There are multiple scenarios in which this spare capacity would be needed by global markets to address production outages. One of the most imposing is an EU embargo on Russian oil imports floated by France this week, which triggers a cut-off of natural gas supplies by Russia to the EU.6 An embargo of Russian oil imports by the EU is a very low-probability event, but it is not vanishingly small. The EU imports about 2.5mm b/d of Russia's crude oil exports. The EU's threat to stop importing half of Russia's 5mm b/d of oil exports would, if realized, force Russian pipelines and storage to fill, and would lead to production shut-ins. Oil prices would have to surge to destroy enough demand to cover this loss of supply, even after OPEC's spare capacity was released into the market. If realized, such an event also would throw the world into recession, in our view. The prospect of a cut-off of Russian oil imports by the EU was addressed last month by Energy Minister Alexander Novak, who said such an act would prompt Russia to shut down natural gas exports to the EU.7 If Russia follows through on such a threat, it would shut down much of the EU's industrial and manufacturing activity. The experience of this past winter – when aluminum and zinc smelters were forced to shut as natural gas prices surged and made electricity from gas-fired generation too expensive for their operations – remains fresh in the mind of the market. An oil-import ban by the EU followed by a cut-off of natgas exports by Russia almost surely would spike volatility in these markets (Chart 6). In addition, a global recession would be a foregone conclusion, in our view. Chart 5OPEC Spare Capacity Concentrated In KSA, UAE
War, Lockdowns, Rate Hikes Depress Oil Demand
War, Lockdowns, Rate Hikes Depress Oil Demand
Chart 6Oil+ Gas Volatility Would Spike If EU Cuts Russian Oil Imports
Oil+ Gas Volatility Would Spike If EU Cuts Russian Oil Imports
Oil+ Gas Volatility Would Spike If EU Cuts Russian Oil Imports
Markets Remain Roughly Balanced … For Now Our supply-demand modeling indicates production losses are roughly balanced by consumption losses at present (Chart 7). If anything, the lost demand slightly outweighs the loss of production, when we run our econometric models. However, we are maintaining a $10/bbl risk premium in our estimates for 2022-23 Brent prices, which keeps our current forecast close to last month's levels. Persistent strength in the USD, particularly in the USD real effective exchange rate, acts as a headwind on prices by making oil more expensive ex-US (Chart 8). We expect this to continue, given the Fed's avowed commitment to raise policy rates to choke off inflation, which, all else equal, will make USD-denominated returns attractive. Chart 7Markets Remain Mostly Balanced
Markets Remain Mostly Balanced
Markets Remain Mostly Balanced
Chart 8Strong USD Restrains Oil Prices
War, Lockdowns, Rate Hikes Depress Oil Demand
War, Lockdowns, Rate Hikes Depress Oil Demand
Investment Implications Despite the major shifts in oil supply and demand over the past month, markets have remained mostly balanced (Table 1). Falling Russian output and weak OPEC 2.0 production – where most states are managing production declines – is being exacerbated by falling Chinese demand and SPR releases from the US and IEA. The market does not yet need the 1.3mm b/d of Iranian output that is being held at bay due to a diplomatic impasse between the US and Iran, which we believe will persist. With overall economic output growth slowing – per the forecasts of the major supranational agencies (WTO, IMF, World Bank) – weaker demand can be expected to persist. Table 1BCA Global Oil Supply - Demand Balances (MMb/d, Base Case Balances) To Dec23
War, Lockdowns, Rate Hikes Depress Oil Demand
War, Lockdowns, Rate Hikes Depress Oil Demand
This is not to say upside risk is non-existent. A move by the EU to ban Russian oil imports could set in motion sharply higher oil and gas prices and a deep EU recession, as discussed above. This could trigger an immediate need for OPEC spare capacity and those Iranian barrels waiting to return to export markets. We remain long commodity index exposure via the S&P GSCI index, and the COMT ETF. We also are long oil and gas producer exposure via the XOP, and base metals producers via the PICK and XME ETFs. Robert P. Ryan Chief Commodity & Energy Strategist rryan@bcaresearch.com Ashwin Shyam Research Analyst Commodity & Energy Strategy ashwin.shyam@bcaresearch.com Paula Struk Research Associate Commodity & Energy Strategy paula.struk@bcaresearch.com Commodity Round-Up Energy: Bullish Russia's concentration of exposure to OECD Europe – as customers for its energy exports – exceeds the latter's concentration of imports from Russia by a wide margin. Russia produced 10.1mm b/d of crude and condensates in 2021. Of the 4.7mm b/d of this Russia exported last year, OECD Europe was its largest customer, accounting for 50% of total oil exports, according to the US EIA (Chart 9). On the natgas side, more than one-third of the ~ 25 Tcf of natgas produced by Russia last year was exported via pipeline or as LNG, based on 2021 data from the EIA. This amounted to almost 9 Tcf. Most of this – 84% – was exported via pipeline to the OECD Europe, with the biggest customers being Germany, Turkey, Italy and France. As is the case with crude oil and liquids, OECD Europe is Russia's biggest natgas customer, accounting for ~ 75% of exports in either gaseous or liquid form. There is an argument to be made Russia needs OECD Europe as much or more than the latter needs Russia. Ags/Softs: Neutral Grains and vegetable oils are at multi-year or all-time highs, as a result of the war in Ukraine. This week, corn futures hit the highest since 2012, while wheat futures surged amid the ongoing war and unfavorable weather in U.S. growing areas. The U.N. Food and Agriculture Organization's Food Price Index rose 12.6% from February, its highest level since 1990. According to the FAO, the war in Ukraine was largely responsible for the 17.1% rise in the price of grains, including wheat and corn. Together, Russia and Ukraine account for around 30% and 20% of global wheat and corn exports. The cost of fertilizers has increased by almost 30% in many places due to the supply disruptions caused by the war and the tightening of natural gas markets, which is being driven by EU efforts to diversify away from Russian imports of the commodity.8 Planting is expected to be very irregular in the upcoming grain-sowing months, navigate through much higher prices for fuel and fertilizers (Chart 10). Chart 9
War, Lockdowns, Rate Hikes Depress Oil Demand
War, Lockdowns, Rate Hikes Depress Oil Demand
Chart 10
Wheat Price Level Going Down
Wheat Price Level Going Down
Footnotes 1 Please see the IMF's April 2022 World Economic Outlook report entitled War Sets Back the Global Recovery, and the World Bank's Spring Meetings 2022 Media Roundtable Opening Remarks by World Bank Group President David Malpass, posted on April 18, 2022. 2 Please see, e.g., Saudi Arabia Considers Accepting Yuan Instead of Dollars for Chinese Oil Sales published by wsj.com on March 15, 2022. 3 Please see Permian drilling permits hit all-time high in March, signaling production surge on the horizon, published by Rystad Energy on April 13, 2022. 4 Please see Joe Biden resumes oil and gas leases on federal land, published by the Financial Times on April 15, 2022. 5 Please see Desperate Times, Desperate Measures: Aramco And The Saudi Security Dilemma, which we published on January 14, 2014. In that report, we noted, "… the U.S. has decided to stop micromanaging the Middle East. The latter policy sucked in too much of Washington's material resources, blood and treasure, at a time when regional powers like China and Russia were looking to establish their own spheres of influence in East Asia and Eurasia respectively." Building deeper commercial relationships with China also would bind both states together in terms of addressing KSA's security concerns, given China's existing relationships with Iran. This is a longer-term strategy, in our view. 6 Please see An EU embargo on Russian oil in the works - French minister, published by reuters.com on April 19, 2022. 7 Please see War in Ukraine: Russia says it may cut gas supplies if oil ban goes ahead, published by bbc.co.uk on March 8, 2022. 8 Please refer to Food prices soar to record levels on Ukraine war disruptions, published by abcNEWS on April 8, 2022. Investment Views and Themes Strategic Recommendations Trades Closed in 2022
Image
Executive Summary A Good Time For A Pause In The Bond Bear Market
A Good Time For A Pause In The Bond Bear Market
A Good Time For A Pause In The Bond Bear Market
The global government bond selloff looks stretched from a technical perspective, and a consolidation phase is likely over the next few months as global growth and inflation momentum both roll over. Central banks are starting to turn more aggressive on the pace of rate hikes in the face of elevated inflation expectations, as evidenced by the 50bp rate hikes in Canada and New Zealand last week (and the likely similar move the Fed next month). However, forward pricing of policy rates over the next 12-18 months is already at or above policymaker estimates of neutral in most developed countries. Global bond yields will be capped until central banks and markets revise higher their estimates of neutral policy rates. This is more a 2023/24 story than a 2022 story. Interest rate expectations are too high in Canada. High household debt will limit the ability for the Bank of Canada to match the Fed’s rate hikes during the current tightening cycle without bursting the Canadian housing bubble. Bottom Line: Maintain a neutral stance on overall global duration exposure. Upgrade Canadian government bonds to neutral (3 out of 5) in global bond portfolios, ideally funded out of US Treasury allocations. How To Interpret Rising Real Bond Yields Chart 1Bonds Under Pressure From Both Inflation & Real Yields
Bonds Under Pressure From Both Inflation & Real Yields
Bonds Under Pressure From Both Inflation & Real Yields
The sharp rise in global government bond yields seen so far in 2022 has been driven by both rising inflation expectations and higher real yields (Chart 1). The former is a function of the war-fueled surge in oil prices at a time of high realized inflation, while the latter is a consequence of expectations for tighter monetary policy to fight that inflation. The magnitude of the yield increases seen year-to-date is surprising given the downgrades to global growth expectations. Just this week, the IMF downgraded its growth forecasts for the second time this year. It now expects global growth to reach 3.6% in both 2022 and 2023, shaving 0.8 and 0.2 percentage points, respectively, from the last set of yearly forecasts made back in January. The World Bank similarly chopped its growth forecast for 2022 to 3.2% from 4.1%. Spillovers from the Russia/Ukraine war were the main factor behind the downgrades, including more aggressive monetary tightening by global central banks in response to commodity-fueled inflation. We’re already seeing a faster pace of rate hikes from developed market central banks. The Bank of Canada (BoC) and Reserve Bank of New Zealand (RBNZ) lifted policy rates by 50bps last week and the Fed is signaling a similar move in May. Not all policymakers are sending hawkish signals, however. The ECB last week opted to not commit to the timing and pace of any future moves on rates, while the Bank of Japan has pledged to maintain monetary stimulus measures even in the face of a collapsing yen. Related Report Global Fixed Income StrategyPolicymakers Face The No-Win Scenario While government bond yields have risen across the developed world so far in 2022, the drivers of the yield increase have not been the same in all countries when looking at moves in benchmark 10-year nominal and inflation-linked bonds (Chart 2). About three-quarters of the nominal yield moves seen year-to-date in the US (+134bps), Canada (+136bps) and Australia (+130bps) have come from higher real yields, while the increase in the Gilt yield (+92bps) was more of an equal split between real yields and inflation breakevens. In Germany (+102bps) and Japan (+17bps), the upward move in 10-year yields this year has all been from higher breakevens, as real yields have fallen in both countries. Chart 2Real Yields (ex-Europe/Japan) Driving Nominal Yields Higher In 2022
Global Bond Yields Take A Breather
Global Bond Yields Take A Breather
In the US, Canada and UK – three countries where central banks have delivered rate hikes this year and are promising to do more – real yields have been highly correlated to rising interest rate expectations for the next two years taken from overnight index swap (OIS) curves (Chart 3). Meanwhile, in Germany, Japan and Australia - where central banks have kept rates steady and not sending strong messages on when that will change – the correlation between real yields and OIS-derived interest rate expectations has not been as strong (Chart 4). Chart 3Rising Real Yields Where Central Banks Have Been Hiking
Rising Real Yields Where Central Banks Have Been Hiking
Rising Real Yields Where Central Banks Have Been Hiking
Chart 4More Stable Real Yields Where CBs Are More Dovish
More Stable Real Yields Where CBs Are More Dovish
More Stable Real Yields Where CBs Are More Dovish
Chart 5Real Rate Expectations Have Risen Much Faster In The US
Global Bond Yields Take A Breather
Global Bond Yields Take A Breather
The link between interest rate expectations and real yields is intuitive after factoring in inflation expectations. In Chart 5, we show actual real interest rates (policy rates minus headline CPI inflation) in the US, euro area and UK, as well as a “market-based” measure of real interest rate expectations derived as the difference between forward rates from the nominal OIS and CPI swap curves (the dotted lines). The current path for real rates is the black dotted line, while the path as of the start of 2022 is the green dotted line. In all three countries, the market-derived path for real rates over the next decade has shifted upward since the start of the year, which is consistent with a rising path for real bond yields. Yet the largest move has been in the US where real rates are expected to average around zero over the next ten years. This lines up logically with the more hawkish messaging on rates from the Fed, leading to a repricing of the 10-year TIPS yield from -1% at the start of the year to a mere -0.04% today. By contrast, real rate expectations and real yields remain negative in the euro area and UK, as both the ECB and Bank of England have been much less hawkish compared to the Fed in terms of signaling the timing and magnitude of future rate hikes. We have long flagged deeply negative real bond yields, especially in the US, as the greatest source of vulnerability for global bond markets. Such yield levels can only be sustained in a rising inflation environment if central banks deliberately keep policy rates below inflation for a long time. The Fed was not going to allow that to happen with inflation reaching levels not seen since the early 1980s, leaving US Treasuries vulnerable to a sharp repricing of fed funds rate expectations that would drive real bond yields higher. Looking ahead, we do not expect to see much additional bearish repricing of global rate expectations and real yields over the rest of 2022, for the following reasons: Global growth momentum is slowing The combined shock of geopolitical uncertainty from the Ukraine war, high oil prices and tightening global monetary policy – in addition to the expected slump in Chinese growth due to the latest wave of COVID lockdowns – has damaged economic confidence. The April reading from global ZEW survey of professional forecasters and investors showed another modest decline in US and euro area growth expectations after the huge drop in March (Chart 6). Interestingly, the ZEW survey also showed a big decline in the net number of respondents expecting higher inflation and a small dip in the number of respondents expecting higher bond yields – both potential signals that the increase in global bond yields is ready to pause. Medium-term US inflation expectations have remained relatively contained The sharp run-up in US inflation has boosted survey-based measures of inflation expectations, although the increase has been much higher for shorter-term expectations (Chart 7). One-year-ahead inflation expectations from the University of Michigan and New York Fed consumer surveys have doubled over the past year and now sit at 6.6% and 5.4%, respectively. Yet the 5-10 year ahead inflation expectation from the Michigan survey has seen a much smaller increase and is holding stable around 3%. The 5-year/5-year forward TIPS breakeven is at even less worrisome levels and now sits at a trendline resistance level of 2.4% (bottom panel). Chart 6ZEW Survey Shows Weaker Growth & Inflation Expectations
ZEW Survey Shows Weaker Growth & Inflation Expectations
ZEW Survey Shows Weaker Growth & Inflation Expectations
Chart 7Medium-Term US Inflation Expectations Have Not Broken Out
Medium-Term US Inflation Expectations Have Not Broken Out
Medium-Term US Inflation Expectations Have Not Broken Out
US inflation is showing early signs of peaking Year-over-year headline US CPI inflation reached another cyclical high of 8.6% in March. However, core CPI inflation rose by a less-than-expected +0.3% on the month and the year-over-year rate of 6.5% was essentially unchanged versus the February level (Chart 8). Used car prices, a huge driver of the surge in US goods inflation in 2021, fell by a sizeable -3.8% in March, the second consecutive monthly decrease. Chart 8A Peak In US Core Inflation?
A Peak In US Core Inflation?
A Peak In US Core Inflation?
Chart 9Housing Cost Inflation Is A Global Problem
Housing Cost Inflation Is A Global Problem
Housing Cost Inflation Is A Global Problem
We expect US consumer spending to shift more towards services from goods over the next 6-12 months, which should lead to overall US inflation rates converging more towards lower services inflation. Services inflation is still well above the Fed’s inflation target, however, particularly with shelter inflation – one-third of the overall US CPI index – now at 5.0% and showing no signs of slowing. Chart 10A Good Time For A Pause In The Bond Bear Market
A Good Time For A Pause In The Bond Bear Market
A Good Time For A Pause In The Bond Bear Market
Rising housing costs are not only a problem in the US, and house prices and valuations have soared across the developed world (Chart 9). This suggests that housing and rental costs will remain an important driver of underlying inflation in many countries, not just the US. Summing it all up, we continue to see conditions conducive to a period of relative global bond market stability, with government bond yields remaining rangebound over the next several months. The stimulus for higher yields – from even more hawkish repricing of central bank expectations, even higher real bond yields or additional increases in inflation expectations – is not evident. Bond yields look stretched from a technical perspective, and our Global Duration Indicator continues to signal that global yield momentum should soon peak (Chart 10). Bottom Line: Maintain a neutral stance on overall global bond portfolio duration. Upgrade Canadian Government Bonds To Neutral The Bank of Canada (BoC) hiked its policy interest rate by 50bps last week to 1%, the first rate increase of that size since 2000. The BoC also announced that it will begin quantitative tightening of its balance sheet at the end of April when it stops buying Canadian government bonds to replace maturing debt it currently owns. In the press conference explaining the move, BoC Governor Tiff Macklem noted that the central bank now saw the Canadian economy in a state of “excess demand” with inflation that was “expected to be elevated for longer than we previously thought” and that “the economy could handle higher interest rates, and they are needed.” Chart 11Canadian Growth Momentum Peaking?
Canadian Growth Momentum Peaking?
Canadian Growth Momentum Peaking?
This is a very clear hawkish message from Macklem, who hinted that the BoC may have to lift rates above neutral for a period to bring Canadian inflation back down to the central bank’s target. We have our doubts that the BoC will be able to raise rates that far, and keep them there for long, before inflation pressures ease. The BoC Business Outlook Survey plays an important role in the central bank’s policy decisions. The survey for Q1/2022 showed dips in the overall survey, and the individual components related to sales growth expectations, investment intentions and hiring plans (Chart 11). There were even small drops in the net number of survey respondents seeing intense labor shortages and expecting faster wage growth (bottom panel). The moves in these survey components were modest, but they are important coming after the relentless upward rise since the trough in mid-2020. Importantly, this survey was conducted before the Russian invasion of Ukraine, which likely provided an additional drag on business confidence. The components of the Business Outlook Survey related to prices and costs continued to show that Canadian firms are facing lingering capacity constraints and intense cost pressures from both labor and supply chain disruption. A net 80% of respondents – a survey record – report they would have some or significant difficulty meeting an unexpected increase in demand. A net 35% of respondents in the Q1/2022 survey cited “labor cost pass through” as a source of upward pressure on their output prices, a huge jump from the Q4/2022 reading of 19% (Chart 12). Also, a net 33% of respondents noted “non labor cost pass through”, i.e. higher prices due to supply chain disruption, as a source of pressure on output prices. Only a net 12% of respondents cited strong demand as a source of pressure on prices, and the net balance of respondents noting that the competitive environment was inflationary was effectively zero. Chart 12Canadian Businesses See More Cost-Push Inflation Pressures
Global Bond Yields Take A Breather
Global Bond Yields Take A Breather
The two main messages from the Business Outlook Survey are: a) Canadian growth momentum likely cooled in Q1, and b) Canadian inflation pressures remain significant, but are more supply driven than demand driven. Overall Canadian inflation is still accelerating rapidly, with headline CPI hitting an 31-year high of 5.7% in February. Underlying measures of inflation are more subdued, but still elevated: the BoC’s CPI-trim and CPI-median measures are at 4.3% and 3.5%, respectively, both above the BoC’s 1-3% target band (Chart 13). Chart 13Mixed Messages On Canadian Inflation Expectations
Mixed Messages On Canadian Inflation Expectations
Mixed Messages On Canadian Inflation Expectations
There are more mixed messages coming out of Canadian inflation surveys. The 1-year-ahead inflation expectation from the BoC’s Survey of Consumer Expectations climbed to 5.1% in Q1/2022 from 4.9% in Q4, while the 5-year-ahead expectation dropped to 3.2% from 3.5%. The 10-year breakeven inflation rate on Canadian inflation linked bonds is even lower, now sitting near at 2.2%. There are also very mixed signals on wage expectations, even with the Canadian unemployment rate dropping to a record low of 5.3% in March. Canadian consumers expect wage growth to reach 2.2% over the next year, below the latest reading on actual wage growth of 2.5% and far below the 5.2% growth expected by Canadian businesses (bottom panel). If medium-term consumer inflation expectations are not rising in the current high inflation environment, and consumer wage expectations are not increasing with a record-low unemployment rate, then the BoC can potentially move slower than markets expect on rate hikes over the next year if realized inflation peaks. On that front there are tentative signs of optimism. When breaking down Canadian inflation into goods and services components, both are still accelerating rapidly (Chart 14). Goods inflation reached 7.6% in February, while services inflation hit 3.8%. However, the pace of year-over-year inflation for some key durable goods components like new cars, household appliances and furniture – items that saw demand and prices increase during the worst of the pandemic – appears to have peaked (middle panel). This may be a sign that overall goods inflation is set to roll over, similarly to what we expect in the US in the coming months. Also like the US, services inflation is less likely to decelerate, as rent inflation is accelerating and the housing cost component of Canadian inflation (home replacement costs) is still expanding at a 13.2% annual rate. On that note, housing remains the key component to watch to determine the BoC’s next move, given highly levered household balance sheets exposed to house prices and higher mortgage rates. The robust strength of the Canadian housing market has driven house prices to some of the most overvalued levels among the developed economies. There is a speculative aspect to the housing boom, with Canadian households expecting house prices to appreciate by 7.1% over the next year according to the BoC consumer survey (Chart 15). Canadian housing demand has also become more sensitive to rate increases by the choice of mortgages. 30% of outstanding mortgages are now variable rate, up from 18% at the start of the pandemic in 2020 after the BoC cut rates to near-0%. Chart 14The Goods-Driven Canadian Inflation Surge May Be Peaking
The Goods-Driven Canadian Inflation Surge May Be Peaking
The Goods-Driven Canadian Inflation Surge May Be Peaking
Chart 15BoC Rate Hikes Will Cool Off Canadian Housing
BoC Rate Hikes Will Cool Off Canadian Housing
BoC Rate Hikes Will Cool Off Canadian Housing
During the BoC’s last rate hiking cycle in 2017-19, national house price inflation slowed from 15% to 0%. Policy rates had to only reach 1.75% to engineer that outcome. With household balance sheets even more levered today, and with greater exposure to variable rate mortgages, it is unlikely that a policy rate higher than the previous cycle peak will be needed to cool off house price growth – an outcome that should also dampen Canadian services inflation with its large housing related component. In addition to the rate hike at last week’s policy meeting, the BoC also announced the results of its annual revision to its estimated range for the neutral policy rate. The range is now 2-3%, up slightly from 1.75%-2.75%. The current pricing of interest rate expectations from the Canadian OIS curve has the BoC lifting rates to the high-end of that new neutral range by the first quarter of 2023, then keeping rates near those levels over at least the next five years (Chart 16). Chart 16Markets Expect The BoC To Keep Rates Elevated For Longer
Global Bond Yields Take A Breather
Global Bond Yields Take A Breather
Chart 17Upgrade Canadian Government Bonds To Neutral
Upgrade Canadian Government Bonds To Neutral
Upgrade Canadian Government Bonds To Neutral
We doubt the BoC will be able to raise rates all the way to 3% without inducing instability in the housing market. More importantly, the current surge in inflation is not becoming embedded in medium-term inflation and wage expectations – outcomes that would require the BoC to keep policy rates at the high end of its neutral range or even move them into restrictive territory. Turning to bond strategy, we have had Canada on “upgrade watch” in recent weeks, with rate hike expectations looking a bit too aggressive. We now see it as a good time to pull the trigger on that upgrade. Thus, this week, we are moving our recommended exposure to Canadian government bonds to neutral (3 out of 5) from underweight (Chart 17). We are “funding” that move in our model bond portfolio by reducing exposure to US Treasuries (see the tables on pages 15-16), as we see the Fed as being more likely than the BoC to deliver on the rate hike expectations discounted in OIS curves. A move to an outright overweight stance, versus all countries and not just the US, will be appropriate once Canadian inflation clearly peaks and interest rate expectations begin to decline. It is too soon to make that move now, but we will revisit that call later this year. Bottom Line: Interest rate expectations are too high in Canada with medium-term inflation expectations relatively subdued. High household debt in Canada will limit the ability for the Bank of Canada to match the Fed’s rate hikes during the current tightening cycle without bursting the Canadian housing bubble. Upgrade Canadian government bonds to neutral (3 out of 5) in global bond portfolios, ideally funded out of US Treasury allocations. Robert Robis, CFA Chief Fixed Income Strategist rrobis@bcaresearch.com GFIS Model Bond Portfolio Recommended Positioning Active Duration Contribution: GFIS Recommended Portfolio Vs. Custom Performance Benchmark
Global Bond Yields Take A Breather
Global Bond Yields Take A Breather
The GFIS Recommended Portfolio Vs. The Custom Benchmark Index Global Fixed Income - Strategic Recommendations* Cyclical Recommendations (6-18 Months)
Global Bond Yields Take A Breather
Global Bond Yields Take A Breather
Tactical Overlay Trades