Euro Area

Executive Summary Ebbing Stagflation Fear Will Prompt Rerating
Ebbing Stagflation Fear Will Prompt Rerating
Ebbing Stagflation Fear Will Prompt Rerating
European inflation will rise further before peaking this summer. Core CPI will reach between 2.8% and 3.2% by year-end before receding. The combination of stabilizing growth and the eventual peak in inflation will cause stagflation fears to recede. European assets have greater upside. Cyclicals, small-caps, and financials will be major beneficiaries of declining stagflation fears. The underperformance of UK small-cap stocks is nearing its end. UK large-cap equities are a tactical sell against Eurozone and Swedish shares. TACTICAL INCEPTION DATE RETURN SINCE INCEPTION (%) COMMENT EQUITIES Buy European & Swedish Equities / Sell UK Large Caps Stocks 03/21/2022 Bottom Line: Stagflation fears are near an apex as commodity inflation recedes. A peak in these fears will allow European asset prices to perform strongly over the coming quarters. Despite a glimmer of hope that Ukraine and Russia may find a diplomatic end to the war, the reality on the ground is that the conflict has intensified. Although the hostilities are worsening and the European Central Bank (ECB) surprised the markets with its hawkish tone, European assets have begun to catch a bid. The crucial question for investors is whether this rebound constitutes a new trend or a counter-trend move? Our view about Europe is optimistic right now. The path is not a direct line upward. The recent optimism about the outcome of the Russia-Ukraine talks is premature; however, we are getting to the point when markets are becoming desensitized to the war and energy prices are losing steam. Moreover, the increasing number of statements by Chinese economic authorities pointing toward greater stimulus and support to alleviate the pain created by China’s stringent zero-COVID policy are another positive omen. Higher Inflation For Some Time European headline inflation is set to exceed 7% this summer and core CPI will increase between 2.8% and 3.2% by the end of 2022. Related Report European Investment StrategySpring Stagflation The main force that will push inflation higher in Europe remains commodity prices. Energy inflation is extremely strong at already 32% per annum (Chart 1). It will increase further because of both the recent jump in Brent prices to EUR122/bbl on March 8 and the upsurge in natural gas prices, which were as high as EUR212/MWh on the same day before settling to EUR106/MWh last Friday. The impact of energy prices will not be limited to headline inflation and will filter through to core CPI (Chart 1, bottom panel). The average monthly percentage change in the Eurozone core CPI inflation stands at 0.25% for the past six months (compared to an average of 0.09% over the past ten years), or the period when energy-prices inflation has been the strongest. Assuming monthly inflation remains at such an elevated level, annual core CPI will hit 3.3% in the Eurozone by the end of 2022 (Chart 2). Chart 2Core CPI to Rise Further
Core CPI to Rise Further
Core CPI to Rise Further
Chart 1Energy Inflation: Alive And Well
Energy Inflation: Alive And Well
Energy Inflation: Alive And Well
The picture is not entirely bleak. Many forces suggest that these inflationary forces will recede before year-end in Europe. Energy prices are peaking, which is consistent with a diminishing inflationary impulse from that space. We showed two weeks ago that the massive backwardation of oil curves, the heavy bullish sentiment, and the high level of risk-reversals were consistent with a severe but transitory adjustment in the energy market. Oil markets will experience further volatility, as uncertainty around peace/ceasefire negotiations continues to evolve in Ukraine. Nonetheless, the peak in energy prices has most likely been reached. BCA’s energy strategists expect Brent to average $93/bbl in 2022 and in 2023. The potential for a decline in headline CPI after the summer is not limited to energy prices. Dramatic moves in the commodity market, from metals to agricultural resources, have made headlines. Yet, the rate of change of commodity prices is decelerating, hence, the commodity impulse to inflation is slowing sharply. As Chart 3 shows, this is a harbinger of a slowdown in European headline CPI. Related Report European Investment StrategyFallout From Ukraine Looking beyond commodity markets, the recent deceleration in European economic activity also suggests weaker inflation in the latter half of 2022. Germany will likely suffer a recession because it already registered a negative GDP growth in Q4 2021. Q1 2022 growth will be even worse because of the country’s high exposure to both China and fossil fuel prices. More broadly, the recent deceleration in the rate of change of both the manufacturing and services PMIs is consistent with an imminent peak in the second derivative of goods and services CPI (Chart 4). Chart 3Commodity Impulse Is Peaking
Commodity Impulse Is Peaking
Commodity Impulse Is Peaking
Chart 4Inflation's Maximum Momentum Is Now
Inflation's Maximum Momentum Is Now
Inflation's Maximum Momentum Is Now
Underlying drivers of inflation also remain tame in Europe. European negotiated wages are only expanding at a 1.5% annual rate, which translates into unit labor costs growth of 1% (Chart 5). This contrast with the US, where wages are expanding at a 4.3% annual rate. A peak in inflation, however, does not mean that CPI readings will fall below the ECB’s 2% threshold anytime soon. The European economy continues to face supply shortages that the Ukrainian conflict exacerbates (Chart 6). Moreover, the recent wave of COVID-19 in China increases the risk of disruptions in supply chains, as highlighted by the closure of Foxconn factories in Shenzhen. Finally, inflation has yet to peak; mathematically, it will take a long time before it falls back below levels targeted by Frankfurt. Chart 5The European Labor Market Is Not Inflationary
The European Labor Market Is Not Inflationary
The European Labor Market Is Not Inflationary
Chart 6Not Blemish-Free
Not Blemish-Free
Not Blemish-Free
Bottom Line: European headline inflation will peak this summer, probably above 7%. Additionally, core CPI is likely to reach between 2.8% and 3.2% in the second half of 2022. As a result of a decline in the commodity impulse, inflation will decelerate afterward, but it will remain above the ECB’s 2% target for most of 2023. Hopes For Growth Two weeks ago, we wrote that Europe was facing a stagflation episode in the coming one to two quarters, but that, ultimately, economic activity will recover well. Recent evidence confirms that assessment. Chart 7A Coming Chinese Tailwind?
A Coming Chinese Tailwind?
A Coming Chinese Tailwind?
The tone of Chinese policymakers is becoming more aggressive, in favor of supporting the economy. On March 16, Vice-Premier Liu He highlighted that Beijing was readying to support property and tech shares and that it will do more to stimulate the economy. True, this response was made in part to address the need to close cities affected by the sudden spike of Omicron cases around China. Nonetheless, the global experience with Omicron demonstrates that, as spectacular and violent the surge in cases may be, it is short-lived. Meanwhile, the impact of stimulus filters through the economy over many months. As a result, Europe will experience the impact of China’s Omicron-induced slowdown, while it also suffers from the growth-sapping effects of the Ukrainian conflict; however, it will also enjoy the positive effect on growth of a rising credit impulse over several subsequent quarters (Chart 7). Beyond China, the other themes we have discussed in recent weeks remain valid. First, European fiscal policy will become looser, as governments prepare to fight the slowdown caused by the war, while also increasing infrastructure spending to wean Europe off Russian energy. Moreover, European military spending is well below NATO’s 2% objective. This will not remain the case, as military expenditure may leap from less than EUR100bn per year to nearly EUR400bn per year over the coming decade. Second, European spending on consumer durable goods still lags well behind the trajectory of the US. With the energy drag at its apex today, consumer spending on durable goods will be able to catch up in the latter half of the year, especially with the household savings rate standing at 15% or 2.5 percentage points above its pre-COVID level. Bottom Line: European growth will be very low in the coming quarters. Germany is likely to face a technical recession as Q1 2022 data filters in. Nonetheless, Chinese stimulus, European fiscal support, pent-up demand, and a declining energy drag will allow growth to recover in the latter half of the year. As a result, we agree with the European Commission estimates that European growth will slow markedly this year. Market Implications In the context of a transitory shock to European economic activity and a coming peak in inflation, European stock prices have likely bottomed. Chart 8Depressed Sentiment To Help Beta
Depressed Sentiment To Help Beta
Depressed Sentiment To Help Beta
Sentiment has reached levels normally linked with a durable market floor. The NAAIM Exposure Index has fallen to a point from which global markets often recover. Europe’s high beta nature increases the odds that European equities will greatly benefit in that context (Chart 8). Valuations confirm that sentiment toward European assets has reached a capitulation stage. The annual rate of change of the earnings yields in the earnings yields has hit 73%, which is consistent with a market bottom (Chart 9). More importantly, the change in European forward P/E tracks closely our European Stagflation Sentiment Proxy (ESSP), based on the difference between the Growth and Inflation Expectations’ components of the ZEW survey (Chart 10). For now, our ESSP indicates that stagflation fears in Europe have never been so widespread, but these fears will likely dissipate as energy inflation declines. This process will lift European earnings multiples. Chart 9Bad News Discounted?
Bad News Discounted?
Bad News Discounted?
Chart 10Ebbing Stagflation Fear Will Prompt Rerating
Ebbing Stagflation Fear Will Prompt Rerating
Ebbing Stagflation Fear Will Prompt Rerating
Earnings revisions will likely bottom soon as well. The ESSP is currently consistent with a dramatic decline in European net earnings revisions (Chart 10, bottom panel). It will take a few more weeks for lower earnings revisions to be fully reflected. However, they follow market moves and, as such, the 17% decline in the MSCI Europe Index that took place earlier this year already anticipates their fall. Consequently, as stagflation fears recede, earnings revisions will rise in tandem with equity prices. Chart 11Maximum Pressure On Corporate Spreads
Maximum Pressure On Corporate Spreads
Maximum Pressure On Corporate Spreads
A decline in stagflation fears is also consistent with a decrease in European credit spreads in the coming months (Chart 11). This observation corroborates the analysis from the Special Report we published jointly with BCA’s Global Fixed-Income Strategy team last week. In terms of sectoral implications, a decline in stagflation fears is often associated with a rebound in the performance of small-cap equities relative to large-cap ones (Chart 12, top panel). This reflects the greater sensitivity of small-cap equities to domestic economic conditions compared to large-cap stocks. Moreover, small-cap equities had been oversold relative to their large-cap counterparts but now, momentum is improving (Chart 12). As a result, it is time to buy these equities. Similarly, financials have suffered greatly from the recent events associated with the Ukrainian conflict. European financial institutions have not only been penalized for their modest exposure to Russia, they have also historically declined when stagflation fears are prevalent (Chart 13). This relationship reflects poor lending activity when the economy weakens, and the risk of a policy-induced recession caused by high inflation. Financials will continue their sharp rebound as stagflation fears dissipate. Chart 13Financials Have Suffered Enough
Financials Have Suffered Enough
Financials Have Suffered Enough
Chart 12Small-Caps Time To Shine
Small-Caps Time To Shine
Small-Caps Time To Shine
The dynamics in inflation alone are very important. As Table 1 highlights, in periods of elevated inflation over the past 20 years, financials underperform the broad market by 11.3% on average. It is also a period of pain for small-cap equities and cyclicals. Logically, exiting the current environment will offer opportunities in European cyclical equities and for financials in particular. Table 1Who Suffers From High Inflation?
Is Europe Turning The Corner?
Is Europe Turning The Corner?
Chart 14Long Industrials & Materials / Short Energy
Long Industrials & Materials / Short Energy
Long Industrials & Materials / Short Energy
Finally, a pair trade buying industrials and materials at the expense of energy makes sense today. Materials and industrials suffer relative to energy equities when stagflation rises, especially in periods when these fears reflect rising energy pressures (Chart 14). A reversal in relative earnings revisions in favor of materials and industrials will propel this position higher. Bottom Line: Sentiment toward European assets reached a selling climax in recent weeks. Stagflation fears in Europe have reached an apex, and their reversal will lift both multiples and earnings revisions in the subsequent quarters. Diminishing stagflation fears will also boost the appeal of European corporate credit, contributing to an easing in financial conditions. Small-cap stocks, cyclicals, and financials will reap the greatest benefits from this adjustment. Going long materials and industrials at the expense of energy stocks is an attractive pair trade. Key Risk: A Policy Mistake The view above is not without risks. The number one threat to European growth and assets is a policy mistake from the ECB. On March 10, 2022, the ECB’s policy statement and President Christine Lagarde’s press conference showed that the Governing Council (GC) will decrease asset purchases faster than anticipated. Chart 15Will The ECB Repeat It Past Mistakes?
Will The ECB Repeat It Past Mistakes?
Will The ECB Repeat It Past Mistakes?
It is important to keep in mind the dynamics of 2011. Back then, the ECB opted to increase interest rates as European headline CPI was drifting toward 2.6% on the back of rising energy prices. According to our ESSP, the April 2011 interest rates hike took place at the greatest level of stagflation fears recorded until the current moment (Chart 15). Lured by rising inflation, the ECB ignored underlying weaknesses in European economic activity, which wreaked havoc on European financial markets and growth. If the ECB were to increase rates as growth remains soft, a similar outcome would take place. For now, the ECB’s communications continue to de-emphasize the need for rate hikes in the near term, which suggests that the GC is cognizant of the risk created by weak growth over the coming months. Waiting until next year, when activity will be stronger and the output gap will be closed, will offer the ECB a better avenue to lift rates durably. This risk warrants close monitoring of the ECB’s communication over the coming months. If headline inflation does not peak by the summer, the ECB is likely to repeat its past error, which will substantially hurt European assets. Our optimism is tempered by this threat. UK Outperformance Long In The Tooth? Last week, the Bank of England (BoE) increased the Bank Rate by 25bps to 0.75%, in a move that was widely expected. Yet, the pound fell 0.7% against the euro and gilt yields fell 6 bps. This market reaction reflected the BoE’s choice to temper its forward guidance. The central bank is now expected to increase interest rates to 2.2% next year, before they decline in 2024. The dovish projection of the BoE shows the MPC’s concerns over the impact of higher energy costs and rising National Insurance contributions on household spending. In the BoE’s opinion, the economy is very inflationary right now, but it will slow, which will mitigate the inflationary impact down the road. We share the BoE’s worries about the UK’s near-term economic outlook. The combination of higher taxes, higher interest rates, and rising energy costs will have an impact on growth. However, the rapid decline in small-cap stocks, which have massively underperformed their large cap-counterparts, already discounts considerable bad news (Chart 16). Additionally, small-cap equities relative to EPS have begun to stabilize, while relative P/E and price-to-book ratios have also corrected their overvaluations. In this context, UK small-cap equities are becoming attractive. Chart 17UK vs Eurozone: A Stagflation Bet
UK vs Eurozone: A Stagflation Bet
UK vs Eurozone: A Stagflation Bet
Chart 16UK Small-Cap Stocks Have Purged Their Excesses
UK Small-Cap Stocks Have Purged Their Excesses
UK Small-Cap Stocks Have Purged Their Excesses
In contrast to small-cap stocks, UK large-cap equities have greatly benefited from the global stagflation scare. The UK large-cap benchmark had the right sector mix for the current environment, overweighting defensive names as well as energy and resources. It is likely that when stagflation fears recede, UK equities will undo their outperformance (Chart 17). Technically, UK equities are massively overbought against Euro Area and Swedish stocks, both of which have been greatly impacted by stagflation fears and their pro-cyclical biases (Chart 18 & 19). An attractive tactical bet will be to sell UK large-cap stocks while buying Eurozone and Swedish equities, as energy inflation declines and as China’s stimulus boosts global industrial activity in the latter half of 2022 Bottom Line: Move to overweight UK small-cap stocks within UK equity portfolios. Go long Euro Area and Swedish equities relative to UK large-cap stocks as a tactical bet. Chart 18UK Overbought Relative To Euro Area...
UK Overbought Relative To Euro Area...
UK Overbought Relative To Euro Area...
Chart 19… And Sweden
... And Sweden
... And Sweden
Mathieu Savary, Chief European Strategist Mathieu@bcaresearch.com Tactical Recommendations Cyclical Recommendations Structural Recommendations Closed Trades
Executive Summary On a tactical (3-month) horizon, the inflationary impulse from soaring energy and food prices combined with the choke on growth from sanctions will weigh on both the global economy and the global stock market. As such, bond yields could nudge higher, the global stock market has yet to reach its crisis bottom, and the US dollar will rally. But on a cyclical (12-month) horizon, the short-term inflationary impulse combined with sanctions will be massively demand-destructive, at which point the cavalry of lower bond yields will charge to the rescue. Therefore: Overweight the 30-year T-bond and the 30-year Chinese bond, both in absolute terms and relative to other 30-year sovereign bonds. Overweight equities. Overweight long-duration US equities versus short-duration non-US equities. Fractal trading watchlist: Brent crude oil, and oil equities versus banks equities. The DAX Has Sold Off ##br##Because It Expects Profits To Plunge…
The DAX Has Sold Off Because It Expects Profits To Plunge...
The DAX Has Sold Off Because It Expects Profits To Plunge...
…But The S&P 500 Has Sold Off ##br##Because The Long Bond Has Sold Off
...But The S&P 500 Has Sold Off Because The Long Bond Has Sold Off
...But The S&P 500 Has Sold Off Because The Long Bond Has Sold Off
Bottom Line: In the Ukraine crisis, the protection from lower bond yields and fiscal loosening will not come as quickly and as powerfully as it did during the pandemic. If anything, the fixation on inflation and sanctions may increase short-term pain for both the economy and the stock market, before the cavalry of lower bond yields ultimately charges to the rescue. Feature Given the onset of the largest military conflict in Europe since the Second World War, with the potential to escalate to nuclear conflict, you would have thought that the global stock market would have crashed. Yet since Russia’s full-scale invasion of Ukraine on February 24 to the time of writing, the world stock market is down a modest 4 percent, while the US stock market is barely down at all. Is this the stock market’s ‘Wile E Coyote’ moment, in which it pedals hopelessly in thin air before plunging down the chasm? Is this the stock market’s ‘Wile E Coyote’ moment, in which it pedals hopelessly in thin air before plunging down the chasm? Admittedly, since the invasion, European bourses have fallen – for example, Germany’s DAX by 10 percent. And stock markets were already falling before the invasion, meaning that this year the DAX is down 20 percent while the S&P 500 is down 12 percent. But there is a crucial difference. While the DAX year-to-date plunge is due to an expected full-blooded profits recession that the Ukraine crisis will unleash, the S&P 500 year-to-date decline is due to the sell-off in the long-duration bond (Chart I-1 and Chart I-2). This difference in drivers will also explain the fate of these markets as the crisis evolves, just as in the pandemic. Chart I-1The DAX Has Sold Off Because It Expects Profits To Plunge...
The DAX Has Sold Off Because It Expects Profits To Plunge...
The DAX Has Sold Off Because It Expects Profits To Plunge...
Chart I-2...But The S&P 500 Has Sold Off Because The Long Bond Has Sold Off
...But The S&P 500 Has Sold Off Because The Long Bond Has Sold Off
...But The S&P 500 Has Sold Off Because The Long Bond Has Sold Off
During The Pandemic, Central Banks And Governments Saved The Day… We can think of a stock market as a real-time calculator of the profits ‘run-rate.’ In this regard, the real-time stock market is several weeks ahead of analysts, whose profits estimates take time to collect, collate, and record. For example, during the pandemic, the stock market had already discounted a collapse in profits six weeks before analysts’ official estimates (Chart I-3 and Chart I-4). Chart I-3The German Stock Market Is Several Weeks Ahead Of Analysts
The German Stock Market Is Several Weeks Ahead Of Analysts
The German Stock Market Is Several Weeks Ahead Of Analysts
Chart I-4The US Stock Market Is Several Weeks Ahead ##br##Of Analysts
The US Stock Market Is Several Weeks Ahead Of Analysts
The US Stock Market Is Several Weeks Ahead Of Analysts
We can also think of a stock market as a bond with a variable rather than a fixed income. Just as with a bond, every stock market has a ‘duration’ which establishes which bond it most behaves like when bond yields change. It turns out that the long-duration US stock market has the same duration as a 30-year bond, while the shorter-duration German stock market has the same duration as a 7-year bond. Pulling this together, and assuming no change to the very long-term structural growth story, we can say that: The US stock market = US profits multiplied by the 30-year bond price (Chart I-5 and Chart I-6). The German stock market = German profits multiplied by the 7-year bond price (Chart I-7 and Chart I-8). Chart I-5US Profits Multiplied By The 30-Year Bond Price...
US Profits Multiplied By The 30-Year Bond Price...
US Profits Multiplied By The 30-Year Bond Price...
Chart I-6...Equals The US Stock Market
...Equals The US Stock Market
...Equals The US Stock Market
Chart I-7German Profits Multiplied By The 7-Year Bond Price...
German Profits Multiplied By The 7-Year Bond Price...
German Profits Multiplied By The 7-Year Bond Price...
Chart I-8...Equals The German Stock Market
...Equals The German Stock Market
...Equals The German Stock Market
When bond yields rise – as happened through December and January – the greater scope for a price decline in the long-duration 30-year bond will hurt the US stock market both absolutely and relatively. But when bond yields decline – as happened at the start of the pandemic – this same high leverage to the 30-year bond price can protect the US stock market. When bond yields decline, the high leverage to the 30-year bond price can protect the US stock market. During the pandemic, the 30-year T-bond price surged by 35 percent, which more than neutralised the decline in US profits. Supported by this surge in the 30-year bond price combined with massive fiscal stimulus that underpinned demand, the pandemic bear market lasted barely a month. What’s more, the US stock market was back at an all-time high just four months later, much quicker than the German stock market. …But This Time The Cavalry May Take Longer To Arrive Unfortunately, this time the rescue act may take longer. One important difference is that during the pandemic, governments quickly unleashed tax cuts and stimulus payments to shore up demand. Whereas now, they are unleashing sanctions on Russia. This will choke Russia, but will also choke demand in the sanctioning economy. Another crucial difference is that as the pandemic took hold in March 2020, the Federal Reserve slashed the Fed funds rate by 1.5 percent. But at its March 2022 meeting, the Fed will almost certainly raise the interest rate (Chart I-9). Chart I-9As The Pandemic Took Hold, The Fed Could Slash Rates. Not Now.
As The Pandemic Took Hold, The Fed Could Slash Rates. Not Now.
As The Pandemic Took Hold, The Fed Could Slash Rates. Not Now.
As the pandemic was unequivocally a deflationary shock at its outset, it was countered with a massive stimulatory response from both central banks and governments. In contrast, the Ukraine crisis has unleashed a new inflationary shock from soaring energy and food prices. And this on top of the pandemic’s second-round inflationary effects which have already dislocated inflation into uncomfortable territory. Our high conviction view is that this inflationary impulse combined with sanctions will be massively demand-destructive, and thereby ultimately morph into a deflationary shock. Yet the danger is that myopic policymakers and markets are not chess players who think several moves ahead. Instead, by fixating on the immediate inflationary impulse from soaring energy and food prices, they will make the wrong move. In the Ukraine crisis, the big risk is that the protection from lower bond yields and fiscal loosening will not come as quickly and as powerfully as it did during the pandemic. If anything, the fixation on inflation and sanctions may increase short-term pain for both the economy and the stock market. Compared with the pandemic, both the sell-off and the recovery will take longer to play out. In the Ukraine crisis, the big risk is that the protection from lower bond yields and fiscal loosening will not come as quickly and as powerfully as it did during the pandemic. One further thought. The Ukraine crisis has ‘cancelled’ Covid from the news and our fears, as if it were just a bad dream. Yet the virus has not disappeared and will continue to replicate and mutate freely. Probably even more so, now that we have dismissed it, and Europe’s largest refugee crisis in decades has given it a happy hunting ground. Hence, do not dismiss another wave of infections later this year. The Investment Conclusions Continuing our chess metaphor, a tactical investment should consider only the next one or two moves, a cyclical investment should be based on the next five moves, while a long-term structural investment (which we will not cover in this report) should visualise the board after twenty moves. All of which leads to several investment conclusions: On a tactical (3-month) horizon, the inflationary impulse from soaring energy and food prices combined with the choke on growth from sanctions will weigh on both the global economy and the global stock market. As such, bond yields could nudge higher, the global stock market has yet to reach its crisis bottom, and the US dollar will rally (Chart I-10). Chart I-10When Stock Markets Sell Off, The Dollar Rallies
When Stock Markets Sell Off, The Dollar Rallies
When Stock Markets Sell Off, The Dollar Rallies
But on a cyclical (12-month) horizon, the short-term inflationary impulse combined with sanctions will be massively demand-destructive, at which point the cavalry of lower bond yields will charge to the rescue. Therefore: Overweight the 30-year T-bond and the 30-year Chinese bond, both in absolute terms and relative to other 30-year sovereign bonds. Overweight equities. Overweight long-duration US equities versus short-duration non-US equities. How Can Fractal Analysis Help In A Crisis? When prices are being driven by fundamentals, events and catalysts, as they are now, how can fractal analysis help investors? The answer is that it can identify when a small event or catalyst can have a massive effect in reversing a trend. In this regard, the extreme rally in crude oil has reached fragility on both its 65-day and 130-day fractal structures. Meaning that any event or catalyst that reduces fears of a supply constraint will cause an outsized reversal (Chart I-11). Chart I-11The Extreme Rally In Crude Oil Is Fractally Fragile
The Extreme Rally In Crude Oil Is Fractally Fragile
The Extreme Rally In Crude Oil Is Fractally Fragile
Equally interesting, the huge outperformance of oil equities versus bank equities is reaching the point of fragility on its 260-day fractal structure that has reliably signalled major switching points between the sectors (Chart I-12). Given the fast-moving developments in the crisis, we are not initiating any new trades this week, but stay tuned. Chart I-12The Huge Outperformance Of Oil Equities Versus Banks Equities Is Approaching A Reversal
The Huge Outperformance Of Oil Equities Versus Banks Equities Is Approaching A Reversal
The Huge Outperformance Of Oil Equities Versus Banks Equities Is Approaching A Reversal
Fractal Trading Watchlist Biotech To Rebound
Biotech Is Starting To Reverse
Biotech Is Starting To Reverse
US Healthcare Vs. Software Approaching A Reversal
US Healthcare Vs. Software Approaching A Reversal
US Healthcare Vs. Software Approaching A Reversal
Norway's Outperformance Could End
Norway's Outperformance Could End
Norway's Outperformance Could End
Greece’s Brief Outperformance To End
Greece Is Snapping Back
Greece Is Snapping Back
Dhaval Joshi Chief Strategist dhaval@bcaresearch.com Fractal Trading System Fractal Trades
Are We In A Slow-Motion Crash?
Are We In A Slow-Motion Crash?
Are We In A Slow-Motion Crash?
Are We In A Slow-Motion Crash?
6-Month Recommendations Structural Recommendations Closed Fractal Trades Indicators To Watch - Bond Yields Chart II-1Indicators To Watch - Bond Yields ##br##- Euro Area
Indicators To Watch - Bond Yields - Euro Area
Indicators To Watch - Bond Yields - Euro Area
Chart II-2Indicators To Watch - Bond Yields ##br##- Europe Ex Euro Area
Indicators To Watch - Bond Yields - Europe Ex Euro Area
Indicators To Watch - Bond Yields - Europe Ex Euro Area
Chart II-3Indicators To Watch - Bond Yields ##br##- Asia
Indicators To Watch - Bond Yields - Asia
Indicators To Watch - Bond Yields - Asia
Chart II-4Indicators To Watch - Bond Yields ##br##- Other Developed
Indicators To Watch - Bond Yields - Other Developed
Indicators To Watch - Bond Yields - Other Developed
Indicators To Watch - Interest Rate Expectations Chart II-5Indicators To Watch - Interest Rate Expectations
Indicators To Watch - Interest Rate Expectations
Indicators To Watch - Interest Rate Expectations
Chart II-6Indicators To Watch - Interest Rate Expectations
Indicators To Watch - Interest Rate Expectations
Indicators To Watch - Interest Rate Expectations
Chart II-7Indicators To Watch - Interest Rate Expectations
Indicators To Watch - Interest Rate Expectations
Indicators To Watch - Interest Rate Expectations
Chart II-8Indicators To Watch - Interest Rate Expectations
Indicators To Watch - Interest Rate Expectations
Indicators To Watch - Interest Rate Expectations
Executive Summary Will The War Stall The Expected Downturn In Inflation This Year?
Will The War Stall The Expected Downturn In Inflation This Year?
Will The War Stall The Expected Downturn In Inflation This Year?
The Russia/Ukraine conflict is impacting financial markets across numerous channels – uncertainty, risk aversion, growth expectations & inflation expectations – but all have a common link through soaring commodity prices, most notably for oil. For global bond investors, allocations to inflation-linked bonds are a necessary hedge to the war and the associated commodity shock, particularly with breakevens in most countries re-establishing the link to oil prices. We recommend investors maintain neutral allocations to inflation-linked bonds versus nominal government bonds across the developed world until there is greater clarity on future global oil production. Markets are discounting a peak in interest rates at the low end of the Bank of Canada’s neutral range, which is reasonable given high household debt levels in Canada. This creates an opportunity for bond investors to go long Canadian government bonds versus US Treasuries. Bottom Line: The supply premium on global oil prices will persist until there are signs of more global oil production or less chaos in the Ukraine – neither of which is imminent. Maintain neutral allocations to inflation-linked bonds versus nominal government debt across the developed markets. Feature Chart 1A Broad-Based Surge In Commodity Prices
A Broad-Based Surge In Commodity Prices
A Broad-Based Surge In Commodity Prices
The Russia/Ukraine war has sent an inflationary shock though the world through a very traditional source – rising commodity prices. Energy prices are getting most of the attention, with oil prices back to levels last seen in 2008 and US gasoline prices now above $4 per gallon. The commodity rally is not just in energy, though. Industrial metals prices have also gone up substantially, with the spot prices for copper and aluminum hitting an all-time-high and 16-year-high, respectively (Chart 1). Agricultural commodities have seen even larger increases, with the price of wheat up 22% and the price of corn up 11% since the Russian invasion began on February 24th. Europe is acutely exposed to the war-driven spike in energy prices given its reliance on Russia for natural gas supplies. Natural gas prices in Europe have spiked a staggering 117% since the invasion started, exacerbating a sharp demand/supply imbalance dating back to the reopening of Europe’s economy from COVID lockdowns one year ago (Chart 2). To date, booming energy prices have fueled a huge rise in headline inflation rates in the euro area – producer prices were up 31% on a year-over-year basis in January – but with little trickle down to core inflation which was only up 2.3% in January. High energy prices are not only a problem for global growth and inflation, but also for the future policy moves by central banks. Inflation rates boosted over the past year by commodity supply squeezes and supply chain disruptions were set to decline this year, but the Ukraine shock has thrown that into question. If the benchmark Brent oil price were to hit $150/bbl, this would end the decelerating trend for energy price inflation momentum, on a year-over-year basis, that has been in place since mid-2021 (Chart 3). That means a higher floor for the energy component of inflation indices, and thus overall headline inflation rates, throughout the major economies in the coming months. Chart 2Europe's Reliance On Russian Natural Gas Is A Big Problem
Europe's Reliance On Russian Natural Gas Is A Big Problem
Europe's Reliance On Russian Natural Gas Is A Big Problem
Chart 3Will The War Stall The Expected Downturn In Inflation This Year?
Will The War Stall The Expected Downturn In Inflation This Year?
Will The War Stall The Expected Downturn In Inflation This Year?
Chart 4The Oil Price Spike Makes Life More Difficult for CBs
The Oil Price Spike Makes Life More Difficult for CBs
The Oil Price Spike Makes Life More Difficult for CBs
How will bond markets respond to higher-than-expected inflation? Rate hike expectations have been highly correlated to the trend of headline inflation in the US, Europe, UK, Canada and Australia over the past year (Chart 4). Currently, overnight index swap (OIS) curves are still discounting between 5-6 rate hikes from the Fed, the Bank of England, the Bank of Canada and the Reserve Bank of Australia before the end of 2022. A single rate hike is still priced into the European OIS curve, even with the Ukraine shock. Global bond yields have been volatile, but surprisingly resilient despite the worries about war and commodity inflation. The 10-year Treasury yield has been trading in a range between 1.7% and 2% since the Russian offensive began, while the 10-year German Bund yield has hovered around 0%. Bond markets are pricing in a stagflation-type outcome of slowing growth and rising inflation, as multiple rate hikes are still discounted despite the geopolitical risks from the war. That reduces the value of using increased duration exposure to position for risk-off moves in a bond portfolio. At the same time, real bond yields are falling and breakeven rates are rising for global inflation-linked bonds – a part of the fixed income universe that looks to offer good protection against the uncertainties of war. Inflation-Linked Bonds – A Good Hedge Against War Risks Since the Russian invasion began, breakeven inflation rates on 10-year inflation-linked bonds have moved higher in the US (+13bps), Canada (+19bps), Australia (+15bps) and even Japan (+15bps). The moves have been even more significant on the European continent – 10-year breakevens have shot up in the UK (+23bps), Germany (+45bps), France (+31bps) and Italy (+36bps). Chart 5Inflation Breakevens Are Rising, Especially In Europe
Inflation Breakevens Are Rising, Especially In Europe
Inflation Breakevens Are Rising, Especially In Europe
The absolute levels of breakevens in Europe are high in the context of recent history (Chart 5). However, breakevens also look a bit stretched in other countries like the US. Our preferred metric to evaluate the upside potential for inflation-linked bonds is our Comprehensive Breakeven Indicators (CBI). The CBI for each country is comprised of three components: the deviation of 10-year breakevens from our model-implied fair value, the spread between 10-year breakevens and longer-term survey-based inflation expectations (the “inflation risk premium”) and the gap between actual inflation and the central bank inflation target. Those three components are all standardized and added together with equal weights to come up with the CBI. A higher CBI reading suggests less potential for inflation breakevens to widen, and vice versa. Currently, the CBIs for the eight countries in our Model Bond Portfolio universe are close to or above zero, suggesting more limited scope for breakevens to widen further (Chart 6). Only in Canada is the CBI below zero, and only slightly so as high realized Canadian inflation is offset by breakevens trading below both fair value and survey-based measures of inflation (Chart 7). Chart 6Global Inflation Breakeven Valuations Are Not That Cheap
A Crude Awakening For Bond Investors
A Crude Awakening For Bond Investors
In the US, the CBI is above zero mostly because of high realized US inflation. In Europe, the CBIs of the UK, Germany and Italy all are well above zero, while in France the CBI is close to zero. The UK has the highest CBI in our eight-country universe, with all three components contributing roughly equally (Chart 8). The Japanese CBI is also just above the zero line. Chart 7Some Mixed Signals On Inflation Breakeven Valuations
Some Mixed Signals On Inflation Breakeven Valuations
Some Mixed Signals On Inflation Breakeven Valuations
Chart 8European Breakevens Have Adjusted Sharply To The Energy Shock
European Breakevens Have Adjusted Sharply To The Energy Shock
European Breakevens Have Adjusted Sharply To The Energy Shock
We have been recommending a relative cautious allocation to global breakeven bonds in recent months. We saw the upside potential on breakevens as capped given the dearth of “cheap” signals on breakevens from our CBIs, especially with central banks moving towards monetary tightening in response to elevated inflation – moves intended to restore inflation-fighting credibility with bond markets. Yet the Ukraine commodity shock has boosted inflation breakevens even in countries with modest underlying (non-commodity) inflation like Japan and the euro area. We now see greater value in owning inflation-linked bonds in global bond portfolios as a hedge against the inflation risks stemming from the Ukraine and the worsening geopolitical tensions between the West and Russia. This is true even without the typical positive signal for breakevens from having CBIs below zero. We recommend that fixed income investors maintain a neutral allocation to inflation-linked bonds in dedicated government bond portfolios across the entire developed market “linker” universe. In our model bond portfolio, we had been allocating to linkers based off the signal from the CBIs, but in the current stagflationary war environment, we see country allocations as secondary to having neutral exposure to linkers in all countries. The new weightings to inflation-linked bonds are shown in the model bond portfolio tables on pages 12-14.1 Bottom Line: For global fixed income investors, allocations to inflation-linked bonds are a necessary hedge to the war and the associated commodity shock, particularly with breakevens in most countries re-establishing the link to oil prices. Canada Update: BoC Liftoff At Last The Bank of Canada (BoC) raised its policy interest rate by 25bps to 0.5% last week, commencing the start of the first rate hike cycle since 2018. The move was no surprise after BoC Governor Tiff Macklem signaled at the January monetary policy meeting that the start of a rate hiking cycle was imminent. The Canadian Overnight Index Swap (OIS) curve is discounting another 171bps of hikes in 2022, with a peak rate of 1.98% reached by March 2023 - near the low-end of the BoC’s range of neutral rate estimates between 1.75% and 2.75% (Chart 9). Chart 9Markets Discounting A Shallow BoC Rate Hiking Cycle, Even With High Inflation
Markets Discounting A Shallow BoC Rate Hiking Cycle, Even With High Inflation
Markets Discounting A Shallow BoC Rate Hiking Cycle, Even With High Inflation
The BoC noted that the Canadian economy was recovering faster than expected from the effects of the Omicron variant and the associated restrictions on activity, coming off a robust 6.7% annualized real GDP growth rate in Q4/2021. The BoC now estimates that economic slack created by the pandemic shock has been fully absorbed, with the unemployment rate at 6.5%. Canadian headline inflation reached a 32-year high of 5.1% in January (Chart 10) – a level that Governor Macklem bluntly called “too high” in a speech the day following the rate hike. The BoC’s CPI-trim measure that excludes the most volatile components is also at an elevated reading of 4%, suggesting that the higher inflation is broad based. The BoC sees persistent high inflation as a risk to the stability of medium-term inflation expectations, thus justifying tighter monetary policy. According the latest BoC Survey of Consumer Expectations, Canadians expect inflation to be 4.1% over the next two years and 3.5% over the next five years, both of which are above the BoC’s 1-3% inflation target band. So with a robust economy, tight labor market, inflation well above the BoC target and elevated consumer inflation expectations showing no signs of settling, why is the OIS curve discounting such a relatively low peak in the BoC policy rate? The answer lies with Canada’s housing bubble and the associated high household debt levels. In a recent Special Report, our colleagues at The Bank Credit Analyst estimated that the neutral rate in Canada was no higher than 1.75%- the previous peak in rates during the 2017-2018 tightening cycle. A big reason for that was the high level of Canadian household debt, which now sits at 180% of disposable income. This compares to the equivalent measure in the US of 124%, showing that unlike their southern neighbors, Canadian households had little appetite for deleveraging after the 2008 financial crisis (Chart 11). Chart 10Good Reasons For A More Aggressive BoC
Good Reasons For A More Aggressive BoC
Good Reasons For A More Aggressive BoC
Chart 11A Big Reason For A Less Aggressive BoC
A Big Reason For A Less Aggressive BoC
A Big Reason For A Less Aggressive BoC
Chart 12Position For Narrower Canada-US Bond Spreads
Position For Narrower Canada-US Bond Spreads
Position For Narrower Canada-US Bond Spreads
The Bank Credit Analyst report estimated that if the BoC hiked rates to 2.5% over the next two years – just below the high end of the BoC neutral range – the Canadian household debt service ratio would climb to a new high of 15.5% (bottom panel). This would greatly restrict Canadian consumer spending and likely trigger a sharp pullback in both housing demand and real estate prices. The conclusion: the neutral interest rate in Canada is likely closer to the peak seen during the previous 2018/19 hiking cycle around 1.75%. We have been recommending an underweight stance on Canadian government bonds in global fixed income portfolios dating back to the spring of 2021. However, with markets now discounting a peak in rates within plausible estimates of neutral, the window for additional underperformance of Canadian government bonds may be closing - but not equally versus all developed economies. We have found that a useful leading indicator of 10-year cross-country government bond yield spreads is the differential between our 24-month discounters. The discounters measure the cumulative amount of short-term interest rate increases over the next two years priced into OIS curves. Currently the “discounter gaps” are signaling room for Canadian spread widening versus the UK and Japan and, to a lesser extent, core Europe (Chart 12). However, the discounter gap is pointing to significant potential for narrowing of the Canada-US 10-year spread over the next year (top panel). This would occur even if the BoC follows the Fed with rate hikes in 2022, as the Fed is likely to deliver more increases in 2023/24 than the BoC. This week, we are introducing two new recommended positions to benefit from narrower Canada-US government bond spreads: We are reducing the size of our underweight position in our model bond portfolio in half, offset by a reduction in the allocation to US Treasuries (see the table on page 13). We are introducing a new trade in our Tactical Overlay, going long Canadian 10-year government bond futures versus selling 10-year US Treasury futures on a duration-matched basis (the specific details of the trade can be found in the table on page 15) We are maintaining our cyclical underweight recommendation on Canada, in a global bond portfolio context, given the potential for Canadian yield spreads to widen versus core Europe, Japan and the UK. That underweight recommendation will be more concentrated versus countries relative to the US. Bottom Line: Markets are discounting a peak in interest rates at the low end of the Bank of Canada’s neutral range, which is reasonable given high household debt levels in Canada. This creates an opportunity for bond investors to go long Canadian government bonds versus US Treasuries. Robert Robis, CFA Chief Fixed Income Strategist rrobis@bcaresearch.com Footnotes 1 The allocations to inflation-linked bonds shown in the model bond portfolio reflect both the recommended country weights and the recommended weighting of linkers versus nominal bonds within each country. For example, we are neutral US TIPS versus nominal bonds within the US Treasury component of the portfolio, but since we are also underweight the US as a country allocation, the TIPS allocation is below the custom benchmark index weight. GFIS Model Bond Portfolio Recommended Positioning Active Duration Contribution: GFIS Recommended Portfolio Vs. Custom Performance Benchmark
A Crude Awakening For Bond Investors
A Crude Awakening For Bond Investors
The GFIS Recommended Portfolio Vs. The Custom Benchmark Index Global Fixed Income - Strategic Recommendations* Cyclical Recommendations (6-18 Months)
A Crude Awakening For Bond Investors
A Crude Awakening For Bond Investors
Tactical Overlay Trades
Executive Summary Nuclear Worries Take Center Stage
Rising Risk Of A Nuclear Apocalypse
Rising Risk Of A Nuclear Apocalypse
Vladimir Putin has now committed himself to orchestrating a regime change in Kyiv. Anything less would be seen as a defeat for him. Assuming he succeeds, and it is far from obvious that he will, the resulting insurgency will drain Russian resources. Along with continued sanctions, this will lead to a further deterioration in Russian living standards and growing domestic discontent. If Putin concludes that he has no future, the risk is that he will decide that no one else should have a future either. Although there is a huge margin of error around any estimate, subjectively, we would assign an uncomfortably high 10% chance of a civilization-ending global nuclear war over the next 12 months. These odds place some credence on Brandon Carter’s highly controversial Doomsday Argument. Even if World War III is ultimately averted, markets could experience a freak-out moment over the next few weeks, similar to what happened at the outset of the pandemic. Google searches for nuclear war are already spiking. Despite the risk of nuclear war, it makes sense to stay constructive on stocks over the next 12 months. If an ICBM is heading your way, the size and composition of your portfolio becomes irrelevant. Thus, from a purely financial perspective, you should largely ignore existential risk, even if you do care about it greatly from a personal perspective. Bottom Line: The risk of Armageddon has risen dramatically. Stay bullish on stocks over a 12-month horizon. All In on Sanctions In the criminal justice system, there is a reason why the punishment for armed robbery is lower than for murder. If the punishment were the same, an armed robber would have a perverse incentive to kill his victim in order to better conceal his crime. The same logic applies, or at least used to apply, to geopolitics: You do not impose maximum sanctions from the get-go because that removes your ability to influence your enemy with the threat of further sanctions. Following Russia’s invasion of Ukraine, the West chose to go all in on sanctions, levying every type imaginable with the exception of those entailing a big cost to the West (such as cutting off Russian energy exports). Most notably, many Russian banks have been blocked from the SWIFT messaging system while the Russian central bank’s foreign exchange reserves have been frozen. Even FIFA has barred Russia from international competition, just weeks before it was set to participate in the qualifying rounds of the 2022 World Cup. At this point, there is not much more that can be done on the sanctions front. This leaves military intervention as the only avenue available to further pressure Russia. A growing chorus of Western pundits, some of whom could not have picked out Ukraine on a map two weeks ago, have begun clamoring for regime change… this time, in Moscow. As one might imagine, this is not something that sits well with Putin. Last week, he declared that “No matter who tries to stand in our way or … create threats for our country and our people, they must know that Russia will respond immediately, and the consequences will be such as you have never seen in your entire history.” To ensure there was no uncertainty about what he was talking about, he proceeded to place Russia’s nuclear forces on “special regime of combat duty.” Yes, It’s Possible The Putin regime has used nuclear weapons of a sort in the past. The FSB likely orchestrated the poisoning of Alexander Litvinenko with polonium-210 in 2006, leaving traces of the radioactive substance scattered in dozens of places across London. As former US presidential advisor and Putin biographer Fiona Hill said in a recent interview with Politico, “Every time you think, “No, he wouldn’t, would he?” Well, yes, he would.” Admittedly, there is a big difference between dropping polonium into a cup of tea at the Millennium hotel in Mayfair and dropping a 10-megaton nuclear bomb on London or any other major Western city. Still, if Putin feels that he has no future, he may try to take everyone down with him. The collapse in the ruble, and what is sure to be a major plunge of living standards across Russia, could foment internal opposition to Putin. A quiet retirement is not an option for him. Based on the latest exchange rates, Russia’s GDP is smaller than Mexico’s and barely higher than that of Illinois (Chart 1). While denying gas to Europe is a very real threat, it has a limited shelf life. Europe will aggressively build out infrastructure to process LNG imports. Chart 1Russia's Economic Power Has Faded
Rising Risk Of A Nuclear Apocalypse
Rising Risk Of A Nuclear Apocalypse
In a few years, the one viable weapon that Russia will have at its disposal is its nuclear arsenal. As Dutch historian Jolle Demmers has said, “It is precisely the decline and contraction of Russian power, coupled with the possession of nuclear weapons and a tormented repressive president, that poses great risks.” Some of the world’s most prominent strategic thinkers flagged these risks before the invasion, but with little effect. The Mother of All Risks In simulated war games, it is generally difficult to get participants to cross the nuclear threshold, but once they do, a full-blown nuclear exchange usually ensues.1 The idea of “limited” nuclear war is a mirage. How high are the odds of such a full-blown war? I must confess that my own feelings on the matter are heavily colored by my writings on existential risk. As I argued in Section XII of my special report, “Life, Death, and Finance in the Cosmic Multiverse,” we are probably greatly understating existential risk, especially when we look prospectively into the future. Although there is a huge margin of error around any estimate, subjectively, we would assign an uncomfortably high 10% chance of a civilization-ending global nuclear war over the next 12 months. These odds place some credence on Brandon Carter’s highly controversial Doomsday argument (See Box 1). A Paradox for Investors For investors, existential risk represents a paradoxical concept. If an ICBM is heading your way, the question of whether you are overweight or underweight stocks would be pretty far down on your list of priorities. And even if you were inclined to think about your portfolio, how would you alter it? In a full-blown global nuclear war, most stocks would go to zero while governments would probably be forced to default or inflate away their debt. Gold might retain some value – provided that you kept it in your physical possession – but even then, you would still have trouble exchanging it for anything of value if nothing of value were available to purchase. This means that from a purely financial perspective, you should largely ignore existential risk, even if you do care greatly about it from a personal perspective. What, then, can we say about the current market environment? I touched on many of the key issues in Monday’s Special Alert, in which we tactically downgraded global equities from overweight to neutral. I encourage readers to consult that report for our latest market views. In the remainder of today’s report, allow me to elaborate on a couple of key themes. A Freak-Out Moment Is Coming Chart 2Nuclear Worries Take Center Stage
Rising Risk Of A Nuclear Apocalypse
Rising Risk Of A Nuclear Apocalypse
The market today reminds me of early 2020. We wrote a report on February 21 of that year entitled “Markets Too Complacent About The Coronavirus,” in which we noted that a full-blown pandemic “could lead to 20 million deaths worldwide,” and that “This would likely trigger a global downturn as deep as the Great Recession of 2008/09, with the only consolation being that the recovery would be much more rapid than the one following the financial crisis.” Many saw that report as alarmist, just as they saw our subsequent decision to upgrade stocks in March as cavalier. Even if you knew in February 2020 that the S&P 500 would reach an all-time high later that year, you should have still shorted equities aggressively on a tactical basis. I feel the same way about the present. Google searches for nuclear war are spiking (Chart 2). A freak-out moment is coming, which will present a good buying opportunity for investors. Just to be on the safe side, I picked up a couple of bottles of Potassium Iodide earlier this week. When I checked the pharmacy again yesterday, all the bottles were sold out. They are now being hawked on Amazon for ten times the regular price. From Cold War to Hot Economy? The spike in commodity prices – especially energy prices – will have a negative near-term impact on global growth, while also limiting the ability of central banks to slow the pace of planned rate hikes (Chart 3). In general, inflation expectations and oil prices move together (Chart 4). Chart 3Central Banks: Caught Between A Rock And A Hard Place
Central Banks: Caught Between A Rock And A Hard Place
Central Banks: Caught Between A Rock And A Hard Place
Chart 4Inflation Expectations And Oil Prices Go Hand-In-Hand
Inflation Expectations And Oil Prices Go Hand-In-Hand
Inflation Expectations And Oil Prices Go Hand-In-Hand
Assuming the geopolitical situation stabilizes in a few months, oil prices should come down. The forward curve for oil is heavily backwardated now: The spot price for Brent is $111/bbl while the December 2022 price is $93/bbl (Chart 5). BCA’s commodity strategists expect the price of Brent oil to fall to $88/bbl by year-end. The decline in energy prices should provide some relief to global growth and risk assets in the back half of the year, which is one reason we are more constructive on equities over a 12-month horizon than a 3-month horizon. Looking out beyond the next year or two, the new cold war will lead to higher, not lower, interest rates. Increased spending on defense and alternative energy sources will prop up aggregate demand, especially in Europe where the need to diversify away from Russian gas is greatest. As Chart 6 shows, capex in the euro area cratered following the euro debt crisis. Capital spending via the Recovery Fund and other sources will rise significantly over the next few years. Chart 5The Brent Curve Is Heavily Backwardated
Rising Risk Of A Nuclear Apocalypse
Rising Risk Of A Nuclear Apocalypse
Chart 6European Capex Is Poised To Increase
European Capex Is Poised To Increase
European Capex Is Poised To Increase
In addition, the shift to a multipolar world will expedite the retreat from globalization. Rising globalization was an important force restraining inflation – and interest rates – over the past few decades. Lastly, the ever-present danger of war could prompt households to reduce savings. It does not make sense to save for a rainy day if that day never arrives. Lower savings implies a higher equilibrium rate of interest. As we discussed in our recent report entitled “A Two-Stage Fed Tightening Cycle,” after raising rates modesty this year, the Fed will resume hiking rates towards the end of 2023 or in 2024, as it becomes clear that the neutral rate in nominal terms is closer to 3%-to-4% rather than the 2% that the market assumes. The secular bull market in equities will likely end at that point. In summary, equity investors should be somewhat cautious over the next three months, more optimistic over a 12-month horizon, but more cautious again over a longer-term horizon of 2-to-5 years. Box 1The Doomsday Argument In A Nutshell
Rising Risk Of A Nuclear Apocalypse
Rising Risk Of A Nuclear Apocalypse
Peter Berezin Chief Global Strategist peterb@bcaresearch.com Footnotes 1 For example, an article from the Center for Arms Control and Non-Proliferation discusses a Reagan administration war game called “Proud Prophet,” an exercise the Americans hatched to test the theory of limited nuclear strikes. The result of this exercise was that the “Soviet Union perceived even a low-yield nuclear strike as an attack, and responded with a massive missile salvo.” Global Investment Strategy View Matrix
Rising Risk Of A Nuclear Apocalypse
Rising Risk Of A Nuclear Apocalypse
Special Trade Recommendations Current MacroQuant Model Scores
Rising Risk Of A Nuclear Apocalypse
Rising Risk Of A Nuclear Apocalypse
Executive Summary Upgrade Global Duration Exposure To Neutral
Upgrade Global Duration Exposure To Neutral
Upgrade Global Duration Exposure To Neutral
The Russian invasion of Ukraine is a stagflationary shock that comes at a difficult time for developed market central banks that have been laying the groundwork for a tightening cycle. We tactically upgraded our recommended duration exposure in the US to neutral last week, as the market was pricing in too much Fed tightening in 2022. We are doing similar upgrades in non-US government bonds this week for the same reason. We are maintaining our cyclical country allocations, however, as those remain in line with interest rate pricing beyond 2022. We are underweight markets where terminal rate expectations remain too low (the US, UK & Canada) and overweight countries where markets are discounting too many rate hikes in 2023/24 (Germany, Japan, Australia). In light of the instability caused by the Russian invasion of Ukraine, we are reducing weightings in our model bond portfolio to credit sectors highly exposed to the war - European high-yield and emerging market hard currency debt. Bottom Line: The Ukraine war comes at a time when global growth momentum was already starting to roll over and with global inflation momentum set to peak soon. Upgrade duration exposure to neutral from underweight in global bond portfolios. Feature Among the tail risks that investors contemplated in their planning for 2022, World War III was likely not ranked too highly on the list. The horrific images of the Russian invasion of Ukraine – and the sharp response of the West to isolate Russia through unprecedented economic and financial sanctions - have shocked global financial markets that had been focused on relatively mundane concerns like the timing of interest rate hikes. BCA sent a short note to all clients late last week that discussed the investment implications of the invasion for several asset classes. In this report, we consider the bond market ramifications of war in Eastern Europe. Our main conclusion is that the Ukraine situation will produce a brief “stagflationary” shock that will boost global inflation and slow global growth, on the margin. High energy prices will be the main driver of that stagflation, given the uncertainties over the availability of Russian oil and natural gas supplies (Chart 1). Tighter financial conditions - beyond what has already occurred so far this year as global equity and credit markets have sold off (Chart 2) – will also contribute to the moderation of the pace of global growth. Chart 1A Mild Inflationary Shock From The Russian Invasion
A Mild Inflationary Shock From The Russian Invasion
A Mild Inflationary Shock From The Russian Invasion
Chart 2The Ukraine War Is Adding To 2022 Risk-Off Trends
The Ukraine War Is Adding To 2022 Risk-Off Trends
The Ukraine War Is Adding To 2022 Risk-Off Trends
The stagflation shock should be relatively short, perhaps 3-6 months. BCA’s Commodity & Energy Strategy service expects OPEC to eventually supply more oil to the global market – a move that was already likely before the Russian invasion – helping to reduce the Russian supply premium in oil prices. Putin will likely have to be satisfied with claiming eastern Ukraine rather than being stuck in a protracted battle with fierce Ukrainian resistance while Russia suffers under crippling sanctions. BCA’s Geopolitical Strategy service does not expect the conflict to spread beyond Ukraine’s borders, as neither Russia nor NATO have an interest in war with each other (despite the nuclear saber-rattling by Russian President Putin in response to Western sanctions). A mild bout of stagflation will only delay, and not derail, the cyclical move towards tighter global monetary policies in response to elevated inflation and tightening labor markets, particularly in the US. This will take some of the upward pressure off global bond yields as central banks will be less hawkish than expected in 2022, but does not change the outlook for higher bond yields in 2023 and 2024. In terms of changes to our fixed income investment recommendations, and the allocations to our Model Bond Portfolio, we come to the following three conclusions. Upgrade Tactical Non-US Duration Exposure To Neutral We recently upgraded our recommended tactical duration exposure in the US to neutral, with the Fed likely to deliver fewer rate hikes this year than what is discounted by markets. The Ukraine situation makes it even more likely that the Fed will underwhelm expectations. A 50bp rate hike at the March FOMC meeting is now off the table, as the equity and credit market selloffs in response to the conflict have tightened US (and global) financial conditions on the margin. However, the war is not enough of a negative shock to US growth to derail the Fed from starting a gradual tightening process this month with a 25bp hike. Our decision to change our US duration stance was largely predicated on a view that US inflation will soon peak and slow significantly over the rest of 2022. However, there is a strong case to increase non-US duration exposure, as well. Our Global Duration Indicator - comprised of leading cyclical growth indicators and which itself leads the year-over-year change in our “Major Countries” GDP-weighted aggregate of 10-year government bond yields by around six months - peaked back in February 2021 (Chart 3). The Global Duration Indicator is now at a “neutral” level consistent with more stable bond yield momentum. Declines in the ZEW economic expectations survey in the US and Europe, and in our global leading economic indicator, are the main culprits behind the fall in the Global Duration Indicator (Chart 4). Chart 3Upgrade Global Duration Exposure To Neutral
Upgrade Global Duration Exposure To Neutral
Upgrade Global Duration Exposure To Neutral
Chart 4Growth Expectations Have Turned Less Bond Bearish ... For Now
Growth Expectations Have Turned Less Bond Bearish ... For Now
Growth Expectations Have Turned Less Bond Bearish ... For Now
While the ZEW series have rebounded in the first two months of 2022, which could set the stage for a move back to higher yields later this year, the Ukraine situation will likely hurt economic expectations (particularly in Europe) in the near-term. We expect our Global Duration Indicator to continue signaling a more neutral backdrop for global bond yields over the next few months. In our Model Bond Portfolio on pages 13-14, we are expressing our view change by increasing the duration for all countries such that the overall duration of the portfolio is in line with the custom benchmark index (7.5 years). Importantly, we view this as only a tactical view change for the next few months, as developed economy interest rate markets are still discounting too few rate hikes – and in some countries like the UK and US, actual rate cuts – in 2023/24 (Chart 5). Chart 5Priced For Short, Shallow Hiking Cycles
Priced For Short, Shallow Hiking Cycles
Priced For Short, Shallow Hiking Cycles
Maintain Cyclical Government Bond Country Allocations That Favor Lower Inflation Regions Chart 6Oil Is Inflationary Now, Will Be Disinflationary Later
Oil Is Inflationary Now, Will Be Disinflationary Later
Oil Is Inflationary Now, Will Be Disinflationary Later
While we are neutralizing our global duration stance over a tactical time horizon (0-6 months), we are sticking with our current recommended cyclical (6-18 months) government bond country allocations. These are based on underlying inflation trends and the expected monetary policy response over the next couple of years. As noted earlier, BCA’s commodity strategists expect oil prices to fall from current war-elevated levels in response to increased supply from OPEC. The benchmark Brent oil price is forecasted to reach $88/bbl at the end of this year and $87/bbl and the end of 2023. The result will be a sharp decline in the year-over-year growth rate of oil prices that will help bring down headline inflation in all countries (Chart 6). Lower energy inflation, however, will not be the only factor reducing overall inflation across the developed world. Goods price inflation should also slow from current elevated levels over the next 6-12 months, as consumer spending patterns shift away from goods towards services with fewer pandemic-related restrictions on activity. Less goods spending will help ease some of the severe supply chain disruptions that have fueled the surge in global goods price inflation over the past year. That process has likely already begun – indices of global shipping costs have peaked and supplier delivery times have been shortening according to global manufacturing PMI surveys. The shift from less goods spending towards more services spending will lead to trends in overall inflation being determined more by services prices than goods prices. The central banks in countries that have higher underlying inflation, as evidenced by faster services inflation, will be under more pressure to tighten policy over the next couple of years. Therefore, our current cyclical recommended country allocations (and our Model Bond Portfolio weightings) within developed market government bonds reflect the relative trends in services inflation. We are currently recommending underweights in the US, UK and Canada where services inflation is currently close to 4%, well above the central bank 2% inflation targets (Chart 7). At the same time, we are recommending overweights in core Europe (Germany and France) and Australia, where services inflation is around 2.5%, and Japan where services prices are deflating (Chart 8). Chart 7Higher Underlying Inflation In Our Recommended Underweights
Higher Underlying Inflation In Our Recommended Underweights
Higher Underlying Inflation In Our Recommended Underweights
Chart 8Lower Underlying Inflation In Our Recommended Overweights
Lower Underlying Inflation In Our Recommended Overweights
Lower Underlying Inflation In Our Recommended Overweights
Chart 9Faster Wage Growth In Our Recommended Underweights
Faster Wage Growth In Our Recommended Underweights
Faster Wage Growth In Our Recommended Underweights
The trends in services inflation are also reflected in wage growth in those same groups of countries – much higher in the US, UK and Canada compared to Australia, the euro area and Japan (Chart 9). We expect these relative trends to continue over the next 12-24 months, with higher underlying inflation pressures forcing the Fed, the Bank of England (BoE) and the Bank of Canada (BoC) to be much more hawkish, on a relative basis, than the European Central Bank (ECB), the Reserve Bank of Australia (RBA) and the Bank of Japan (BoJ). Our current bond allocations not only fit with underlying inflation trends, but also with market-based interest rate expectations. In Table 1, we show the pricing of interest rate expectations over the next few years, taken from Overnight Index Swap (OIS) forwards. We show the OIS projection for 1-month interest rates 12 months from now and 24 months from now. We also include 5-year/5-year forward OIS rates as a measure of market expectations of the terminal rate, a.k.a. the peak central bank policy rate over the next tightening cycle. In the table, we also added neutral policy rate estimates taken from central bank sources.1 Table 1Medium-Term Interest Rate Expectations Still Too Low In The US & UK
Adjusting Our Bond Recommendations For A More Uncertain World
Adjusting Our Bond Recommendations For A More Uncertain World
In the US and UK, the OIS rate projections two years out, as well as the 5-year/5-year forward rate, are below the range of neutral rate estimates. This justifies an underweight stance on both US Treasuries and UK Gilts with both the Fed and BoE now in tightening cycles. In Japan and Australia, the OIS projections are already within the range of neutral rate estimates, but the RBA and, especially, the BoJ are not yet signaling a need to begin normalizing the level of policy rates. This justifies an overweight stance on Australian government bonds and Japanese government bonds. In the euro area, OIS projections are below the range of neutral rate estimates, but the ECB is now signaling that any monetary tightening actions will need to be delayed because of the growth uncertainties stemming from the Ukraine conflict and high energy prices. Thus, an overweight stance on core European government debt is still warranted. In Canada, the OIS projections are within the range of neutral rate estimates, but the BoC has been preparing markets for a series of rate hikes. This makes our underweight stance on Canadian government bonds a more “mixed” call, although we remain confident that Canadian bonds will underperform in a global bond portfolio context versus European and Japanese government bonds. In sum, we see our recommended country allocations as the most efficient way to express our cyclical (medium-term) central bank views, given the strong link between forward interest rate expectations and longer-term bond yields (Chart 10). This is why we are not making changes to our country allocation recommendations alongside our move to tactically upgrade our global duration stance to neutral. Chart 10Too Much Tightening Priced Over The Next Year
Too Much Tightening Priced Over The Next Year
Too Much Tightening Priced Over The Next Year
Chart 11Bond Markets Not Priced For A Relatively More Hawkish Fed
Bond Markets Not Priced For A Relatively More Hawkish Fed
Bond Markets Not Priced For A Relatively More Hawkish Fed
Given our high-conviction view that markets are underestimating how high the Fed will need to lift interest rates in the upcoming tightening cycle – likely more than any other major developed economy central bank - positioning for US Treasury market underperformance on a 1-2 year horizon still looks like an attractive bet with forward rates priced for little change in US/non-US bond spreads (Chart 11). A wider US Treasury-German Bund spread remains our highest conviction cross-country spread recommendation. Reduce Spread Product Exposure In Europe & Emerging Markets Chart 12Cut EM & European High-Yield Exposure, But Stay O/W Italian BTPs
Cut EM & European High-Yield Exposure, But Stay O/W Italian BTPs
Cut EM & European High-Yield Exposure, But Stay O/W Italian BTPs
The geopolitical uncertainty stemming from the Ukraine war and the stagflationary near-term impact of high energy prices are negatives for all risk assets, on the margin. That leads us to tactically reduce the allocation to spread product to neutral versus government debt in our Model Bond Portfolio. We are implementing this by cutting allocations to riskier fixed income sectors that are most impacted by the Russia/Ukraine conflict – European high-yield corporate debt and emerging market (EM) USD-denominated hard currency debt (Chart 12). We had already been cautious on EM debt before the Russian invasion, with an underweight allocation to both USD-denominated sovereigns and corporates, so the latest moves just increase the size of the underweight. European high-yield, on the other hand, had been one of our highest conviction overweight positions – particularly versus US high-yield - entering 2022. However the Ukraine war is likely to have a bigger negative impact on the European economy than the US economy, thus we are cutting our recommended exposure to European high-yield only. The uncertainty of a war on European soil, combined with the spike in energy prices (especially natural gas), is negative for European growth momentum, reducing 2022 euro area real GDP growth by as much as 0.4 percentage points according to ECB estimates. This raises the hurdle for any ECB monetary tightening this year. An early taper of bond buying in the ECB’s Asset Purchase Program, an outcome that ECB officials claim is a required precursor to rate hikes, is now highly unlikely. Fears of reduced ECB bond buying had weighed on the relative performance of Italian government bonds last month, but a more dovish ECB policy stance should lead to lower Italian yields and a narrowing of the BTP-Bund spread (bottom panel). We continue to recommend a cyclical overweight stance on Italian government debt. A Final Thought We need to reiterate that the recommended changes made in this report – increasing global duration exposure to neutral and cutting EM and European high-yield – are over a tactical time horizon, largely in response to the Ukraine conflict. This is more of a “risk management” exercise, rather than a change in our fundamental cyclical views. We still believe global growth will remain above trend in 2022 and likely 2023, which will prevent a complete unwind of last year’s inflation surge, particularly in the US. We expect global bond yields to begin climbing again later this year and into 2023, and we envision an eventual return to a below-benchmark duration stance. Robert Robis, CFA Chief Fixed Income Strategist rrobis@bcaresearch.com Footnotes 1 The sources of the neutral rate estimates are listed in the footnotes of Table 1. GFIS Model Bond Portfolio Recommended Positioning Active Duration Contribution: GFIS Recommended Portfolio Vs. Custom Performance Benchmark
Adjusting Our Bond Recommendations For A More Uncertain World
Adjusting Our Bond Recommendations For A More Uncertain World
The GFIS Recommended Portfolio Vs. The Custom Benchmark Index
Adjusting Our Bond Recommendations For A More Uncertain World
Adjusting Our Bond Recommendations For A More Uncertain World
Global Fixed Income - Strategic Recommendations* Tactical Overlay Trades
Dear client, In addition to this weekly report, we sent you a Special Report from our Geopolitical Strategy service, highlighting the risk from the Russo-Ukrainian conflict. Kind regards, Chester Executive Summary The Ukraine crisis will lead to a period of strength for the DXY. Countries requiring foreign capital will be most at risk from an escalation in tensions. Portfolio flows have reaccelerated into the US, on the back of a rise in Treasury yields. This will be sustained in the near term. The euro area on the other hand has already witnessed significant portfolio outflows, on the back of Russo-Ukrainian tensions and an energy crisis. Countries with balance of payment surpluses like Switzerland and Australia are good havens amidst the carnage. Oil-producing countries such as Norway and Canada have also seen an improvement in their balance of payments, on the back of a strong terms-of-trade tailwind. This will be sustained in the near term. Balance Of Payments Across The G10
The Ukraine Crisis And Balance Of Payments
The Ukraine Crisis And Balance Of Payments
Bottom Line: The dollar is king in a risk-off environment. That said, the US and the UK sport the worst balance of payments backdrops, while Norway, Switzerland, and Sweden have the best. This underpins our long-term preference for Scandinavian currencies in an FX portfolio. In the near term, we think the DXY will peak near 98-100, but volatility will swamp fundamental biases. Feature Chart 1The US Runs A Sizeable Deficit
The Ukraine Crisis And Balance Of Payments
The Ukraine Crisis And Balance Of Payments
The Russia-Ukraine conflict continues to dictate near-term FX movements. With Russia’s invasion of Ukraine, the risk of escalation and/or a miscalculation has risen. FX volatility is increasing sharply, and with it, the risk of a further selloff in currencies dependent on foreign capital inflows. As a reserve currency, the dollar has also been strong. It is difficult to ascertain how this imbroglio will end. However, in this week’s report, we look at which currencies are most vulnerable (and likely to stay vulnerable) from a balance of payments standpoint. Chart 1 plots the basic balance – the sum of the current account balance and foreign investment – across G10 countries. It shows that at first blush, Norway, Switzerland, Sweden, and Australia are the most resilient from a funding standpoint, while New Zealand, the UK, and the US are the most vulnerable. In Chart 2, we rank G10 currencies on eight different criteria: The basic balance, which we highlighted above. Real interest rate differentials, using the 10-year tenor and headline inflation. Relative growth fundamentals, as measured by the Markit manufacturing PMI. Three fair value models which we use in-house. The first is our Purchasing Power Parity model, which adjusts consumption basket weights across the G10 to reflect a more apples-to-apples comparison. The second is our long-term fair value model (LTFV), which adjusts for productivity differentials between countries; and the final is our intermediate-term timing model (ITTM), which separates procyclical from safe-haven currencies by including a risk factor such as corporate spreads. All three models are equally weighted in our rankings. The net international investment position (NIIP), which highlights currencies that are most likely to witness either repatriation flows or a positive income balance in the current account. Finally, net speculative positioning, which tells us which currencies have crowded long positions, and which ones sport a consensus sell. Chart 2The Scandinavian Currencies Are Attractive
The Ukraine Crisis And Balance Of Payments
The Ukraine Crisis And Balance Of Payments
The conclusions from this chart are similar to our basic balance scenario – NOK, SEK, AUD, CHF, and JPY stand out as winners while GBP, NZD, and USD are the least attractive. The US dollar is a special case given its reserve currency status, with a persistent balance of payments deficit. The rise in the greenback amidst market volatility is a case in point. However, portfolio flows into the dollar also tend to be cyclical, so a resolution in the Ukraine/Russia conflict will put a cap on inflows. Equity portfolio flows had dominated financing of the US current account deficit but are relapsing (Chart 3). Bond portfolio flows have rebounded on the back of rising US yields, but US TIPS yields remain very low by historical standards (Chart 4). If they do not improve much further, specifically relative to other developed markets, it will be tough to justify further inflows into US Treasurys. Chart 3Equity Portfolio Flows Into The US Are Relapsing
Equity Portfolio Flows Into The US Are Relapsing
Equity Portfolio Flows Into The US Are Relapsing
Chart 4Bond Portfolio Flows Into The US Are Strong
Bond Portfolio Flows Into The US Are Strong
Bond Portfolio Flows Into The US Are Strong
In this week’s report, we look at the key drivers of balance of payments dynamics across the G10, starting with the US, especially amidst a scenario where the forfeit of foreign capital could come to the fore. United States Chart 5US Balance Of Payments
US Balance Of Payments
US Balance Of Payments
The US trade deficit continues to hit record lows at -$80.7 billion for the month of December. Over the last few years, it has become increasingly difficult to fund this widening trade deficit via foreign purchases of US Treasurys. A positive net income balance has allowed a slower deterioration in the US current account balance, though at -$214.8 billion for Q3, it remains close to record lows. The overall picture for both the trade and current account balance is more benign as a share of GDP, given robust GDP growth (Chart 5). That said, as a share of GDP, the trade balance stands at -3.5%, the worst in over a decade. Foreign direct investment into the US has been improving of late. This probably reflects an onshoring of manufacturing, triggered by the Covid-19 crisis. That said, despite this improvement, the US still sports a negative net FDI backdrop. In a nutshell, the basic balance in the US (the sum of the current account and foreign direct investment) is still deteriorating. The dollar tends to decline on a multi-year basis when the basic balance peaks and starts worsening. Euro Area Chart 6Euro Area Balance Of Payments
Euro Area Balance Of Payments
Euro Area Balance Of Payments
The trade balance in the euro area has significantly deteriorated in recent quarters, on the back of an escalating energy crisis. Russia’s invasion of Ukraine marks the cherry on top. On a rolling 12-month basis, the trade surplus has fallen to 1% of GDP (Chart 6). This is particularly telling since for the month of December, the trade balance came in at €-4.6 billion, the worst since the euro area debt crisis. The current account continues to post a surplus of 2.6% of GDP, on the back of a positive income balance. However, FDI inflows are relapsing. After about two decades of underinvestment in the euro area, FDI inflows were at their highest level, to the tune of about 2% of GDP in 2021. Those have now completely reversed on the back of uncertainty. The combination of an energy crisis and dwindling FDI is crushing the euro area’s basic balance surplus. A rising basic balance surplus has been one of the key pillars underpinning a bullish euro thesis. Should the deterioration continue, it will undermine our longer-term bullish stance on the euro. It is encouraging that portfolio investments have turned less negative in recent quarters, as bond yields in the euro area are rising. Should this continue, it will be a good offset to the deterioration in FDI. Japan Chart 7Japan Balance Of Payments
Japan Balance Of Payments
Japan Balance Of Payments
Like the euro area, the trade balance in Japan continues to be severely hampered by rising energy imports. The trade deficit in January deteriorated to a near record of ¥2.2 trillion, even though export growth remained very robust. Income receipts from Japan’s large investment positions abroad continue to buffer the current account, but a resolution to the energy crisis will be necessary to stem Japan’s basic balance from deteriorating (Chart 7). The process of offshoring has sharply reversed since the Covid-19 crisis. While FDI is still deteriorating, it now stands at -2.4% of GDP, compared to -4.3% just before the pandemic. Net portfolio investments are also accelerating, especially given the rise in long-term interest rates in Japan, positive real rates, and the value bias of Japanese equities. We are buyers of the yen over the long term, but a further rise in global yields and energy prices are key risks to our view. United Kingdom Chart 8UK Balance Of Payments
UK Balance Of Payments
UK Balance Of Payments
The UK has the worst trade balance in the G10, and the picture has not improved much since the pandemic (currently at -6.7% of GDP). Similar to both the euro area and Japan, much of the drag on the trade balance has been due to rising import costs from energy and fuels. This puts the UK at risk of an escalation in the conflict between Ukraine and Russia. Meanwhile, the improvement in the income balance over the last few years has started to deteriorate, as transfer payments under the Brexit withdrawal agreement kick in. As a result, the current account balance is deteriorating anew (Chart 8). Both portfolio and direct investment in the UK were robust in the post-Brexit environment but have started to deteriorate. This is critical since significant foreign investment is necessary to boost productivity in the UK and prevent the pound from adjusting much lower. With bond yields in the UK rising, and the FTSE heavy in cyclical stocks, this should limit further deterioration in the UK’s financial account. A significant drop in the estimated path of settlement payments for Brexit will also boost the income balance. The key for the pound over the coming years remains how fast the UK can improve productivity, which will convince foreign investors that the return on capital for UK assets will increase. Canada Chart 9Canada Balance Of Payments
Canada Balance Of Payments
Canada Balance Of Payments
Canada’s domestic economy has been relatively insulated from the geopolitical shock in Europe, but its export sector is benefiting tremendously from it. Rising oil prices are boosting Canadian terms of trade. As a result, the current account has turned into a surplus for the first time since 2009, in part driven by an improving trade balance (Chart 9). Outside of trade, part of the improvement in the Canadian current account balance is specifically driven by income receipts from Canada’s positive net international investment position. At C$1.5 trillion, income receipts are becoming an important component of the current account balance. Foreign direct investment into Canada continues to remain robust, given strong commodity prices. This is boosting our basic balance measure, which today sits at a surplus of 2.4% of GDP and should continue to improve. Finally, because of Canada’s improving balance-of-payments backdrop, it is no longer reliant on foreign capital as it had been in the past, which supports the loonie. Australia Chart 10Australia Balance Of Payments
Australia Balance Of Payments
Australia Balance Of Payments
Australia continues to sport the best improvement in both its trade and current account balances over the last few years. As a result, the basic balance has eclipsed 4% of GDP for the first time since we have been measuring this series (Chart 10). The story for Australia remains improving terms of trade, specifically in the most desirable commodities – copper, high-grade iron ore, liquefied natural gas, and to a certain extent, high-grade coal. Foreign direct investment in Australia has eased significantly. Investment in projects in the resource space are now bearing fruit, easing the external funding constraint. Meanwhile, domestic savings can now be easily recycled for sustaining capital investment. In fact, foreign direct investment turned negative in Q4 2021. This also explains the drop in net portfolio investment since Australians now need to build a positive net international investment position. We have a limit buy on the Aussie dollar at 70 cents, as we are bullish the currency over a medium-term horizon. New Zealand Chart 11New Zealand Balance Of Payments
New Zealand Balance Of Payments
New Zealand Balance Of Payments
For the third quarter of 2021, New Zealand’s current account balance hit record lows, despite robust commodity (agricultural) prices. Imports of fertilizers, crude oil, and vaccines have led to a widening trade deficit. A drop in the exports of wood also affected the balance. With a negative net international investment position of about 48% of GDP, the income balance also subtracted from the current account total (Chart 11). From a bigger-picture perspective, New Zealand’s basic balance has been negative for many years, as coupon and dividend payments to foreign investors, as well as valuation adjustments from net foreign liabilities, have kept the current account in structural deficit. However, as the prices of key agricultural goods head higher, New Zealand can begin to benefit from a terms-of-trade boom that will limit its external funding requirement. In that respect, portfolio investments are also improving. New Zealand has the highest bond yield in the G10, on the back of the highest policy rate so far (the RBNZ raised interest rates again this week). New Zealand’s defensive equity market has also corrected sharply amidst the general market riot. As such, foreign investors could begin to favor this market again based on high yields and a reset in valuations. Going forward, New Zealand should continue to see further improvement in its basic balance relative to the US, supporting the kiwi. Switzerland Chart 12Switzerland Balance Of Payments
Switzerland Balance Of Payments
Switzerland Balance Of Payments
The Swiss trade balance remains in a structural surplus, with a post Covid-19 boom that has led a new high as a share of GDP (Chart 12). Global trade has been rather resilient due to high demand for goods. While Switzerland has a large net international investment position, income flows this quarter were hampered by servicing costs for foreign direct investments. The net international investment position did improve by CHF27 billion on a quarter-over-quarter basis in Q3, on the back of a net increase in foreign asset purchases. Currency movements also had little impact on the portfolio in Q3, which is atypical. The SNB will always have to contend with a structural trade surplus that puts upward pressure on the currency. This will keep the Swiss franc well bid, especially in times of crisis when the positive balance-of-payments backdrop makes the CHF a safe haven. Norway Chart 13Norway Balance Of Payments
Norway Balance Of Payments
Norway Balance Of Payments
Q3 2021 saw a strong recovery in Norway’s trade account that is likely to carry over to this year. A recovery in crude oil and natural gas prices was a welcome boon. The lack of tourism also boosted the services account (Norwegians travel and spend less abroad than foreigners visiting Norway). The ongoing electricity crisis in Europe was also an opportune export channel for Norway, which for the first time, opened its 450-mile-long, 1400-megawatt North Sea cable link to the UK. Positive income flows also benefit the current account and the krone (Chart 13). With one of the largest NIIPs in the world heavily skewed towards equity dividends, the NOK benefits when yields rise, even though the domestic fixed-income market is highly illiquid. While a resolution of the Russian-Ukrainian crisis could sap the geopolitical risk premium from oil, the reopening of the global economy will benefit Norwegian exports of oil and gas. Tepid investment in global oil and gas exploration will also ensure Norway’s terms of trade remain robust. Sweden Chart 14Sweden Balance Of Payments
Sweden Balance Of Payments
Sweden Balance Of Payments
The Swedish current account balance has deteriorated slightly in the last few quarters, on the back of supply-side bottlenecks. Particularly, exports of cars have been hampered amidst a semiconductor shortage. That said, the primary income surplus remains a key pillar of the current account, keeping the basic balance at a healthy surplus of about 6% of GDP (Chart 14). Portfolio inflows into Sweden have dwindled, like most other European economies. If this has been due to geopolitical tensions in Europe, it will eventually prove to be fleeting. That said, the Riksbank remains one of the most dovish in the G10 and the OMX is also one of the most cyclical stock markets, which may have spooked short-term foreign investments. The Swedish krona has been the weakest G10 currency year-to-date. Given that we expect most of the headwinds to be temporary, and the basic balance backdrop remains solid, we will go long SEK versus both the euro and the US dollar. Chester Ntonifor Foreign Exchange Strategist chestern@bcaresearch.com Trades & Forecasts Strategic View Cyclical Holdings (6-18 months) Tactical Holdings (0-6 months) Limit Orders Forecast Summary
Feature This week, we present the third edition of the BCA Research Global Fixed Income Strategy (GFIS) Global Credit Conditions Chartbook – a review of central bank surveys of bank lending standards and loan demand. The data from lending surveys during the last quarter of 2021 were mixed, with business credit standards easing in the US, Japan, Canada, and New Zealand while remaining mostly unchanged in the euro area and UK (Chart 1). Supply chain disruptions have had a two-pronged effect on borrowing. While they have hurt business confidence and prospects, they have also created loan demand as firms look to replenish depleted inventory stocks. The overall picture is one of solid economic fundamentals that are nonetheless perturbed by inflation concerns and lingering uncertainty regarding Covid-19 infections. Chart 1Credit Standards Eased In Most Developed Markets In Q4/2021
Credit Standards Eased In Most Developed Markets In Q4/2021
Credit Standards Eased In Most Developed Markets In Q4/2021
An Overview Of Global Credit Conditions Surveys Chart 2Credit Standards And Spreads Are Correlated
Credit Standards And Spreads Are Correlated
Credit Standards And Spreads Are Correlated
After every quarter, major central banks compile surveys to assess prevailing credit conditions. The purpose is to obtain from banks an assessment of how their lending standards and demand for loans, for both firms and consumers, changed over the previous quarter. Most surveys also ask questions about the key factors driving these changes and expectations for the next quarter.1 For fixed income investors, these surveys are valuable for a few reasons. Firstly, data on consumer lending is a window into consumer health while business loan demand sheds light on the investment picture. These help derive a view on the path of future economic growth and interest rates and thus, the appropriate duration stance of a bond portfolio. Also, credit standards can tell us about the pass-through from fiscal and monetary policy measures to realized financial conditions (i.e. corporate borrowing rates). Most importantly, credit standards exhibit a direct correlation with corporate bond spreads (Chart 2). As they have access to detailed, non-public information on a large number of borrowers, loan officers are uniquely positioned to evaluate corporate health. When banks are tightening standards, they see an issue with the credit quality of either current or future loans, which impacts borrowing costs in the corporate bond market. Tightening standards indicate a worsening borrowing backdrop and weaker growth, which then pushes up corporate spreads. Vice-versa, easing standards imply a favorable backdrop and plentiful liquidity—both bullish signs for spread product. US In the US, a net percentage of domestic respondents to the Fed’s Senior Loan Officer Survey, reported easing standards for commercial and industrial (C&I) loans to firms of all sizes over Q4/2021 (Chart 3). This marks the fourth consecutive quarter of easing standards. However, banks did report a slower pace of easing, which correlates with tighter financial conditions on the margin (top panel). While we are still in a period of easy financial conditions in absolute terms, this could soon start to change as hot inflation prints and booming economic data cause the Fed to turn increasingly hawkish. Despite this, banks expect to ease standards further over 2022, indicating confidence that underlying economic fundamentals and corporate health will be able to weather monetary tightening. US banks also reported stronger C&I loan demand from all firms in Q4, marking three consecutive quarters of improvement (middle panel). The picture was optimistic, with banks attributing increased loan demand to inventory financing, mergers & acquisitions, and fixed investment. Meanwhile, only 4.2% and 12.5% of banks saw a decrease in internal funds and increasing precautionary demand, respectively, as somewhat important. Inventories accounted for all but 2% of the 6.9% annualized GDP growth in Q4. With inventory stocks still depressed in absolute terms, we expect inventory restocking will continue to buoy demand over 2022. Chart 3US Credit Conditions
US Credit Conditions
US Credit Conditions
Chart 4US Loan Demand Outlook For 2022
Q1/2022 Credit Conditions Chartbook: Tightening Cometh?
Q1/2022 Credit Conditions Chartbook: Tightening Cometh?
On the consumer side, banks reported easier standards across the board, with standards easing for credit card, auto, and other consumer loans (bottom panel). However, the pace of easing, which has historically been good at calling turning points in consumer confidence (on a rate-of-change basis), appears to have peaked. Consumer sentiment has already been battered by rampant inflation and falling real wage expectations; tighter credit standards down the road could prove to be a further headwind. As part of the one-off special questions in this edition of the survey, respondents were asked about the reasoning behind their outlook for loan demand over 2022 (Chart 4). Of those that expected higher demand, 70% cited higher spending and investment demand from borrowers as their income prospects improved. Meanwhile, only 33% thought that precautionary demand for liquidity would be a factor. Lenders thought that both, a worsening or an improvement in supply chain disruptions, could contribute to increased demand. 53% expected that continued disruption would create greater inventory financing needs. Meanwhile, 55% expected that easing supply chain troubles would boost demand as product availability concerns faded. Of those that expected weaker loan demand, interest rates were by-and-large the biggest factor, with an overwhelming 96% believing that rising rates would quell loan demand. This was followed by concerns that supply chain disruptions would keep prices high and product availability scarce (70%). On the whole, the responses capture a US economy that is at a tipping point, with market participants watching to see how it weathers an aggressive rate hiking cycle from the Fed. While underlying economic variables such as growth and employment remain strong, it still remains to be seen how much of a tightening in financial conditions the markets can bear. Euro Area In the euro area, banks on net reported a very slight tightening of standards to enterprises for the second consecutive quarter in Q4/2021 (Chart 5). Effectively, standards were unchanged as 96 of the 100 respondents to the survey reported no change from Q3. Slightly lower risk tolerance from banks contributed to tightening while lower risk perceptions related to the general economic outlook and the value of collateral had an easing effect. As in the US, standards in the euro area do show a correlation to overall financial conditions. Those have already tightened noticeably since the February 3rd meeting of the European Central Bank (ECB) Governing Council where President Lagarde set a more hawkish tone. While banks do expect a slight easing of standards over Q1/2022, that is unlikely given high inflation and geopolitical uncertainties which will negatively impact risk perceptions. Chart 5Euro Area Credit Conditions
Euro Area Credit Conditions
Euro Area Credit Conditions
Chart 6Credit Demand In Major Euro Area Economies
Credit Demand In Major Euro Area Economies
Credit Demand In Major Euro Area Economies
Loan demand growth from enterprises was remarkably strong in Q4, with 18% of firms reporting increased demand for loans (middle panel). The main driver was increased demand for inventories, followed closely by fixed investment and merger & acquisition needs. Loan demand leads realized growth in inventories, which has been already been picking up. In Q1, banks expect continued growth in loan demand, albeit at a slower pace. On the consumer side, however, loan demand only increased slightly, with the pace of growth slowing from the previous quarter (bottom panel). This was in line with consumer confidence taking a hit from rising inflation and the Omicron variant in the fourth quarter. The generally low level of interest rates had a small positive impact, while durable goods spending had a slight negative impact on consumer credit demand. Lenders expect moderate growth in consumer credit demand in Q1. Moving to the four major euro area economies, demand for loans to enterprises picked up in Germany, France, and Italy, while remaining unchanged in Spain (Chart 6). Fixed investment needs made a positive contribution across the board. This is corroborated by data on total lending, which is still growing on a year-on-year basis, even though the pace of growth is slowing in all the major euro area economies except Spain. UK In the UK, overall corporate credit standards eased slightly in Q4/2021, marking the fourth straight quarter of easing (Chart 7). However, there was dispersion along firm size. Large private non-financials accounted for all the easing and standards for small and medium firms actually tightened slightly. Going forward, lenders expect a further easing in standards in Q1, about on par with the easing seen in Q4. Chart 7UK Credit Conditions
UK Credit Conditions
UK Credit Conditions
Chart 8UK Lenders Expect A Robust Growth To Ease Credit Availability
Q1/2022 Credit Conditions Chartbook: Tightening Cometh?
Q1/2022 Credit Conditions Chartbook: Tightening Cometh?
On the demand side, lenders reported slightly weaker corporate demand for lending in Q4. Again, the results were uneven across firm size – loan demand from large firms strengthened moderately, while demand from small and medium firms weakened. On average, lenders expect a slight pickup in corporate demand over Q1. Moving to the UK consumer, demand for unsecured lending continued to rise at a brisk pace, hovering around the highest levels since Q4/2014 (bottom panel). Going forward, lenders expect a continued increase in demand, but at a much slower pace. The strong developments in loan growth are seemingly at odds with the GfK consumer confidence index which has declined a total of 12 points since its July peak. Although the Bank of England does not survey respondents on the factors driving household unsecured lending demand, the divergence between confidence and loan demand suggests that precautionary demand for liquidity is playing a role. This lines up with the GfK survey, where expectations for the general economic situation over the next year are in freefall with consumers bracing for high inflation and further Bank Rate increases. Pivoting back to the drivers of corporate lending, the leading factor behind increased credit availability was an improvement in the overall economic outlook, followed by market share objectives (Chart 8). In contrast to the UK consumer, lenders are bullish on the economic outlook and believe it will continue to drive further easing over Q1/2022. On the demand side, investment in commercial real estate, which has seen steady improvement since Q3/2020, was the leading factor. This was followed by merger & acquisition and inventory financing needs. Capital investment needs, meanwhile, were a drag on demand. Moving forward, real estate investment and inventory restocking needs are expected to drive demand. Japan In Japan, credit standards to firms and households continued to ease in Q4/2021 (Chart 9). However, more than 90% of respondents in each case reported that standards were basically unchanged, and there were no reported instances of tightening among the sample of 50 lenders. Those that did report easier standards cited aggressive competition from other banks and strengthened efforts to grow the business. The vast majority of lenders expect standards to remain unchanged over Q1, but there is a slight easing expected on a net percentage basis. Chart 9Japan Credit Conditions
Japan Credit Conditions
Japan Credit Conditions
Business loan demand on the whole was unchanged in Q4 although small and medium firms did increase demand slightly (middle panel). In contrast to other regions, business loan demand tends to behave counter-cyclically in Japan, with businesses borrowing more on a precautionary basis when they are pessimistic and vice-versa. Those dynamics were at play in Q4, with lenders attributing increased demand to a fall in firms’ internally generated funds. Banks expect a slight net pickup in demand next quarter, in line with business confidence which has fallen from its September peak on the back of concerns about Covid-19 infections, supply chain disruptions, and rising input prices. On the consumer side, loan demand was basically unchanged, with a very small net percentage of banks reporting weaker demand (bottom panel). The key reason for decreased demand was a decrease in household consumption, which is in line with retail sales, where the pace of growth has been falling. Even though core inflation in Japan is low, consumers are still exposed to rising energy prices, which might cause them to tighten other parts of their budgets. Canada Chart 10Canada Credit Conditions
Canada Credit Conditions
Canada Credit Conditions
In Canada, business lending standards continued to ease at a slightly slower pace in Q4/2021 (Chart 10). This marks the fourth consecutive quarter of easing conditions, coming amid booming economic activity, high capacity utilization, and buoyant sentiment. Both, price and non-price lending conditions eased at roughly the same pace. On the consumer side, non-mortgage lending conditions continued to ease, but at a slower pace (middle panel). 1-year ahead consumer spending growth expectations, sourced from the Bank of Canada’s (BoC) Survey Of Consumer Expectations, and non-mortgage lending conditions typically display an inverse correlation, with expected spending growth increasing when standards are getting easier on the margin and vice-versa. The divergence in Q4 is explained in part by excess savings accumulated during the pandemic that have yet to be spent down, and in part by expected price increases over the coming year. In either case, it demonstrates that nominal spending has room to grow even in an environment where consumer credit availability is worsening. We also saw mortgage standards ease at a slightly slower pace in Q4, with both price and non-price lending conditions easing (bottom panel). While the BoC has made a hawkish pivot, underlying conditions are still easy – the conventional 5-year mortgage rate is still flat at 4.79%, the same level as Q3/2020. However, house price growth has peaked, and rate hikes this year will help prices moderate further. New Zealand Chart 11New Zealand Credit Conditions
New Zealand Credit Conditions
New Zealand Credit Conditions
In New Zealand, business credit standards eased in the six month period ended September 2021 (Chart 11). However, the real impact of the Reserve Bank of New Zealand’s (RBNZ) tightening is being felt in the housing market, where actual standards entered tightening territory. More importantly, a net 23.1% of respondents expect mortgage credit availability to erode by the end of March; if realized, this figure would be a series high. Banks reporting less credit availability cited regulatory changes and risk perceptions. On the mortgage loan demand side, banks continued to see increased demand even after the record spike in March 2021 (middle panel). Going forward, demand is expected to moderate and fall from current levels. These dynamics have already made their mark on house prices which have already peaked, indicating that the RBNZ’s push is working as intended. Business loan demand does not appear to have been much affected by higher rates, with demand picking up slightly and expected to increase going forward (bottom panel). However, confidence has been falling since September 2021, with businesses feeling the twin bite of supply chain disruptions and labor shortages. Shakti Sharma Senior Analyst ShaktiS@bcaresearch.com Appendix: Where To Find The Bank Lending Surveys A number of central banks publish regular surveys of bank lending conditions in their domestic economies. The surveys, and the details on how they are conducted, can be found on the websites of the central banks: US Federal Reserve: https://www.federalreserve.gov/data/sloos.htm European Central Bank: https://www.ecb.europa.eu/stats/ecb_surveys/bank_lending_survey/ Bank of England: https://www.bankofengland.co.uk/credit-conditions-survey/2021/2021-q4 Bank of Japan: https://www.boj.or.jp/en/statistics/dl/loan/loos/index.htm/ Bank of Canada: https://www.bankofcanada.ca/publications/slos/ Reserve Bank of New Zealand: https://www.rbnz.govt.nz/statistics/c60-credit-conditions-survey Footnotes 1 The weblinks to each individual survey for the US, euro area, UK, Japan, Canada and New Zealand can be found in the Appendix on page 12. GFIS Model Bond Portfolio Recommended Positioning Active Duration Contribution: GFIS Recommended Portfolio Vs. Custom Performance Benchmark
Q1/2022 Credit Conditions Chartbook: Tightening Cometh?
Q1/2022 Credit Conditions Chartbook: Tightening Cometh?
The GFIS Recommended Portfolio Vs. The Custom Benchmark Index
Q1/2022 Credit Conditions Chartbook: Tightening Cometh?
Q1/2022 Credit Conditions Chartbook: Tightening Cometh?
Global Fixed Income - Strategic Recommendations* Duration Regional Allocation Spread Product Tactical Overlay Trades
Executive Summary The End Of The Negative Bond Yield Era
Europe Joins The Global Bond Bear Market
Europe Joins The Global Bond Bear Market
Recent price action in developed market government bond markets confirms a backdrop that has been in place for the past several years - movements in US Treasuries define the trend in global yields, but Europe sets the effective floor. Higher core European bond yields are also pushing up non-European yields, in the context of the current global monetary policy tightening cycle. The hawkish market pricing for the ECB this year has gone a bit too far, as the start of European rate hikes this year is more likely in Q4 than in the summer – and only after ECB asset purchases begin to formally wind down. In the UK, the Bank of England appears to be trying to front load policy tightening, both rate hikes and balance sheet runoff, in response to overshooting UK inflation. A shorter, sharper policy tightening cycle means that the UK Gilt curve will continue to bear-flatten. Bottom Line: Within the “Big 3” developed market central banks, the Fed and Bank of England are more likely to deliver discounted rate hikes than the ECB over the next 6-12 months. Remain underweight US Treasuries and UK Gilts versus German Bunds in global bond portfolios. Feature Chart 1A Global Repricing Of Interest Rate Expectations
A Global Repricing Of Interest Rate Expectations
A Global Repricing Of Interest Rate Expectations
Persistent elevated inflation readings are forcing policymakers to move up the timetable of expected cyclical interest rate increases, but without signaling any change to longer-term interest rate expectations. The result has been an upward move in bond yields led by a repricing of shorter-term yields, leading to bearish yield curve flattening pressure across the developed markets (Chart 1). As the global bond bear market has intensified and broadened across countries and fixed income sectors, the amount of bonds worldwide with negative yields has been slashed by $9 trillion since December (Chart 2). Some notable examples: the 10-year German Bund yield is now up to +0.26%, the 30-year US real TIPS yield is now at +0.04% and even the 5-year Japanese government bond yield climbed to +0.02% for the first time since 2016. Last week, bond markets had to digest both a 25bp Bank of England (BoE) rate hike - that was almost a 50bp move - and a huge upside surprise in the January US employment report. However, it was the more hawkish-than-expected messaging from the European Central Bank (ECB) that really rattled fixed income markets. At the February monetary policy meeting, ECB President Christine Lagarde opened the door to potential ECB rate hikes this year, a notable change from the previous forward guidance that rates would stay unchanged in 2022. This not only triggered a major decline in European government bond prices, but also notable jumps in bond volatility for both longer-term and, especially, shorter-term yields. Implied volatilities for swaptions on 2-year European swap rates now sit at the highest levels since the depths of the European Debt Crisis in 2011 (Chart 3). Chart 2The End Of The Negative Bond Yield Era
The End Of The Negative Bond Yield Era
The End Of The Negative Bond Yield Era
Chart 3The Front-Ends Of Yield Curves Awaken
The Front-Ends Of Yield Curves Awaken
The Front-Ends Of Yield Curves Awaken
Overnight index swap (OIS) curves are now discounting multiple rate hikes from the Fed (+127bps), BoE (+125bps) and ECB (+46bps) this year. Tighter monetary policy is the inevitable consequence of the current combination of steady above-trend growth, tight labor markets and very high inflation in those countries. This mix will continue to put upward pressure on global bond yields through a blend of steady inflation expectations and higher real yields as pandemic era monetary stimulus is removed – a process that is already underway in the US and Europe (Chart 4). Our Central Bank Monitors – designed to measure the cyclical pressure to change monetary policy – are all indicating the need for tightening in the US, UK and euro area. However, the risk is that tightening perceived to be too aggressive or too rapid will be received poorly by financial markets that have grown accustomed to easy money policies during the pandemic. Given the current starting point of high equity valuations and relatively tight corporate credit spreads in the US, financial conditions are no impediment to additional Fed rate hikes in 2022 (Chart 5). The same cannot be said in the UK, where the steady appreciation of the trade-weighted pound is tightening financial conditions, on the margin. In the euro area, financial conditions remain relatively stimulative, as the euro is undervalued on a trade-weighted basis. Chart 4A Recipe For Even Higher Bond Yields
A Recipe For Even Higher Bond Yields
A Recipe For Even Higher Bond Yields
Given high realized inflation, financial stability concerns are playing a secondary role in the policy deliberations of central banks facing an inflation-fighting credibility crisis. In the absence of a big fall in inflation, it will take much larger selloffs in equity and corporate credit markets than what has occurred so far in 2022 before policymakers would step back from interest rate increases over the next year. Chart 5Financial Conditions Are No Impediment To Rate Hikes
Financial Conditions Are No Impediment To Rate Hikes
Financial Conditions Are No Impediment To Rate Hikes
The ECB Will Lag The Fed On Rate Hikes Chart 6Faster Growth & Slower Inflation Expected In 2022
Faster Growth & Slower Inflation Expected In 2022
Faster Growth & Slower Inflation Expected In 2022
One of our highest conviction bond market views to begin 2022 called for US Treasuries to underperform German Bunds. Our view was based on the likelihood that the Fed would lift the fed funds rate multiple times this year and the ECB was likely to hold off on rate hikes until the first half of 2023 at the earliest. Last week’s shift in the ECB’s tone does not change that relative call. The Fed is still under far greater pressure to hike rates than the ECB, even if there is now a greater chance that the ECB could begin to tighten by the end of 2022. From an economic growth perspective, both central banks have good reasons to consider withdrawing monetary accommodation. The economic expectations in both the US and euro area have started to recover, according to the ZEW survey of financial market professionals, with a bigger bounce seen in the latter since the trough of last October (Chart 6). The fading Omicron wave is likely playing a large role in lifting economic expectations, as the variant has proven to be less lethal than previous waves of the virus. The ZEW survey also asks respondents about their views on future inflation and interest rate changes. The ZEW Inflation Expectations index has fallen back to pre-pandemic lows in both the US and euro area, indicating that a majority expect lower inflation in the US and Europe over the next year. Both the Fed and ECB also expect inflation to fall from current elevated levels this year. However, there is still a much stronger case for tightening in the US given the tight labor market that is pushing up wages. Last week’s January US payrolls data was a shocker, with employment rising +476,000 on the month when some forecasters were calling for an outright contraction in jobs due to the impact of the Omicron variant. Wage growth accelerated smartly, with average hourly earnings up 0.7% on the month and 5.7% on a year-over-year basis (Chart 7). This continues the trend of wage acceleration seen in other data series like the Employment Cost Index, confirming that the US labor market is tight enough to elicit a strong policy response from the Fed. In the euro area, the recent economic data has been a bit more mixed. The Markit manufacturing PMI rose to a five-month high of 59.0 in January, beating expectations. However, the services PMI fell to a nine-month low of 51.2 as renewed COVID lockdowns weighed on consumer confidence and spending (Chart 8). With Omicron numbers now slowing, some recovery in consumer spending is likely over the next few months as euro area governments reduce restrictions. However, the manufacturing recovery will struggle to gain significant upside momentum without stronger demand for European exports – an outcome that is not currently heralded by an upturn in reliable indicators like the global leading economic indicator or the China credit impulse (Chart 9). Chart 7Persistent US Labor Market Strength
Persistent US Labor Market Strength
Persistent US Labor Market Strength
Chart 8A Mixed Picture On European Growth
A Mixed Picture On European Growth
A Mixed Picture On European Growth
Even within the euro area inflation data, there are mixed trends that make it less clear that a major tightening cycle is necessary. Headline euro area HICP inflation hit a 37-year high of 5.1% in January, which was heavily influenced by a 28.6% rise in the energy component of the index (Chart 10). Goods price inflation reached 6.8%, its highest level since 1991, fueled by global supply chain disruptions and greater consumer demand for goods versus services during the pandemic. For the latter, services inflation reached a much more subdued 2.4% in January, in line with core HICP inflation of 2.3%. We expect goods price inflation to slow substantially, on a global basis and not just in Europe, as supply chain disruptions ease over the course of 2022 and consumers shift spending back towards services from durable goods as economies reopen post-Omicron. Chart 9A Gloomy Picture For European Exports
A Gloomy Picture For European Exports
A Gloomy Picture For European Exports
Chart 10European Inflation Surge Focused On Energy & Goods
European Inflation Surge Focused On Energy & Goods
European Inflation Surge Focused On Energy & Goods
Surging oil and natural gas prices will keep the energy component elevated over the next few months, particularly if geopolitical tensions over Ukraine result in Russia withholding natural gas supplies to Europe. Yet it is not clear how much of this will pass through to core inflation, which actually decelerated in January from the 2.6% pace seen in December 2021 despite surging energy prices. What does a typical ECB liftoff look like? Should the ECB focus more on the headline or core inflation numbers when deciding if rate hikes are necessary later this year? The answer may lie more in the breadth across countries, rather than depth across sectors, of euro area inflation pressures. In the relatively short history of the ECB, dating back to the inception of the euro in 1998, there have been only three monetary tightening episodes that involved interest rate increases: 1999-00, 2006-08 and 2011. In Chart 11, we show the percentage share of individual euro area countries that have accelerating growth momentum (measured as a leading economic indicator above the level of a year earlier), and with headline/core inflation above the ECB’s 2% target. In all three of those past ECB tightening episodes, essentially all euro area countries had to see strong growth or inflation at or above the ECB target before the ECB would hike rates. Chart 11The Growth & Inflation Conditions For An ECB Rate Hike Are In Place
The Growth & Inflation Conditions For An ECB Rate Hike Are In Place
The Growth & Inflation Conditions For An ECB Rate Hike Are In Place
Chart 12Watch European Wages To Determine The ECB's Next Move(s)
Watch European Wages To Determine The ECB's Next Move(s)
Watch European Wages To Determine The ECB's Next Move(s)
A similar story can be told looking at the state of the euro area labor market. The 1999-00 and 2006-08 tightening cycles occurred when nearly all euro area countries had an unemployment rate below the OECD’s estimate of the full employment NAIRU (Chart 12). Only in 2011, which was widely regarded as a major policy error, did the ECB hike rates without widespread labor market strength across the euro area. Right now, the breadth of the growth and inflation data across the euro area would indicate that the ECB will soon begin to tighten policy, if history is any guide. The one missing piece of the puzzle is faster wage growth. Euro area wage growth is severely lagging compared to other developed economies. For the last known data point in Q3/2021, wages were only growing at a 1.5% year-over-year rate. Wage growth has very likely accelerated since then, with the overall euro area unemployment rate now down to an all-time low of 7.0%, well below the OECD NAIRU estimate of 7.7%. The ECB will need to see confirmation of that faster wage growth in the data, however, before embarking on a path of rate hikes. Since last week’s ECB meeting, numerous ECB officials – including President Lagarde - have stated that asset purchases must stop before rate hikes can begin. While the ECB’s pandemic emergency bond buying program is set to end next month, the existing Asset Purchase Program is set to continue with no expiry date. If the ECB officials are to be taken at their word, it is very difficult to imagine a scenario where asset purchases would be fully wound down (i.e. net purchases of zero, with buying only to replace maturing bonds held by the ECB) before the July liftoff date now priced into the Euro OIS curve. Such a rapid removal of the ECB bid would be very disruptive to the riskier parts of European fixed income markets, like Italian and Greek sovereign debt, that have benefited from heavy ECB buying under the pandemic bond buying program. European bond strategy implications While an ECB rate hike in 2022 is now a more probable scenario, it is not yet a done deal. The European growth picture remains mixed, and inflation readings outside of supply-constrained energy and durable goods – including wages - are far less threatening than headline inflation. At the moment, underlying inflation pressures are far more intense in the US. Durable goods inflation in the US reached 16.8% on a year-over-year basis last month, but climbed to “only” 3.8% in Europe (Chart 13). The Cleveland Fed’s trimmed mean CPI index accelerated to 4.8% in January, compared to 3.0% for the euro area trimmed mean CPI inflation gauge constructed by our colleagues at BCA Research European Investment Strategy. Chart 13Stay Positioned For A Wider UST-Bund Spread
Stay Positioned For A Wider UST-Bund Spread
Stay Positioned For A Wider UST-Bund Spread
The Fed has a lot more work ahead of it in terms of tightening monetary policy to rein in inflation pressures (and inflation expectations) than the ECB. This will lead to a faster pace of rate hikes in the US than in Europe and renewed widening of the US Treasury-German Bund yield spread. Financial conditions in Europe will also play a role in limiting when, and how much, the ECB can eventually tighten monetary policy. Yields and spreads on the riskier parts of the European fixed income markets like Italian government bonds have already widened substantially in response to the more hawkish guidance from the ECB (Chart 14). The euro has also stabilized after the steady depreciation seen since the May 2021 peak. Markets are obviously pricing in an end to ECB asset purchases – the precursor to rate hikes – which would force the private sector to absorb a greater share of Italian bond issuance than has been the case over the past few years. It will likely take higher yields to entice those buyers compared to the price-insensitive ECB that has been buying Italian debt as a monetary policy tool. The speed of the adjustment in Italian bond yields has no doubt alerted the ECB Governing Council to the financial stability risks of moving too fast on tightening monetary conditions. We must acknowledge that most the recent trends in the Treasury-Bund spread (narrower) and Italian bond yields/spreads (higher) go against our current strategic recommendations to overweight European fixed income. Markets have moved to price in a far more aggressive move from the ECB than we had envisioned for 2022. However, as highlighted above, it is not clear that the ECB needs to dial back monetary accommodation as rapidly as markets now expect. Thus, we are sticking with our strategic recommendations to overweight euro area government bonds, both in the core and periphery, in global bond portfolios. At the same time, we continue to recommend a below-benchmark duration stance within dedicated European portfolios, even with the 10-year German Bund yield having already reached our end-2022 yield target of 0.25% (Chart 15). European bond yields will remain under upward pressure until euro area inflation finally peaks and the ECB will be under less pressure to tighten. Chart 14ECB Facing An "Italy-vs-Inflation" Tradeoff
ECB Facing An "Italy-vs-Inflation" Tradeoff
ECB Facing An "Italy-vs-Inflation" Tradeoff
Chart 15Too Much, Too Soon Priced Into Bund Yields
Too Much, Too Soon Priced Into Bund Yields
Too Much, Too Soon Priced Into Bund Yields
Bottom Line: Markets are overestimating how quickly the ECB can begin to tighten European monetary policy. An initial rate hike can occur in Q4 of this year, at the earliest, which is later than the current mid-summer liftoff date discounted in interest rate forwards. Ride out the current European rates volatility and stay overweight European government debt versus the US. UK Update: The BoE Wants To Tighten Fast At last week's policy meeting, the BoE Monetary Policy Committee (MPC) voted 5-4 to raise Bank Rate by 25bps to 0.5%. That close vote is less dovish than it appears, though, as the four “dissenting” MPC members wanted to raise rates by 50bps instead! This was a hawkish surprise that resulted in bearish flattening of the UK Gilt yield curve. Chart 16UK Gilts: Volatile, But Underperforming
UK Gilts: Volatile, But Underperforming
UK Gilts: Volatile, But Underperforming
We have maintained a below-benchmark strategic recommendation on Gilts since August of last year. The relative performance of Gilts versus the Bloomberg Global Treasury benchmark index has seen tremendous volatility since then, particular after the BoE delayed the expected initial rate hike last November (Chart 16) Gilts began to underperform again after the BoE hiked in December and have continued to be one of the worst performing G10 bond markets, validating our bearish call. After last week’s BoE hike, we still see value in betting on additional Gilt underperformance, as markets may still be underestimating how high the BoE will have to raise rates in the current tightening cycle. In the new set of economic projections from the BoE’s Monetary Policy Report published last week, the central bank raised its expectation for the April peak in UK inflation to 7.25% (Chart 17). This compares to the latest inflation rate of 5.4%. Higher energy and goods prices account for three-quarters of that expected inflation increase, according to the BoE. UK inflation is projected to fall rapidly from that April peak, in response to an expected deceleration of energy and goods prices and slower UK economic growth. However, the Monetary Policy Report also highlighted that domestic UK cost pressures are intensifying in response to a very tight UK labor market. The BoE’s Agents’ survey of UK businesses reported that UK firms continue to have difficulty filling job openings, while also having success in passing on rising labor costs into selling prices. Thus, the UK labor market is now the critical variable to watch to determine how many more rate hikes the BoE will need to deliver in the current cycle. On that note, the BoE expects UK wage growth to accelerate to just under 5% over the next year, which is well above the central bank’s estimate of “underlying” pre-pandemic wage growth around 3.5%. Inflation expectations in the UK remain elevated. The YouGov/Citigroup survey shows that UK consumers expect inflation to be 4.8% on year from now and 3.8% 5-10 years ahead (Chart 18, top panel). Market-based inflation expectations have been more volatile of late but CPI swaps are pricing in inflation of 5.0% in two years and 4.2% in ten years.1 Thus, by any measure – realized inflation, expected inflation or wage growth – UK inflation is too high, which justifies tighter monetary policy. The UK OIS curve now discounts a peak in Bank Rate of 1.85% in April 2023, but this is immediately followed by rate cuts that take Bank Rate to 1.5% by the end of 2024. That path over the next year is a bit more hawkish than the results from the BoE’s new Market Participants Survey of bond investors, which showed an expected peak in Bank Rate of 1.5% sometime in the latter half of 2023. In both cases, Bank Rate is expected to settle below the BoE’s 2% inflation target, or below current inflation expectations. Suggesting an implied belief that the BoE will not be able to raise real interest rates into positive territory. In terms of forward guidance, several BoE officials have noted that they expect that only a few more hikes will be needed to help bring UK inflation back down to the 2% target. Yet the OIS curve is pricing in a “policy error” scenario where the BoE pushes up rates too rapidly and is then forced to cut rates soon afterward. We see both the BoE guidance and the OIS pricing as far too cautious on the eventual peak in Bank Rate, which leads us to maintain our underweight recommendation on UK Gilt exposure, both in terms of duration and country allocation in global bond portfolios. Chart 17BoE Sees A Short, Sharp Shock From Inflation & Rates
BoE Sees A Short, Sharp Shock From Inflation & Rates
BoE Sees A Short, Sharp Shock From Inflation & Rates
We have also been recommending a Gilt curve steepening trade in our Tactical Overlay portfolio on page 20 since last October. This trade went long a 10-year Gilt bullet versus a barbell combination of a 7-year and 30-year Gilt. Chart 18Stay Underweight UK Gilts
Stay Underweight UK Gilts
Stay Underweight UK Gilts
Our view at the time of trade inception was that a Gilt steepener would benefit from a scenario where the market would be forced to reassess how high rates would go in the next BoE tightening cycle. However, the BoE now appears to be “front loading” the tightening cycle by moving rates sooner and more aggressively, as evidenced by the near 50bp rate hike last week, while also moving to an accelerated runoff of bonds accumulated during quantitative easing operations. The Gilt yield curve has flattened considerably in response to increasing BoE hawkishness, with the yield spread between the 10-year and 2-yield Gilt now down to a mere +17bps. While we still see the potential for the longer-end of the Gilt curve to rise in response to an eventual repricing of terminal rate expectations that appear too low, the BoE’s acceleration of its hiking timetable will make it difficult for the curve to bearishly steepen in the near term. Thus, we are closing out our tactical Gilt curve steepener at a small gain of +23bps. Robert Robis, CFA Chief Fixed Income Strategist rrobis@bcaresearch.com Footnotes 1 UK CPI swaps, and inflation breakevens on index-linked Gilts, reference the UK Retail Price Index (RPI) which typically runs higher than the UK Consumer Price Index (CPI). This imparts an upward bias to UK inflation expectations when compared to CPI swaps and breakevens in other countries. Currently, RPI inflation is running at 7.5% compared to CPI inflation of 5.4%. GFIS Model Bond Portfolio Recommended Positioning Active Duration Contribution: GFIS Recommended Portfolio Vs. Custom Performance Benchmark
Europe Joins The Global Bond Bear Market
Europe Joins The Global Bond Bear Market
The GFIS Recommended Portfolio Vs. The Custom Benchmark Index Cyclical Recommendations (6-18 Months)
Europe Joins The Global Bond Bear Market
Europe Joins The Global Bond Bear Market
Tactical Overlay Trades
BCA Research is proud to announce a new feature to help clients get the most out of our research: an Executive Summary cover page on each of the BCA Research Reports. We created these summaries to help you quickly capture the main points of each report through an at-a-glance read of key insights, chart of the day, investment recommendations and a bottom line. For a deeper analysis, you may refer to the full BCA Research Report. Executive Summary The golden rule for investing in the stock market simply states: “Stay bullish on stocks unless you have good reason to think that a recession is imminent.” The catch, of course, is that it is difficult to know whether a recession is lurking around the corner. Still, we can learn a lot from past recessions. As we document in this week’s report, every major downturn was caused by the buildup of imbalances within the economy, which were then laid bare by some sort of catalyst, usually monetary tightening. Today, the US is neither suffering from an overhang of capital spending, as it did in the lead-up to the 2001 recession, nor an overhang of housing, as it did in the lead-up to the Great Recession. US inflation has risen, but unlike in the early 1980s, long-term inflation expectations remain well anchored. This gives the Fed scope to tighten monetary policy in a gradual manner. Outside the US, vulnerabilities are more pronounced, especially in China where the property market is weakening, and debt levels stand at exceptionally high levels. Fortunately, the Chinese government has enough tools to keep the economy afloat, at least for the time being. Equity Bear Markets And Recessions Go Hand In Hand
Equity Bear Markets And Recessions Go Hand In Hand
Equity Bear Markets And Recessions Go Hand In Hand
Bottom Line: Equity bear markets rarely occur outside of recessions. With global growth set to remain above trend at least for the next 12 months, investors should continue to overweight equities. However, they should underweight the tech sector since tech stocks remain disproportionately vulnerable to rising rates, increased regulation, and a retrenchment in pandemic-induced spending on electronics and online services. Macro Matters Investors tend to underestimate the importance of macroeconomics for stock market outcomes. That is a pity. Charts 1, 2, and 3 show that the business cycle drives the evolution of corporate earnings; corporate earnings, in turn, drive the stock market; and as a result, the business cycle determines the path for stock prices. Chart 1The Business Cycle Drives Earnings…
The Business Cycle Drives Earnings...
The Business Cycle Drives Earnings...
Chart 2…Earnings In Turn Drive Stock Prices…
...Earnings In Turn Drive Stock Prices...
...Earnings In Turn Drive Stock Prices...
An appreciation of macro forces leads to our golden rule for investing in the stock market. It simply states: Stay bullish on stocks unless you have good reason to think that a recession is imminent. Chart 3…Hence, The Business Cycle Is The Main Driver Of Equity Returns
...Hence, The Business Cycle Is The Main Driver Of Equity Returns
...Hence, The Business Cycle Is The Main Driver Of Equity Returns
Historically, stocks have peaked about six months before the onset of a recession. Thus, it usually does not pay to turn bearish on stocks if you expect the economy to grow for at least another 12 months. In fact, aside from the brief but violent 1987 stock market crash, during the past 50 years, the S&P 500 has never fallen by more than 20% outside of a recessionary environment (Chart 4). Peering Around The Corner The catch, of course, is that it is difficult to know whether a recession is lurking around the corner. Leo Tolstoy began his novel Anna Karenina with the words “Happy families are all alike; every unhappy family is unhappy in its own way.” By the same token, every economic boom seems the same, whereas every recession has its own unique features. This makes forecasting recessions difficult. Difficult, but not impossible. Even though recessions differ substantially in their magnitude and causes, they all share the following three characteristics: 1) The buildup of imbalances that make the economy vulnerable to a downturn; 2) A catalyst that exposes these imbalances; and 3) Amplifiers or dampeners that either exacerbate or mitigate the slump. Let us review six past recessions to better understand what these three characteristics reveal about the current state of the global economy. Chart 4Equity Bear Markets And Recessions Go Hand In Hand
Equity Bear Markets And Recessions Go Hand In Hand
Equity Bear Markets And Recessions Go Hand In Hand
The 1980 And 1982 Recessions The double-dip recessions of 1980 and 1982 were the last in which inflation played a starring role. Throughout the 1970s, the Fed consistently overstated the degree of slack in the economy (Chart 5). This led to a prolonged period in which interest rates stayed below their equilibrium level. The resulting upward pressure on inflation from an overheated economy was compounded by a series of oil shocks, the last of which occurred in 1979 following the Iranian revolution. Chart 6The Volcker Era: It Took Massive Monetary Tightening To Bring Down Inflation
The Volcker Era: It Took Massive Monetary Tightening To Bring Down Inflation
The Volcker Era: It Took Massive Monetary Tightening To Bring Down Inflation
Chart 5The Fed Continuously Overstated The Magnitude Of Economic Slack In The 1970s
The Fed Continuously Overstated The Magnitude Of Economic Slack In The 1970s
The Fed Continuously Overstated The Magnitude Of Economic Slack In The 1970s
In an effort to break the back of inflation, newly appointed Fed chair Paul Volcker raised rates, first to 17% in April 1980, and then following a brief interlude in which the effective fed funds rate dropped back to 9%, to a peak of 19% in July 1981 (Chart 6). The 1990-91 Recession Overheating also contributed to the early 1990s recession. After reaching a high of 10.8% in 1982, the unemployment rate fell to 5% in 1989, about one percentage point below its equilibrium level at that time. Core inflation began to accelerate, reaching 5.5% by August 1990. The Fed initially responded to the overheating economy by hiking interest rates. The fed funds rate rose from 6.6% in March 1988 to a high of 9.8% by May 1989. By the summer of 1990, the economy had already slowed significantly. Commercial real estate, still reeling from the effects of the Savings and Loan crisis, weakened sharply. Defense outlays continued to contract following the collapse of the Soviet Union. The final straw was Saddam Hussein’s invasion of Kuwait, which caused oil prices to surge and consumer confidence to plunge (Chart 7). The 2001 Recession An overhang of IT equipment sowed the seeds of the 2001 recession. Spending on telecommunications equipment rose almost three-fold over the course of the 1990s, which helped lift overall nonresidential capital spending from 11.2% of GDP in 1992 to 14.7% in 2000 (Chart 8). Chart 7Overheating In The Leadup To The 1990-91 Recession
Overheating In The Leadup To The 1990-91 Recession
Overheating In The Leadup To The 1990-91 Recession
The recession itself was fairly mild. After subsequent revisions to the data, growth turned negative for just one quarter, in Q3 of 2001. However, due to the lopsided influence of the tech sector in aggregate profits – and even more so, in market capitalization – the dotcom bust had a major impact on equity prices (Chart 9). Chart 9The Dotcom Bust Dragged Down Tech Earnings
The Dotcom Bust Dragged Down Tech Earnings
The Dotcom Bust Dragged Down Tech Earnings
Chart 8A Glut Of I.T. Equipment Sowed The Seeds Of The 2001 Recession
A Glut Of I.T. Equipment Sowed The Seeds Of The 2001 Recession
A Glut Of I.T. Equipment Sowed The Seeds Of The 2001 Recession
Having raised rates to 6.5% in May 2000, the Fed responded to the downturn by easing monetary policy. Falling rates were effective in reviving the economy – indeed, perhaps too effective. The resulting housing boom paved the way for the Great Recession. The Great Recession (2007-2009) The housing sector was the source of imbalances in the lead-up to the Great Recession. In the US, and in other countries such as Spain and Ireland, house prices soared as lenders doled out credit on increasingly lenient terms. Chart 10A Long House Party
A Long House Party
A Long House Party
Rising house prices stoked a consumption boom and incentivized developers to build more homes. In the US, the personal savings rate fell to historic lows. Residential investment reached a high of 6.7% of GDP, up from an average of 4.3% of GDP in the 1990s (Chart 10). While the housing bubble would have burst at some point anyway, tighter monetary policy helped expedite the downturn. Starting in June 2004, the Fed raised rates 17 times, pushing the fed funds rate to 5.25% by June 2006. The ECB also hiked rates; it raised the refi rate from 2% in December 2005 to 4.25% in July 2008, continuing to tighten policy even after the Fed had begun to cut rates. Once global growth started to weaken, a number of accelerants kicked in. As is the case in every recession, rising unemployment led to less spending, which in turn led to even higher unemployment. To make matters worse, a vicious circle engulfed the housing market. Falling home prices eroded the collateral underlying mortgage loans, producing more defaults, tighter lending standards, and even lower home prices. The Fed responded to the crisis by cutting rates and introducing an alphabet soup of programs to support the financial system. However, the zero lower-bound constraint limited the degree to which the Fed could cut rates, forcing it to resort to unorthodox measures such as quantitative easing. While these measures arguably helped, they fell short of what was needed to resuscitate the economy. Fiscal policy could have picked up the slack, but political considerations limited the scale and scope of the 2009 Recovery Act. The result was a needlessly long and drawn-out recovery. The Euro Crisis (2012) Chart 11The State Is Here To Mop Up The Mess
The State Is Here To Mop Up The Mess
The State Is Here To Mop Up The Mess
A reoccurring theme in economic history is that financial crises often force governments to assume private-sector liabilities in order to avoid a full-scale economic collapse. Unlike Greece, where government debt stood at very high levels even before the GFC, debt levels in Spain and Ireland were quite modest before the crisis. However, all that changed when Spain and Ireland were forced to bail out their banks (Chart 11). Unlike the US, UK, and Japan, euro area member governments did not have access to central banks that could serve as buyers of last resort for their debts. This limitation created a feedback loop where rising bond yields made it more onerous for governments to service their debts, which led to a higher perceived likelihood of default and even higher yields (Chart 12). Chart 12Multiple Equilibria In The Debt Market Are Possible Without A Lender Of Last Resort
The Golden Rule For Investing In The Stock Market
The Golden Rule For Investing In The Stock Market
The ECB could have short-circuited this vicious cycle. Unfortunately, under the hapless leadership of Jean-Claude Trichet, instead of providing assistance, the central bank raised rates twice in 2011. This helped spread the crisis to Italy and other parts of core Europe. It ultimately took Mario Draghi’s “whatever it takes pledge” to restore some semblance of normality to European sovereign debt markets. Lessons For Today The current environment bears some resemblance to the one preceding the recessions of the early 1980s. As was the case back then, inflation today has surged well above the Federal Reserve’s target, forcing the Fed to turn more hawkish. Oil prices have also risen, despite slowing global growth. Even Russia has returned to its status as the world’s leading geopolitical boogeyman. Yet, digging below the surface, there is a big difference between today and the early ‘80s. For one thing, long-term inflation expectations remain well anchored. While expected inflation 5-to-10 years out has risen to 3.1% in the latest University of Michigan survey, this just takes the reading back to where it was not long after the Great Recession. It is still nowhere near the double-digit levels reached in the early ‘80s (Chart 13). Market-based inflation expectations are even more subdued. In fact, the widely watched 5-year/5-year forward TIPS breakeven inflation rate is currently well below the Fed’s comfort zone (Chart 14). Chart 13Long-Term Inflation Expectations Are Inching Up But Are Still Low
Long-Term Inflation Expectations Are Inching Up But Are Still Low
Long-Term Inflation Expectations Are Inching Up But Are Still Low
Chart 14Market-Based Long-Term Inflation Expectations Are Below The Fed's Comfort Zone
Market-Based Long-Term Inflation Expectations Are Below The Fed's Comfort Zone
Market-Based Long-Term Inflation Expectations Are Below The Fed's Comfort Zone
Higher oil prices are unlikely to have the sting that they once did. The energy intensity of the global economy has fallen steadily over time, especially in advanced economies (Chart 15). Today, the US generates three-times as much output for every joule of energy consumed than it did in 1970. Household spending on energy has declined from a peak of 8.3% of disposable income in 1980 to 3.8% in December 2021. The US also produces over 11 million barrels of oil per day, more than Saudi Arabia (Chart 16). Chart 15The Global Economy Has Become Less Energy Intensive Over Time
The Global Economy Has Become Less Energy Intensive Over Time
The Global Economy Has Become Less Energy Intensive Over Time
Chart 16When It Comes To Energy Production, The USA Is Now #1
When It Comes To Energy Production, The USA Is Now #1
When It Comes To Energy Production, The USA Is Now #1
Unlike in the late 1990s, advanced economies do not face a significant capex overhang. Quite the contrary. Capital spending has been fairly weak across much of the OECD. In the US, the average age of the nonresidential capital stock has risen to the highest level since the 1960s (Chart 17). Looking out, far from cratering, capital spending is set to rise, as foreshadowed by the jump in core capital goods orders (Chart 18). Chart 17The Aging Capital Stock
The Aging Capital Stock
The Aging Capital Stock
Chart 18The Outlook For US Capex Is Bright
The Outlook For US Capex Is Bright
The Outlook For US Capex Is Bright
Chart 19Need More Houses
Need More Houses
Need More Houses
In contrast to the glut of housing that helped precipitate the Global Financial Crisis, housing remains in short supply in many developed economies. In the US, the homeowner vacancy rate has fallen to a record low. There are currently half as many new homes available for sale as there were in early 2020 (Chart 19). Even in Canada, where homebuilding has held up well, government officials have been hitting the panic button over a brewing home shortage. The Biggest Risk Is Debt The biggest macroeconomic risk the global economy faces stems from high debt levels. While household debt has fallen by 20% of GDP in the US, it has risen in a number of other economies. Corporate debt has generally increased everywhere, in many cases to finance share buybacks and M&A activity (Chart 20). Public debt has also soared to the highest levels since during World War II. Chart 20Mo' Debt
Mo' Debt
Mo' Debt
Among emerging markets, China’s debt burden is especially pronounced. Total private and public debt reached 285% of GDP in 2021, nearly double what it was in early 2008. The property market is also slowing, which will weigh on growth. Like many countries, China finds itself in a paradoxical situation: Any effort to pare back debt is likely to crush nominal GDP by so much that the debt-to-GDP ratio rises rather than falls. Ironically, the only solution is to adopt reflationary policies that allow the economy to run hot. In the near term, this could prove to be a favorable outcome for investors since it will mean that monetary policy stays highly accommodative. Over the long haul, however, it may lead to a stagflationary environment, which would be detrimental to equities and other risk assets. In summary, investors should remain overweight stocks for now. However, they should underweight the tech sector since tech stocks remain disproportionately vulnerable to rising rates, increased regulation, and a retrenchment in pandemic-induced spending on electronics and online services. Peter Berezin Chief Global Strategist peterb@bcaresearch.com Global Investment Strategy View Matrix
The Golden Rule For Investing In The Stock Market
The Golden Rule For Investing In The Stock Market
Special Trade Recommendations Current MacroQuant Model Scores
The Golden Rule For Investing In The Stock Market
The Golden Rule For Investing In The Stock Market
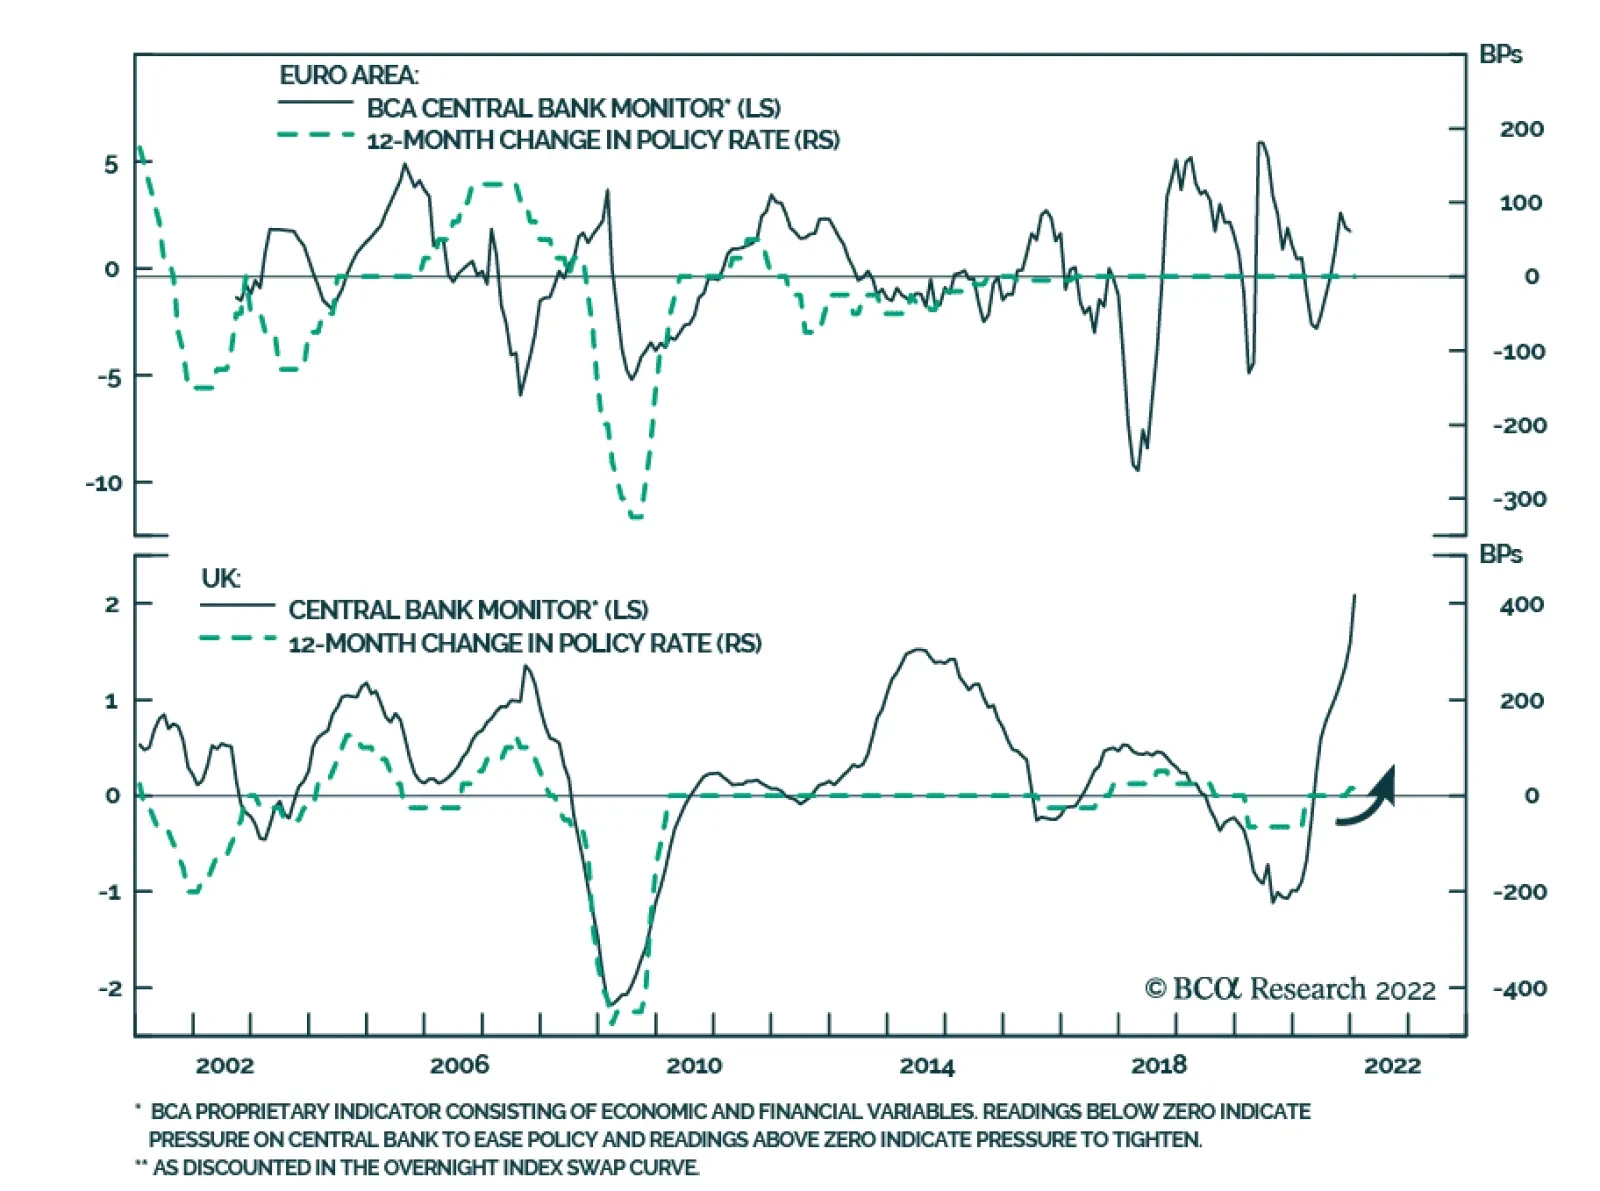
As expected, the Bank of England raised the Bank Rate by 25 bps to 0.5% on Thursday. Notably, of the nine voting MPC members, four voted to increase the Bank Rate by 50 bps to 0.75%. Meanwhile, the ECB kept policy unchanged. Instead, it announced that net…