Euro Area

BCA Research is proud to announce a new feature to help clients get the most out of our research: an Executive Summary cover page on each of the BCA Research Reports. We created these summaries to help you quickly capture the main points of each report through an at-a-glance read of key insights, chart of the day, investment recommendations and a bottom line. For a deeper analysis, you may refer to the full BCA Research Report. Executive Summary Risk Premium In EU Gas Prices
Long-Term EU Gas Volatility Will Increase
Long-Term EU Gas Volatility Will Increase
Regardless of whether Russia invades all, part of or none of Ukraine again, its current standoff with the West will force the EU to reconfigure its gas markets to assure reliability of supplies, and remove geopolitical supply disruptions. We expect the EU's renewable energy taxonomy scheduled for release Wednesday will include natgas as a sustainable fuel, which will help build more diversified sources of supply and deeper spot and term markets. Success here will increase market share of natgas in EU power generation. In the short run (1-2 years), neither the EU nor Russia can afford Gazprom's pipeline supplies to be significantly curtailed. Over the medium term (3-5 years), alternative supplies from US and Qatari LNG exports will be required to deepen EU gas-market liquidity and supply. Longer term (i.e., beyond 2025), EU energy markets will remain volatile as the renewable-energy transition progresses. High and volatile natgas prices will translate into persistent EU inflation – particularly food prices, because of higher fertilizer costs, and base metals' prices. Shortages in these markets will slow the energy transition, and raise its price tag. Bottom Line: The Russian standoff with the West over Ukraine puts a higher risk premium in EU gas prices. We remain long commodity-index exposure (S&P GSCI, and COMT ETF), and the XME ETF. We are getting long the SPDR S&P Oil & Gas Exploration & Production ETF (XOP) at tonight's close. Feature We expect the EU's financial taxonomy for renewable energy scheduled for release Wednesday will include natgas as a sustainable fuel. This will help in building out more diversified sources of supply and deeper spot and term markets. Success here will increase the market share of natgas in the EU's power generation (Chart of the Week). This coincides with natural gas supply uncertainty, arising from geopolitical tensions. On the back of already-low inventory levels, European natural gas markets are forced to handicap the odds of a major curtailment of Russian pipeline gas supplies resulting from another invasion of Ukraine (Chart 2). This is keeping a significantly increased risk premium embedded in natgas prices: Russian exports to the EU account for 40% of total gas supplies. Germany is particularly exposed, as ~65% of its gas comes from Russia (Chart 3). Chart of the WeekEU Natgas Generation Will Rise In Energy Transition
Long-Term EU Gas Volatility Will Increase
Long-Term EU Gas Volatility Will Increase
BCA’s Geopolitical Strategy desk upgraded the odds of Russia invading Ukraine to 75% from 50% in its latest research report.1 Our colleagues, however, keep the probability of Russia invading all of Ukraine low. Their analysis concludes Russia will only invade a part of Ukraine, so as to argue for lighter sanctions being imposed on it by the West, as opposed to having to incur the full wrath of US and EU sanctions. The other 25% of the probability space includes a diplomatic settlement between the West and Russia. Chart 2Risk Premium In EU Gas Prices
Long-Term EU Gas Volatility Will Increase
Long-Term EU Gas Volatility Will Increase
While Russia has been trying to diversify its customer base – by increasing natgas exports to China, e.g. – data from the BP Statistical Review of World Energy shows ~ 78% of total natural gas exports (pipeline + LNG) from Russia went to the EU in 2020.2 Chart 3EU Highly Dependent On Russian Gas
Long-Term EU Gas Volatility Will Increase
Long-Term EU Gas Volatility Will Increase
In light of the fact that Russia likely will face watered-down sanctions, and the EU’s gargantuan share of total Russian exports, we do not believe Europe’s largest natural gas exporter will stop all supply to the EU now or in the near future. In case Russia does go through with its invasion, it likely will cut off natural gas supply to Ukraine, implying Europe will loose slightly more than 6% of total natgas imports as opposed to 40% in the event of a halt to all natgas exports to Europe (Chart 4). Gas consumption of the EU-27 in 2021 was ~ 500 Bcm, according to the Oxford Institute For Energy Studies (OIES). Some 85% of EU gas consumption was met by imports. Chart 4Imports Cover Most EU Gas Consumption
Long-Term EU Gas Volatility Will Increase
Long-Term EU Gas Volatility Will Increase
Can The EU Mitigate The Loss Of Russian Gas? The EU and the US have entered discussions with other countries to plug the potential 6% reduction in imports from Russia. While in theory, there is enough spare pipeline capacity to import natural gas from existing and new sources (Chart 5), practical limitations may prevent this from occurring.3 The US is working with the EU to ensure energy supply security in case Russia cuts off natural gas supply. However, as can be seen in Chart 6, Panel 1, the US currently is and likely will continue to export nearly at capacity until end-2023. Panel 2 shows global liquefaction also is nearly at capacity. Chart 5EU Gas Import Capacity Exists, But Filling It Will Be Problematic
Long-Term EU Gas Volatility Will Increase
Long-Term EU Gas Volatility Will Increase
Chart 6US LNG Export Capacity Maxed Out
Long-Term EU Gas Volatility Will Increase
Long-Term EU Gas Volatility Will Increase
While an increase in gas production at the earthquake-prone Groningen field in the Netherlands is theoretically viable, it will induce a public backlash, as was evidenced when the Dutch government announced plans to double output from the field earlier this year. In the short run, facing few sources of alternate gas supply, the EU will need to focus on curtailing demand. Fossil fuels will need to be considered as an alternative for electricity and heating, since nuclear is not used in all EU countries. The depth of this crisis and the Dutch TTF price rise will be capped by the fact that we expect the EU to lose a relatively small fraction of total imports. Further, while we expect Dutch TTF prices to be volatile and face upward pressure, any price increases also will be capped by the fact that the colder-than-expected Northern Hemisphere winter has not yet materialized, and the warmer Spring and Summer months will be approaching soon. Medium-, Long-Term EU Gas Supply On the supply side, over the medium- and long-term, the EU will need to deepen and stabilize its gas supply, so that firms and households can rationally forecast and allocate spending and investment. This would include finding back-up or alternative supplies to Russian imports, which carry with them uncertain geopolitical risk. If Brussels includes natural gas as a sustainable fuel in its energy taxonomy, over the medium term (3-5 years), alternative supplies from US and Qatari LNG exports will be required to deepen EU gas-market liquidity and supply. Longer term (i.e., beyond 2025), EU energy markets will remain volatile as the renewable-energy transition progresses. Natgas will be a critical component of this transition, until utility-scale battery storage is able to support renewable generation and grid stability. We believe over the remainder of this decade, high and volatile natgas prices will translate into persistent EU inflation, as pricing pressures spill into oil and coal markets at the margin, as happened over the course of last year. This will work in the other direction as well – e.g., higher coal prices will spill over into gas and oil markets as price pressures incentivize fuel switching at the margin. Food prices will be right in the inflationary cross-hairs, given the fertilizer required to produce the grains and beans consumed globally consists mostly of natgas in urea and ammonia fertilizers (Chart 7). This will feed into higher food prices (Chart 8). Chart 7High Natgas Prices Will Show Up In High Fertilizer Prices
High Natgas Prices Will Show Up In High Fertilizer Prices
High Natgas Prices Will Show Up In High Fertilizer Prices
Chart 8… And Higher Food Prices
Long-Term EU Gas Volatility Will Increase
Long-Term EU Gas Volatility Will Increase
Base metals' prices also will be upwardly biased as natgas price volatility remains elevated. Supply shortages in natgas markets will, at the margin, slow the energy transition by reducing reliable energy supplies in the EU, forcing states to compete for back-up and replacement supply in the global LNG markets. Fuel-switching into oil, gas and coal will transmit EU gas volatility to markets globally. Tight energy and base metals markets also will feed directly into higher inflation and inflation expectations (Chart 9). Chart 9Higher Commodity Prices Will Pressure Inflation Higher
Higher Commodity Prices Will Pressure Inflation Higher
Higher Commodity Prices Will Pressure Inflation Higher
Investment Implications The standoff between the West and Russia over the latter's amassing of troops on the Ukraine border, plus the marked increase in the tempo of Russian naval operations, will keep the risk premium in EU natgas prices high. This is not a sustainable equilibrium over the medium- to long-term. We expect little if any curtailment of Russian natgas exports over the short term; however, prudence suggests EU member states will be forced to find back-up and alternative gas supplies over the medium- to longer-term, as the global renewable-energy transition gains traction. The knock-on effects from the current European geopolitical standoff are keeping EU natgas prices elevated via a higher risk premium to cover possible supply losses. This will feed into other markets – particularly metals and ags – which will feed directly into inflation and inflation expectations. We remain long commodity index exposure – the S&P GSCI and the COMT ETF – and metals producers via the XME ETF. At tonight's close, we will be getting long the SPDR S&P Oil & Gas Exploration & Production ETF (XOP). Robert P. Ryan Chief Commodity & Energy Strategist rryan@bcaresearch.com Ashwin Shyam Research Associate Commodity & Energy Strategy ashwin.shyam@bcaresearch.com Commodities Round-Up Energy: Bullish OPEC 2.0's decision to stay with its policy of returning 400k b/d every month appeared to be a foregone conclusion in the markets. In our January 2022 balances and price forecasts, we anticipated a larger increase, given the producer coalition led by Saudi Arabia and Russia has fallen significantly behind its goal of returning 400k b/d to the market monthly due to declining production among OPEC 2.0 member states ex-Gulf GCC member states, chiefly KSA, UAE and Kuwait (Iraq's exports fell in December and January; production data have not been released). In the past, KSA has said it will not make up for production shortfalls of OPEC 2.0 member states, and would abide by its production allocation. The upside risk to prices remains, in our estimation, and we continue to expect KSA and its GCC allies to increase output if production from the price-taking cohort led by the US shale-oil producers fails to materialize in over the coming months. Failure to cover production shortfalls among OPEC 2.0 member states would lift Brent prices by $6/bbl above our baseline forecast, which assumed higher production from the GCC states would be forthcoming at Wednesday's OPEC 2.0 meeting (Chart 10, brown curve). Base Metals: Bullish An environmental committee in Chile's Senate voted out a proposed bill that would, among other things, reportedly make it easier for the government to seize mines developed and operated by private companies. The proposed legislation still has a long road ahead of it, but copper prices rallied earlier in the week as this news broke. Even if the odds of the bill's passage are slim, a watered down version of the proposed legislation would markedly change the economic proposition of developing and maintaining copper mines in Chile (Chart 11). We continue to follow this closely. Chart 10
Brent Forecast Restored To $80/bbl For 2022
Brent Forecast Restored To $80/bbl For 2022
Chart 11
Bullish For Copper Prices
Bullish For Copper Prices
Footnotes 1 Please see All Bets Are Off ... Well, Some (A GeoRisk Update), published by BCA Research's Geopolitical Strategy service 27 January 2022. It is available at gps.bcaresearch.com. 2 Please see bp's Statistical Review of World Energy 2021 | 70th edition. 3 Norway, the EU’s second largest gas exporter after Russia stated that its natural gas production is at the limit. Apart from the issue of production, current LNG flows will need to be redirected from Asia and the Americas. Defaulting on long-term contracts to redirect fuel to Europe could mire exporters’ relationships with importing countries. Finally, infrastructure in the Eastern and Central section of the EU may not be equipped to receive supplies from the West, thus increasing costs and time associated with putting these systems in place. Investment Views and Themes Strategic Recommendations Trades Closed in 2021
Image
BCA Research is proud to announce a new feature to help clients get the most out of our research: an Executive Summary cover page on each of the BCA Research Reports. We created these summaries to help you quickly capture the main points of each report through an at-a-glance read of key insights, chart of the day, investment recommendations and a bottom line. For a deeper analysis, you may refer to the full BCA Research Report. Executive Summary Cyclical UST Curve Flattening, But With Unusually Low Rate Expectations
Deciphering The Messages From The US Treasury Curve
Deciphering The Messages From The US Treasury Curve
The US Treasury curve is unusually flat given high US inflation and with the Fed not having begun to raise interest rates. The dichotomy between deeply negative real interest rates and a flattening yield curve is not only evident in the US, but in other major developed countries like Germany and the UK. A low term premium on longer-term US Treasury yields is one factor keeping the curve so flat, but the term premium will likely rise as the Fed begins to hike rates. An overly flat US Treasury curve more likely reflects a belief that the neutral real fed funds rate (r-star) is actually negative. This is consistent with markets pricing in a very low peak in the funds rate for the upcoming tightening cycle, despite the current high inflation and tight labor market. Bottom Line: The Fed will hike by less than the market expects in 2022 and longer-term Treasury yields remain too low versus even a moderate 2-2.5% peak in the fed funds rate. Stay in US curve steepeners, as the Treasury curve is already too flat and will not flatten as much as discounted in forward rates this year. Feature Last week’s FOMC meeting essentially confirmed that the Fed will begin lifting rates in March and deliver multiple rate hikes this year. This was considered a hawkish surprise as the Fed signaled imminently tighter monetary policy even with the elevated financial market volatility seen so far in 2022. Fed Chair Jerome Powell noted that the US economy was in a stronger position compared to the 2016-18 tightening cycle, justifying a faster pace of hikes – and an accelerated pace of QE tapering – this time around. Markets have responded to the increasingly hawkish guidance of the Fed by pushing up rate expectations for 2022, continuing a path dating back to last September’s FOMC meeting when the Fed first signaled that QE tapering was imminent (Chart 1). There are now 163bps of Fed rate hikes by year-end discounted in the US overnight index swap (OIS) curve. Some Wall Street investment banks are calling for the Fed to hike as much as 6 or 7 times in 2022. We see this as much too aggressive. Chart 1Fed Hawkishness Pushing Up Rate Expectations For 2022/23 - But Not Beyond That
Fed Hawkishness Pushing Up Rate Expectations For 2022/23 - But Not Beyond That
Fed Hawkishness Pushing Up Rate Expectations For 2022/23 - But Not Beyond That
Our base case scenario calls for the Fed to lift rates “only” 3-4 times this year. The persistently high inflation that is troubling the Fed is likely to peak in the first half of 2022, taking some heat off the FOMC to move as aggressively as discounted in markets this year. Although inflation will remain high enough, and the labor market tight enough, to keep the Fed on a tightening path into 2023. The US Treasury Curve Looks Too Flat What is unique about the upcoming Fed tightening cycle is that it is starting with such a flat US Treasury curve. The spread between the 2-year and 10-year yield now sits at 61bps, the lowest level since October 2020. This dynamic is not unique to the US, as yield curves are quite flat in other major countries where policy rates are near 0% and inflation remains relatively high, like the UK and Germany (Chart 2). In the US, the modest slope of the Treasury curve is notably unusual given a growth and inflation backdrop that would be more consistent with much higher bond yields: The US unemployment rate fell to 3.9% in December, well within the range of full employment estimates from FOMC members (Chart 3, top panel) Chart 2Bond Bearish Yield Curve Flattening In The US & UK
Bond Bearish Yield Curve Flattening In The US & UK
Bond Bearish Yield Curve Flattening In The US & UK
US labor costs are accelerating; the wages and salaries component of the Employment Cost Index for Private Industry Workers rose to a 38-year high of 5.0% on a year-over-year basis in Q4/2021 (middle panel) Chart 3Challenges To The Fed's Inflation Fighting Credibility
Challenges To The Fed's Inflation Fighting Credibility
Challenges To The Fed's Inflation Fighting Credibility
Higher inflation is becoming more embedded in medium term consumer inflation expectations measures like the University of Michigan 5-10 year ahead series that climbed to 3.1% last month (bottom panel). Importantly, market-based measures of inflation expectations have pulled back, even with little sign of inflation pressures easing. The 5-year TIPS breakeven, 5-years forward has fallen 35bps from the October 2021 peak of 2.41%. The bulk of that decline occurred in January of this year, alongside a rising trend in real TIPS yields as markets began pricing in a faster pace of Fed rate hikes. TIPS breakevens can often be something of a “vote of confidence” by the markets in the appropriateness of the Fed’s policy stance; rising when policy appears overly stimulative and vice versa. Thus, the decline in the TIPS 5-year/5-year forward breakeven, which climbed steadily higher since the Fed introduced massive monetary easing in March 2020 in response to the pandemic, can be interpreted as a sign that markets agree with the Fed’s recent hawkish turn. However, while the move in TIPS breakevens is sensible, the flatness of the Treasury curve appears unusual. In Chart 4, where we look at the previous times since 1975 that the 2-year/10-year US Treasury spread flattened to 70bps (just above the current level). In past cycles, the Treasury curve would be flattening into such a level after the Fed had already hiked rates a few times, which is obviously not the case today. Also, US unemployment was typically approaching, or falling through, the full employment NAIRU when the 2/10 Treasury curve fell to 70bps, suggesting diminished spare economic capacity and rising inflation pressures – similar to the current backdrop. Chart 4The UST Curve Is Unusually Flat Right Now
The UST Curve Is Unusually Flat Right Now
The UST Curve Is Unusually Flat Right Now
Chart 5UST Curve Too Flat Relative To Inflation Pressures
UST Curve Too Flat Relative To Inflation Pressures
UST Curve Too Flat Relative To Inflation Pressures
In those past cycles, the funds rate was rising at a faster pace than that of core inflation, suggesting that the Fed was pushing up real interest rates. The backdrop looks very different today, with US realized inflation soaring and the real funds rate now deeply negative. In the top panel of Chart 5, we show a “cycle-on-cycle” chart of the 2/10 Treasury curve versus an average of the previous five instances where the curve flattened to 70bps. The green line is the median outcome of all the cycles, while the shaded region represents the range of all the outcomes. In the other panels of the chart, we show US economic variables (the Conference Board leading economic index and the ISM Manufacturing index) and US inflation variables (the wages and salaries component of the Employment Cost Index and the US Congressional Budget Office estimate of the US output gap). The panels are all lined up so that the vertical line in the middle of the chart represents the date that the 2/10 curve falls to 70bps. The conclusion from Chart 5 is that the US economic variables shown are currently at the high end of the range of past curve flattening episodes, but the inflation variables are well above the high end of the historical range. In other words, the current modest slope of the 2/10 Treasury curve is in line with US growth momentum but is too flat relative to US inflation trends. So Why Isn’t The US Treasury Curve Steeper? There are a few possible reasons why the US curve is as flat as it is before the Fed has even begun tightening amid above-trend US growth and very high US inflation: Fears of a deeper financial market selloff The Fed believes strongly in the role of financial conditions in transmitting its monetary policy into the US economy. That often means that, during tightening cycles, the Fed hikes rates “until something breaks” in the financial markets, like a major equity market downturn or a big widening in corporate credit spreads. Such moves act as a brake on US growth through negative wealth effects for investors and by raising the cost of capital for businesses – reducing the need for additional Fed tightening. If bond investors thought that a major market selloff was likely before the Fed could successfully lift rates back to neutral (or even restrictive) levels during a tightening cycle, then they would discount a lower peak level of the funds rate. This would also lower the expected peak level of longer-term Treasury yields, resulting in a flatter Treasury yield curve. Given the current elevated valuations on so many asset classes – like equities, corporate credit and housing – it is likely that the relatively flat Treasury curve incorporates some believe that the Fed will have difficulty delivering a lot of rate hikes in this cycle. However, it should be noted that the US financial conditions remain quite accommodative, even after the recent equity market turbulence (Chart 6), and represent no impediment to US growth that reduces how much tightening the Fed will need to do. Longer-term bond term premia are too low A relatively flat yield curve could reflect a lack of a term premium on longer-maturity bonds. That is certainly the case when looking at the slope of the 2/10 government yield curve in the US, as well as in the UK and Germany (Chart 7).1 Chart 6US Financial Conditions Are No Impediment To US Growth
US Financial Conditions Are No Impediment To US Growth
US Financial Conditions Are No Impediment To US Growth
Chart 7Flatter Yield Curves? Or Just Lower Bond Term Premia?
Flatter Yield Curves? Or Just Lower Bond Term Premia?
Flatter Yield Curves? Or Just Lower Bond Term Premia?
The term premium is the defined as the extra yield that investors require to commit to own a longer-maturity bond instead of the compounded yield from a series of shorter-maturity bonds. The latter can also be expressed as the “expected path of short-term interest rates”, which is often proxied by an average expected path of the monetary policy rate over the life of the longer-maturity bond. So the term premium on a 10-year US Treasury yield is the difference between the actual 10-year Treasury yield and the expected (or average) path of the fed funds rate over the next ten years. The term premium can also be thought of as a risk premium to holding longer-term bonds. On that basis, the term premium should correlate to measures of bond risk, like bond price volatility or inflation volatility. That is definitely true in the US, where the 10-year Treasury term premium shows a strong correlation to the MOVE index of Treasury market option-implied volatility or a longer-term standard deviation of headline CPI inflation (Chart 8). Estimated term premia can also rise during periods of slowing economic growth momentum, but that is typically due to a rapid decline in the expected path of interest rates rather than a rise in bond risk premia (in this case, this is probably more accurately described as a rise in bond uncertainty). Currently, a low term premium on US Treasury yields is justified by the relatively low level of bond volatility and solid US growth momentum. However, the term premium looks far too low compared to the more volatile US inflation seen since the start of the COVID-19 pandemic. With the Fed set to respond to that higher inflation with rate hikes, rising real interest rate expectations could also give a lift to the Treasury term premium. Our favorite proxy for the market expectation of the peak/terminal real short-term interest rate for the major developed market economies is the 5-year/5-year forward OIS rate minus the 5-year/5-year forward CPI swap rate. That “real” 5-year/5-year forward rate measure is typically well correlated to our estimates of the 10-year term premium in the US, Germany and the UK (Chart 9). This correlation likely reflects the level of certainty bond investors have over the likely future path of real interest rates. When there is more uncertainty about how high rates will eventually go to in a tightening cycle, a higher term premium is required. The opposite is true during periods of very low and stable interest rates. Chart 8Drivers Of US Term Premia Pointing Upward
Drivers Of US Term Premia Pointing Upward
Drivers Of US Term Premia Pointing Upward
Chart 9Bond Term Premia Positively Correlated To Real Rate Expectations
Bond Term Premia Positively Correlated To Real Rate Expectations
Bond Term Premia Positively Correlated To Real Rate Expectations
Chart 10Global Yield Curves Are Too Flat Versus Real Policy Rates
Global Yield Curves Are Too Flat Versus Real Policy Rates
Global Yield Curves Are Too Flat Versus Real Policy Rates
Currently, the estimated 10-year US term premium is increasing alongside a rising market-implied path for the real fed funds rate. We anticipate these trends will continue as the Fed lift rates over the next couple of years, boosting longer-term Treasury yields and potentially putting some steepening pressure on the US Treasury curve (or at least limiting the degree of flattening as the Fed tightens). Markets believe that the neutral real rate (r*) is negative Historically, yield curve slopes for government bonds were well correlated to the level of real interest rates, measured as the central bank policy rate minus headline inflation. That relationship has broken down in the US, with the Treasury curve flattening in the face of soaring US inflation and an unchanged fed funds rate (Chart 10). Similar dynamics can also be seen in the German and UK yield curves. The most plausible reason for such a dramatic shift in the relationship between curve slopes and real policy rates is that bond investors now believe that the neutral real interest rate, a.k.a. “r-star”, is negative … and perhaps deeply so. The New York Fed has produced estimates of the US r-star dating back to the 1960s. The gap between the real fed funds rate and that r-star estimate has typically been fairly well correlated to the slope of the Treasury curve (Chart 11). When the real fed funds rate is below r-star, indicating that the policy is accommodative, the Treasury curve is usually steepening, and vice versa. Under this framework, the recent flattening trend of the Treasury curve would indicate that policy is actually getting tighter, despite the falling, and deeply negative, real fed funds rate of -5.4% (deflated by core inflation). Chart 11UST Curve Slope Is Positively Correlated To The 'Real Policy Gap'
UST Curve Slope Is Positively Correlated To The 'Real Policy Gap'
UST Curve Slope Is Positively Correlated To The 'Real Policy Gap'
The last known estimate of r-star from the New York Fed was 0%, but no update has been provided for almost two years. Blame the pandemic for that. The sharp lockdown-fueled collapse in US GDP growth in 2020, and the rapid recovery in growth as the economy reopened, made it impossible to estimate the the “neutral” level of real interest rates given such massive swings in demand that were not related to monetary policy. One way to try and “back out” the implicit pricing of r-star currently embedded in US Treasury yields is to estimate a model linking the gap between the real fed funds rate and r-star to the slope of the Treasury curve. We did just that, with the results presented in Chart 12. This model estimates the “Real Policy Gap”, or r-star minus the real fed funds rate, as a function of the 2/10 Treasury curve slope. In other words, the model shows the Real Policy Gap that is consistent with the current slope of the curve. Chart 12Current UST Yield Curve Makes Slope Sense ... If The Fed Followed The Taylor Rule With 7% Inflation
Current UST Yield Curve Makes Slope Sense ... If The Fed Followed The Taylor Rule With 7% Inflation
Current UST Yield Curve Makes Slope Sense ... If The Fed Followed The Taylor Rule With 7% Inflation
The model estimates that the current 2/10 curve slope is consistent with a Real Policy Gap of 96bps. With US core CPI inflation currently at 5%, and assuming r-star is still 0% as per the last New York Fed estimate, the fed funds rate would have to rise to 4% to justify the current slope of the 2/10 curve. While that may sound like an implausibly large increase in the funds rate, similar results are produced using straightforward Taylor Rules.2 We can also use our Real Policy Gap model to infer the level of inflation that is consistent with a Gap of 96bps, for various combinations of the funds rate and r-star. Those are shown in Table 1. Assuming the funds rate rises in line with current market expectations to 1.7% and r-star remains close to 0%, the current slope of the 2/10 Treasury curve suggests a fall in US inflation to just around 3% - still above the Fed’s inflation target - from the current 5%. Table 1The UST Curve Slope Has Already Discounted A Big Drop In US Inflation
Deciphering The Messages From The US Treasury Curve
Deciphering The Messages From The US Treasury Curve
We see this as the most plausible reason for the relatively flat level of the 2/10 US Treasury curve. Markets expect somewhat lower US inflation and a moderate rise in the funds rate over the next couple of years, making the real funds rate less negative but not pushing it above a negative r-star expectation. This would suggest upside risk for US Treasury yields, and potential bearish steepening pressure, as markets come to realize that the neutral real fed funds rate is actually positive, not negative. Fight The Forwards, Stay In US Treasury Curve Steepeners While it may sound counter-intuitive with the Fed set to begin a rate hiking cycle, we continue to see better value in tactically positioning in US Treasury curve steepening trades. Specifically, we are keeping our recommended trade in our Tactical Overlay on page 19, where we are long a 2-year Treasury bullet versus a duration-neutral barbell of cash (a 3-month US Treasury bill) and a 10-year Treasury bond. The trade is currently underwater, but we see good reasons to expect the performance to rebound over the next few months. The front end of the curve now discounts more hikes than we expect will unfold in 2022, which should limit further increases in the 2-year Treasury yield. At the same time, the 10-year yield looks too low relative to the expected cyclical peak for the fed funds rate (Chart 13). One way we can assess this is by comparing 5-year/5-year forward Treasury rates to survey estimates of the longer run, or terminal, fed funds rate. The median FOMC forecast (or “dot”) for the terminal funds rate is 2.5%, the median terminal rate forecast from the New York Fed’s Survey of Primary Dealers is 2.25% and the median terminal rate forecast from the New York Fed’s Survey of Market Participants is 2%. This sets a range of estimates of the longer-run terminal rate of 2-2.5%, in line with the current expectations of the BCA Research bond services. The current 5-year/5-year forward Treasury rate is 2.0%, at the low end of that range. We see those forwards rising to the upper part of that 2-2.5% range by the end of 2022, which will push the 10-year Treasury yield toward our year-end target of 2.25%. Chart 13The 5-Year/5-Year UST Forward Rate Is Too Low
The 5-Year/5-Year UST Forward Rate Is Too Low
The 5-Year/5-Year UST Forward Rate Is Too Low
Chart 14Stay In UST Curve Steepeners, Even With Fed Liftoff Imminent
Stay In UST Curve Steepeners, Even With Fed Liftoff Imminent
Stay In UST Curve Steepeners, Even With Fed Liftoff Imminent
Some of our colleagues within the BCA family see the longer-term neutral funds rate as considerably higher than survey estimates, perhaps as high as 3-4%. We are sympathetic to that view, but it will take signs of US economic resiliency in the face of rate hikes before bond investors – and more importantly, the Fed – arrive at that conclusion. This would make steepening trades more attractive on a strategic, or medium-term, basis as the market realizes that the Fed is further behind the policy curve (i.e. the funds rate even further below a higher terminal rate) than previously envisioned. For now, we do not see the US Treasury curve flattening at the pace discounted in the Treasury forward curve over the next 3-6 months (Chart 14, top panel). However, this will be more of a carry trade by betting against the forwards over time. A bearish steepening of the Treasury curve with a swift upward move in the 10-year Treasury yield is less likely with bond investor/trader positioning already quite short (bottom two panels). Robert Robis, CFA Chief Fixed Income Strategist rrobis@bcaresearch.com Footnotes 1 The term premium estimates shown here are derived from our own in-house framework. For those familiar with the various term premium estimates on the 10-year US Treasury yield produced by the Fed, our estimates are currently in line with those produced by the ACM model and the Kim & Wright model. 2 A fun US Taylor Rule calculator, which can be used to generate Taylor Rules under a variety of assumptions, is available on the Atlanta Fed’s website here. GFIS Model Bond Portfolio Recommended Positioning Active Duration Contribution: GFIS Recommended Portfolio Vs. Custom Performance Benchmark
Deciphering The Messages From The US Treasury Curve
Deciphering The Messages From The US Treasury Curve
The GFIS Recommended Portfolio Vs. The Custom Benchmark Index Global Fixed Income - Strategic Recommendations* Duration Regional Allocation Spread Product Tactical Overlay Trades
Highlights US Vs. Europe: Growth and inflation momentum remains stronger in the US versus Europe. The latter is taking the bigger economic hit from more severe Omicron economic restrictions and a greater exposure to slowing Chinese demand. European inflation has accelerated, but remains slower and less broad-based than elevated US inflation. The backdrop remains more negative for US fixed income compared to Europe. UST-Bund Spread: With markets already priced for multiple Fed rate hikes in 2022, it is now harder to earn significant returns shorting US Treasuries outright compared to 2021. We prefer positioning for higher US bond yields through less-volatile US Treasury-German Bund spread widening positions, with the ECB unlikely to deliver even the single discounted 2022 rate hike. We recommend the position both as a structural allocation in bond portfolios (underweight the US versus Germany) and as a tactical trade (selling US Treasury futures versus Bund futures). Feature Chart of the WeekUS Bond Yields & Bond Volatility Are Both Rising
US Bond Yields & Bond Volatility Are Both Rising
US Bond Yields & Bond Volatility Are Both Rising
Global fixed income markets are off to a volatile start in 2022, on the back of significant repricing of US interest rate expectations. The 10-year US Treasury yield now sits at 1.85%, up +34bps so far in January and is up +72bps from the August 4/2021 intraday low of 1.13%. The 2-year US yield, which is even more sensitive to changes in Fed expectations, is 1.04%, up +31bps so far this month and up +87bps since early August 2021. Yields are rising in other countries as well, with the 10-year benchmark government bond yield up year-to-date in the UK (+24bps), Canada (+45bps) and even Germany (+18bps) where the Bund yield is threatening to return to positive territory. US Treasuries are selling off as markets have heeded the hawkish shift in the Fed’s interest rate guidance. The US overnight index swap (OIS) curve now discounting 89bps of Fed rate hikes in 2022. Bond volatility further out the Treasury curve has increased as yields have moved higher, with the realized volatility of the Bloomberg 7-10 US Treasury index now at an 19-month high (Chart of the Week). We continue to recommend a defensive strategic posture towards direct US Treasuries with below-benchmark exposure on both duration and country allocations in global bond portfolios. However, we prefer a more efficient way to position for the same theme of rising US yields – betting on a wider 10-year US Treasury-German Bund spread. US Growth & Inflation Fundamentals Support A More Hawkish Fed The rise in global bond yields seen in recent weeks has inflicted damage on risk assets, but not in a consistent fashion. Equity markets have taken the brunt of the hit, with the S&P 500 down around -3% so far in January with the tech-heavy NASDAQ down -6%. Yet the MSCI emerging market equity index is up around +1%, European equities are flat and global high-yield corporate bond spreads are essentially unchanged so far this month. While higher bond yields are reflecting expectations of more global monetary tightening over the next year, medium-term interest rate expectations remain subdued. Our proxy for the market pricing of terminal interest rate expectations – 5-year OIS rates, 5-years forward – remains at or below pre-pandemic levels in the US, the UK, Canada and the euro area (Chart 2). Risk assets are performing relatively well in the face of higher bond yields because markets still do not believe that a major increase in interest rates will be needed in the current global tightening cycle. We see this – the likelihood that interest rates will have to rise much more than markets expect - as the biggest vulnerability for global bond markets over the next couple of years. The US remains the “poster child” for this view. In the US, core CPI inflation accelerated to an 31-year high of 5.5% in December. The pickup in US inflation continues to be broad-based, with the Cleveland Fed median CPI and trimmed mean CPI inflation measures reaching 3.8% and 4.8%, respectively (Chart 3). This massive run-up in US inflation has filtered through to medium-term household inflation expectations; the preliminary University of Michigan consumer survey for January showed that inflation 5-10 years out is expected to be 3.1% - the highest level in 13 years. Chart 2Rising Yields Are Not A Threat To Risk Assets ... Yet
Rising Yields Are Not A Threat To Risk Assets ... Yet
Rising Yields Are Not A Threat To Risk Assets ... Yet
Chart 3The Fed Cannot Ignore Elevated Inflation Expectations
The Fed Cannot Ignore Elevated Inflation Expectations
The Fed Cannot Ignore Elevated Inflation Expectations
Chart 4US Demand Steadily Normalizing From The Pandemic Shock
US Demand Steadily Normalizing From The Pandemic Shock
US Demand Steadily Normalizing From The Pandemic Shock
While much of the run-up in US inflation over the past year has been fueled by supply chain disruption and high energy prices, there is still a robust demand component to the high inflation. Consumer spending on goods remains elevated versus its pre-pandemic trend, while services spending is steadily returning back to the pre-pandemic pace (Chart 4). The overall US unemployment rate is now down to 3.9%, the lowest level since February 2020, with broad-based strength in the US labor market across most industries (bottom panel). The rise in consumer inflation expectations has to be most worrisome to Fed officials. Yes, market-based inflation expectations have already seen a significant run-up since the mid-2020 lows, and have even drifted down a bit of late on the back of the more hawkish rhetoric from the Fed. However, survey-based measures of inflation expectations tend to be less volatile than market-based measures, and typically follow trends in realized inflation, which is not slowing down in the US. In other words, rising household inflation expectations are a more reliable indication that an inflationary mindset is becoming entrenched in consumer behavior. US inflation dynamics are transitioning away from supply-driven goods inflation toward more lasting domestically driven forces like tight labor markets, faster wage growth and rising housing costs (Chart 5). Measures of supply chain disruption like global shipping costs are showing signs of peaking (top panel), while commodity price momentum has clearly rolled over – both should eventually feed into slower goods inflation this year. At the same time, tight labor markets will continue to boost US employment costs, which historically have been strongly correlated to US services inflation (middle panel). Chart 5US Inflation Pressures Remain Intense
US Inflation Pressures Remain Intense
US Inflation Pressures Remain Intense
Meanwhile, shelter costs, which represents 32% of the US CPI index, were up 4.2% on a year-over-year basis in December and are likely to continue accelerating given a dearth of housing supply versus demand that is pushing up both house prices and rents (bottom panel). Tying it all together, there are good reasons why the Fed has ramped up the hawkish rhetoric over the past couple of months. However, with the US OIS curve now discounting between 3-4 rate hikes in 2022, it will be harder to generate a second consecutive year of negative returns in the US Treasury market this year. Dating back to the early 1970s, there have only been five calendar years where the Bloomberg US Treasury index delivered an outright negative total return: 1994, 1999, 2009, 2013 and 2021 (Chart 6). None of the four cases prior to last year saw negative returns in the following year, as Treasury yields fell in 1995, 2000, 2010, 2014. Yet even the episodes that saw consecutive years of US yield increases – 1974-75, 1977-81, 1987-88, 2005-06 and 2015-16 – did not see outright negative returns from the Bloomberg US Treasury index. Chart 6Negative Return Years For US Treasuries Are Rare
Negative Return Years For US Treasuries Are Rare
Negative Return Years For US Treasuries Are Rare
Given the starting point of deeply negative real US bond yields, and interest rate expectations that remain too low beyond 2022, we still see value in staying below-benchmark on US duration exposure on a medium-term basis. However, we see a more efficient way to play for higher Treasury yields this year by positioning US Treasury underweights/shorts versus overweights/longs in government bonds in a region where discounted rate hikes will not happen – Europe. The ECB Is In No Hurry To Hike Rates The same supply driven factors that have pushed up US inflation over the past year have also lifted inflation in the euro area. Headline HICP inflation reached an 30-year high of 5.0% in December, while core HICP inflation hit an all-time high of 2.6%. The European Central Bank (ECB), however, is unlikely to deliver any rate hikes in 2022 even with the high inflation, for several reasons (Chart 7): Growth momentum entering 2022 was soft, thanks to Omicron related economic restrictions at the end of 2021 and also weak demand for European exports from China. It will take time for both of those factors to reverse, thus reducing any growth related pressure to tighten monetary policy. Inflation expectations are not exceeding the ECB 2% inflation target, with the 5-year/5-year forward EUR CPI swap now at 1.9% even with headline inflation of 5.0%. The surge in European energy prices will eventually subside in the first half of 2022, which will reduce inflationary pressure on the ECB to tighten. The ECB is ending its pandemic emergency bond buying program (PEPP) in March, and is only partially replacing that buying activity by upsizing its existing pre-pandemic asset purchase program (APP). The ECB will not want to compound the effect of this “tapering” of bond buying by also hiking interest rates, which would surely tighten financial conditions further through higher Italian government bond yields, rising corporate bond yields and a firmer euro. There is little evidence to date showing any pass-through of higher energy-fueled inflation into more domestically-driven inflation. Euro area wage growth was only 1.3% as of the latest available data in Q3/2021 (which is still well after realized inflation had started to accelerate), highlighting the lack of visible “second round” effects on euro area inflation from high energy prices that would prompt the ECB to consider rate hikes (Chart 8). Chart 7An ECB Rate Hike In 2022 Is Unlikely
An ECB Rate Hike In 2022 Is Unlikely
An ECB Rate Hike In 2022 Is Unlikely
Chart 8Limited 'Second Round' Effects From Energy-Driven European Inflation
Limited 'Second Round' Effects From Energy-Driven European Inflation
Limited 'Second Round' Effects From Energy-Driven European Inflation
The EUR OIS curve is discounting 7bps of rate hikes by year-end. Even that modest amount will not be delivered, which will limit how much further European government bond yields will rise this year. A Better Mousetrap: Playing UST Bearishness Through UST-Bund Spread Widening Trades Combining our view of an increasingly hawkish Fed and a still-dovish ECB produces our highest conviction investment recommendation for 2022: positioning for a wider 10-year US Treasury/Germany Bund spread. This can be done by underweighting the US versus core Europe in global bond portfolios, or shorting US Treasury futures versus German Bund futures as we are already recommending in our Tactical Trade Overlay (see page 15). A Treasury-Bund spread widening view is a more efficient way to play for a more hawkish Fed and higher US Treasury yields, for several reasons: There are many examples over past 30 years where the Treasury-Bund spread widened in consecutive years (Chart 9). This is in contrast to the fewer occurrences of consecutive years of rising Treasury yields shown earlier in this report. Thus, there are better odds that last year’s Treasury-Bund spread widening can be repeated in 2022. Chart 9Consecutive Years Of A Rising UST-Bund Spread Happen Often
Consecutive Years Of A Rising UST-Bund Spread Happen Often
Consecutive Years Of A Rising UST-Bund Spread Happen Often
The realized volatility of Treasury-Bund spread trades is almost always lower than that of an outright short position in US Treasuries, but the direction of returns of the two trades is similar (Chart 10). This shows that there is directionality in the Treasury-Bund spread (i.e. it is driven far more by the movements of US yields), but that is a welcome feature given our more bearish view on US Treasuries. The Treasury-Bund spread remains well below fair value on our fundamental valuation model, with fair value increasing due to widening US-European inflation differentials (Chart 11). Tighter relative monetary policies this year (more tapering and rate hikes from the Fed compared to the ECB) also favor a wider fair value spread on our model. Chart 10UST-Bund Wideners Have Lower Volatility Than Outright UST Shorts
UST-Bund Wideners Have Lower Volatility Than Outright UST Shorts
UST-Bund Wideners Have Lower Volatility Than Outright UST Shorts
Chart 11The UST-Bund Spread Looks Very Cheap On Our Model
The UST-Bund Spread Looks Very Cheap On Our Model
The UST-Bund Spread Looks Very Cheap On Our Model
The gap between our 24-month discounters, which measure the change in policy interest rates over the next two years discounted in OIS curves, for the US and euro area is a reliable leading indicator of the 10-year Treasury-Bund spread (Chart 12, bottom panel). The “discounter spread” is currently calling for the Treasury-Bund spread to widen by more than the current path discounted in US Treasury and German Bund forward rates. Chart 12Position For More UST-Bund Spread Widening In 2022
Position For More UST-Bund Spread Widening In 2022
Position For More UST-Bund Spread Widening In 2022
Chart 13UST-Bund Spread Is Not Technically Stretched
UST-Bund Spread Is Not Technically Stretched
UST-Bund Spread Is Not Technically Stretched
The Treasury-Bund spread is not stretched from a technical perspective (Chart 13). The spread is sitting right at its 200-day moving average and the 26-week change in the spread (a measure of price momentum) is rising but remains well below previous peak levels that have capped past spread increases. Summing it all up, the case is strong for including US-Germany spread widening positions as core holdings in investor portfolios in 2022. The current spread is 185bps and we have a year-end target of 225bps. Bottom Line: With markets already priced for multiple Fed rate hikes in 2022, it is now harder to earn significant returns shorting US Treasuries outright compared to 2021. We prefer positioning for higher US bond yields through less-volatile US Treasury-German Bund spread widening positions, with the ECB unlikely to deliver even the single discounted 2022 rate hike. We recommend the position both as a structural allocation in bond portfolios (underweight the US versus Germany) and as a tactical trade (selling US Treasury futures versus Bund futures). Robert Robis, CFA Chief Fixed Income Strategist rrobis@bcaresearch.com Recommendations Duration Regional Allocation Spread Product Tactical Trades GFIS Model Bond Portfolio Recommended Positioning Active Duration Contribution: GFIS Recommended Portfolio Vs. Custom Performance Benchmark
Image
The GFIS Recommended Portfolio Vs. The Custom Benchmark Index
Highlights 2022 Key Views & Allocations: Translating our 2022 global fixed income Key Views into recommended positioning within our model bond portfolio results in the following conclusions to begin the year. Target a moderate level of overall portfolio risk, maintain below-benchmark overall duration exposure, make developed market government bond country allocations based on relative expected central bank hawkishness (underweight the US, UK and Canada; overweight Germany, France, Italy, Australia, Japan), and be selective on allocations to global spread product (overweight high-yield with a bias toward Europe over the US, neutral global investment grade, underweight emerging market hard currency debt). Specific Allocation Changes: Much of the current positioning in our model bond portfolio already reflects our 2022 investment themes. The only significant changes we make to begin the year are reducing emerging market USD-denominated corporate bond exposure to underweight, and shifting some high-yield corporate bond exposure from the US to Europe. Feature In our last report of 2021, we published our 2022 Key Views, outlining the themes and investment implications of the 2022 BCA Outlook for global fixed income markets. In this report, our first of the new year, we translate those views into more specific recommendations and allocations within the BCA Research Global Fixed Income Strategy model bond portfolio. The main takeaways are that another year of expected above-trend global growth, even after the risks to start the year from the Omicron variant, will further absorb spare capacity across the developed economies. Realized inflation will slow from the elevated readings of 2021, but will remain high enough to force central banks – led by the US Federal Reserve – to incrementally remove highly accommodative monetary policies put in place during the pandemic. The backdrop for global bond markets will turn far less friendly as a result, with higher bond yields (led by US Treasuries), flatter yield curves and much weaker returns on spread products that have benefited from easy monetary policies like investment grade corporate debt and emerging market (EM) hard currency debt. Against this challenging backdrop for overall fixed income returns, bond investors will need to focus more on relative exposures between countries, sectors and credit ratings to generate outperformance versus benchmarks. Our recommended portfolio allocations to begin 2022 reflect that shift (Table 1). Table 1GFIS Model Bond Portfolio Recommended Positioning For The Next Six Months
Our Model Bond Portfolio Strategy To Begin 2022: Choosing Our Battles Wisely
Our Model Bond Portfolio Strategy To Begin 2022: Choosing Our Battles Wisely
A Review Of The Model Bond Portfolio Performance In 2021 Chart 12021 Performance: A Positive, Yet Volatile, Year
2021 Performance: A Positive, Yet Volatile, Year
2021 Performance: A Positive, Yet Volatile, Year
Before we begin our discussion of the model bond portfolio for 2022, we will take a final look back at the performance of the portfolio in 2021. Last year, the model bond portfolio delivered a small negative total return (hedged into US dollars) of -0.51%, but this still outperformed its custom benchmark index by +36bps (Chart 1).1 It was a very challenging year for global fixed income markets, in aggregate, with significant swings in bond yields (i.e. US Treasuries were up in Q1, down in Q2/Q3, up then down in Q4) and credit spreads (US high-yield spreads fell in H1/2021 and were rangebound in H2/2021, while EM hard currency spreads were stable in H1/2021 before steadily widening during the rest of the year). Over the full year, the government bond portion of the portfolio outperformed the custom benchmark index by +27bps while the spread product segment outperformed by +9bps (Table 2). The bulk of that government bond outperformance occurred during the first quarter of the year when global bond yields surged higher as COVID-19 vaccines began to be distributed and economic optimism improved in response – trends that benefited the below-benchmark duration tilt within the portfolio. The credit market outperformance was more evenly spread out during the final nine months of the year. Table 2GFIS Model Bond Portfolio Full Year 2021 Overall Return Attribution
Our Model Bond Portfolio Strategy To Begin 2022: Choosing Our Battles Wisely
Our Model Bond Portfolio Strategy To Begin 2022: Choosing Our Battles Wisely
In terms of specific country exposures on government debt (Chart 2), our underweight stance on US Treasuries (both in allocation and duration exposure) generated virtually all of the full-year outperformance of the government bond portion of the portfolio (+38bps versus the benchmark). The biggest underperformer was the UK (-9bps), concentrated at the very end of the year as Gilt yields declined on the back of the Omicron surge, to the detriment of our underweight stance. All other country allocations provided little excess return, in aggregate, over the full year in 2021 – although there was significant variance of those returns during the year.
Chart 2
Within spread product (Chart 3), the biggest gains were seen in US high-yield (+19bps) where we remained overweight throughout 2021. The largest drag on performance came from UK investment grade corporates (-9bps), although this all came in Q1/2021 where we maintained an overweight stance at the time and spreads widened. Other spread product sectors delivered little in the way of excess return, although that should not be a surprise as we maintained a neutral stance on US and euro area investment grade corporates – which have a combined 18% weighting within the model bond portfolio custom benchmark index – throughout 2021.
Chart 3
In the end, our recommended portfolio tilts during 2021 were generally on the right side of the market, with our overweights outperforming in an overall down year for bond returns (Chart 4). The numbers would have been even better without the drag on performance in the fourth quarter (-17bps for the entire portfolio). That came entirely from our two biggest government bond underweights – US Treasuries and UK Gilts – which saw significant bond yield declines in response to the emergence of the Omicron variant. (the detailed breakdown of the Q4/2021 performance can be found in the Appendix on pages 19-23).
Chart 4
Importantly, the surge in bond yields seen in the first week of 2022 has already resulted in a full recovery of that Q4/2021 underperformance, providing a good start to the new year for our model portfolio. Top-Down Bond Market Implications Of Our Key Views We now present the specific fixed income investment recommendations that derive from those themes, described along the following lines: overall portfolio risk, overall duration exposure, country allocations within government bonds, yield curve allocations within countries, and corporate credit allocations by country and credit rating. Overall Portfolio Duration Exposure: BELOW BENCHMARK As we concluded in our 2022 Key Views report, longer-maturity government bond yields are now too low given the mix of very high inflation and very low unemployment seen in many countries. While we expect inflation to come down this year from the very rapid pace of 2021, it will not be by enough to force central banks off the path towards rate hikes that already began at the end of last year in places like the UK and New Zealand. The Fed is now signaling that multiple US rate hikes are likely in 2022, while even some European Central Bank (ECB) officials are expressing concern over very high European inflation. Longer maturity bond yields remain too low, in our view, because investors are discounting very low terminal rates – the peak level of policy rates to be reached in the next monetary tightening cycle. (Chart 5). An upward adjustment of global interest rate expectations is likely this year as central banks like the Fed and the Bank of England (BoE) deliver on expected rate hikes, with more tightening necessary beyond 2022. This will be the primary driver of the rise in global bond yields that we expect this year - an outcome that has already begun in the first week of 2022. Chart 5Global Government Bond Yields Vulnerable To Hawkish Repricing
Global Government Bond Yields Vulnerable To Hawkish Repricing
Global Government Bond Yields Vulnerable To Hawkish Repricing
Chart 6Staying Below-Benchmark On Overall Duration Exposure
Staying Below-Benchmark On Overall Duration Exposure
Staying Below-Benchmark On Overall Duration Exposure
We ended 2021 with a model bond portfolio duration that was -0.65 years below that of the custom performance benchmark (Chart 6). We feel comfortable maintaining that position, in that size, to begin the new year. Government Bond Country Allocation: OVERWEIGHT THE EURO AREA (CORE & PERIPHERY), JAPAN & AUSTRALIA; UNDERWEIGHT THE US, UK & CANADA Our country allocation decisions within our model bond portfolio entering 2022 are based on a simple framework. We are overweighting countries where central banks are less likely to raise rates this year, and vice versa. We expect the largest increase in developed market bond yields in 2022 to occur in the US, as markets are still not priced for the cumulative tightening that the Fed will likely deliver over the next couple of years. Markets are also underpricing how much the Bank of England and Bank of Canada will need to raise rates over the full tightening cycle, even with multiple hikes discounted for 2022. We see the necessary upward repricing of post-2022 rate expectations in all three of those countries – the US, UK and Canada – justifying underweight allocations in our model portfolio. Chart 7Our Recommended DM Government Bond Allocations To Start 2022
Our Recommended DM Government Bond Allocations To Start 2022
Our Recommended DM Government Bond Allocations To Start 2022
The opposite is true in core Europe and Australia. Overnight index swap (OIS) curves are discounting multiple rate hikes this year from the Reserve Bank of Australia (RBA) and even an ECB rate hike later in 2022. As we discussed in our Key Views report, there is still not enough evidence pointing to rapid wage growth in Australia or Europe that would force the RBA and ECB to turn more hawkish than their current forward guidance which calls for no rate hikes in 2022. While both central banks may talk about the possibility that monetary policy will need to be tightened, we expect the actual rate hikes to occur in 2023 and not 2022. Thus, both markets justify overweight allocations in our model bond portfolio. We are also maintaining an overweight to Japanese government bonds, as Japanese inflation remains far too low – even in an environment of high energy prices and global supply chain disruption – for the Bank of Japan to contemplate any tightening of monetary policy. The country allocations within the model portfolio as of the end of 2021 all fit with the above analysis, thus we see no major changes that need to be made to begin 2022 (Chart 7).2 The only significant move made was to slightly bump up the size of the overweights in Italy and Spain, to be funded by the reduction in EM corporate bond exposure (as we discuss below). We continue to see a positive case for owning Peripheral European government bonds for the relatively high yields within Europe, with the ECB maintaining an overall dovish policy stance in 2022 even as it scales back the size of its bond buying activity starting in March. Inflation-Linked Bond Allocations: MAINTAIN A NEUTRAL OVERALL ALLOCATION TO GLOBAL LINKERS Chart 8Our Recommended Inflation-Linked Bond Allocations To Start 2022
Our Recommended Inflation-Linked Bond Allocations To Start 2022
Our Recommended Inflation-Linked Bond Allocations To Start 2022
Inflation-linked bonds have been a necessary part of bond investors' portfolios since the lows in global inflation breakeven spreads were seen in mid-2020. Now, with inflation expectations at or above central bank inflation targets in most developed market countries, and with realized inflation likely to subside from current levels this year, the backdrop no longer justifies structural overweights to linkers across all countries. We are sticking with our end-2021 overall neutral allocation to global inflation-linked bonds, focusing more on country allocations based on our inflation breakeven valuation indicators, as discussed in our 2022 Key Views report (Chart 8). This means maintaining a neutral stance on US TIPS and linkers (vs. nominal government bonds) in Canada, Australia and Japan. We are also staying with underweight positions in linkers (vs. nominals) in the UK, Germany, France and Italy where breakevens appear too high based on our indicators. Spread Product Allocation: MAINTAIN A SMALL OVERWEIGHT TO GLOBAL SPREAD PRODUCT FOCUSED ON EUROPEAN & US HIGH-YIELD CORPORATES, WHILE UNDERWEIGHTING EM CREDIT Chart 9Negative Real Yields: Global Bonds' Biggest Vulnerability
Negative Real Yields: Global Bonds' Biggest Vulnerability
Negative Real Yields: Global Bonds' Biggest Vulnerability
Our expectation of above-trend global growth in 2022, with still relatively high inflation (compared to pre-pandemic levels), should be positive for spread products like corporate bonds that benefit from strong nominal economic (and revenue) growth. However, the less accommodative global monetary policy backdrop we also expect is a potential negative for credit market performance - specially as rate hikes put upward pressure on deeply negative real interest rates, most notably in the US (Chart 9). Thus, we are entering 2022 with a cautious, but still positive, overall position on spread product in our model bond portfolio. We are focusing more on credit valuation, however - both in absolute terms and between countries and sectors – to try and generate outperformance for the credit portion of the portfolio. We are maintaining a neutral stance on investment grade corporates in the US, euro area and UK given the tight spread valuations in those markets. We prefer to focus our corporate credit exposure on overweights to high-yield bonds in the US and Europe, but with a marginal preference for European junk bonds over US equivalents as we discussed in our 2022 Key Views report (Chart 10). Within EM USD-denominated credit, we remain cautious entering 2022 given the poor fundamental backdrop for EM credit: slowing momentum of Chinese economic growth and global commodity prices, a firmer US dollar, and a less-accommodative global monetary policy backdrop (Chart 11). Thus, an underweight stance on EM credit is appropriate within the portfolio to start the year. Chart 10Increase Euro High-Yield Exposure Vs US High-Yield
Increase Euro High-Yield Exposure Vs US High-Yield
Increase Euro High-Yield Exposure Vs US High-Yield
Chart 11Reduce EM USD-Denominated Corporate Debt Exposure To Underweight
Reduce EM USD-Denominated Corporate Debt Exposure To Underweight
Reduce EM USD-Denominated Corporate Debt Exposure To Underweight
Chart 12
Finally, we are entering 2022 with the same relative tilt within US mortgage-backed securities (MBS) that we maintained during the latter half of 2021, with an overweight stance on agency commercial MBS and an underweight on agency residential MBS. Based on our outlook for 2022, we are immediately making two marginal changes to the spread product allocations to the model bond portfolio: Reducing the size of our US high-yield overweight and using the proceeds to increase the size of the European high-yield overweight Reducing our EM USD-denominated corporate bond allocation to underweight from neutral, and placing the proceeds into Italian and Spanish government bonds (hedged into USD) to limit the reduction in the portfolio yield from the EM downgrade. The above moves will lower our overall credit overweight versus government bonds from 5% to 4%, all coming from the EM to Italy/Spain switch (Chart 12). Overall Portfolio Risk: MODERATE The changes made to our spread product allocations had no material impact on the estimated tracking error of the model portfolio – the relative volatility versus that of the benchmark. The tracking error is 78bps, still below our self-imposed limit of 100bps but above the lows seen in early 2021 (Chart 13). That higher tracking error is likely related to our underweight stance on US Treasuries, given the rise in bond volatility evident in measures like the MOVE index (bottom panel). Nonetheless, a moderate level of portfolio risk is reasonable given the combination of solid global economic growth, but with tighter global monetary policy, that we expect in 2022. Chart 13Keeping Overall Portfolio Risk At Moderate Levels
Keeping Overall Portfolio Risk At Moderate Levels
Keeping Overall Portfolio Risk At Moderate Levels
Chart 14Positive Portfolio Carry Via Selective Spread Product Overweights
Positive Portfolio Carry Via Selective Spread Product Overweights
Positive Portfolio Carry Via Selective Spread Product Overweights
The overweights to US high-yield, European high-yield and Italian government bonds all contribute to the model bond portfolio having a yield that begins 2022 modestly higher (+14bps) than that of the benchmark index (Chart 14). Portfolio Scenario Analysis For The Next Six Months After making all the changes to our model portfolio allocations, which can be seen in the tables on pages 24-25, we now turn to our regular quarterly scenario analysis to determine the return expectations for the portfolio during the first half of 2022. On the credit side of the portfolio, we use risk-factor-based regression models to forecast future yield changes for global spread product sectors as a function of four major factors - the VIX, oil prices, the US dollar and the fed funds rate (Table 2A). For the government bond side of the portfolio, we avoid using regression models and instead use a yield-beta driven framework, taking forecasts for changes in US Treasury yields and translating those in changes in non-US bond yields by applying a historical yield beta (Table 2B).
Chart
Chart
For our scenario analysis over the next six months, we use a base case scenario plus two alternate “tail risk” scenarios, based on the following descriptions and inputs: Base Case Omicron related economic weakness is visible in some major economies (euro area, Canada), but the US stays resiliently strong and the US labor market continues to tighten. China is a growth laggard, but this will lead to policymakers providing more macro stimulus (credit, monetary, fiscal) starting in Q2/2022. Inflation pressures from supply chain disruption remain stubbornly strong and realized global inflation rates stay elevated for longer. Developed market central banks continue dialing back pandemic-era monetary policy accommodation, led by Fed tapering and a June 2022 liftoff of the funds rate. There is a mild initial bear steepening of the US Treasury curve with additional widening of US inflation breakevens in Q1/2022, leading to bear flattening in Q2 in the run-up to liftoff – the net effect is a parallel shift higher in the entire yield curve. The VIX index stays near current levels at 20, both the US dollar and oil prices are broadly unchanged and the fed funds rate is increased to 0.25%. Hawkish Fed The Omicron wave is short-lived with limited impact on global growth, which remains well above trend. Global inflation only declines moderately from current elevated levels, both from persistent supply squeezes and faster wage growth. China loosens monetary/credit policies and announces new fiscal stimulus in late Q1/2022 – a positive surprise for global growth expectations. Developed economy central banks turn even more hawkish. Fed liftoff is in March, with another hike in June. The US Treasury curve bear-flattens as US inflation breakevens reach their cyclical peak. The VIX index climbs to 25, the US dollar depreciates by -3% (pulled in opposing directions by strong global growth but relatively higher US interest rates), oil prices climb +10% and the fed funds rate is increased to 0.5%. Pessimistic Scenario The Omicron wave persists in many major countries (including the US) and leads to extended lockdowns and weaker consumer spending. Global growth momentum slows sharply. China does not signal adequate stimulus to offset its slowdown, while a weakened Biden administration passes much smaller US fiscal stimulus. Supply chain disruptions persist and are made worse by Omicron, keeping inflation elevated even as growth slows (stagflation). Developed economy central banks, stuck between slowing growth and elevated inflation, are unable to ease in response to economic weakness. The Fed goes for a slower taper that still ends in June, but liftoff is delayed until at least September. The US Treasury curve bull steepens modestly as the front end prices out 2022 hikes. US inflation breakevens remain sticky due to persistent realized inflation. The VIX index climbs to 30, the US dollar appreciates by +5% on a safe haven bid, oil prices fall -10% and the fed funds rate remains at 0%. The excess return scenarios for the model bond portfolio, using the above inputs in our simple quantitative return forecast framework, are shown in Table 3A. The US Treasury yield assumptions are shown in Table 3B. For the more visually inclined, we present charts showing the model inputs and Treasury yield projections in Chart 15 and Chart 16, respectively.
Chart
Chart
Chart 15Risk Factor Assumptions For The Scenario Analysis
Risk Factor Assumptions For The Scenario Analysis
Risk Factor Assumptions For The Scenario Analysis
Chart 16US Treasury Yield Assumptions For The Scenario Analysis
US Treasury Yield Assumptions For The Scenario Analysis
US Treasury Yield Assumptions For The Scenario Analysis
The model bond portfolio is expected to deliver an excess return over its performance benchmark during the next six months of +54bps in the Base Case and +31bps in the Hawkish Fed scenario, but is projected to underperform by -9bps in the Pessimistic scenario. Importantly, there is virtually no expected excess return from the credit side of model bond portfolio in the Hawkish Fed scenario, even with strong global growth. A faster-than-expected pace of Fed rate hikes in the first half of 2022 would be a clear signal to downgrade exposure to the riskier parts of the fixed income universe like US high-yield. Although in that Hawkish Fed scenario, greater-than-expected China stimulus and a weaker US dollar would also represent signals to begin adding back emerging market credit exposure. Robert Robis, CFA Chief Fixed Income Strategist rrobis@bcaresearch.com Footnotes 1 Our model bond portfolio custom benchmark index is the Bloomberg Barclays Global Aggregate Index, but with allocations to global high-yield corporate debt and USD-denominated emerging market debt replacing very high quality spread product (i.e. AA-rated). We believe this to be more indicative of the typical internal benchmark used by global multi-sector fixed income managers. 2 We also made very slight adjustments within the US, Japan, Germany and France allocations to refine our allocations across the various maturity buckets while keeping the overall portfolio duration unchanged entering 2022. Appendix
Image
Image
Image
Image
Image
Recommendations Duration Regional Allocation Spread Product Tactical Trades GFIS Model Bond Portfolio Recommended Positioning Active Duration Contribution: GFIS Recommended Portfolio Vs. Custom Performance Benchmark
Image
The GFIS Recommended Portfolio Vs. The Custom Benchmark Index
Image
We have entered a new phase of the cycle, with central banks in most developed markets turning more hawkish (the Bank of England surprisingly hiking in December, and the Fed signaling three rate hikes for 2022). How much does this matter for equities and other risk assets? Our view is that, as long as economic growth continues to be strong (and we think it will), and provided that central banks don’t overdo the tightening (and, with inflation likely to come down this year, we think excess tightening is unlikely), the hawkish turn might temporarily raise volatility and cause the occasional correction, but it does not undermine the case for equities to outperform bonds over the next 12 months. We remain overweight global equities. Economic growth is likely to continue to be well above trend for the next year or two (Chart 1), driven by (1) consumers spending some of the $5 trillion of excess savings they have accumulated in the G10 economies, (2) the unprecedented wealth effect from recent stock and house price rises (Chart 2), and (3) strong capex as companies strive to increase capacity to meet the consumer demand (Chart 3). The upsurge in Covid cases in December (Chart 4) will undoubtedly slow growth temporarily. But the signs are that the now-prevalent Omicron variant is mild, and its rapid spread could help the developed world achieve “herd immunity” thanks to widespread vaccination and natural immunity, though emerging countries – especially China – may continue to struggle. Chart 1Growth Will Continue To Be Above Trend
Growth Will Continue To Be Above Trend
Growth Will Continue To Be Above Trend
Chart 2Growth Will Be Boosted By The Wealth Effect...
Growth Will Be Boosted By The Wealth Effect...
Growth Will Be Boosted By The Wealth Effect...
Chart 3...And Capex To Increase Production
...And Capex To Increase Production
...And Capex To Increase Production
With US growth very strong – the Atlanta Fed Nowcast suggests Q4 QoQ annualized real GDP growth was 7.6% – and core PCE inflation 4.1%, it is hardly surprising that the Fed wants to accelerate the rate at which it withdraws accommodation. The FOMC dots, which see three rate hikes this year and another three in 2023, are unexceptional and close to what the futures market has already been (and still is) pricing in (Chart 5). Chart 4Covid Cases Not Leading to Hospitalizations And Deaths
Covid Cases Not Leading to Hospitalizations And Deaths
Covid Cases Not Leading to Hospitalizations And Deaths
Chart 6Fed Hikes Have Usually Caused Only A Short-Lived Selloff
Fed Hikes Have Usually Caused Only A Short-Lived Selloff
Fed Hikes Have Usually Caused Only A Short-Lived Selloff
Chart 5The Futures Market Is In Line With The FOMC Dots
The Futures Market Is In Line With The FOMC Dots
The Futures Market Is In Line With The FOMC Dots
In the past, the first Fed hike in a cycle has often triggered a mild short-term sell off in stocks (the timing depending on how well the hike was flagged in advance), but the equity market digested the news rapidly, quickly resuming its upward trend as the Fed continued to tighten (Chart 6). The same was true around the tapering and end of asset purchases in 2013-17 (Chart 7). All that depends, though, on whether the Fed is rushed into further rate hikes because inflation surprises even more to the upside. Our view remains that inflation will decline this year. The high inflation prints we are seeing now are mostly the result of exceptional demand for consumer manufactured goods, which the supply side has temporarily been unable to fulfil, causing shortages. This can be seen in the very different pattern of goods and services inflation (Chart 8). As we have argued previously, the supply response is now kicking in for key inputs into manufactured goods, such as semiconductors and shipping and, with demand likely to shift to services this year as the pandemic fades, this should bring inflation down. Chart 7Tapering Didn't Much Affect Stocks Either
Tapering Didn't Much Affect Stocks Either
Tapering Didn't Much Affect Stocks Either
Chart 8Inflation Probably Will Decline This Year
Inflation Probably Will Decline This Year
Inflation Probably Will Decline This Year
That said, the year-on-year inflation number will continue to look scary for some time, even if month-on-month inflation settles back to its pre-pandemic level of 0.2% (Chart 9). The consensus average forecast of 3.3% core PCE inflation in 2022 is factoring in monthly inflation around this level. The risks to inflation remain to the upside, particularly if wages respond to higher prices (US wage growth is currently 4-6%, significantly lagging behind price inflation – Chart 10), causing companies to raise prices further, triggering a price-wage spiral. Chart 9Year-On-Year Inflation Will Remain High
Year-On-Year Inflation Will Remain High
Year-On-Year Inflation Will Remain High
Chart 10Risk Of A Price-Wage Spiral?
Risk Of A Price-Wage Spiral?
Risk Of A Price-Wage Spiral?
All this suggests a year of significant volatility and uncertainty. The US stock market has not seen a correction (a drop of more than 10%) in this cycle, and there were no drawdowns last year of more than 5% (Chart 11). This is unusual: There were six 10%-plus corrections in the 2009-2019 bull market. The US equity rally is also looking increasingly narrow, with the run-up to a record-high in December driven by just a few large-cap growth stocks (Chart 12). This – and pricey valuations – makes it vulnerable and, as a hedge to downside risks, we continue to recommend an overweight in cash (rather than government bonds, which offer very asymmetrical returns, with significant downside in the event that inflation proves to be stubborn). Chart 11Where Have All The Corrections Gone?
Where Have All The Corrections Gone?
Where Have All The Corrections Gone?
Chart 12Stock Market Has Got Very Narrow
Stock Market Has Got Very Narrow
Stock Market Has Got Very Narrow
The other policy focus remains China. The authorities’ recent cut of the banks’ reserve ratio and more dovish talk does suggest that they are now concerned about how weak growth has become (Chart 13). A slight loosening of monetary policy has probably caused credit growth to bottom (Chart 14). However, our China strategists argue that the easing is likely to be only moderate since policymakers want to continue with structural reforms, such as reducing debt. The next few months may resemble early 2019 when the PBOC engineered a brief injection of liquidity which lasted only a few months. Moreover, the slump in the property market has not run its course (Chart 15), and this will hamper the authorities’ ability to accelerate infrastructure spending, much of which is financed by local governments’ property sales. Even if Chinese credit growth and the property market do pick up a little, the economy – and indeed commodity prices – will not bottom for another 6-9 months (Chart 16). But, when this happens, it would be a signal to turn more risk-on and bullish on cyclical countries and sectors, such as Emerging Markets, Europe, and Value stocks. Chart 13Chinese Data Looks Very Poor
Chinese Data Looks Very Poor
Chinese Data Looks Very Poor
Chart 14Is Credit Growth Now Bottoming?
Is Credit Growth Now Bottoming?
Is Credit Growth Now Bottoming?
Chart 15Slump In China Property Is Not Over
Slump In China Property Is Not Over
Slump In China Property Is Not Over
Chart 16It Will Take A While For Commodity Prices To Pick Up
It Will Take A While For Commodity Prices To Pick Up
It Will Take A While For Commodity Prices To Pick Up
Equities: While we remain overweight equities, returns this year will be only modest. Returns in 2020 were driven by multiple expansion, and last year by strong margin expansion (Chart 17), as often happens in Years 1 and 2 of a bull market. But this year, while sales growth should remain strong, BCA Research’s US equity strategists’ model points to a small decline in margins, which are at a record high (Chart 18). The PE multiple is likely to fall further too, as it usually does when the Fed is hiking. Even with buybacks and dividends, this amounts to a total return from US equities of only about 8%. Chart 17What Can Drive Returns In 2022?
What Can Drive Returns In 2022?
What Can Drive Returns In 2022?
Chart 18Margins Likely To Slip From Record High
Margins Likely To Slip From Record High
Margins Likely To Slip From Record High
Chart 19Europe Is More Sensitive To China Slowing...
Europe Is More Sensitive To China Slowing...
Europe Is More Sensitive To China Slowing...
Nonetheless, we continue to prefer the US to other developed markets. Europe is more sensitive to the slowdown in China (Chart 19) and tends to underperform when global growth is slowing and is concentrated in services. Neither is it notably cheap versus the US relative to history (Chart 20). Emerging Markets face multiple headwinds, from the slowdown in China, to rampant inflation that is forcing central banks to hike aggressively (Brazil, for example has raised rates to 9.25% from 2% since April even in the face of weak growth and continuing risks from Covid). Chart 20...And Not Particularly Cheap
...And Not Particularly Cheap
...And Not Particularly Cheap
Chart 22US Treasurys Are Attractive to Europeans And Japanese
US Treasurys Are Attractive to Europeans And Japanese
US Treasurys Are Attractive to Europeans And Japanese
Chart 21Long Rates Low Given Fed Signaling
Long Rates Low Given Fed Signaling
Long Rates Low Given Fed Signaling
Fixed Income: Long-term rates are surprisingly low, given the hawkish pivot of the Fed and other central banks (Chart 21). One explanation Fed chair Powell has given is the attractiveness of US Treasurys, after FX hedges, to European and Japanese investors (Chart 22). He is correct about this, but the advantage will wane as the Fed raises rates (while the ECB and BOJ don’t). We continue to forecast the 10-year Treasury yield to rise to 2-2.25% by the time of the first Fed hike. We are underweight duration and expect a moderate steepening of the yield curve. TIPs look richly valued, especially at the short end. We are neutral on US TIPs, where 10-years at least represent a hedge against tail-risk inflation. Inflation-linked bonds in the euro zone are particularly unattractive now (Chart 23). Chart 23Breakevens Already Pricing In A Lot Of Inflation
Breakevens Already Pricing In A Lot Of Inflation
Breakevens Already Pricing In A Lot Of Inflation
Chart 24
In credit, we continue to see value in riskier high-yield bonds, where US B- and Caa-rated names are trading at breakeven spreads close to historic averages (Chart 24). Our global fixed-income strategists have also recently turned more positive on US dollar-denominated EM debt, which offers a decent spread pickup versus US corporate debt of the same credit rating and maturity (Chart 25). Currencies: Relative monetary policy between the US and Europe and Japan could mean some further upside for the dollar over the next few months (Chart 26). However, the dollar is expensive relative to fair value, long-dollar is an increasingly crowded trade and, in the second half of the year, a rebound in China would boost growth in Europe and Emerging Markets, which would be positive for commodity currencies. Bearing that in mind, we remain neutral on the USD. Chart 25...As Are Some EM Dollar Bonds
...As Are Some EM Dollar Bonds
...As Are Some EM Dollar Bonds
Chart 26Dollar To Rise On More Hawkish Fed?
Dollar To Rise On More Hawkish Fed?
Dollar To Rise On More Hawkish Fed?
Chart 28Gold Is Vulnerable To Rising Real Rates
Gold Is Vulnerable To Rising Real Rates
Gold Is Vulnerable To Rising Real Rates
Chart 27
Commodities: Metals prices are likely to suffer further in the first half of the year, as China’s growth continues to slow. This would suggest a further decline in the equity Materials sector. Nonetheless, we continue to have a neutral on commodities as an asset class because of the positive long-term story: Demand for metals for use in alternative energy is not being met by increased supply because investor pressure is stymying capex in the mining sector (Chart 27). It makes sense to have long-term exposure to metals such as copper and lithium which are used in electric vehicles. The oil price is mostly determined currently by Saudi supply. Our energy strategists forecast Brent oil to average $78.50 in 2022 and $80 in 2023, roughly the same as the current spot price. We remain neutral on gold: The bullion is not particularly attractively valued currently and will suffer if, as we expect, real long-term rates rise (Chart 28). Garry Evans, Senior Vice President Global Asset Allocation garry@bcaresearch.com Recommended Asset Allocation
Highlights Global growth will remain above-trend in 2022, although with more divergence between regions than at any time during the pandemic (US strong, Europe steady, China slowing). Global inflation will transition from being driven by supply squeezes towards more sustainable inflation fueled by tightening labor markets - a shift leading to tighter monetary policies that are not adequately discounted in the current low level of bond yields, most notably in the US. Maintain below-benchmark overall global duration exposure. Diverging growth and inflation trends will lead to a varying pace of monetary policy tightening between countries, resulting in greater opportunities to benefit from relative bond market performance and cross-country yield spread moves. Underweight government bonds in countries where central banks are more likely to hike rates in 2022 (the US, the UK, Canada) versus overweights where monetary policy is more likely to remain unchanged (Germany, France, Italy, Australia, Japan). Deeply negative real bond yields reflect an implied path of nominal interest rates that is too low relative to inflation expectations in the majority of developed countries. Real bond yields will adjust higher in countries where rate hikes are more likely, resulting in more stable inflation breakevens compared to 2021. Stay neutral global inflation-linked bonds versus nominal government debt. A tightening global monetary policy backdrop and rising real interest rates will weigh on returns in global credit markets, even as strong nominal economic growth minimizes downgrade and default risks. Like government bonds, global growth and policy divergences will create relative investment opportunities between countries, especially later in 2022 when the Fed begins to hike rates and China begins to ease macro policies. Overweight euro area high-yield and investment grade corporates versus US equivalents. Limit exposure to EM hard-currency debt until there are clear signals of China policy stimulus and upside momentum on the US dollar fades. Feature Dear Client, This report, detailing our global fixed income investment outlook for next year, will be our last for 2021. We wish you a very safe, happy and prosperous 2022. We look forward to continuing our conversation in the new year. Rob Robis, Chief Global Fixed Income Strategist BCA Research’s Outlook 2022 report, “Peak Inflation – Or Just Getting Started?”, outlining the main investment themes for the upcoming year based on the collective wisdom of our strategists, was sent to all clients in late November. In this report, we discuss the broad implications of those themes for the direction of global fixed income markets, along with our main investment recommendations for 2022. A Brief Summary Of The 2022 BCA Outlook The tone of the 2022 Outlook report was quite positive on the prospects for global growth, even with the recent development of the rapid spread of the Omicron COVID-19 variant. It remains to be seen how severe this new variant will be in terms of hospitalizations and deaths compared to previous COVID waves. We assume that any negative economic impacts from Omicron in the developed economies will be contained to the first half of 2022, however, given more widespread vaccination rates (including booster shots) and greater access to anti-viral treatments. The baseline economic scenario in 2022 is one of persistent above-trend growth in the developed world (Chart 1) with a closing of output gaps in the US and euro area. The mix of spending in those economies will shift away from goods towards services, although Omicron may delay that transition until later in 2022. Chart 1Another Year Of Above Trend Growth Expected In 2022
Another Year Of Above Trend Growth Expected In 2022
Another Year Of Above Trend Growth Expected In 2022
Chart 2Strong Fundamental Support For US Growth
Strong Fundamental Support For US Growth
Strong Fundamental Support For US Growth
Chart 3China In 2022: Deceleration Leading To Policy Easing
China In 2022: Deceleration Leading To Policy Easing
China In 2022: Deceleration Leading To Policy Easing
The US looks particularly well supported to maintain a solid pace of economic activity. The US labor market is very strong. Monetary policy remains accommodative (although that is slowly changing). Financial conditions are still easy, with the lagged impact of elevated equity and housing values providing a robust tailwind to consumer spending that is already well supported by excess savings resulting from the pandemic (Chart 2). China starts the year as a “one-legged” economy supported only by external demand, and policy stimulus later in the year will eventually be needed for the Chinese government to reach its growth targets (Chart 3).That policy shift will have significant implications for the outlook of many financial assets as 2022 evolves, including emerging market (EM) fixed income, industrial commodity prices and the US dollar (as we discuss later in this report). Global inflation will recede from the overheated pace of 2021 as supply chain bottlenecks become less acute. Inflationary pressures in 2022 will come from more “normal” sources like tightening labor markets, rising wage growth and higher housing costs (rents). This constellation of lower unemployment with still-elevated underlying inflation will look most acute in the US, leading the Fed to begin a tightening cycle that is not fully discounted in US Treasury yields. The broad investment conclusions of the BCA 2022 Outlook are more positive for global equity markets relative to bond markets, although with elevated uncertainty stemming from Omicron and future China stimulus. The views are more nuanced for other assets, like the US dollar (stronger to start the year, weaker later) and oil prices (essentially flat from pre-Omicron levels). Our Four Key Views For Global Fixed Income Markets In 2022 The following are the main implications for global fixed income investment strategy based off the conclusions from the 2022 BCA Outlook. Key View #1: Maintain below-benchmark overall global duration exposure. As we have noted in the title of our report, the investment outlook for 2022 is more complicated for investors to navigate than the relatively straightforward story from this time a year ago. Then, the development of COVID-19 vaccines led to optimism on reopening from 2020 lockdowns, but with no threat of the early removal of pandemic monetary and fiscal policy stimulus. The fixed income investment implications at the time were obvious, in the majority of developed countries - expect higher government bond yields, steeper yield curves, wider inflation breakevens and tighter corporate credit spreads. Today, the story is more complicated, but is still one that points to higher global bond yields. Take, for example, global fiscal policy. According to the IMF, the US is expected to see no fiscal drag in 2022 thanks to the Biden Administration’s spending initiatives, while Europe and EM will see significant fiscal drag (Chart 4). However, in the case of Europe, this should not be viewed negatively as it is the result of expiring pandemic era employment and income support programs that are no longer needed after economies emerged from wholesale lockdowns. So less fiscal stimulus is a sign of a healthier European economy that is more likely to put upward pressure on global bond yields, on the margin. The outlook for global consumer spending is also a bit more complicated, but still one that points to higher bond yields. Consumer confidence was declining over the final months of 2021 in the US, Europe, the UK, Canada and most other developed countries. This occurred despite falling unemployment rates and very strong labor demand, which would typically be associated with consumer optimism (Chart 5). High global inflation, which has outstripped wage gains and reduced real purchasing power, is why consumers have become gloomier in the face of healthy job markets. Chart 4Global Fiscal Policy Divergence In 2022
Global Fiscal Policy Divergence In 2022
Global Fiscal Policy Divergence In 2022
Chart 5Lower Inflation Will Help Boost Consumer Confidence
Lower Inflation Will Help Boost Consumer Confidence
Lower Inflation Will Help Boost Consumer Confidence
The implication is that the expectation of lower inflation outlined in the 2022 BCA Outlook, which sounds bond-bullish on the surface, could actually prove to be bond-bearish if it makes consumers more confident and willing to spend. On that note, there are already signs that the some of the sources of the global inflation surge of 2021 are fading in potency. Commodity price inflation has rolled over, in line with slowing momentum in manufacturing activity and a firmer US dollar (Chart 6). Measures of global shipping costs, while still elevated, have stopped accelerating. The spread of the Omicron variant may delay a further easing of supply chain disruptions in the short-term, but on a rate of change basis, the upward pressure on global inflation from supply squeezes will diminish in 2022. The inflation story will also be more complicated next year. While there will be less inflation from the prices of commodities and durable goods, there will be more inflation from the elimination of output gaps, tightening labor markets and an overall dearth of global spare capacity. Put another way, expect the gap between global headline and core inflation rates to narrow in most countries, but with domestically generated core inflation rates remaining elevated (Chart 7). Chart 6Some Relief On Supply-Driven Inflation On The Way
Some Relief On Supply-Driven Inflation On The Way
Some Relief On Supply-Driven Inflation On The Way
Chart 7Global Inflation Will Be Lower, But More Sustainable, In 2022
Global Inflation Will Be Lower, But More Sustainable, In 2022
Global Inflation Will Be Lower, But More Sustainable, In 2022
The more complicated investment story for 2022 extends to global bond yields themselves. Longer-maturity government bond yields remain far too low given the mix of very high inflation and very low unemployment in many countries. Chart 8Bond Markets Vulnerable To More Hawkish Repricing
Bond Markets Vulnerable To More Hawkish Repricing
Bond Markets Vulnerable To More Hawkish Repricing
Even as major central banks like the Fed are tapering bond purchases and signaling more rate hikes in 2022, and others like the Bank of England (BoE) have actually raised rates, bond yields remain low. The reason for this is that markets are discounting very low terminal rates – the peak level of policy rates to be reached in the next monetary tightening cycle. We proxy this by looking at 5-year overnight index swap (OIS) rates, 5-years forward. A GDP-weighted aggregate of those forward OIS rates for the major developed economies (the US, Germany, the UK, Japan, Canada and Australia) is currently 0.9%. This compares to GDP-weighted 10-year government bond yield of 0.8% (Chart 8). Forward OIS rates and 10-year bond yields are typically closely linked, which suggests upward scope for longer-maturity bond yields as markets begin to discount a higher trajectory for policy rates. We see this as the primary driver of higher bond yields in 2022 – an upward adjustment of interest rate expectations as central banks like the Fed, BoE and Bank of Canada (BoC) promise, and eventually deliver, more rate hikes than markets currently expect. We therefore recommend maintaining a below-benchmark stance on overall interest rate (duration) exposure in global bond portfolios in 2022. Government bond yield curves will eventually see more flattening pressure as central banks tighten, most notably in the US, but not before longer-term yields rise to levels more consistent with the most likely peak levels of central bank policy rates. Key View #2: Underweight government bonds in countries where central banks are more likely to hike rates in 2022 (the US, the UK, Canada) versus overweights where monetary policy is more likely to remain unchanged (Germany, France, Italy, Australia, Japan). The more complicated fixed income investing story for 2022 also extends to country allocation decisions, with more opportunities to take advantage of diverging bond market performance and cross-country spread moves. Current pricing in OIS curves shows a very modest expected path for interest rates in the major developed economies (Chart 9). Some central banks, like the BoE, BoC and the Reserve Bank of New Zealand (RBNZ) are expected to be more aggressive with rate hikes in 2022 compared to the Fed. Yet there are not many rate hikes discounted beyond 2022, even in the US (Table 1). Chart 9Markets Are Pricing Short, Shallow Hiking Cycles
Markets Are Pricing Short, Shallow Hiking Cycles
Markets Are Pricing Short, Shallow Hiking Cycles
Table 1Only Modest Tightening Expected Over The Next Three Years
2022 Key Views: The Story Gets More Complicated
2022 Key Views: The Story Gets More Complicated
The US OIS curve is currently priced for an expectation that the Fed will struggle to hike the fed funds rate beyond 1.25% by the end of 2024, even with the latest set of FOMC rate forecasts calling for 75bps of rate hikes in 2022 alone. In the case of the UK, markets are pricing in lower rates in 2024 after multiple rate hikes in 2022/23, indicative of an expectation of a policy error of BoE “overtightening” even with the BoE Bank Rate expected to peak just above 1% The relative performance of government bond markets is typically correlated to changes in relative interest rate expectations. That was once again evident in 2021, where the UK, Canada and Australia significantly underperformed the Bloomberg Global Treasury aggregate in the third quarter as markets moved to rapidly price in multiple rate hikes (Chart 10). That volatility of bond market performance was particularly unusual Down Under, as the Reserve Bank of Australia (RBA) did not signal any desire to begin hiking rates in 2022, unlike the BoE and BoC. As rate expectations in those three countries stabilized in the fourth quarter, their government bonds began to outperform. On the other hand, relative government bond performance was more stable in the euro area, Japan and the US for most of 2021 (Chart 11). In the case of the US, rate hike expectations only began to move higher in September after the Fed signaled that tapering of bond purchases was imminent. Even then, markets have moved slowly to discount 2022 rate hikes. Now, the pricing in the US OIS curve is more in line with the median interest rate “dot” from the latest FOMC projections, calling for three rate hikes next year starting in June. Chart 10Rate Hike Expectations Driving Relative Bond Returns
Rate Hike Expectations Driving Relative Bond Returns
Rate Hike Expectations Driving Relative Bond Returns
Chart 11Stay Underweight US Interest Rate Exposure
Stay Underweight US Interest Rate Exposure
Stay Underweight US Interest Rate Exposure
Looking ahead to next year, we see the widening divergences on growth, inflation and monetary policies between countries leading to the following investible opportunities on country allocation in global bond portfolios. Underweight US Treasuries Chart 12Cyclical Upside Risk To Longer-Dated UST Yields
Cyclical Upside Risk To Longer-Dated UST Yields
Cyclical Upside Risk To Longer-Dated UST Yields
The Fed has already begun to taper its bond buying, which is set to end by March 2022. As shown in Table 1, 79bps of rate hikes are discounted in the US by the end 2022, but only another 41bps are priced over the subsequent two years. Survey-based measures of interest rate expectations are similarly dovish, even with the US unemployment rate now at 4.2% - within the FOMC’s range of full employment (NAIRU) estimates between 3.5-4.5% - and wage inflation accelerating (Chart 12). Markets are underestimating how much the funds rate will have to rise over the next 2-3 years as the Fed belated catches up to a very tight US labor market and inflation persistently above the Fed’s 2% target. Stay below-benchmark on US interest rate risk, through both reduced duration exposure and lower portfolio allocations to Treasuries. Overweight Core Europe While interest rate markets are underestimating how much monetary tightening the Fed will deliver, the opposite is true in Europe. The EUR OIS curve is discounting 39bps of rate hikes to the end of 2024, even with cyclical growth indicators like the manufacturing PMI and ZEW expectations survey well off the 2021 highs (Chart 13). At the same time, there is little evidence to date indicating that the surge in European inflation this year, which has been narrowly concentrated in energy prices and durable goods prices, is feeding through into broader inflation pressures or faster wage growth. We recommend maintaining an overweight allocation to core European government bond markets (Germany, France), particularly versus underweights in US Treasuries. Our expectation of a wider 10-year US Treasury-German bund spread is one of our highest conviction views for 2022, playing on our theme of widening growth, inflation and monetary policy divergences (Chart 14). Chart 13Stay Overweight European Interest Rate Exposure
Stay Overweight European Interest Rate Exposure
Stay Overweight European Interest Rate Exposure
Chart 14Expect More US-Europe Spread Widening In 2022
Expect More US-Europe Spread Widening In 2022
Expect More US-Europe Spread Widening In 2022
Overweight European Peripherals Chart 15Stay O/W European Peripheral Exposure To Begin 2022
Stay O/W European Peripheral Exposure To Begin 2022
Stay O/W European Peripheral Exposure To Begin 2022
The ECB will be allowing its Pandemic Emergency Purchase Program, or PEPP, to expire at the end of March 2022. Beyond that, the ECB has announced that the pace of buying in the existing pre-pandemic Asset Purchase Program (APP) will be upsized from €20bn per month to between €30-40bn until at least the third quarter of 2022. This represents a meaningful slowing of the pace of ECB bond purchases, which were nearly €90bn per month under PEPP. Nonetheless, unlike most other developed economy central banks that are ending pandemic-era quantitative easing (QE) programs, the ECB will still be buying bonds on a net basis and expanding its balance sheet in 2022 (Chart 15). The central bank has taken great care in signaling that no rate hikes should be expected in 2022, likely to avoid any unwanted surges in Peripheral European bond yields or the euro. A continuation of asset purchases reinforces that message, leaving us comfortable in maintaining an overweight recommendation on Italian and Spanish government bonds for 2022. Underweight the UK and Canada Chart 16Stay U/W UK & Canadian Interest Rate Exposure
Stay U/W UK & Canadian Interest Rate Exposure
Stay U/W UK & Canadian Interest Rate Exposure
A combination of rapidly tightening labor markets and soaring inflation is almost impossible for any inflation-targeting central bank to ignore. That is certainly the case in the UK, where the unemployment rate is 4.2% with two job vacancies available for every unemployed person – a series high for that ratio (Chart 16, top panel). UK headline CPI inflation is at a 10-year high of 5.2% and the BoE expects inflation to peak around 6% in April 2022. Medium-term inflation expectations, both market based and survey based, are also elevated and well above the BoE’s 2% inflation target. The BoE surprised markets a couple of times at the end of 2021, not delivering on an expected hike in November and actually lifting rates in December in the midst of the intense UK Omicron wave. We see the latter decision as indicative of the central bank’s growing concern over high UK inflation becoming embedded in inflation expectation. The BoE will likely have to eventually raise rates to a level higher than the 2023 peak of 1.1% currently discounted in the GBP OIS curve. That justifies an underweight stance on UK interest rate exposure (both duration and country allocation) in 2022. A similar argument applies to Canada. The Canadian unemployment rate now sits at 6.0%, closing in on the February 2020 pre-COVID low of 5.7%. The BoC’s Q3/2021 Business Outlook Survey showed a net 64% of respondents reporting intensifying labor shortages (the highest level in the 20-year history of the survey). Wage growth is accelerating, headline CPI inflation is running at 4.7% and underlying inflation (trimmed mean CPI) is now at 3.4% - the latter two are well above the BoC inflation target range of 1-3%. The CAD OIS curve currently discounts 147bps of rate hikes in 2022, which is aggressively hawkish, but very little is priced beyond that in 2023 (another 19bp hike) and 2024 (a rate cut of 24bps). The BoC estimates that the neutral interest rate in Canada is between 1.75% and 2.75%. Thus, markets do not expect the BoC to lift rates to even the low end of that range over the next three years, despite a very tight labor market and an inflation overshoot. We see this as justifying a continued underweight stance on Canadian interest rate exposure (both duration and country allocation) in 2022, even with markets already discounting significant monetary tightening next year. Overweight Australia and Japan Outside of Europe, we recommend overweights on Australian and Japanese government bonds entering 2022 (Chart 17). The RBA has been quite clear in what needs to happen before it will begin to lift rates. Australian wage growth must climb into the 3-4% range that has coincided with underlying Australian inflation sustainably staying in the RBA’s 2-3% target range. Wage growth and trimmed mean CPI inflation only reached 2.2% and 2.1%, respectively, for the latest available data from Q3/2021. As Australian wage and inflation data is only released on a quarterly basis, the RBA will not be able to assess whether wage dynamics are consistent with reaching its inflation target until the latter half of 2022. The AUD OIS curve is currently discounting 119bps of rate hikes in 2022 and an additional 86bps of hikes in 2023. Those are both far too aggressive for a central bank that is unlikely to begin lifting rates until the end of 2022, at the very earliest. Thus, we recommend an overweight stance on Australian bond exposure in global bond portfolios in 2022. The case for overweighting Japanese government bonds is a simple one. There are none of the inflation or labor market pressures seen in other countries to justify a hawkish turn by the Bank of Japan (bottom panel). Japanese core CPI is shockingly in deflation (-0.7%), bucking the trend seen in other countries and showing no pass-through from rising energy prices of global supply chain disruptions. This makes Japan a good defensive “safe haven” bond market against the backdrop of rising global bond yields that we expect in 2022. Chart 17Stay O/W Australian & Japanese Interest Rate Exposure
Stay O/W Australian & Japanese Interest Rate Exposure
Stay O/W Australian & Japanese Interest Rate Exposure
Chart 18Our Recommended DM Government Bond Country Allocations
Our Recommended DM Government Bond Country Allocations
Our Recommended DM Government Bond Country Allocations
In summary, our government allocations reflect the growing gap between expected monetary policy changes in 2022. This gives us a bias to favor lower-yielding markets, with Australia being the notable exception (Chart 18). However, in an environment where global bond volatility is expected to increase as multiple central banks exit QE and begin rate hiking cycles, carry/yield considerations play a secondary role in determining optimal country allocations. Key View #3: Stay neutral global inflation-linked bonds versus nominal government debt Another part of the global fixed income universe where the investment story has become more complicated is inflation-linked bonds. Overweighting inflation-linked bonds versus nominal government debt was the right strategy for bond investors as economies reopened from 2020 COVID lockdowns and global growth recovered. Booming commodity prices and supply chain squeezes added to the positive backdrop for linkers in 2021, as realized inflation soared to levels not seen in over a generation in many countries. Yet now, there is much less upside potential for inflation breakevens from current levels. Our Comprehensive Breakeven Indicators (CBI) are one of our preferred tools to assess the attractiveness of inflation-linked bonds versus nominals within the developed markets. For each country, the CBI reflects the distance of 10-year inflation breakevens from three different measures – the fair value from our breakeven spread model, medium-term survey-based inflation expectations and the central bank inflation target. The further breakevens are from these three measures, the less scope there is for additional increases in breakevens. As can be seen in Chart 19, there is limited upside potential for breakevens in almost all countries. Only Canada has a CBI below zero, with the CBIs for the UK, US, Germany and Italy well above zero.
Chart 19
With central banks belated starting to respond to high realized inflation with tapering and rate hikes, it is still too soon to move to a full-blown underweight stance on global inflation-linked bond exposure versus nominal government debt. Instead, we recommend no more than a neutral exposure in countries where our CBIs are relatively lower – Canada, Australia, Japan – and underweight allocations where the CBIs are relatively higher – the UK, Germany, Italy and France (Chart 20). One country where we are deviating from our CBI signal is the US. We are keeping the recommended US TIPS exposure at neutral to begin 2022, but we anticipate downgrading TIPS later in 2022 if the Fed begins to lift rates sooner and more aggressively than expected. We do recommend positioning within that neutral overall TIPS allocation by underweighting shorter maturities versus longer-dated TIPS, A more hawkish Fed and some likely deceleration of realized US inflation should result in a steeper TIPS breakeven curve and a flatter TIPS real yield curve. Beyond looking at inflation breakevens, the outlook for real bond yields may be THE most complicated part of the 2022 investment story. Perhaps no single topic generates a greater debate among BCA’s strategists than real bond yields, which remain negative across the developed world (Chart 21). Determining why real yields are negative is critical for making calls across other asset classes beyond just government bonds. Valuations for equities and corporate credit have become more closely correlated with real yields in recent years. Real yield differentials are also an important factor driving currency levels. Chart 20Our Recommended Inflation-Linked Bond Allocations
Our Recommended Inflation-Linked Bond Allocations
Our Recommended Inflation-Linked Bond Allocations
We see negative real yields as a reflection of persistent central bank policy dovishness that looks increasingly unrealistic. Chart 22 should look familiar to regular readers of Global Fixed Income Strategy. We show real central bank policy rates (adjusted for realized inflation) and the market-implied expectations for those real rates derived from the forward curves for OIS rates and CPI swap rates. Chart 21Negative Real Yields: Global Bonds' Biggest Vulnerability
Negative Real Yields: Global Bonds' Biggest Vulnerability
Negative Real Yields: Global Bonds' Biggest Vulnerability
Chart 22
In the US, UK and Europe, markets are pricing a future path for nominal short-term interest rates that is consistently lower than the expected path of inflation. If markets believe that central banks will be unwilling (or unable) to ever lift policy rates above inflation, or that neutral medium-term real interest rates are in fact negative in most developed countries, then it should come as no surprise that longer-maturity real bond yields should also be negative. We do not subscribe to the view that neutral real rates are negative across the developed world, especially in the US. Even if we did, however, such a view is already reflected in the future pricing of bond yields and interest rates. As outlined earlier, OIS curves in many countries are underestimating how high nominal policy rates will go in the next 2-3 years. The potential for a “real rate shock”, where central banks tighten policy at a faster pace than markets expect, is a significant risk for global financial markets in the coming years. We see this as more of a risk for markets in 2023, with the Fed likely to become more aggressive on rate hikes and even the ECB likely to begin considering an interest rate adjustment. For 2022, however, we do expect global real yields to stabilize and likely begin to turn less negative as central banks continue to tighten policy. Key View #4: Overweight euro area high-yield and investment grade corporates versus US equivalents. Limit exposure to EM hard-currency debt until there are clear signals of China policy stimulus and upside momentum on the US dollar fades. The outlook for global credit markets in 2022 has also become more complicated, particularly for corporate bonds and EM hard currency debt. On the one hand, the levels of index yields (Chart 23) and spreads (Chart 24) for investment grade and high-yield corporate debt in the US, euro area and UK have clearly bottomed. The Omicron threat to global growth may be playing a role in the recent increases, but the more likely culprit is growing central bank hawkishness and fears of tighter monetary policy. Chart 23Global Corporate Bond Yields Have Reached A Cyclical Bottom
Global Corporate Bond Yields Have Reached A Cyclical Bottom
Global Corporate Bond Yields Have Reached A Cyclical Bottom
Chart 24Global Corporate Bond Spreads Have Reached A Cyclical Bottom
Global Corporate Bond Spreads Have Reached A Cyclical Bottom
Global Corporate Bond Spreads Have Reached A Cyclical Bottom
On the other hand, the fundamental backdrop for corporate debt is not conducive to major spread widening. As outlined at the start of this report, nominal economic growth in the major developed economies remains solid, which supports the expansion corporate revenues. Combined with still-low borrowing rates, this creates a relatively positive backdrop that limits risks from downgrades and defaults. Chart 25Monetary Policy Backdrop Turning More Negative For Credit Markets
Monetary Policy Backdrop Turning More Negative For Credit Markets
Monetary Policy Backdrop Turning More Negative For Credit Markets
Corporate bond performance, both absolute returns and excess returns versus government debt, has worsened on a year-over-year basis for the latter half of 2021 (Chart 25). That has coincided with slowing growth in the balance sheets of the Fed and other major central banks and, more recently, the flattening trend of government bond yield curves as markets have discounted 2022 rate hikes. This suggests that monetary policy tightening expectations are dominating the still relatively positive fundamental backdrop for corporate credit. Looking ahead to 2022, we see a greater need to focus on relative value and cross-country valuation considerations when allocating to developed market corporate debt – particularly when looking the biggest markets in the US and euro area. We see a strong case for favoring euro area corporates over US equivalents, both for investment grade and particularly for high-yield. Our preferred method of corporate bond valuation is looking at 12-month breakevens. Breakevens measure the amount of spread widening that would need to occur over a one year horizon to eliminate the yield advantage of owning corporate bonds over government bonds of similar duration. We calculate this as the ratio of the index spread to the index duration for a particular credit market, like US investment grade. We then take a percentile ranking of those 12-month breakevens to determine the attractiveness of spreads versus its own history. On that basis, the 12-month breakeven for US investment grade corporates looks very unattractive, sitting near the bottom of the historical distribution (Chart 26). This reflects not only tight spreads but also the high durations of investment grade credit. US high-yield corporate spreads are not as stretched, but are also not particularly cheap, with the 12-month breakeven sitting at the 34th percentile of its distribution. In the euro area, the 12-month breakeven for investment grade is not as stretched as in the US, sitting in the 36th percentile (Chart 27). The euro area high-yield 12-month breakeven looks similar to the US, at the 24th percentile of its historical distribution. Chart 26US Corporate Spread Valuations Are Not Compelling
US Corporate Spread Valuations Are Not Compelling
US Corporate Spread Valuations Are Not Compelling
Chart 27Euro Area Corporate Spread Valuations Are Also Stretched
Euro Area Corporate Spread Valuations Are Also Stretched
Euro Area Corporate Spread Valuations Are Also Stretched
Our current recommended strategy on US corporate exposure is to be neutral investment grade and overweight high-yield. We see no reason to change that view to begin 2022. However, we do anticipate downgrading US corporate exposure later in the year when the Fed begins to lift interest rates and the US Treasury curve flattens more aggressively. Earlier, we recommended positioning for a wider US Treasury-German bund spread as a way to play for the growing policy divergence between a more hawkish Fed and a still dovish ECB. Another way to do that is to overweight euro area corporate debt versus US equivalents, for both investment grade and especially for high-yield. In terms of potential default losses, the outlook is positive on both sides of the Atlantic. Moody’s is projecting a 2022 default rate of 2.3% in the US and 2.2% in the euro area (Chart 28). The last two times that the default rates were so similar, in 2014/15 and 2017/18, also coincided with a period of euro area high-yield outperforming US high-yield (on a duration-matched and currency-matched performance). We see that pattern repeating in 2022. Chart 28Favor Euro Area High-Yield Over US Equivalents In 2022
Favor Euro Area High-Yield Over US Equivalents In 2022
Favor Euro Area High-Yield Over US Equivalents In 2022
Chart 29
When looking within credit tiers, we see the best value in favoring Ba-rated euro area high-yield versus US equivalents when looking at 12-month breakeven percentile rankings (Chart 29). Yet even looking at just yields rather than spread, lower-rated euro area high-yield corporates offer more attractive yields than US equivalents, on a currency-hedged basis (Chart 30).
Chart 30
Chart 31Stay Cautious On EM Hard Currency Debt
Stay Cautious On EM Hard Currency Debt
Stay Cautious On EM Hard Currency Debt
Turning to EM hard currency debt, we recommend a cautious stance entering 2022. EM fundamentals that typically need to in place to produce tighter EM credit spreads are currently not in place. Chinese economic growth is slowing, commodity price momentum is fading and the US dollar is appreciating versus EM currencies (Chart 31). An improvement in non-US economic growth will help turn around all three trends, especially the strengthening US dollar which typically trades off US/non-US growth differentials. The key to any non-US growth acceleration in 2022 will come from China. When Chinese policymakers announce more aggressive stimulus measures in 2022, as we expect, that would represent an opportunity to turn more positive on EM USD-denominated debt. Until that happens, we recommend staying underweight EM hard currency debt, with a slight bias to favor sovereigns over corporates. Robert Robis, CFA Chief Fixed Income Strategist rrobis@bcaresearch.com Recommendations Duration Regional Allocation Spread Product Tactical Trades GFIS Model Bond Portfolio Recommended Positioning Active Duration Contribution: GFIS Recommended Portfolio Vs. Custom Performance Benchmark
Image
The GFIS Recommended Portfolio Vs. The Custom Benchmark Index
Dear Client, Thank you for your continued readership and support this year. This is the last European Investment Strategy report for 2021. In this piece, we review ten charts covering important aspects of the European economy and capital markets. We will resume our regular publishing schedule on January 10th, 2022. The European Investment Strategy team wishes you and your loved ones a wonderful holiday season, and a healthy, happy, and prosperous new year. Best regards, Mathieu Savary Highlights European growth continues to face headwinds as it enters 2022. The ECB will be slow to remove more accommodation than what is implied by the end of the PEPP. Value stocks and Italian equities will enjoy a modest tailwind from rising Bund yields. The lower quality of European stocks creates a long-term headwind versus US benchmarks. The outperformance of European cyclicals relative to defensives will resume and financials will have greater upside. The relative performance of small-cap stocks will soon stabilize, but a weak euro will create a near-term risk. President Emmanuel Macron’s real contender is the center-right candidate Valerie Pécresse, not populists. Feature Chart 1: Wave Dynamics The current wave of COVID-19 infections continues to surge in Europe. As Chart 1 highlights, Austria and the Netherlands just witnessed intense waves that eclipsed those experienced earlier this year. However, these waves are already ebbing because of the containment measures implemented in recent weeks. In these two severely hit nations, hospitalization rates also increased significantly; however, they did not reach the degree experienced in France or the UK in the first half of 2021 (Chart 1, right panel). Chart 1Wave Dynamics
Wave Dynamics I
Wave Dynamics I
Chart 1Wave Dynamics
Wave Dynamics II
Wave Dynamics II
Europe will experience another test in the coming weeks as the highly contagious Omicron variant becomes the dominant COVID-19 strain. However, data from South Africa continues to suggest that this mutation is much less pathogenic than previous variants and will not place as much strain on the healthcare system as potential case counts would indicate. Nonetheless, it is too early to make this prognosis with great confidence. Importantly, even if a small proportion of infected people is hospitalized, a large enough a pool of infections could cause a rupture in the healthcare system. As a result, politicians will likely remain cautious until a larger share of the population receives its booster dose. Hence, Omicron still represents a near-term risk to economic activity, albeit one that will prove ephemeral. Chart 2: The Economy Is Not Out Of The Woods Yet European growth remains highly dependent on the fluctuations of the global economy because exports and capex account for a large share of the continent’s output. Consequently, global economic trends remain paramount when considering the European economic outlook. In the near-term, Europe continues to face headwinds beyond the uncertainty caused by the potential effects of the Omicron variant. Global economic activity, for instance, is likely to face some further near-term headwinds caused by the supply shock typified by elevated commodity prices and bottlenecks (Chart 2). Not only does this shock limit the ability of producers to procure important inputs, but it also increases the costs of production. Historically, this combination results in downward pressure on global manufacturing activity. Chart 2The Economy Is Not Out Of The Woods Yet
The Economy Is Not Out Of The Woods Yet I
The Economy Is Not Out Of The Woods Yet I
Chart 2The Economy Is Not Out Of The Woods Yet
The Economy Is Not Out Of The Woods Yet II
The Economy Is Not Out Of The Woods Yet II
The second problem remains the deceleration in the Chinese economy. Declining credit growth in China results in slower European exports, which also hurts the region’s PMI. The recent Central Economic Work Conference suggests that China is ready to inject more stimulus in its economy, which will help Europe. However, the beginning of 2022 will still witness the lagged impact of previous tightening in credit conditions on European economic indicators. Moreover, BCA’s China Investment Strategy team expects the stimulus to be modest at first and only grow in intensity later. It is unlikely to be as credit-heavy as in the past, which also means it will be less beneficial to Europe. Chart 3: A Careful ECB Last week, the European Central Bank aggressively upgraded its inflation forecast for 2022 and announced the end of the PEPP for March, however, it will increase temporarily the APP program to EUR40bn. Moreover, President Christine Lagarde remains steadfast that the Governing Council will not raise rates in 2022. Our Central Bank Monitor points to the need for tighter policy, yet the ECB continues to adopt a cautious tone, even if the Eurozone HICP inflation has reached 4%—the highest reading in thirteen years. First, the ECB still runs the risk of dislocation in the periphery, where Italian and Spanish spreads may easily explode if monetary accommodation is removed too quickly. Second, European inflationary pressures remain significantly narrower than they are in the US (Chart 3, left panel). Our Eurozone trimmed-mean CPI continues to linger well below core CPI readings, while in the US both measures track each other closely. Third, the decline in energy prices and the ebbing transportation bottlenecks mean that odds are growing that sequential inflation will soon experience an interim peak (Chart 3, right panel). Chart 3A Careful ECB
A Careful ECB I
A Careful ECB I
Chart 3A Careful ECB
A Careful ECB II
A Careful ECB II
This view of the ECB implies that German yields will not rise as much as US yields next year, which BCA’s US Bond Strategy team expects to reach 2.25% by the end of 2022. Moreover, the more tepid pace of the removal of accommodation and the implicit targeting of peripheral bond markets also warrant an overweight position in Italian bonds. Spreads will be volatile, but any move upward will be self-limiting because of their role in the ECB’s reaction function. As a result, investors should continue to pocket the additional income over German paper. Chart 4: A Murky Outlook For The Euro The market continues to test EUR/USD. Any breakdown below 1.1175 is likely to prompt a pronounced down leg toward 1.07-1.08, near the pandemic lows. The euro suffers from three handicaps. First, Europe’s economic links with China are greater than those of the US with China. Consequently, the Chinese economic deceleration hurts European rates of returns more than it hurts those in the US. Second, the acceleration of US inflation is inviting investors to reprice the path of the Fed’s policy rate, which accentuates the upside pressure on the dollar. Finally, the energy crisis is ramping up anew following Germany’s suspension of the approval of the Nord Stream 2 pipeline and the buildup of Russian troops on Ukraine’s borders. Surging European natural gas prices act as a powerful headwind for EUR/USD because they accentuate stagflation risks in the Eurozone (Chart 4, left panel). While these create downside pressures on the euro, the picture is more complex. Our Intermediate-Term Timing Model shows that EUR/USD is one-sigma oversold (Chart 4, right panel). Over the past 20 years, it was more depressed only in 2010 and in early 2015. Such a reading indicates that most of the bad news is already embedded in EUR/USD and that sentiment has become massively negative. Thus, we are not chasing the euro lower, even though we will respect our stop-loss at 1.1175 if it were triggered. Instead, we will look to buy the euro at lower levels in the first quarter of 2021. Chart 4A Murky Outlook For The Euro
A Murky Outlook For The Euro I
A Murky Outlook For The Euro I
Chart 4A Murky Outlook For The Euro
A Murky Outlook For The Euro II
A Murky Outlook For The Euro II
Chart 5: German Yields Are Key To Value Stocks And Italian Equities The performance of European value stocks relative to that of growth stocks continues to exhibit a close relationship with the evolution of German Bund yields (Chart 5, left panel). Value stocks are less sensitive than growth stocks to higher yields because they derive a smaller proportion of their intrinsic value from long-term deferred cash flows; which suffer more from rising discount factors than near-term cash flows. Moreover, value stocks overweight financials, whose profitability increases when yields rise. The same relationship exists between the performance of Italian equities relative to the Eurozone benchmark (Chart 5, right panel). This correlation holds because of Italy’s significant value bias and its large exposure to financials. Chart 5German Yields Are Key To Value Stocks And Italian Equities
German Yields Are Key To Value Stocks And Italian Equities I
German Yields Are Key To Value Stocks And Italian Equities I
Chart 5German Yields Are Key To Value Stocks And Italian Equities
German Yields Are Key To Value Stocks And Italian Equities II
German Yields Are Key To Value Stocks And Italian Equities II
Based on these observations, BCA’s view that German Bund yields will rise toward 0.25% is consistent with a modest outperformance of value and Italian equities in 2022. For a more robust outperformance by value and Italian stocks, the Chinese economy will have to re-accelerate clearly and the dollar will have to fall significantly. However, these two outcomes could take more time to materialize than our bond view. Chart 6: Europe’s Quality Deficit The gyrations in the performance of European equities relative to US stocks continue to be influenced by China’s economic fluctuations. The deterioration in various measures of China’s credit impulse remains consistent with further near-term underperformance of European equities (Chart 6, left panel). Moreover, if Omicron has a significant impact on consumer behavior (via personal choices or government measures), it will once again hurt spending on services and boost the appeal of growth stocks, which Europe underrepresents. These headwinds will not be long lasting. Europe has an opportunity to outperform next year if global yields rise. However, European equity markets continue to suffer from a potent long-term disadvantage relative to those of the US. American benchmarks are composed of higher quality stocks than European ones. As a result of greater market concentration, more innovative applications of research, and the development of greater moats, US stocks generate wider profits margins than European companies and have a higher utilization of their asset base. Consequently, US shares sport significantly higher RoEs and earnings growth than European large-cap names (Chart 6, right panel). Historically, the quality factor has been one of the top performers and is an important contributor to the current strength of growth equities. Thus, even if Europe’s day in the sun arrives before the middle of 2022, it will again be a temporary phenomenon. Chart 6Europe’s Quality Deficit
Europe's Quality Deficit I
Europe's Quality Deficit I
Chart 6Europe’s Quality Deficit
Europe's Quality Deficit II
Europe's Quality Deficit II
Chart 7: Will the Cyclicals Outperformance Resume? For most of 2021, European cyclicals equities have not performed as well against defensive stocks as many investors hoped. In fact, the relative performance of cyclicals is broadly flat since March. Going forward, cyclicals will resume their uptrend against defensive equities and even break out of their range of the past twenty years. From a technical perspective, cyclicals have expunged many of their excesses. By the spring, European cyclicals had become prohibitively expensive compared to their defensive counterparts (Chart 7, left panel). However, their overvaluation has now passed and medium-term momentum measures are not overbought anymore, which creates a much better entry point for cyclical equities. From a fundamental perspective, cyclicals will also enjoy rising yields after being hamstrung by Treasury yields that have moved sideways for more than nine months (Chart 7, right panel). Moreover, the eventual stabilization of the Chinese economy will create an additional tailwind for these stocks. Chart 7Will The Cyclicals Outperformance Resume?
Will the Cyclicals Outperformance Resume? I
Will the Cyclicals Outperformance Resume? I
Chart 7Will The Cyclicals Outperformance Resume?
Will the Cyclicals Outperformance Resume? II
Will the Cyclicals Outperformance Resume? II
The biggest risk to cyclical stocks lies in inflation expectations. Ten-year CPI swaps have stopped increasing despite rising inflation. As the yield curve flattens and long-term segments of the OIS curve invert, markets register their fears that the Fed might tighten too much over the next two years. In other words, markets continue to agonize over the effect of a very low perceived terminal rate. These worries may cause the CPI swaps to decline significantly as the Fed hikes rates next year, creating a headwind for cyclicals. Chart 8: Favor Financials Financials in general and banks in particular have outperformed the European benchmark this year. This trend will persist in 2020. More than the positive impact of higher yields on the profitability of financials justifies this view. One of the key drivers supporting our optimism toward this sector is the continued improvement in the balance-sheet health of the European banking sector (Chart 8, left panel). Capital adequacy ratios remain in an uptrend and NPLs continue to be well-behaved. Meanwhile, both the governments’ liquidity support during the pandemic and the nonfinancial sector’s cash buildup over the past 18 months limit the risk that a brisk rise in insolvencies would threaten the viability of the banking system. European bank lending is also likely to remain superior to that of the post-GFC years. Consumer confidence is still sturdy, despite the recent increase in COVID cases and the tax hike created by rapidly climbing energy prices (Chart 8, right panel). Companies also benefit from an environment of low real rates and limited fiscal austerity. Unsurprisingly, capex intentions are elevated, which should support credit demand from businesses going forward. Chart 8Favor Financials
Favor Financials I
Favor Financials I
Chart 8Favor Financials
Favor Financials II
Favor Financials II
These factors imply that the current large discount embedded in European financials’ valuations remains excessive (even if a smaller discount is still warranted). As long as peripheral spreads do not blow out durably, financials will have scope to outperform further. Banks should also beat insurance companies. Chart 9: Small-Caps Are Nearly There Despite a sideways move followed by a 4% dip, the performance of European small-cap stocks remains in a pronounced uptrend relative to large-cap equities. The recent bout of underperformance is likely to end soon, unless a recession is around the corner. Small-cap stocks are becoming oversold (Chart 9, left panel) and will benefit from their pronounced procyclicality, especially if the recent improvement in global economic surprises continues next year. Moreover, above-trend European growth as well as an ECB that will maintain accommodative monetary conditions will combine to prevent a significant widening in European high-yield spreads, particularly once natural gas prices are turned down after the winter. This process will also help small-cap equities. The biggest risk for the European small-caps’ relative performance is the currency market. The relative performance of small-cap names is still closely correlated to the euro (Chart 9, right panel). As a result, if EUR/USD were to falter in the coming weeks, the underperformance of small-cap stocks could deepen. At the very least, small-cap stocks would languish before resuming their uptrend later in the year. Chart 9Small-Caps Are Nearly There
Small-Caps Are Nearly There I
Small-Caps Are Nearly There I
Chart 9Small-Caps Are Nearly There
Small-Caps Are Nearly There II
Small-Caps Are Nearly There II
Chart 10: A Risk to Macron’s Second Term The emergence of the new populist candidate Éric Zemmour has galvanized the media in recent weeks. However, he is very unlikely to pose a credible threat to French President Emmanuel Macron, unlike center-right candidate Valerie Pécresse, who just won the Les Républicains (LR) primary. In a Special Report published conjointly with our geopolitical strategists last summer, we identified the emergence of a single candidate able to unite the center-right as one of the biggest risks to Macron. As Chart 10 shows, Pécresse has made a comeback in the polls and is now expected to face Macron in the second round. According to an Elabe poll conducted after her victory in the primary, if the second round of the elections were held now, she would beat Macron.
Chart 10
Chart 10
Will Pécresse manage to keep her momentum going until April 2022? First, she has to ensure the center-right remains united behind her. Up until the primaries, the center-right was divided. While she won the primary by a wide margin, her main opponent Éric Ciotti won the first round (25.6%), and Michel Barnier as well as Xavier Bertrand came close behind, with 23.9% and 22.7% respectively. Second, Pécresse must work hard to prevent voters from succumbing to the siren songs of Zemmour and Marine Le Pen, or to lean toward former Prime Minister Phillippe Edouard, a declared supporter of Macron. Investors should ignore Le Pen and Eric Zemmour. The real threat to Macron lies in Valerie Pécresse’s ability to keep the center-right united under her banner. Considering that the center-left does not represent an option and that the far-right is entangled in a tug-of-war, there is a high probability that Pécresse will reach the second round. Footnotes Tactical Recommendations
Europe In Charts
Europe In Charts
Cyclical Recommendations
Europe In Charts
Europe In Charts
Structural Recommendations
Europe In Charts
Europe In Charts
Closed Trades Currency Performance Fixed Income Performance Equity Performance
Feature Over the past months, we have seen a potent bout of volatility in developed government bond markets, as investors have tried to assess the “lift-off” dates for central bank hiking cycles and the speed and cumulative degree of eventual monetary tightening. Record inflation prints have also created a communication challenge for central banks, with investors demanding more certainty in relation to the preconditions that need to be met in the data for central banks to raise rates. Adding to the uncertainty are the new frameworks adopted by the US Federal Reserve and the European Central Bank (ECB) that allow for overshoots of the 2% inflation target to make up for historical undershoots. However, it remains to be seen how committed policymakers will be to these new frameworks. Even the historically dovish European Central Bank has been forced to talk down market pricing, with overnight swap markets eyeing a rate hike as early as next year. Across the English Channel, the Bank Of England, which initially baffled investors by failing to deliver a rate hike during its November meeting, now appears to have embarked on a new path, with Governor Andrew Bailey calling into question the very efficacy of forward guidance itself and possibly returning to making decisions on a meeting-by-meeting basis. Chief Economist Huw Pill has recently talked about “training” people to “think the right way about monetary policy,” but it remains to be seen if market participants will be receptive students. In any case, it is clear that the uniformly dovish period of extraordinary monetary accommodation induced by the pandemic is at an end. To navigate the uncertainty as central banks shift gears toward tighter policy on the margin, we are introducing revised versions of our BCA European Central Bank monitors this week. These indicators use economic and financial market data to gauge whether the current stance of monetary policy lines up with current conditions. Our revisions focus on making the monitors more dynamic and responsive to shifts in central bank reaction functions. Overall, the message from our new monitors is clear—rebounding growth and inflation data mean that all our indicators are moving in a direction more consistent with tighter policy even after Friday's market action (Chart 1). In the following sections of this report, we cover in greater detail the methodological changes to our indicators, followed by region-level assessments of the five new monitors introduced in this report for the Euro Area, UK, Sweden, Norway, and Switzerland. Chart 1The New BCA European Central Bank Monitors
The New BCA European Central Bank Monitors
The New BCA European Central Bank Monitors
What’s New? We have made three major improvements to our central bank monitors: First, the sub-components—economic growth, inflation, and financial conditions—are no longer calculated as a simple average of their constituent data series. Instead, each data series is now weighted according to the degree that it moves in conjunction with other data series over a 60-month rolling window. In other words, data series that are highly correlated with other series receive a greater weight. There are two benefits to this approach: (i) it makes the monitors more dynamic and (ii) it adjusts for changes in correlations over time. Second, the weights of each of the three sub-components in the overall monitor are now determined so as to minimize the sum of squared residuals (SSR) of a regression of the 12-month change in policy rate (the dependent variable) with the readings from our monitors (the independent variable). We have imposed two constraints: each sub-component must have a minimum weight of 15% and may not weigh more than 70%. More importantly, the weights are now re-calculated every 60 months. In doing so, there is no assumption that central bankers’ reaction function is constant over time, and it avoids look-ahead bias. There is also the natural question of how to optimize the weights of our sub-components when policy rates remain flat for extended periods at, or near, the Zero Lower Bound (ZLB). While we did consider calculating a different set of weights targeting the annual change in assets held by the Central Bank during ZLB periods, we eschewed this approach for two reasons: these periods are neither frequent nor sufficiently prolonged to provide an appropriate sample. As a result, the weights currently applied to the monitors are based on the 60 months preceding policy rates reaching the Zero Lower Bound. Table 1 shows the weights currently being used for each monitor. Table 1European Central Bank Monitors' Weights
A Tour Of The New BCA European Central Bank Monitors
A Tour Of The New BCA European Central Bank Monitors
Third, all of the data series included in our monitors are now standardized over 60-month rolling time horizons. Like the changes made to the weight calculation above, it ensures the monitor does not rely too heavily on either past or future data. Although central banks’ mandates do not change often—if at all—their reaction functions do. Take inflation, for instance. Our monitors should not factor in the level of price changes experienced in the 1970s as a benchmark to determine whether a central bank should be more or less accommodative based on what inflation is today. We also took this opportunity to make changes to the data series included in the monitors, with a focus on including higher-frequency series to improve the timeliness of the indicator. All in all, clients should note that these improvements do not change the interpretation of the monitors. A rising trend is still consistent with fundamentals that would have caused central banks to tighten in the past and vice versa. ECB Monitor: Stay Put Chart 2Euro Area: ECB Monitor
Euro Area: ECB Monitor
Euro Area: ECB Monitor
Our European Central Bank (ECB) Monitor is currently in positive territory, suggesting that the ECB should be removing accommodation (Chart 2). However, the ECB did not sound any more hawkish at the close of its last meeting held at the beginning of the month. The latest surge of COVID-19 cases in Europe and subsequent governments’ responses will weigh on economic growth and give reason to the ECB not to rush into a new tightening cycle. It will also be interesting to see how the renewed energy crisis affects President Christine Lagarde's stance on the transitory aspects of inflation. The components of our ECB Monitor are consistent with these two forces (Chart 2, panel 2). Strong economic data prints have been losing steam this year, which weighed on the economic growth component. Nonetheless, this indicator now tries to move back up. Meanwhile, the inflation component is surging, driven by both the rapid acceleration in European realized inflation and CPI swaps. We have argued that energy, taxes, and base effects account for the bulk of the price increases in the Euro Area, and that, as such, the ECB was correct in looking past them. Market participants do not agree with the ECB. The Euro Overnight Index Average (EONIA) curve is now pricing 15bps of tightening by the end of 2022 (Chart 2, bottom panel), which is unlikely to happen considering the ECB’s dovish communication and its adoption of AIT. In this context, we lean against the EONIA pricing and expect the ECB to increase rates in 2024, at the earliest. We also continue to recommend an overweight stance on European government bonds within global fixed income portfolios. BoE Monitor: Tightening On The Way Chart 3UK: BoE Monitor
UK: BoE Monitor
UK: BoE Monitor
Our Bank of England (BoE) monitor has continued its sharp rebound into positive territory since its trough in 2020 (Chart 3). While the BoE’s communication has been questionable, the Bank has done nothing to reverse its recent hawkish turn. This makes sense given economic data that is showing signs of an overheating economy. Consumer price inflation came in at 4.2% year-over-year in October, a ten-year high. And as we discussed in a recent BCA Research Global Fixed Income Strategy report, there are signs that rising inflation is having a dampening effect on consumer confidence, imperiling growth in 2022. Turning to the individual components of our BoE monitor, we see broad-based pressure to tighten policy, with all three components in solidly positive territory and rising quickly (Chart 3, middle panel). Inflationary pressures are being driven not only by strong CPI prints, but also by rising input prices and inflation expectations that are becoming unmoored from the BoE’s target. Meanwhile, capacity utilization scores from the BoE’s Agents’ Summary are at the highest level since 2007, creating scope for further inflation down the road. Growth is ebullient as well, with both manufacturing and services PMIs significantly above the 50 advance/decline line. Rising house prices and consumer lending are creating stability risks captured in the financial subcomponent of the monitor. Market anticipations for tightening over the next year have continued to increase, notwithstanding the muddled messaging from the BoE, with 111bps of tightening expected over the coming year (Chart 3, bottom panel). With the BoE set to be one of the more hawkish developed market central banks in 2022, we are comfortable maintaining an underweight stance on Gilts within global government bond portfolios. Riksbank Monitor: On Hold, But Not For Long Chart 4Sweden: Riksbank Monitor
Sweden: Riksbank Monitor
Sweden: Riksbank Monitor
Our Riksbank Monitor is now close to neutral, after reaching all-time highs earlier this year (Chart 4). For now, the Riksbank seems content to continue to hold the repo rate at 0%, while expanding the size of its balance sheet. Taking a closer look at the breakdown in the Riksbank Monitor, we can see that the earlier surge was mostly driven by the financial conditions component, which is still solidly in positive territory (Chart 4, panel 2). The inflation component confirms that inflation is still not a concern for the Riksbank. In fact, core CPI stands at 1.82% annually, below the 2% target and far from what other developed economies are currently experiencing. We expect the ongoing robust economic recovery to continue lifting the economic growth component, which, at some point in the future, should place more pressure on the Riksbank to remove accommodation. Market participants have only started pricing in some rate hikes from the Riksbank recently (Chart 4, bottom panel). Still, we view this 35bps of expected tightening as too modest relative to the actual pressure on the Riksbank to tighten policy. The positive outlook for the Swedish economy,1 as well as rising house prices and household indebtedness, will force the Riksbank to tighten policy before the ECB—all of which may happen sooner if inflation starts to accelerate. Consequently, Swedish sovereign debt does not appear as an attractive underweight candidate in global government bond portfolios. Norges Bank Monitor: More Hikes To Come Chart 5Norway: Norges Bank Monitor
Norway: Norges Bank Monitor
Norway: Norges Bank Monitor
Our Norges Bank Monitor is well into positive territory and continues to increase, signaling pressure for tighter policy (Chart 5). In September, the Norges Bank became the first of the G10 central banks to deliver a rate hike, which it paired with forward guidance suggesting hikes at its coming December, January, and March meetings. We believe such an outcome is supported by the data, which show pressure to tighten on a growth and inflation basis (Chart 5, middle panel). The growth subcomponent of our indicator has been driven by rebounding business and consumer sentiment. Meanwhile, inflationary pressures have been driven by rising capacity utilization and producer prices, which grew at an unbelievable 60.8% year-over-year in October, the highest annual growth rate that has ever been recorded for the series. The reading from the financial subcomponent is more neutral, hovering above the zero level. This slight decline this year may largely be explained by slowing house price growth and falling debt service ratios. However, the NOK remains undervalued on a PPP-basis, which, at the margin, creates pressure on the Norges Bank to tighten. Overnight index swap curves are currently discounting 136bps of tightening in Norway over the coming year. We believe this is a realistic outcome, given the Norges Bank’s uniquely hawkish reaction function and pressures to tighten, which are not likely to dissipate any time soon. We remain bearish on Norwegian government debt. SNB Monitor: Still About The Swiss Franc Chart 6Switzerland: SNB Monitor
Switzerland: SNB Monitor
Switzerland: SNB Monitor
Our Swiss National Bank (SNB) Monitor has decreased somewhat after peaking earlier this year, but remains solidly in positive territory, which suggests that the SNB should remove accommodation (Chart 6). This is unlikely to happen anytime soon. At the Central Bank leadership’s annual meeting with the Swiss government last month, the SNB emphasized the need to maintain accommodative monetary policy. In so doing, it kept policy rate and interest on sight deposits at the SNB at −0.75%, while remaining willing to intervene in the foreign exchange market as necessary, in order to counter upward pressure on the Swiss franc. After all, the currency remains the main determinant of Swiss monetary conditions. Therefore, the SNB will continue to try to cap the upside in the CHF vis-à-vis the EUR, because it considers the Swiss franc "highly valued". Meanwhile, inflation does not seem to be an imminent concern for the SNB. Headline inflation and core inflation stand at 1.25% and 0.58%, respectively. All three components of our SNB Monitor appear to send the same message at the moment (Chart 6, panel 2). Markets largely seem to believe the SNB’s unwillingness to tighten monetary policy (Chart 6, bottom panel). Only 16 bps of tightening are priced over the next 12 months, and 54bps over the next 24 months. We maintain our neutral stance on Swiss bonds within global portfolios, given low liquidity. Jeremie Peloso, Associate Editor JeremieP@bcaresearch.com Shakti Sharma Senior Analyst ShaktiS@bcaresearch.com Footnotes 1 Please see BCA Research European Income Strategy Report, "Take A Chance On Sweden", dated May 3, 2021, available at eis.bcareseach.com.
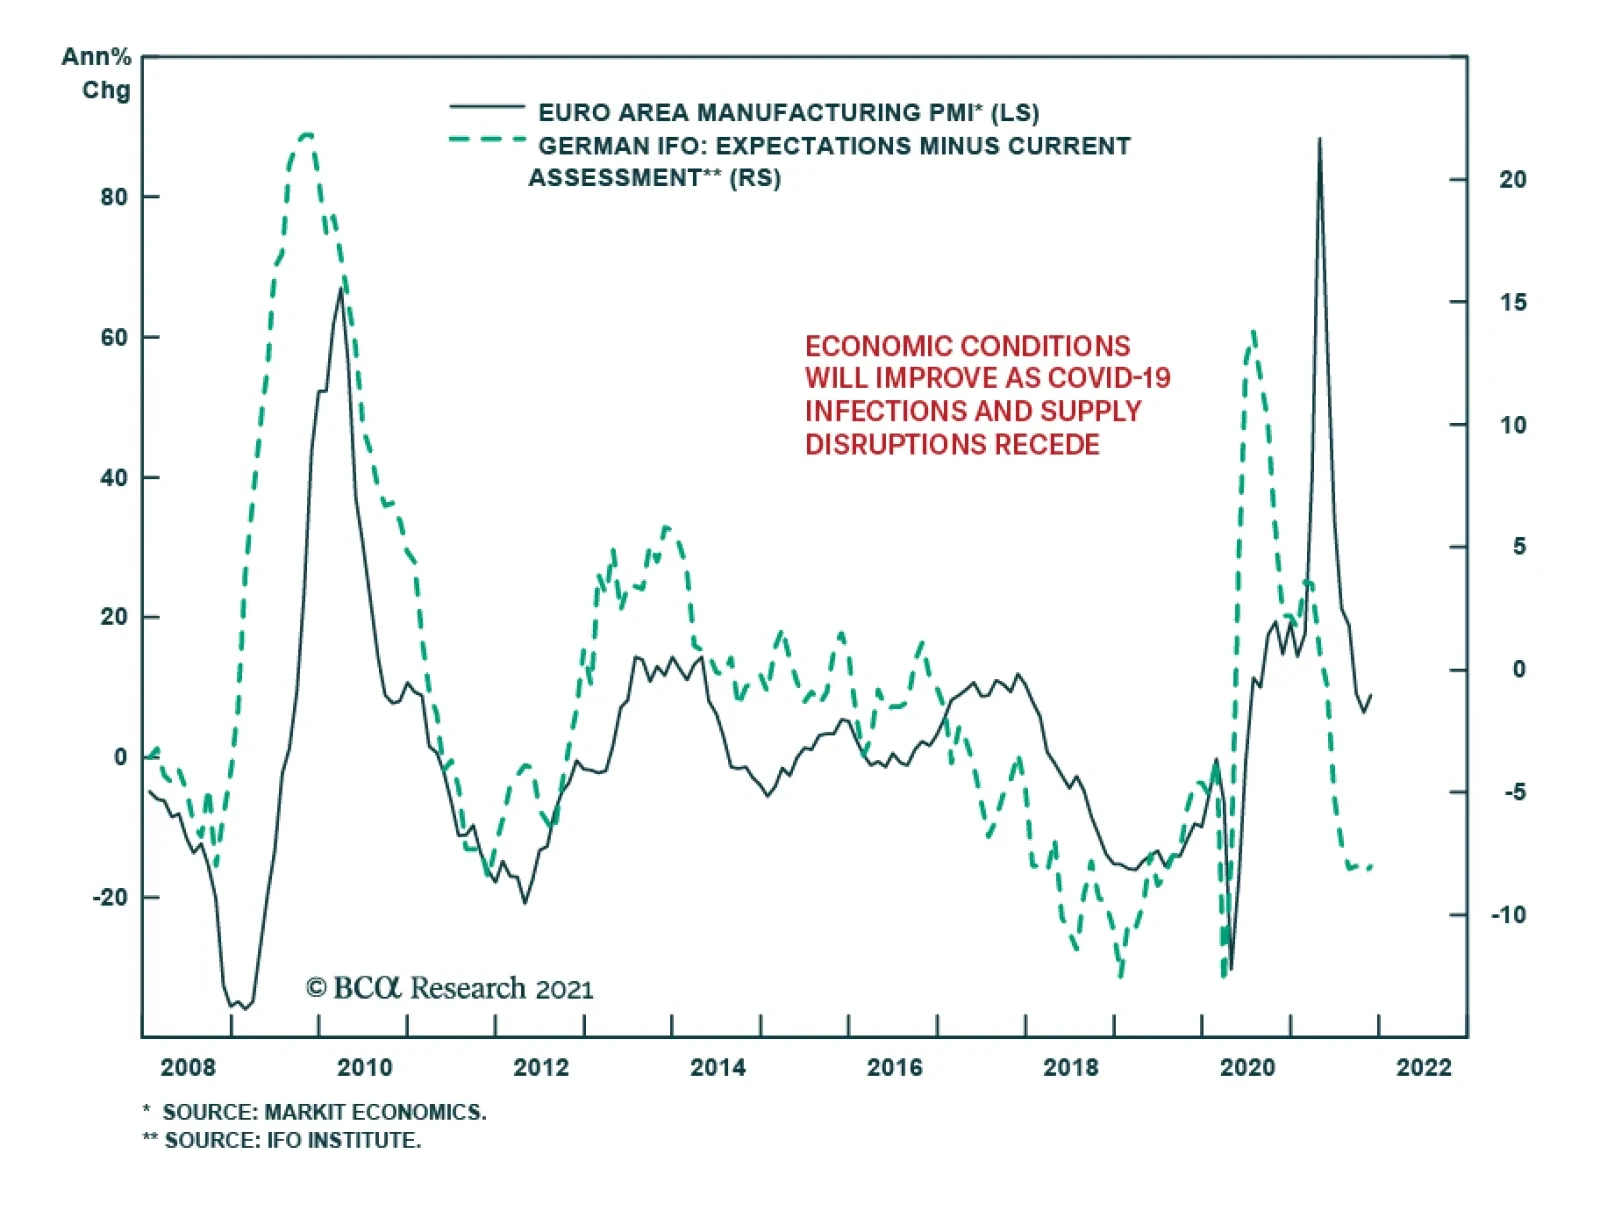
Both the current and forward-looking components of the ifo Business Climate Index deteriorated in November, sending a negative signal about German sentiment. The headline series lost 1.2 points and fell to a 9-month low of 96.5 – slightly below expectations.…
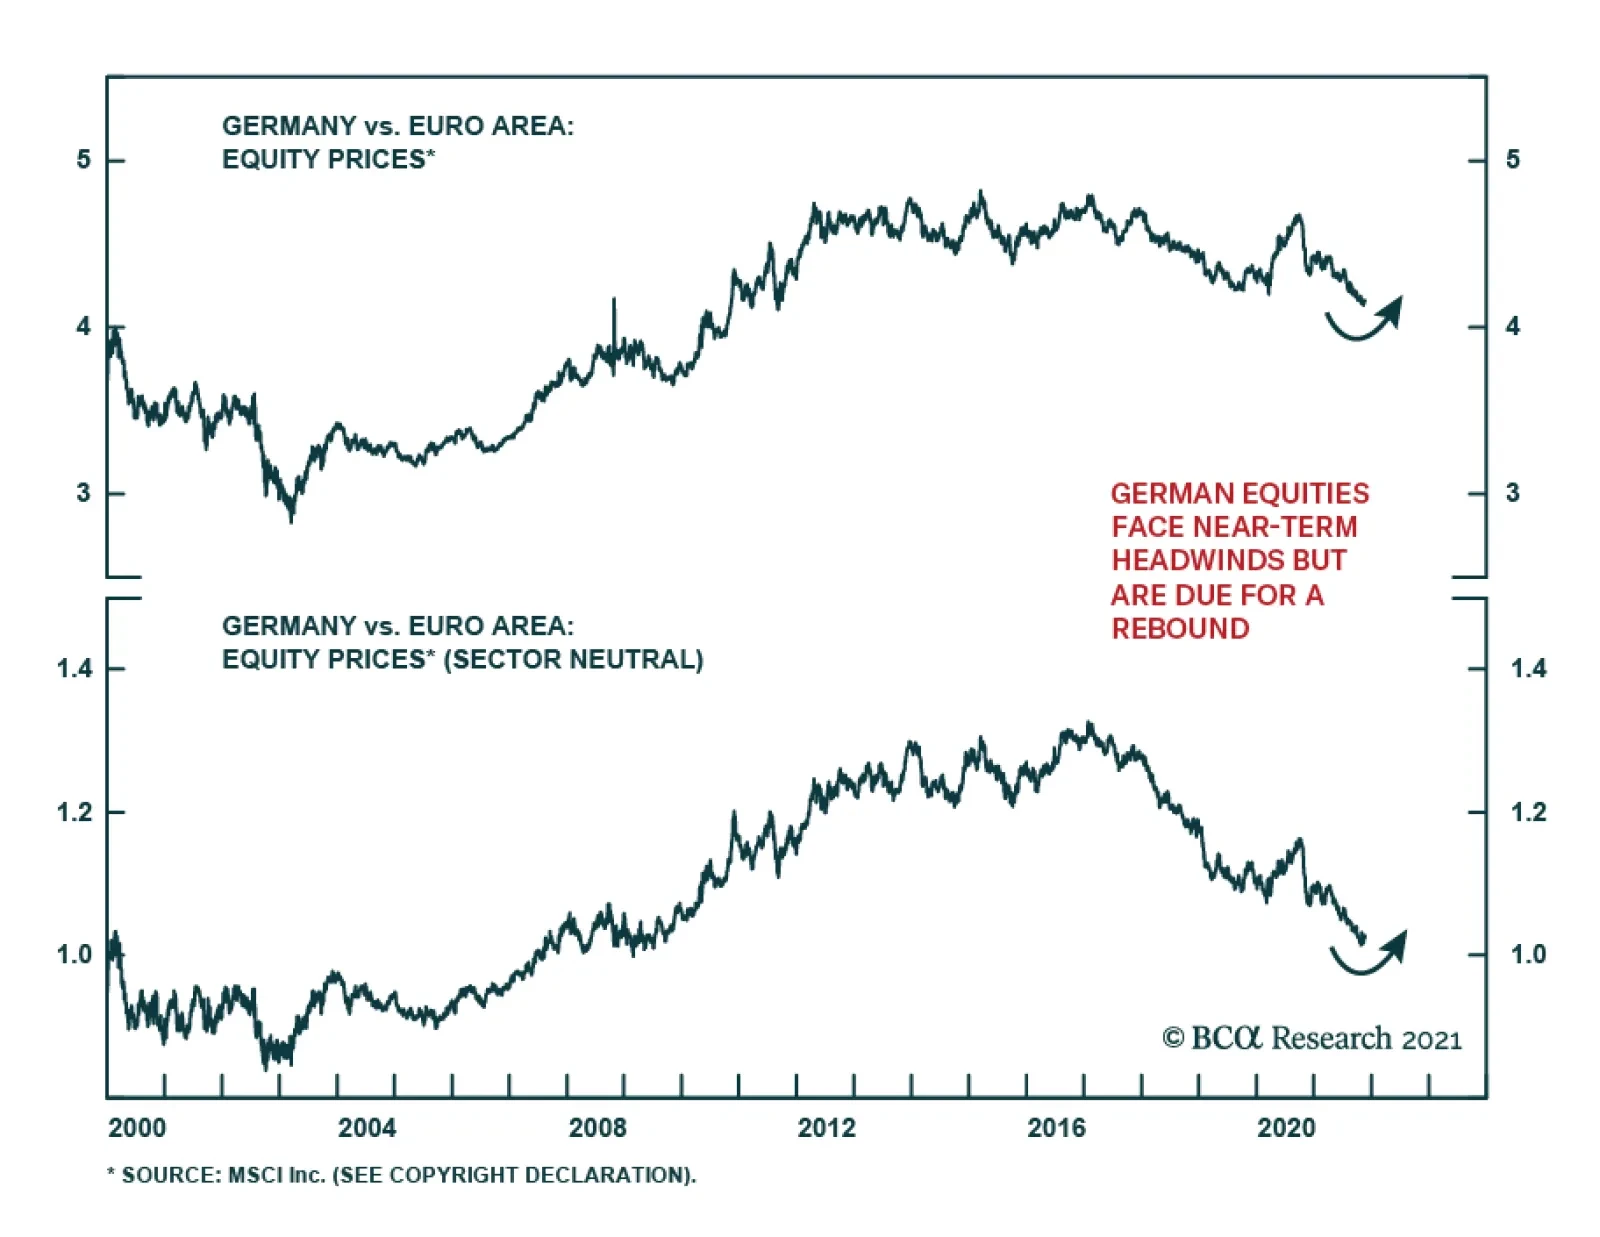
Germany’s Social Democrats (SPD), Greens, and Free Democrats (FDP) formed a new government with the SPD’s Olaf Scholz replacing Angela Merkel as chancellor. The FDP – whose leader, Christian Lindner, will become the new finance minister – takes a harder line…