Euro Area

Highlights The US government issued its first-ever water-shortage declaration for the Colorado River basin in August, due to historically low water levels at the major reservoirs fed by the river (Chart of the Week). The drought producing the water shortage was connected to climate change by US officials.1 Globally, climate-change remediation efforts – e.g., carbon taxes – likely will create exogenous shocks similar to the oil-price shock of the 1970s. Remedial efforts will compete with redressing chronic underfunding of infrastructure. The US water supply infrastructure, for example, faces an investment shortfall of ~ $3.3 trillion over the next 20 years to replace aging plants and equipment, based on an analysis by the American Society of Civil Engineers (ASCE). This will translate to a $6,000 per-capita cost by 2039 if the current funding gap persists. Fluctuating weather and the increasing prevalence of droughts and floods will increase volatility in markets such as agriculture which rely on stable climate and precipitation patterns.We are getting long the FIW ETF at tonight's close. The ETF tracks the performance of equities in the ISE Clean Edge Water Index, which covers firms providing potable water and wastewater treatment technologies and services. This is a strategic recommendation. Feature A decades-long drought in the US Southwest linked by US officials to climate change will result in further water rationing in the region. The drought has reduced total Colorado River system water-storage levels to 40% of capacity – vs. 49% at the same time last year. It has drawn attention to the impact of climate change on daily life, and the acute need for remediation efforts. The US Southwest is a desert. Droughts and low water availability are facts of life in the region. The current drought began in 2012, and is forcing federal, state, and local governments to take unprecedented conservation measures. The first-ever water-shortage declaration by the US Bureau of Reclamation sets in motion remedial measures that will reduce water availability in the Lower Colorado basin starting in October (Map 1). Chart 1Drought Hits Colorado River Especially Hard
Drought Hits Colorado River Especially Hard
Drought Hits Colorado River Especially Hard
Map 1Colorado River Basin
Investing In Water Supply
Investing In Water Supply
The two largest reservoirs in the US – Lake Powell and Lake Meade, part of the massive engineering projects along the Colorado – began in the 1930s and now supply water to 40mm people in the US Southwest. Half of those people get their water from Lake Powell. Emergency rationing began in August, primarily affecting Arizona, but will be extended to the region later in the year. Lake Powell is used to hold run-off from the upper basin of the Colorado River from Colorado, New Mexico, Utah and Wyoming. Water from Powell is sent south to supply the lower-basin states of California, Arizona, and Nevada. Reduced snowpack due to weather shifts caused by climate change has reduced water levels in Powell, while falling soil-moisture levels and higher evaporation rates, contribute to the acceleration of droughts and their persistence down-river. Chart 2Southwests Exceptionally Hard Drought
Southwests Exceptionally Hard Drought
Southwests Exceptionally Hard Drought
Steadily increasing demand for water from agriculture, energy production and human activity brought on by population growth and holiday-makers have made the current drought exceptional (Chart 2). Most of the Southwest has been "abnormally dry or even drier" during 2002-05 and from 2012-20, according to the US EPA. According to data from the National Oceanic and Atmospheric Administration, most of the US Southwest was also warmer than the 1981 – 2010 average temperature during July (Map 2). The Colorado River Compact of 1922 governing the water-sharing rights of the river expires in 2026. Negotiations on the new treaties already have begun, as the seven states in the Colorado basin sort out their rights alongside huge agricultural interest, native American tribes, Mexico, and fast-growing urban centers like Las Vegas. Map 2Most Of The US Southwest Is Warmer Than Average
Investing In Water Supply
Investing In Water Supply
Global Water Emergency States around the globe are dealing with water crises as a result of climate change. "From Yemen to India, and parts of Central America to the African Sahel, about a quarter of the world's people face extreme water shortages that are fueling conflict, social unrest and migration," according to the World Economic Forum. Droughts, and more generally, changing weather patterns will make agricultural markets more volatile. Food production shortages due to unpredictable weather are compounding lingering pandemic related supply chain disruptions, leading to higher food prices (Chart 3). This could also fuel social unrest and political uncertainty. Floods in China’s Henan province - a key agriculture and pork region - inundated farms. Drought and extreme heat in North America are destroying crops in parts of Canada and the US. While flooding in July damaged Europe’s crops, the continent’s main medium-term risk, will be water scarcity.2 Droughts and extreme weather in Brazil have deep implications for agricultural markets, given the variety and quantity of products it exports. Water scarcity and an unusual succession of polar air masses caused coffee prices to rise earlier this year (Chart 4). The country is suffering from what national government agencies consider the worst drought in nearly a century. According to data from the NASA Earth Observatory, many of the agricultural states in Brazil saw more water evaporate from the ground and plants’ leaves than during normal conditions (Map 3). Chart 3The Pandemic and Changing Weather Patterns Will Keep Food Prices High
The Pandemic and Changing Weather Patterns Will Keep Food Prices High
The Pandemic and Changing Weather Patterns Will Keep Food Prices High
Chart 4Unpredictable Weather Will Increase Volatility In Markets For Agricultural Commodities
Unpredictable Weather Will Increase Volatility In Markets For Agricultural Commodities
Unpredictable Weather Will Increase Volatility In Markets For Agricultural Commodities
Map 3Brazil Is Suffering From Its Worst Drought In Nearly A Century
Investing In Water Supply
Investing In Water Supply
Agriculture itself could be part of a longer-term and irreversible problem – i.e. desertification. Irrigation required for modern day farming drains aquifers and leads to soil erosion. According to the EU, nearly a quarter of Spain’s aquifers are exploited, with agricultural states, such as Andalusia consuming 80% of the state’s total water. Irrigation intensive farming, the possibility of higher global temperatures and the increased prevalence of droughts and forest fires are conducive to soil infertility and subsequent desertification. This is a global phenomenon, with the crisis graver still in north Africa, Mozambique and Palestinian regions. Changing weather patterns could also impact the production of non-agricultural goods and services. One such instance is semiconductors, which are used in machines and devices spanning cars to mobile phones. Taiwan, home to the Taiwan Semiconductor Manufacturing Company – the world’s largest contract chipmaker - suffered from a severe drought earlier this year (Chart 5). While the drought did not seriously disrupt chipmaking, in an already tight market, the event did bring the issue of the impact of water shortages on semiconductor manufacturing to the fore. According to Sustainalytics, a typical chipmaking plant uses 2 to 4 million gallons of water per day to clean semiconductors. While wet weather has returned to Taiwan, relying on rainfall and typhoons to satisfy the chipmaking sector’s water needs going forward could lead to volatility in these markets. Chart 5Taiwan Faced Its Worst Drought In History Earlier This Year
Investing In Water Supply
Investing In Water Supply
Climate Change As A Macro Factor The scale of remediating existing environmental damage to the planet and the cost of investing in the technology required to sustain development and growth will be daunting. Unfortunately, there is not a great deal of research looking into how much of a cost households, firms and governments will incur on these fronts. Estimates of the actual price of CO2 – the policy variable most governments and policymakers focus on – range from as little as $1.30/ton to as much as $13/ton, according to the Peterson Institute for International Economics.3 PIIE's Jean Pisani-Ferry estimates the true cost is around $10/ton presently, after accounting for a lack of full reporting on costs and subsidies that reduce carbon costs. The cost of carbon likely will have to increase by an order of magnitude – to $130/ton or more over the next decade – to incentivize the necessary investment in technology required to deal with climate change and to sufficiently induce, via prices, behavioral adaptations by consumers at all levels. The PIIE notes, "… the accelerated pace of climate change and the magnitude of the effort involved in decarbonizing the economy, while at the same time investing in adaptation, the transition to net zero is likely to involve, over a 30-year period, major shifts in growth patterns." These are early days for assessing the costs and global macro effects of decarbonization. However, PIIE notes, these costs can be expected to "include a significant negative supply shock, an investment surge sizable enough to affect the global equilibrium interest rate, large adverse consumer welfare effects, distributional shifts, and substantial pressure on public finances." Much of the investment required to address climate change will be concentrated on commodity markets. Underlying structural issues, such as lack of investment in expanding supplies of metals and hydrocarbons required during the transition to net-zero CO2 emissions, will impart an upward bias to base metals, oil and natural gas prices over the next decade. We remain bullish industrial commodities broadly, as a result. Investment Implications Massive investment in infrastructure will be needed to address emerging water crises around the world. The American Society of Civil Engineers (ASCE) projects an investment shortfall of ~ $3.3 trillion over the next 20 years to replace aging water infrastructure in the US alone. This will translate to a $6,000 per-capita cost by 2039 if the current funding gap persists.4 At tonight's close we will be getting long the FIW ETF, which is focused on US-based firms providing potable water and wastewater treatment services. This ETF provides direct investment exposure to water remediation efforts and needed infrastructure modernization in the US. We also remain long commodity index exposure – the S&P GSCI and the COMT ETF – as a way to retain exposure to the higher commodity-price volatility that climate change will create in grain and food markets. This volatility will keep the balance of price risks to the upside. Robert P. Ryan Chief Commodity & Energy Strategist rryan@bcaresearch.com Ashwin Shyam Research Associate Commodity & Energy Strategy ashwin.shyam@bcaresearch.com Commodities Round-Up Energy: Bullish Hurricane Ida shut in ~ 96% of total US Gulf of Mexico (GoM) oil production. Colonial Pipeline, a major refined product artery for the US South and East coast closed a few of its lines due to the hurricane but has restarted operations since then. Since the share of US crude oil from this region has fallen, WTI and RBOB gasoline prices have only marginally increased, despite virtually zero crude oil production from the GoM (Chart 6). Prices are, however, likely to remain volatile, as energy producers in the region check for damage to infrastructure. Power outages and a pause in refining activity in the region will also feed price volatility over the coming weeks. Despite raising the 2022 demand forecast and pressure from the US, OPEC 2.0 stuck to its 400k b/d per month production hike in its meeting on Wednesday. Base Metals: Bullish A bill to increase the amount of royalties payable by copper miners in Chile was passed in the senate mining committee on Tuesday. As per the bill, taxes will be commensurate with the value of the red metal. If the bill is passed in its current format, it will disincentivize further private mining investments in the nation, warned Diego Hernandez, President of the National Society of Mining (SONAMI). Amid a prolonged drought in Chile during July, the government has outlined a plan for miners to cut water consumption from natural sources by 2050. Increased union bargaining power - due to higher copper prices -, a bill that will increase mining royalties, and environmental regulation, are putting pressure on miners in the world’s largest copper producing nation. Precious Metals: Bullish Jay Powell’s dovish remarks at the Jackson Hole Symposium were bullish for gold prices. The chairman of the US Central Bank stated the possibility of tapering asset purchases before the end of 2021 but did not provide a timeline. Powell reiterated the absence of a mechanical relationship between tapering and an interest rate hike. Raising interest rates is contingent on factors, such as the prevalence of COVID, inflation and employment levels in the US. The fact that the US economy is not close to reaching the maximum employment level, according to Powell, could keep interest rates lower for longer, supporting gold prices (Chart 7). Ags/Softs: Neutral The USDA crop Progress Report for the week ending August 29th reported 60% of the corn crop was good to excellent quality, marginally down by 2% vs comparable dates in 2020. Soybean crop quality on the other hand was down 11% from a year ago and was recorded at 56%. Chart 6
Investing In Water Supply
Investing In Water Supply
Chart 7
Weaker Real Rates Bullish For Gold
Weaker Real Rates Bullish For Gold
Footnotes 1 Please see Reclamation announces 2022 operating conditions for Lake Powell and Lake Mead; Historic Drought Impacting Entire Colorado River Basin. Released by the US Bureau of Reclamation on August 16, 2021. 2 Please refer to Water stress is the main medium-term climate risk for Europe’s biggest economies, S&P Global, published on August 13, 2021. 3 Please see 21-20 Climate Policy is Macroeconomic Policy, and the Implications Will Be Significant by Jean Pisani-Ferry, which was published in August 2021. 4 Please see The Economic Benefits of Investing in Water Infrastructure, published by the ASCE and The Value of Water Campaign on August 26, 2020. Investment Views and Themes Recommendations Strategic Recommendations Commodity Prices and Plays Reference Table Trades Closed in 2021 Summary of Closed Trades
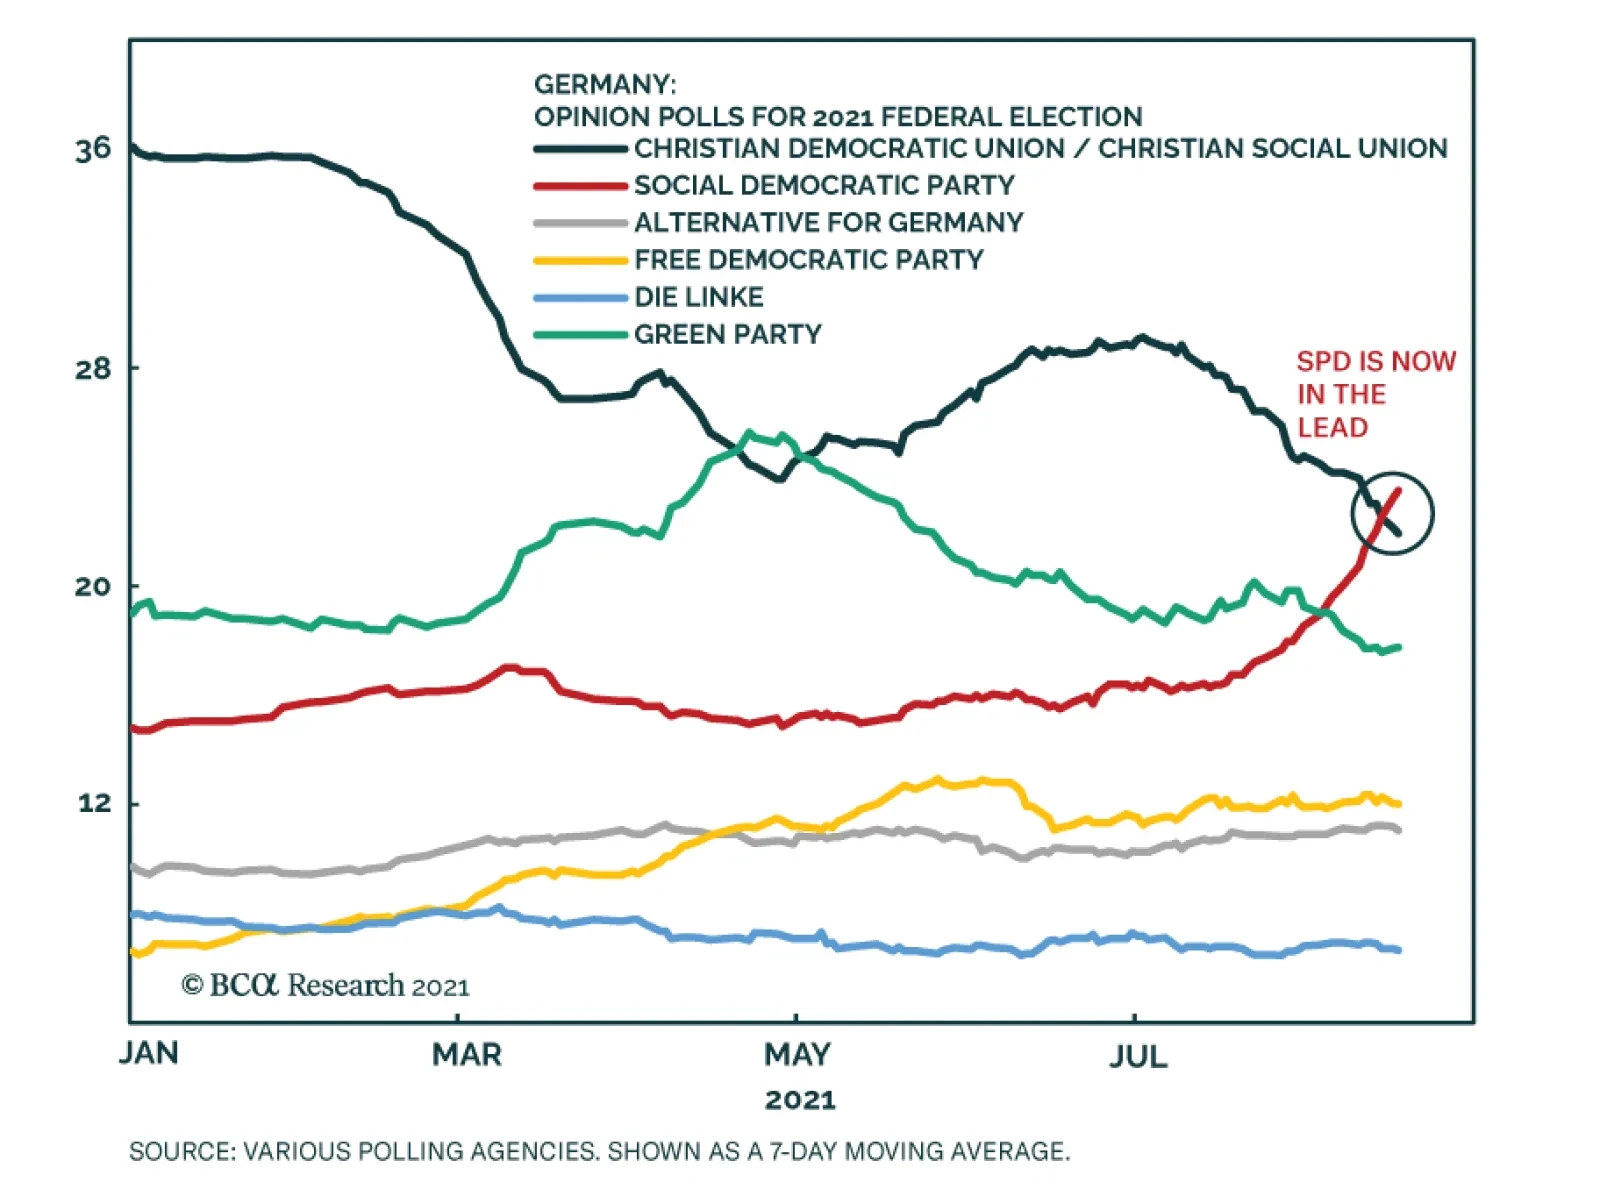
Germany's center-left Social Democrats (SPD) have jumped ahead of Merkel's conservative Christian Democratic Union/Christian Social Union (CDU/CSU) bloc and are now leading in opinion polling for the upcoming September 26 federal election. The Green Party…
Highlights Commodity markets will face growing supply challenges over the next decade as the US and China prepare for war, if only to deter war. Chinese President Xi Jinping's push for greater self-reliance at home and supply chain security abroad is reinforced by the West’s focus on the same interests. The erosion of a single rules-based global trade system increases the odds of economic and even military conflict. The competition for security is precipitating a reforging of global supply chains and a persistent willingness to use punitive measures, which can escalate into boycotts, embargoes, and even blockades (i.e. not only Huawei). The risk of military engagements will rise, particularly along global chokepoints and sea lanes needed to transport vital commodities. Import dependency and supply chain risk are powerful drivers of decarbonization efforts, especially in China. On net, geopolitical trends will keep the balance of commodity-price risks tilted to the upside. Commodity and Energy Strategy remains long commodity index exposure on a strategic basis via the S&P GSCI and the COMT ETF. Note: Even in the short term, a higher geopolitical risk premium is warranted in oil prices due to US-Iran conflict. Feature The Chinese Communist Party (CCP) under President Xi Jinping has embarked on a drive toward autarky, or economic self-sufficiency, that has enormous implications, especially for global commodities. Beijing believes it can maintain central control, harness technology, enhance its manufacturing prowess, and grow at a reasonable rate, all while bulking up its national security. The challenge is to maintain social stability and supply security through the transition. China lives in desperate fear of the chaos that reigned throughout most of the twentieth and twenty-first centuries, which also enabled foreign domination (Chart 1). The problem for the rest of the world is that Chinese nationalism and assertive foreign policy are integral aspects of the new national strategy. They are needed to divert the public from social ills and deter foreign powers that might threaten China’s economy and supply security. Chart 1China Fears Any Risk Of Another ‘Century Of Humiliation’
US-China: War Preparation Pushes Commodity Demand
US-China: War Preparation Pushes Commodity Demand
The chief obstacle for China is the United States, which remains the world leader even though its share of global power and wealth is declining over time. The US is formally adopting a policy of confrontation rather than engagement with China. For example, the Biden administration is co-opting much of the Trump administration's agenda. Infrastructure, industrial policy, trade protectionism, and the “pivot to Asia” are now signature policies of Biden as well as Trump (Table 1).1 Table 1US Strategic Competition Act Highlights Return Of Industrial Policy, Confrontation With China
US-China: War Preparation Pushes Commodity Demand
US-China: War Preparation Pushes Commodity Demand
Many of these policies are explicitly related to the strategic aim of countering China’s rise, which is seen as vitiating the American economy and global leadership. Biden’s Trump-esque policies are a powerful indication of where the US median voter stands and hence of long-term significance (Chart 2). Thus competition between the US and China for global economic, military, and political leadership is entering a new phase. China’s drive for self-reliance threatens the US-led global trade system, while the US’s still-preeminent geopolitical power threatens China’s vital lines of supply. Chart 2US Public’s Fears Are China-Centric
US-China: War Preparation Pushes Commodity Demand
US-China: War Preparation Pushes Commodity Demand
Re-Ordering Global Trade The US’s and China’s demonstrable willingness to use tariffs, non-tariff trade barriers, export controls, and sanctions cannot be expected to abate given that they are locked in great power competition (Chart 3). More than likely, the US and China will independently pursue trade relations with their respective allies and partners, which will replace the mostly ineffective World Trade Organization (WTO) framework. The WTO is the successor to the rules-based and market-oriented system known as the General Agreement on Tariffs and Trade (GATT), which was formed following World War II. The GATT’s founders shared a strong desire to avoid a repeat of the global economic instability brought on by World War I, the Great Crash of 1929, and the retreat into autarky and isolationism that led to WWII. Chart 3US and China Imposing Trade Restrictions
US and China Imposing Trade Restrictions
US and China Imposing Trade Restrictions
This inter-war period saw domestically focused monetary policies and punishing tariffs that spawned ruinous bouts of inflation and deflation. Minimizing tariffs, leveling the playing field in trading markets, and reducing subsidization of state corporate champions were among the GATT's early successes. The WTO, like the GATT before it, has no authority to command a state to change its economy or the way it chooses to organize itself. At its inception the GATT's modus vivendi was directed at establishing a rules-based system free of excessive government intrusion and regulation. If governments agreed to reduce their domestic favoritism, they could all improve their economic efficiency while avoiding a relapse into autarky and the military tensions that go with it.2 The prime mover in the GATT's founding and early evolution – the USA – firmly believed that exclusive trading blocs had created the groundwork for economic collapse and war. These trading blocs had been created by European powers with their respective colonies. During the inter-war years the revival of protectionism killed global trade and exacerbated the Great Depression. After WWII, Washington was willing to use its power as the global hegemon to prevent a similar outcome. Policymakers believed that European and global economic integration would encourage inter-dependency and discourage protectionism and war. The fall of the Soviet Union reinforced this neoliberal Washington Consensus. Countries like India and China adopted market-oriented policies. The WTO was formed along with a range of global trade deals. Ultimately the US and the West cleared the way for China to join the trading bloc, hoping that the transition from communism to capitalism would eventually be coupled with social and even political liberalization. The world took a very different turn as the United States descended into a morass of domestic political divisions and foreign military adventures. China seized the advantage to expand its economy free of interference from the US or West. The West failed to insist that liberal economic reforms keep pace.3 Moreover, when China joined the WTO in 2001, the organization was in a state of "regulatory stalemate," which made it incapable of dealing with the direct challenges presented by China.4 Today President Xi has consolidated control over the Communist Party and directs its key economic, political, and military policymaking bodies. He has deepened party control down to the management level of SOEs – hiring and firing management. SOEs have benefited from Xi’s rule (Chart 4). But now the West is also reasserting the role of the state in the economy and trade, which means that punitive measures can be brought to bear on China’s SOEs. Chart 4State-Owned Enterprises Benefit From Xi Administration
State-Owned Enterprises Benefit From Xi Administration
State-Owned Enterprises Benefit From Xi Administration
What Comes After The WTO? The CCP has shown no interest in coming around to the WTO's founding beliefs of government non-interference in the private sector. For example, it is doubling down on subsidization and party control of SOEs, which compete against firms in other WTO member states. Nor has the party shown any inclination to accept a trade system based on the GATT/WTO founding members' Western understanding of the rule of law. These states represent market-based economies with long histories of case law for settling disputes. Specifically, China’s fourteenth five-year plan and recent policies re-emphasize the need to upgrade the manufacturing sector rather than rebalancing the economy toward household consumption. The latter would reduce imbalances with trade deficit countries like the US but China is wary of the negative social consequences of too rapidly de-industrializing its economy. It wants to retain its strategic and economic advantage in global manufacturing and it fears the social and political consequences of fully adopting consumer culture (Chart 5). Chart 5China’s Economic Plans Re-Emphasize Manufacturing, Not Consumption
US-China: War Preparation Pushes Commodity Demand
US-China: War Preparation Pushes Commodity Demand
The US, EU, and Japan have proposed reform measures for the WTO aimed at addressing “severe excess capacity in key sectors exacerbated by government financed and supported capacity expansion, unfair competitive conditions caused by large market-distorting subsidies and state owned enterprises, forced technology transfer, and local content requirements and preferences.”5 But these measures are unlikely to succeed. China disagrees with the West’s characterization. In 2018-19, during the trade war with the US, Beijing contended that WTO members must “respect members’ development models.” China formally opposes “special and discriminatory disciplines against state-owned enterprises in the name of WTO reform.”6 In bilateral negotiations with the US this year, China’s first demand is that the US not to oppose its development model of “socialism with Chinese characteristics” (Table 2). Table 2China’s Three Diplomatic Demands Of The United States (2021)
US-China: War Preparation Pushes Commodity Demand
US-China: War Preparation Pushes Commodity Demand
Yet it is hard for the US not to oppose this model because it involves Beijing using the state’s control of the economy to strengthen national security strategy, namely by the fusion of civil and military technology. Going forward, the Biden administration will violate the number one demand that Chinese diplomats have made: it will attempt to galvanize the democracies to put pressure on China’s development model. China’s demand itself reflects its violation of the US primary demand that China stop using the state to enhance its economy at the expense of competitors. If a breakdown in global trading rules is replaced by the US and China forming separate trading blocs with their allies and partners, the odds of repeating the mistakes of the inter-bellum years of 1918-39 will significantly increase. Tariff wars, subsidizing national champions, heavy taxation of foreign interests, non-tariff barriers to trade, domestic-focused monetary policies, and currency wars would become more likely. China’s Strategic Vulnerability The CCP has delivered remarkable prosperity and wealth to the average Chinese citizen in the 43 years since it undertook market reforms, and especially since its accession to the WTO in 2001 (Chart 6). China has transformed from an economic backwater into a $15.4 trillion (2020) economy and near-peer competitor to the US militarily and economically.7 This growth has propelled China to the top of commodity-importing and -consuming states globally for base metals and oil. We follow these markets closely, because they are critical to sustaining economic growth, regardless of how states are organized. Production of and access to these commodities, along with natural gas, will be critical over the next decade, as the world decarbonizes its energy sources, and as the US and China address their own growth and social agendas while vying for global hegemony. Decarbonization is part of the strategic race since all major powers now want to increase economic self-sufficiency and technological prowess. Chart 6CCPs Remarkable Success In Growing Chinas Economy
CCPs Remarkable Success In Growing Chinas Economy
CCPs Remarkable Success In Growing Chinas Economy
Over recent decades China has become the largest importer of base metals ores (Chart 7) and the world's top refiner of many of these metals. In addition, it is the top consumer of refined metal (Chart 8). Chart 7China Is World’s Top Ore Importer
US-China: War Preparation Pushes Commodity Demand
US-China: War Preparation Pushes Commodity Demand
Chart 8China Is Worlds Top Refined Metal Consumer
China Is Worlds Top Refined Metal Consumer
China Is Worlds Top Refined Metal Consumer
By contrast, the US is not listed among ore importers or metals consumers in the Observatory of Economic Complexity (OEC) databases we used to map these commodities. This reflects not only domestic supplies but also the lack of investment and upgrades to the US's critical infrastructure over 2000-19.8 Going forward, the US is trying to invest in “nation building” at home. An enormous change has taken shape in strategic liabilities. In the oil market, the US went from being the world's largest importer of oil in 2000, accounting for more than 24% of imports globally, to being the largest oil and gas producer by 2019, even though it still accounted for more than 12% of the world's imports (Chart 9). In 2000, China accounted for ~ 3.5% of the world's oil imports and by 2019 it was responsible for nearly 21%. China is far behind per capita US energy consumption, given its large population, but it is gradually closing the gap (Chart 10). Overall energy consumption in China is much higher than in the US (Chart 11). Chart 9US Oil Imports Collapse As Shale Production Grows
US-China: War Preparation Pushes Commodity Demand
US-China: War Preparation Pushes Commodity Demand
Chart 10Energy Use Per Capita In China Far From US Levels...
Energy Use Per Capita In China Far From US Levels...
Energy Use Per Capita In China Far From US Levels...
Chart 11China Is World’s Largest Primary Energy Consumer
US-China: War Preparation Pushes Commodity Demand
US-China: War Preparation Pushes Commodity Demand
China's impressive GDP growth in the twenty-first century is primarily responsible for China's stunning growth in imports and consumption of oil (Chart 12) and copper (Chart 13), which we track closely as a proxy for the entire base-metals complex. Chart 12Global Oil Demand Forecast Remains Steady Chinas GDP Drives Oil Consumption, Imports
Global Oil Demand Forecast Remains Steady Chinas GDP Drives Oil Consumption, Imports
Global Oil Demand Forecast Remains Steady Chinas GDP Drives Oil Consumption, Imports
Chart 13Global Oil Demand Forecast Remains Steady Chinas GDP Drives Refined Copper Consumption And Ore Imports
Global Oil Demand Forecast Remains Steady Chinas GDP Drives Refined Copper Consumption And Ore Imports
Global Oil Demand Forecast Remains Steady Chinas GDP Drives Refined Copper Consumption And Ore Imports
China’s importance in these markets points to an underlying strategic weakness, which is its dependency on imports. This in turn points to the greatest danger of the breakdown in US-China relations and the global trade system. The Road To War? China is extremely anxious about maintaining supply security in light of these heavy import needs. Its pursuit of economic self-sufficiency, including decarbonization, is driven by its fear of the US’s ability to cut off its key supply lines. China’s first goal in modernizing its military in recent years was to develop a naval force capable of defending the country from foreign attack, particularly in its immediate maritime surroundings. Historically China suffered from invaders across the sea who took advantage of its weak naval power to force open its economy and exploit it. Today China is thought to have achieved this security objective. It is believed to have a high level of capability within the “first island chain” that surrounds the coast, from the Korean peninsula to the Spratly Islands, including southwest Japan and Taiwan (Map 1).9 China’s militarization of the South China Sea, suppression of Hong Kong, and intimidation of Taiwan shows its intention to dominate Greater China, which would put it in a better strategic position relative to other countries. Map 1China’s Navy Likely Achieved Superiority Within The First Island Chain
US-China: War Preparation Pushes Commodity Demand
US-China: War Preparation Pushes Commodity Demand
China’s capability can be illustrated by comparing its naval strength to that of the United States, the most powerful navy in the world. While the US is superior, China would be able to combine all three of its fleets within the first island China, while the US navy would be dispersed across the world and divided among a range of interests to defend (Table 3). China would also be able to bring its land-based air force and missile firepower to bear within the first island chain, as opposed to further abroad.10 Table 3China’s Naval Growth Enables Primacy Within First Island Chain
US-China: War Preparation Pushes Commodity Demand
US-China: War Preparation Pushes Commodity Demand
In this sense China is militarily capable of conquering Taiwan or other nearby islands. President Xi Jinping had in fact ordered China’s armed forces be capable of doing so by 2020.11 Taiwan continues to be the most significant source of insecurity for the regime. True, a military victory would likely be a pyrrhic victory, as Taiwan’s wealth and tech industry would be destroyed, but China probably has the raw military capability to defeat Taiwan and its allies within this defined space. However, this military capability needs to be weighed against economic capability. If China seized military control of Taiwan, or Okinawa or other neighboring territories, the US, Japan, and their allies would respond by cutting off China’s access to critical supplies. Most obviously oil and natural gas. China’s decarbonization has been impressive but the reliance on foreign oil is still a fatal strategic vulnerability over the next few years (Chart 14). China is rapidly pursuing a Eurasian strategy to diversify away from the Middle East in particular. But it still imports about half its oil from this volatile region (Chart 15). The US navy is capable of interdicting China’s critical oil flows, a major inhibition on China’s military ambitions within the first island chain. Chart 14Chinas Energy Diversification Still Leaves Vulnerabilities
Chinas Energy Diversification Still Leaves Vulnerabilities
Chinas Energy Diversification Still Leaves Vulnerabilities
Of course, if the US and its allies ever blockaded China, or if China feared they would, Beijing could be driven to mount a desperate attack to prevent them from doing so, since its economic, military, and political survival would be on the line. Chart 15China Still Dependent On Middle East Energy Supplies
China Still Dependent On Middle East Energy Supplies
China Still Dependent On Middle East Energy Supplies
The obvious historical analogy is the US-Japan conflict in WWII. Invasions that lead to blockades will lead to larger invasions, as the US and Japan learned.12 However, the lesson from WWII for China is that it should not engage the US navy until its own naval power has progressed much further. In the event of a conflict, the US would be imposing a blockade at a distance from China’s naval and missile forces. When it comes to the far seas, China’s naval capabilities are extremely limited. Military analysts highlight that China lacks a substantial naval presence in the Indian Ocean. China relies on commercial ports, where it has partial equity ownership, for ship supply and maintenance (Table 4). This is no substitute for naval basing, because dedicated military facilities are lacking and host countries may not wish to be drawn into a conflict. Table 4China’s Network Of Part-Owned Ports Across The World: Useful But Not A Substitute For Military Bases
US-China: War Preparation Pushes Commodity Demand
US-China: War Preparation Pushes Commodity Demand
Further, Beijing lacks the sea-based air power necessary to defend its fleets should they stray too far. And it lacks the anti-submarine warfare capabilities necessary to defend its ships.13 These capabilities are constantly improving but at the moment they are insufficient to overthrow US naval control of the critical chokepoints like the Strait of Hormuz or Strait of Malacca. While China’s naval power is comparable to the US’s Asia Pacific fleet (the seventh fleet headquartered in Japan), it is much smaller than the US’s global fleet and at a much greater disadvantage when operating far from home. China’s navy is based at home and focused on its near seas, whereas US fleet is designed to operate in the far seas, especially the Persian Gulf, which is precisely the strategic area in question (Chart 16).14 China is gradually expanding its navy and operations around the world, so over time it may gain the ability to prevent the US from cutting off its critical supplies in the Persian Gulf. But not immediately. The implication is that China will have to avoid direct military conflict with the United States until its military and naval buildup has progressed a lot further. Chart 16China’s Navy At Huge Disadvantage In Distant Seas
US-China: War Preparation Pushes Commodity Demand
US-China: War Preparation Pushes Commodity Demand
Meanwhile Beijing will continue diversifying its energy sources, decarbonizing, and forging supply chains across Eurasia via the Belt and Road Initiative. What could go wrong? We would highlight a few risks that could cause China to risk war even despite its vulnerability to blockade: Chart 17China’s Surplus Of Males Undergirds Rise In Nationalism
US-China: War Preparation Pushes Commodity Demand
US-China: War Preparation Pushes Commodity Demand
Domestic demographic pressure. China is slated to experience a dramatic bulge in the male-to-female ratio over the coming decade (Chart 17).15 A surfeit of young men could lead to an overshoot of nationalism and revanchism. This trend is much more important than the symbolic political anniversaries of 2027, 2035, and 2049, which analysts use to predict when China’s military might launch a major campaign. Domestic economic pressure. China’s turn to nationalism reflects slowing income growth and associated social instability. An economic crisis in China would be worrisome for regional stability for many reasons, but such pressures can lead nations into foreign military adventures. Domestic political pressure. China has shifted from “consensus rule” to “personal rule” under Xi Jinping. This could lead to faulty decision-making or party divisions that affect national policy. A leadership that carefully weighs each strategic risk could decay into a leadership that lacks good information and perspective. The result could be hubris and belligerence abroad. Foreign aggression. Attempts by the US or other powers to arm China’s neighbors or sabotage China’s economy could lead to aggressive reaction. The US’s attempt to build a technological blockade shows that future embargoes and blockades are not impossible. These could prompt a war rather than deter it, as noted above. Foreign weakness. China’s capabilities are improving over time while the US and its allies lack coordination and resolution. An opportunity could arise that China’s strategists believe they cannot afford to miss. Afghanistan is not one of these opportunities, but a US-Iran war or another major conflict with Russia could be. The breakdown in global trade is concerning because without an economic buffer, states may resort to arms to resolve disputes. History shows that military threats intended to discourage aggressive behavior can create dilemmas that incentivize aggression. The behavior of the US and China suggests that they are preparing for war, even if we are generous and assume that they are doing so only to deter war. Both countries are nuclear powers so they face mutually assured destruction in a total war scenario. But they will seek to improve their security within that context, which can lead to naval skirmishes, proxy wars, and even limited wars with associated risks of going nuclear. Investment Takeaways The pursuit of the national interest today involves using fiscal means to create more self-sufficient domestic economies and reduce international supply risks. Both China and the West are engaged in major projects to this end, including high-tech industrialization, domestic manufacturing, and decarbonization. These trends are generally bullish for commodities, even though they include trends like military modernization and naval expansion that could well be a prelude to war. War itself leads to commodity shortages and commodity price inflation, but of course it is disastrous for the people and economies involved. Fortunately, strategic deterrence continues to operate for the time being. The underlying geopolitical trend will put commodity markets under continual pressure. A final urgent update on oil and the Middle East: The US attempt to conduct a strategic “pivot” to Asia Pacific faces a critical juncture. Not because of Afghanistan but because of Iran. The Biden administration will have trouble unilaterally lowering sanctions on Iran after the humiliating Afghanistan pullout. The new administrations in both Iran and Israel are likely to establish red lines and credible threats. A higher geopolitical risk premium is thus warranted immediately in global oil markets. Beyond short-term shows of force, everything depends on whether the US and Iran can find a temporary deal to avoid the path to a larger war. But for now short-term geopolitical risks are commodity-bullish as well as long-term risks. Robert P. Ryan Chief Commodity & Energy Strategist rryan@bcaresearch.com Matt Gertken Vice President Geopolitical Strategy mattg@bcaresearch.com Footnotes 1 There are also significant differences between Biden and Trump in other areas such as redistribution, immigration, and social policy. 2 See Ravenhill, John (2020), Regional Trade Agreements, Chapter 6 in Global Political Economy, which he edited for Oxford University Press, particularly pp. 156-9. 3 “As time went by, the United States realized that Communism not only did not retreat, but also further advanced in China, with the state-owned economy growing stronger and the rule of the Party further entrenched in the process." See Henry Gao, “WTO Reform and China Defining or Defiling the Multilateral Trading System?” Harvard International Law Journal 62 (2021), p. 28, harvardilj.org. 4 See Mavroidis, Petros C. and Andre Sapir (2021), China and the WTO, Why Multilateralism Still Matters (Princeton University Press) for discussion. See also Confronting the Challenge of Chinese State Capitalism published by the Center for Strategic & International Studies 22 January 2021. 5 Gao (2021), p. 19. 6 Gao (2021), p. 24. 7 Please see China's GDP tops 100 trln yuan in 2020 published by Xinhuanet 18 January 2021. 8 We excluded 2020 because of the COVID-19 pandemic's effects on supply and demand for these ores, metals and crude oil. 9 See Captain James Fanell, “China’s Global Navy Strategy and Expanding Force Structure: Pathway To Hegemony,” Testimony to the US House of Representatives, May 17, 2018, docs.house.gov. 10 Fanell (2018), p. 13. 11 He has obliquely implied that his vision for national rejuvenation by 2035 would include reunification with Taiwan. Others suggest that the country’s second centenary of 2049 is the likely deadline, or the 100th anniversary of the People’s Liberation Army. 12 The US was a major supplier of oil to Japan, and in 1941 it froze Japan's assets in the US and shut down all oil exports, in response to Japan's military incursion into China in the Second Sino-Japanese War of 1937-45. Please see Anderson, Irvine H. Jr. (1975), "The 1941 De Facto Embargo on Oil to Japan: A Bureaucratic Reflex," Pacific Historical Review, 44:2, pp. 201-231. 13 See Jeffrey Becker, “Securing China’s Lifelines Across the Indian Ocean,” China Maritime Report No. 11 (Dec 2020), China Maritime Studies Institute, digital-commons.usnwc.edu. 14 See Rear Admiral Michael McDevitt, “Becoming a Great ‘Maritime Power’: A Chinese Dream,” Center for Naval Analyses (June 2016), cna.org. 15 For discussion see Major Tiffany Werner, “China’s Demographic Disaster: Risk And Opportunity,” 2020, Defense Technical Information Center, discover.dtic.mil.
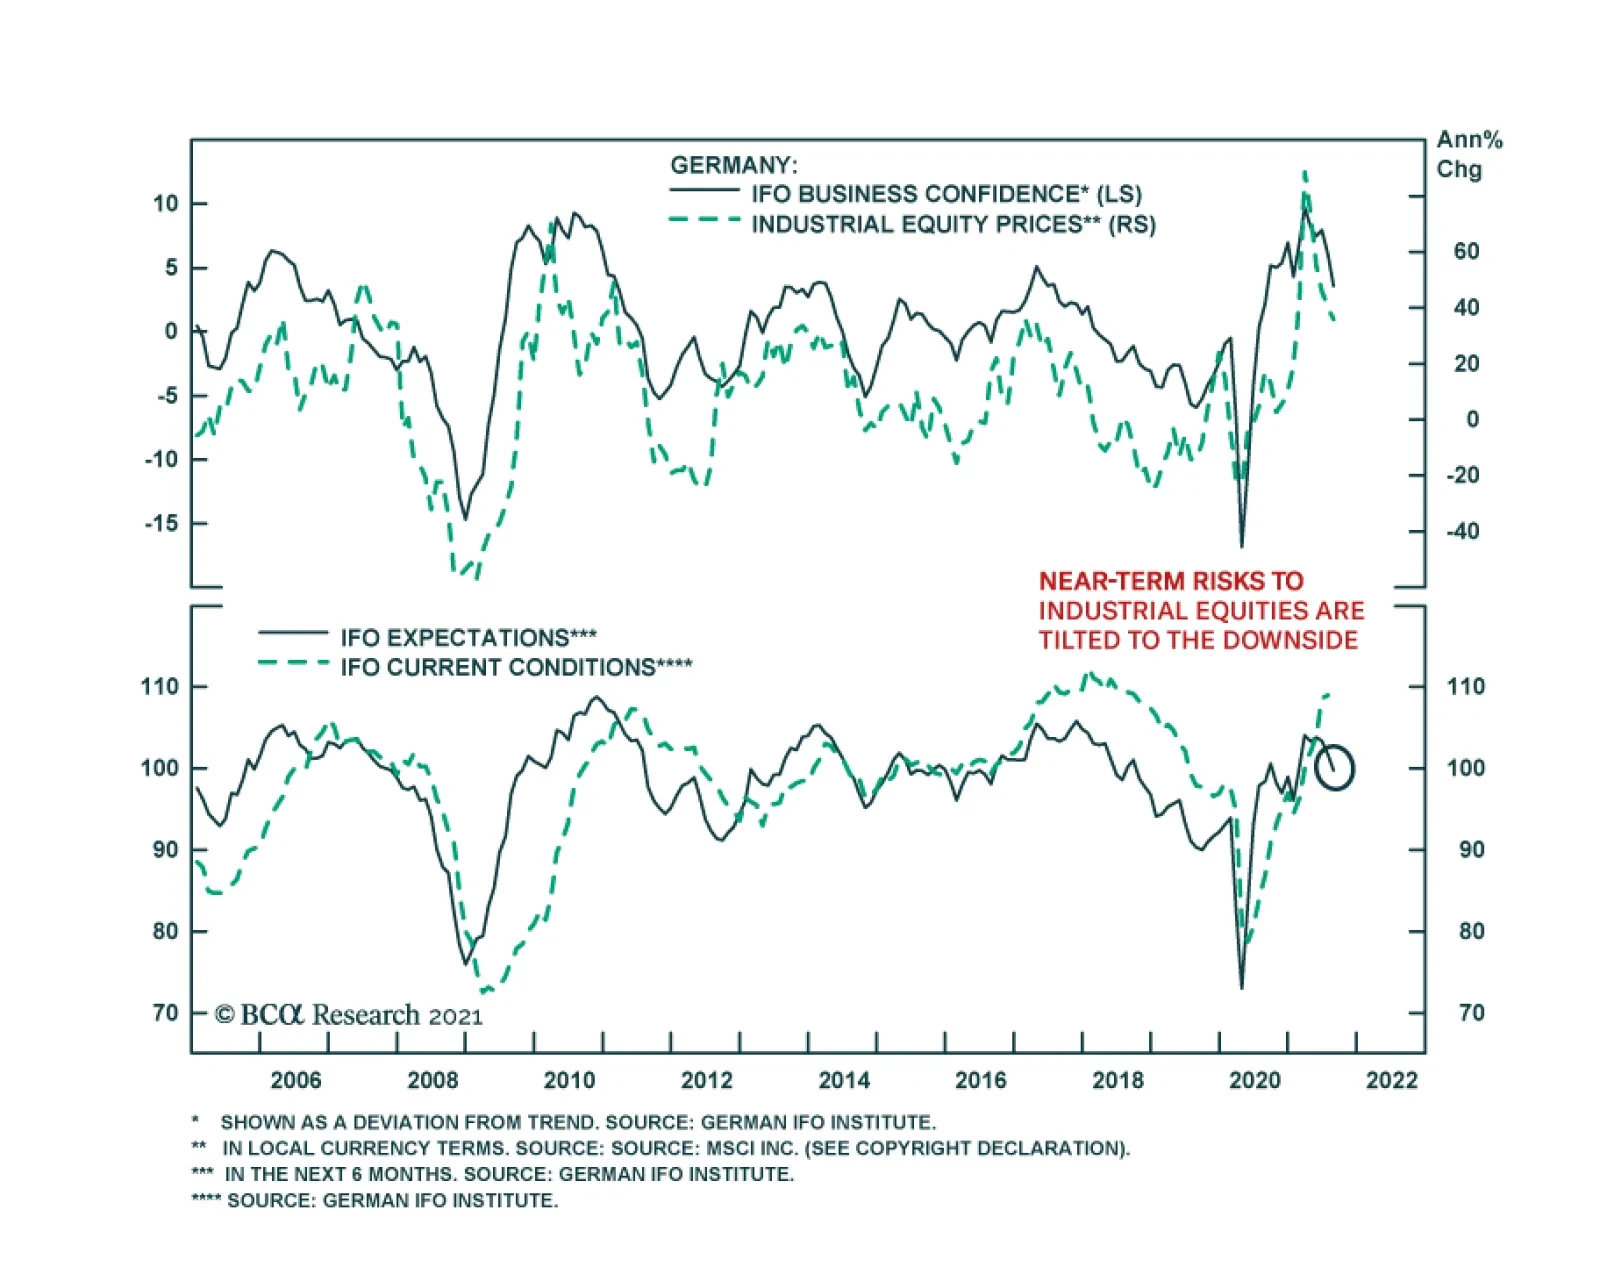
The German IFO reveals that businesses continue to pare back optimism. The headline index fell 1.3 points to 99.4 on the back of a greater than expected 3.5-point decline in expectations. Meanwhile, the current assessment component gained one point. The…
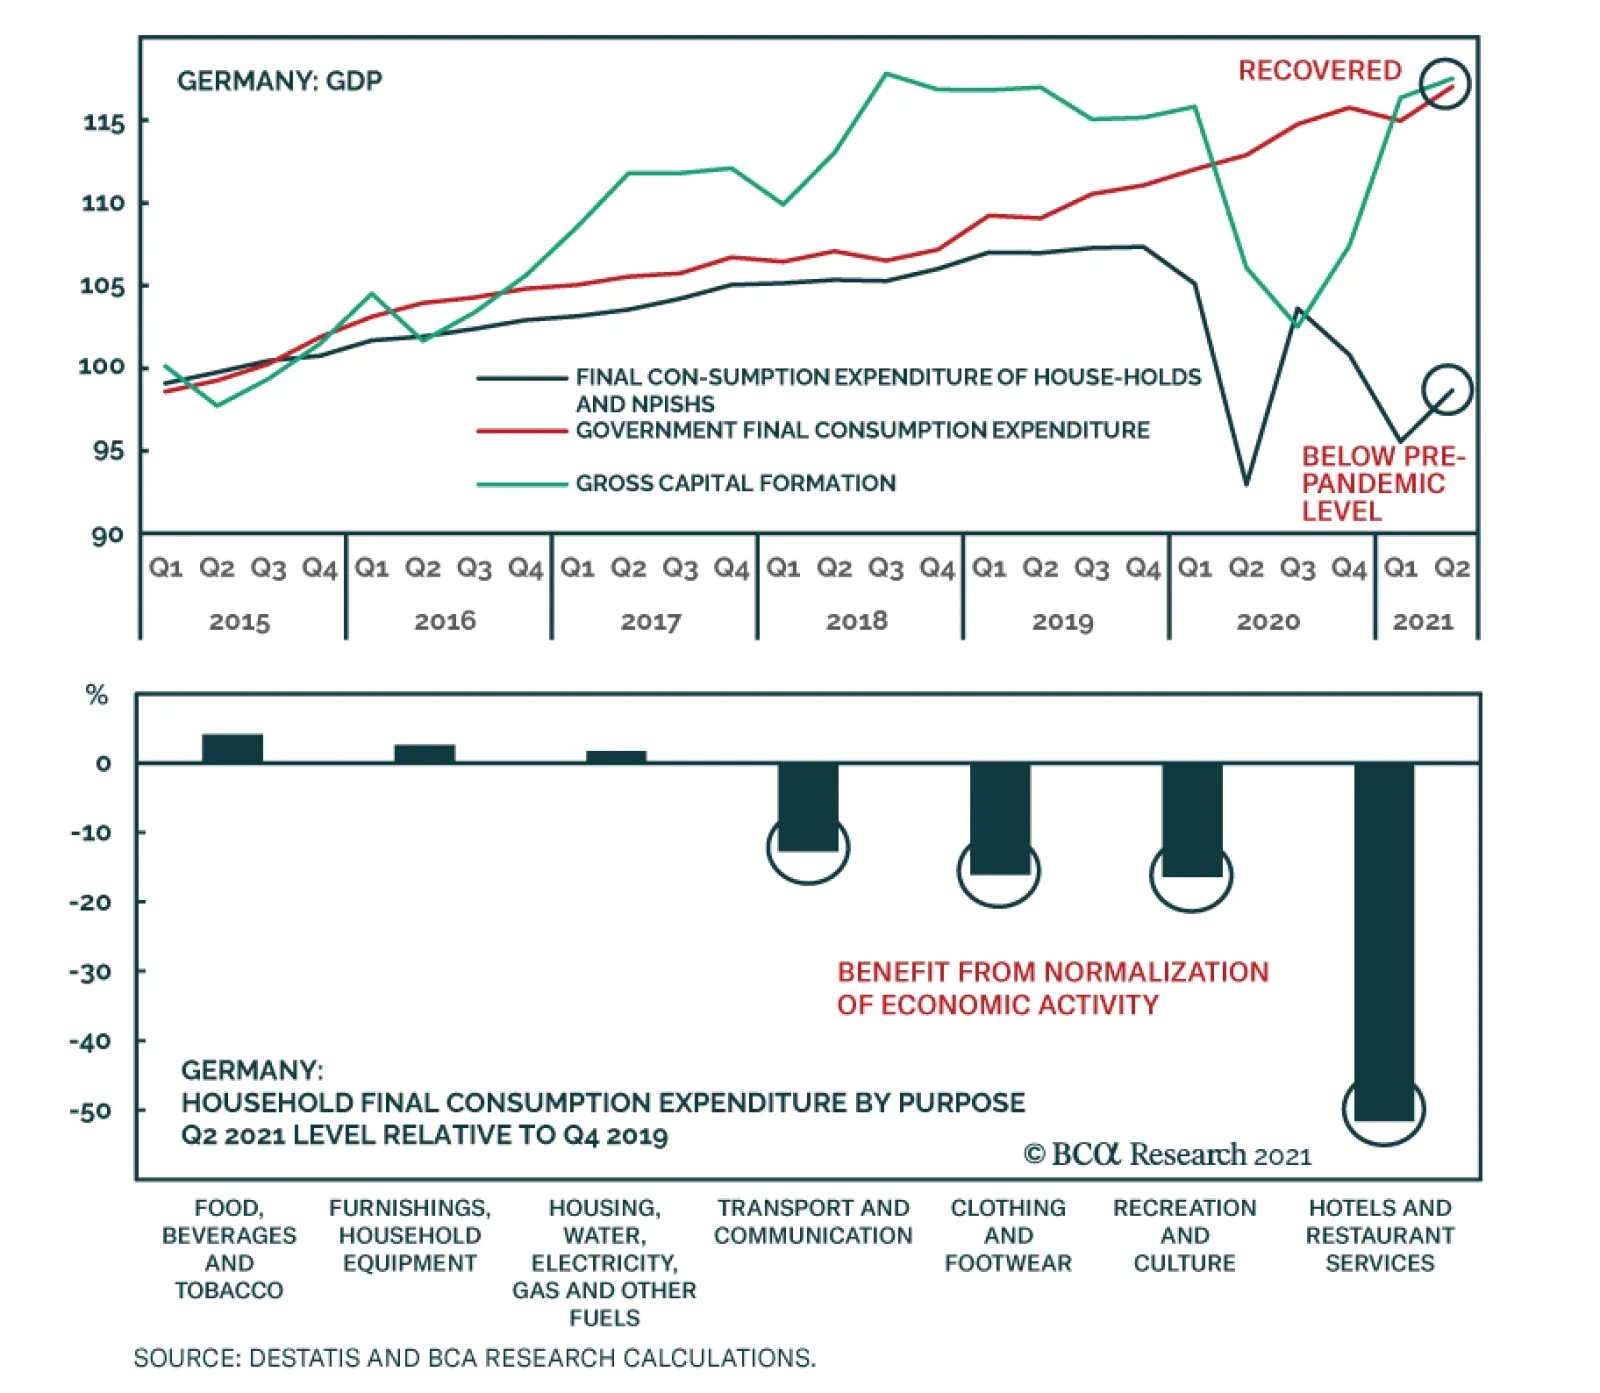
Germany's Q2 GDP was revised up to 1.6% q/q versus the initial estimate of 1.5% q/q. The latest figure reduces the GDP gap relative to Q4 2019 to 3.2%. The details of the release reveal that while government spending and gross capital formation recovered…
Highlights China’s July Politburo meeting signaled that policy is unlikely to be overtightened. The Biden administration is likely to pass a bipartisan infrastructure deal – as well as a large spending bill by Christmas. Geopolitical risk in the Middle East will rise as Iran’s new hawkish president stakes out an aggressive position. US-Iran talks just got longer and more complicated. Europe’s relatively low political risk is still a boon for regional assets. However, Russia could still deal negative surprises given its restive domestic politics. Japan will see a rise in political turmoil after the Olympic games but national policy is firmly set on the path that Shinzo Abe blazed. Stay long yen as a tactical hedge. Feature Chart 1Rising Hospitalizations Cause Near-Term Jitters, But UK Rolling Over?
China’s Khodorkovsky Moment? And Other Questions From Clients
China’s Khodorkovsky Moment? And Other Questions From Clients
Our key view of 2021, that China would verge on overtightening policy but would retreat from such a mistake to preserve its economic recovery, looks to be confirmed after the Politburo’s July meeting opened the way for easier policy in the coming months. Meanwhile the Biden administration is likely to secure a bipartisan infrastructure package and push through a large expansion of the social safety net, further securing the American recovery. Growth and stimulus have peaked in both the US and China but these government actions should keep growth supported at a reasonable level and dispel disinflationary fears. This backdrop should support our pro-cyclical, reflationary trade recommendations in the second half of the year. Jitters continue over COVID-19 variants but new cases have tentatively peaked in the UK, US vaccinations are picking up, and death rates are a lot lower now than they were last year, that is, prior to widescale vaccination (Chart 1). This week we are taking a pause to address some of the very good client questions we have received in recent weeks, ranging from our key views of the year to our outstanding investment recommendations. We hope you find the answers insightful. Will Biden’s Infrastructure Bill Disappoint? Ten Republicans are now slated to join 50 Democrats in the Senate to pass a $1 trillion infrastructure bill that consists of $550 billion in new spending over a ten-year period (Table 1). The deal is not certain to pass and it is ostensibly smaller than Biden’s proposal. But Democrats still have the ability to pass a mammoth spending bill this fall. So the bipartisan bill should not be seen as a disappointment with regard to US fiscal policy or projections. The Republicans appear to have the votes for this bipartisan deal. Traditional infrastructure – including broadband internet – has large popular support, especially when not coupled with tax hikes, as is the case here. Both Biden and Trump ran on a ticket of big infra spending. However, political polarization is still at historic peaks so it is possible the deal could collapse despite the strong signs in the media that it will pass. Going forward, the sense of crisis will dissipate and Republicans will take a more oppositional stance. The Democratic Congress will pass President Joe Biden’s signature reconciliation bill this fall, another dollop of massive spending, without a single Republican vote (Chart 2). After that, fiscal policy will probably be frozen in place through at least 2025. Campaigning will begin for the 2022 midterm elections, which makes major new legislation unlikely in 2022, and congressional gridlock is the likely result of the midterm. Republicans will revert to belt tightening until they gain full control of government or a new global crisis erupts. Table 1Bipartisan Infrastructure Bill Likely To Pass
China’s Khodorkovsky Moment? And Other Questions From Clients
China’s Khodorkovsky Moment? And Other Questions From Clients
Chart 2Reconciliation Bill Also Likely To Pass
China’s Khodorkovsky Moment? And Other Questions From Clients
China’s Khodorkovsky Moment? And Other Questions From Clients
Chart 3Biden Cannot Spare A Single Vote In Senate
China’s Khodorkovsky Moment? And Other Questions From Clients
China’s Khodorkovsky Moment? And Other Questions From Clients
Hence the legislative battle over the reconciliation bill this fall will be the biggest domestic battle of the Biden presidency. The 2021 budget reconciliation bill, based on a $3.5 trillion budget resolution agreed by Democrats in July, will incorporate parts of the American Jobs Plan that did not pass via bipartisan vote (such as $436 billion in green energy subsidies), plus a large expansion of social welfare, the American Families Plan. This bill will likely pass by Christmas but Democrats have only a one-seat margin in the Senate, which means our conviction level must be medium, or subjectively about 65%. The process will be rocky and uncertain (Chart 3). Moderate Democratic senators will ultimately vote with their party because if they do not they will effectively sink the Biden presidency and fan the flames of populist rebellion. US budget deficit projections in Chart 4 show the current status quo, plus scenarios in which we add the bipartisan infra deal, the reconciliation bill, and the reconciliation bill sans tax hikes. The only significant surprise would be if the reconciliation bill passed shorn of tax hikes, which would reduce the fiscal drag by 1% of GDP next year and in coming years. Chart 4APassing Both A Bipartisan Infrastructure Bill And A Reconciliation Bill Cannot Avoid Fiscal Cliff In 2022 …
China’s Khodorkovsky Moment? And Other Questions From Clients
China’s Khodorkovsky Moment? And Other Questions From Clients
Chart 4B… The Only Major Fiscal Surprise Would Come If Tax Hikes Were Excluded From This Fall’s Reconciliation Bill
China’s Khodorkovsky Moment? And Other Questions From Clients
China’s Khodorkovsky Moment? And Other Questions From Clients
Chart 5Biden Stimulus Overshadowed By China Policy Tightening ... But China Is Now Marginally Easing
Biden Stimulus Overshadowed By China Policy Tightening ... But China Is Now Marginally Easing
Biden Stimulus Overshadowed By China Policy Tightening ... But China Is Now Marginally Easing
There are two implications. First, government support for the economy has taken a significant step up as a result of the pandemic and election in 2020. There is no fiscal austerity, unlike in 2011-16. Second, a fiscal cliff looms in 2022 regardless of whether Biden’s reconciliation bill passes, although the private economy should continue to recover on the back of vaccines and strong consumer sentiment. This is a temporary problem given the first point. Monetary policy has a better chance of normalizing at some point if fiscal policy delivers as expected. But the Federal Reserve will still be exceedingly careful about resuming rate hikes. President Biden could well announce that he will replace Chairman Powell in the coming months, delivering a marginally dovish surprise (otherwise Biden runs the risk that Powell will be too hawkish in 2022-23). Inflation will abate in the short run but remain a risk over the long run. Essentially the outlook for US equities is still positive for H2 but clouds are forming on the horizon due to peak fiscal stimulus, tax hikes in the reconciliation bill, eventual Fed rate hikes (conceivably 2022, likely 2023), and the fact that US and Chinese growth has peaked while global growth is soon to peak as well. All of these factors point toward a transition phase in global financial markets until economies find stable growth in the post-pandemic, post-stimulus era. Investors will buy the rumor and sell the news of Biden’s multi-trillion reconciliation bill in H2. The bill is largely priced out at the moment due to China’s policy tightening (Chart 5). The next section of this report suggests that China’s policy will ease on the margin over the coming 12 months. Bottom Line: US fiscal policy is delivering, not disappointing. Congress is likely to pass a large reconciliation bill by Christmas, despite no buffer in the Senate, because Democratic Senators know that the Biden presidency hangs in the balance. China’s Khodorkovsky Moment? Many clients have asked whether China’s crackdown on private business, from tech to education, is the country’s “Khodorkovsky moment,” i.e. the point at which Beijing converts into a full, autocratic regime where private enterprise is permanently impaired because it is subject to arbitrary seizure and control of the state. The answer is yes, with caveats. Yes, China’s government is taking a more aggressive, nationalist, and illiberal stance that will permanently impair private business and investor sentiment. But no, this process did not begin overnight and will not proceed in a straight line. There is a cyclical aspect that different investors will have to approach differently. First a reminder of the original Khodorkovsky moment. After the Soviet Union’s collapse, extremely wealthy oligarchs emerged who benefited from the privatization of state assets. When President Putin began to reassert the primacy of the state, he arbitrarily imprisoned Khodorkovsky and dismantled his corporate energy empire, Yukos, giving the spoils to state-owned companies. Russia is a petro state so Putin’s control of the energy sector would be critical for government revenues and strategic resurgence, especially at the dawn of a commodity boom. Both the RUB-USD and Russian equity relative performance performed mostly in line with global crude oil prices, as befits Russia’s economy, even though there was a powerful (geo)political risk premium injected during these two decades due to Russia’s centralization of power and clash with the West (Chart 6). Investors could tactically play the rallies after Khodorkovsky but the general trend depended on the commodity cycle and the secular rise of geopolitical risk. Chart 6Russia's 'Khodorkovsky Moment' Was A Geopolitical Turning Point...But Russian Assets Benefited From Oil Bull Market For A While Longer
Russia's 'Khodorkovsky Moment' Was A Geopolitical Turning Point...But Russian Assets Benefited From Oil Bull Market For A While Longer
Russia's 'Khodorkovsky Moment' Was A Geopolitical Turning Point...But Russian Assets Benefited From Oil Bull Market For A While Longer
President Xi Jinping is a strongman and hardliner, like Putin, but his mission is to prevent Communist China from collapsing like the Soviet Union, rather than to revive it from its ashes. To that end he must reassert the state while trying to sustain the country’s current high level of economic competitiveness. Since China is a complex economy, not a petro state, this requires the state-backed pursuit of science, technology, competitiveness, and productivity to avoid collapse. Therefore Beijing wants to control but not smother the tech companies. Hence there is a cyclical factor to China’s regulatory crackdown. A crackdown on President Xi Jinping’s potential rivals or powerful figures was always very likely to occur ahead of the Communist Party’s five-year personnel reshuffle in 2022, as we argued prior to tech exec Jack Ma’s disappearance. Sackings of high-level figures have happened around every five-year leadership rotation. Similarly a crackdown on the media was expected. True, the pre-party congress crackdowns are different this time around as they are targeted at the private sector, innovative businesses, tech, and social media. Nevertheless, as in the past, a policy easing phase will follow the tightening phase so as to preserve the economy and the mobilization of private capital for strategic purposes. The critical cyclical factor for global investors is China’s monetary and credit impulse. For example, the crackdown on the financial sector ahead of the national party congress in 2017 caused a global manufacturing slowdown because it tightened credit for the entire Chinese economy, reducing imports from abroad. One reason Chinese markets sold off so heavily this spring and summer, was that macroeconomic indicators began decelerating, leaving nothing for investors to sink their teeth into except communism. The latest Politburo meeting suggests that monetary, fiscal, and regulatory policy is likely to get easier, or at least stay just as easy, going forward (Table 2). Once again, the month of July has proved an inflection point in central economic policy. Financial markets can now look forward to a cyclical easing in regulation combined with easing in monetary and fiscal policy over the next 12-24 months. Table 2China’s Politburo Prepares To Ease Policy, Secure Recovery
China’s Khodorkovsky Moment? And Other Questions From Clients
China’s Khodorkovsky Moment? And Other Questions From Clients
Despite all of the above, for global investors with a lengthy time horizon, the government’s crackdown points to a secular rise of Communist and Big Government interventionism into the economy, with negative ramifications for China’s private sector, economic freedoms, and attractiveness as a destination for foreign investment. The arbitrary and absolutist nature of its advances will be anathema to long-term global capital. Also, social media, unlike other tech firms, pose potential sociopolitical risks and may not boost productivity much, whereas the government wants to promote new manufacturing, materials, energy, electric vehicles, medicine, and other tradable goods. So while Beijing cannot afford to crush the tech sector, it can afford to crush some social media firms. Chart 7China's Crackdown On Private Sector Reinforces Past Decade's Turn Away From Liberal Reform
China's Crackdown On Private Sector Reinforces Past Decade's Turn Away From Liberal Reform
China's Crackdown On Private Sector Reinforces Past Decade's Turn Away From Liberal Reform
China’s equity market profile looks conspicuously like Russia’s at the time of Khodorkovsky’s arrest (Chart 7). Chinese renminbi has underperformed the dollar on a multi-year basis since Xi Jinping’s rise to power, in line with falling export prices and slowing economic growth, as a result of economic structural change and the administration’s rolling back Deng Xiaoping’s liberal reform era. We expect a cyclical rebound to occur but we do not recommend playing it. Instead we recommend other cyclical plays as China eases policy, particularly in European equities and US-linked emerging markets like Mexico. Bottom Line: The twentieth national party congress in 2022 is a critical political event that is motivating a cyclical crackdown on potential rivals to Communist Party power. Chinese equities will temporarily bounce back, especially with a better prospect for monetary and fiscal easing. But over the long run global investors should stay focused on the secular decline of China’s economic freedoms and hence productivity. What Happened To The US-Iran Deal? Our second key view for 2021 was the US strategic rotation from the Middle East and South Asia to Asia Pacific. This rotation is visible in the Biden administration’s attempt to withdraw from Iraq and Afghanistan while rejoining the 2015 nuclear deal with Iran. However, Biden here faces challenges that will become very high profile in the coming months. The Biden administration failed to rejoin the 2015 deal under the outgoing leadership of the reformist President Hassan Rouhani. This means a new and much more difficult negotiation process will now begin that could last through Biden’s term or beyond. On August 5, President Ebrahim Raisi will take office with an aggressive flourish. The US is already blaming Iran for an act of sabotage in the Persian Gulf that killed one Romanian and one Briton. Raisi will need to establish that he is not a toady, will not cower before the West. The new Israeli government of Prime Minister Naftali Bennett also needs to demonstrate that despite the fall of his hawkish predecessor Benjamin Netanyahu, Jerusalem is willing and able to uphold Israel’s red lines against Iranian nuclear weaponization and regional terrorism. Hence both Iran and its regional rivals, including Saudi Arabia, will rattle sabers and underscore their red lines. The Persian Gulf and Strait of Hormuz will be subject to threats and attacks in the coming months that could escalate dramatically, posing a risk of oil supply disruptions. Given that the Iranians ultimately do want a deal with the Americans, the pressure should be low-to-medium level and persistent, hence inflationary, as opposed to say a lengthy shutdown of the Strait of Hormuz that would cause a giant spike in prices that ultimately kills global demand. Short term, the US attempt to reduce its commitments in Iraq and Afghanistan will invite US enemies to harass or embarrass the Biden administration. The Taliban is likely to retake control of Afghanistan. The US exit will resemble Saigon in 1975. This will be a black eye for the Biden administration. But public opinion and US grand strategy will urge Biden to be rid of the war. So any delays, or a decision to retain low-key sustained troop presence, will not change the big picture of US withdrawal. Long term, Biden needs to pivot to Asia, while President Raisi is ultimately subject to the Supreme Leader Ali Khamenei, who wants to secure Iran’s domestic stability and his own eventual leadership succession. Rejoining the 2015 nuclear deal leads to sanctions relief, without requiring total abandonment of a nuclear program that could someday be weaponized, so Iran will ultimately agree. The problem will then become the regional rise of Iranian power and the balancing act that the US will have to maintain with its allies to keep Iran contained. Bottom Line: The risk to oil prices lies to the upside until a US-Iran deal comes together. The US and Iran still have a shared interest in rejoining the 2015 deal but the time frame is now delayed for months if not years. We still expect a US-Iran deal eventually but previously we had anticipated a rapid deal that would put downward pressure on oil prices in the second half of the year. What Comes After Biden’s White Flag On Nord Stream II? Our third key view for 2021 highlighted Europe’s positive geopolitical and macro backdrop. This view is correct so far, especially given that China’s policymakers are now more likely to ease policy going forward. But Russia could still upset the view. Italy has been the weak link in European integration over the past decade (excluding the UK). So the national unity coalition that has taken shape under Prime Minister Mario Draghi exemplifies the way in which political risks were overrated. Italy is now the government that has benefited the most from the overall COVID crisis in public opinion (Chart 8). The same chart shows that the German government also improved its public standing, although mostly because outgoing Chancellor Angela Merkel is exiting on a high note. Her Christian Democrat-led coalition has not seen a comparable increase in support. The Greens should outperform their opinion polling in the federal election on September 26. But the same polling suggests that the Greens will be constrained within a ruling coalition (Chart 9). The result will be larger spending without the ability to raise taxes substantially. Markets will cheer a fiscally dovish and pro-European ruling coalition. Chart 8European Political Risk Limited, But Rising, Post-COVID
China’s Khodorkovsky Moment? And Other Questions From Clients
China’s Khodorkovsky Moment? And Other Questions From Clients
The chief risk to this view of low EU political risk comes from Russia. Russia is a state in long-term decline due to the remorseless fall in fertility and productivity. The result has been foreign policy aggression as President Putin attempts to fortify the country’s strategic position and frontiers ahead of an even bleaker future. Chart 9German Election Polls Point To Gridlock?
German Election Polls Point To Gridlock?
German Election Polls Point To Gridlock?
Now domestic political unrest has grown after a decade of policy austerity and the COVID-19 pandemic. Elections for the Duma will be held on September 19 and will serve as the proximate cause for Russia’s next round of unrest and police repression. Foreign aggressiveness may be used to distract the population from the pandemic and poor economy. We have argued that there would not be a diplomatic reset for the US and Russia on par with the reset of 2009-11. We stand by this view but so far it is facing challenges. Putin did not re-invade Ukraine this spring and Biden did not impose tough sanctions canceling the construction of the Nord Stream II gas pipeline to Germany. Russia is tentatively cooperating on the US’s talks with Iran and withdrawal from Afghanistan. The US gave Germany and Russia a free point by condoning the NordStream II. Now the US will expect Germany to take a tough diplomatic line on Russian and Chinese aggression, while expecting Russia to give the US some goodwill in return. They may not deliver. The makeup of the new German coalition will have some impact on its foreign policy trajectory in the coming years. But the last thing that any German government wants is to be thrust into a new cold war that divides the country down the middle. Exports make up 36% of German output, and exports to the Russian and Chinese spheres account for a substantial share of total exports (Chart 10). The US administration prioritizes multilateralism above transactional benefits so the Germans will not suffer any blowback from the Americans for remaining engaged with Russia and China, at least not anytime soon. Russia, on the other hand, may feel a need to seize the moment and make strategic gains in its region, despite Biden’s diplomatic overtures. If the US wraps up its forever wars, Russia’s window of opportunity closes. So Russia may be forced to act sooner rather than later, whether in suppressing domestic dissent, intimidating or attacking its neighbors, or hacking into US digital networks. In the aftermath of the German and Russian elections, we will reassess the risk from Russia. But our strong conviction is that neither Russian nor American strategy have changed and therefore new conflicts are looming. Therefore we prefer developed market European equities and we do not recommend investors take part in the Russian equity rally. Chart 10Germany Opposes New Cold War With Russia Or China
China’s Khodorkovsky Moment? And Other Questions From Clients
China’s Khodorkovsky Moment? And Other Questions From Clients
Bottom Line: German and European equities should benefit from global vaccination, Biden’s fiscal and foreign policies, and China’s marginal policy easing (Chart 11). Eastern European emerging markets and Russian assets are riskier than they appear because of latent geopolitical tensions that could explode around the time of important elections in September. Chart 11Geopolitical Tailwinds To European Equities
Geopolitical Tailwinds To European Equities
Geopolitical Tailwinds To European Equities
What Comes After The Olympics In Japan? Japan is returning to an era of “revolving door” prime ministers. Prime Minister Yoshihide Suga’s sole purpose was to tie up the loose ends of the Shinzo Abe administration, namely by overseeing the Olympics. After the games end, he will struggle to retain leadership of the Liberal Democratic Party. He will be blamed for spread of Delta variant even if the Olympics were not a major factor. If he somehow retains the party’s helm, the October general election will still be an underwhelming performance by the Liberal Democrats, which will sow the seeds of his downfall within a short time (Chart 12). Suga will need to launch a new fiscal spending package, possibly as an election gimmick, and his party has the strength in the Diet to push it through quickly, which will be favorable for the economy. For the elections the problem is not the Liberal Democrats’ popularity, which is still leagues above the nearest competitor, but rather low enthusiasm and backlash over COVID. Abe’s retirement, and the eventual fall of Abe’s hand-picked deputy, does not entail the loss of Abenomics. The Bank of Japan will retain its ultra-dovish cast at least until Haruhiko Kuroda steps down in 2023. The changes that occurred in Japan from 2008-12 exemplified Japan’s existence as an “earthquake society” that undergoes drastic national changes suddenly and rapidly. The paradigm shift will not be reversed. The drivers were the Great Recession, the LDP’s brief stint in the political wilderness, the Tohoku earthquake and Fukushima nuclear crisis, and the rise of China. The BoJ became ultra-dovish and unorthodox, the LDP became more proactive both at home and abroad. The deflationary economic backdrop and Chinese nationalism are still a powerful impetus for these trends to continue – as highlighted by increasingly alarming rhetoric by Japanese officials, including now Shinzo Abe himself, regarding the Chinese military threat to Taiwan. In other words, Suga’s lack of leadership will not stand even if he somehow stays prime minister into 2022. The Liberal Democrats have several potential leaders waiting in the wings and one of these will emerge, whether Yuriko Koike, Shigeru Ishiba, or Shinjiro Koizumi, or someone else. The popular and geopolitical pressures will force the Liberal Democrats and various institutions to continue providing accommodation to the economy and bulking up the nation’s defenses. This will require the BoJ to stay easier for longer and possibly to roll out new unorthodox policies, as with yield curve control in the 2010s. Japan has some of the highest real rates in the G10 as a result of very low inflation expectations and a deeply negative output gap (Chart 13). Abenomics was bearing fruit, prior to COVID-19, so it will be justified to stay the course given that deflation has reemerged as a threat once again. Chart 12Japan: Back To Revolving Door Of Prime Ministers
China’s Khodorkovsky Moment? And Other Questions From Clients
China’s Khodorkovsky Moment? And Other Questions From Clients
Chart 13Japan To Keep Fighting Deflation Post-Abe
Japan To Keep Fighting Deflation Post-Abe
Japan To Keep Fighting Deflation Post-Abe
Bottom Line: The political and geopolitical backdrop for Japan is clear. The government and BoJ will have to do whatever it takes to stay the course on Abenomics even in the wake of Abe and Suga. Prime ministers will come and go in rapid succession, like in past eras of political turmoil, but the trajectory of national policy is set. We would favor JGBs relative to more high-beta government bonds like American and Canadian. Given deflation, looming Japanese political turmoil, and the secular rise in geopolitical risk, we continue to recommend holding the yen. These views conform with those of BCA’s fixed income and forex strategists. Investment Takeaways China’s policymakers are backing away from the risk of overtightening policy this year. Policy should ease on the margin going forward. Our number one key forecast for 2021 is tentatively confirmed. Base metals are still overextended but global reflation trades should be able to grind higher. The US fiscal spending orgy will continue through the end of the year via Biden’s reconciliation bill, which we expect to pass. Proactive DM fiscal policy will continue to dispel disinflationary fears. Sparks will fly in the Middle East. The US-Iran negotiations will now be long and drawn out with occasional shows of force that highlight the tail risk of war. We expect geopolitics to add a risk premium to oil prices at least until the two countries can rejoin the 2015 nuclear deal. Germany’s Green Party will surprise to the upside in elections, highlighting Europe’s low level of geopolitical risk. China policy easing is positive for European assets. Russia’s outward aggressiveness is the key risk. Matt Gertken Vice President Geopolitical Strategy mattg@bcaresearch.com
The European Commission’s Euro Area economic sentiment index increased 1.1 points in July, climbing to 119 – the highest level in the history of the series dating back to 1985. This improvement is especially significant given that it occurred despite renewed…
Highlights Portfolio Duration: The decline in US bond yields is overdone. We anticipate that strong US employment data will catalyze a jump in bond yields this fall and that the 10-year US Treasury yield will reach a range of 2% - 2.25% by the time that the Fed is ready to lift rates, likely by the end of 2022. Maintain below-benchmark duration in bond portfolios. US Yield Curve: Investors should position for a rebound in bond yields but not a reversal of recent US Treasury curve flattening. In fact, we advocate owning 2/10 flatteners on the US Treasury curve as we see ample room for further curve flattening as Fed rate hikes approach in late-2022. ECB: The ECB’s new forward interest rate guidance has moved it that much closer to the Fed’s ultra-accommodative stance. This reinforces the defensive nature of the European bond market. Investors should overweight European bonds within global fixed income portfolios with a particular emphasis on peripheral European bond markets like Italy and Spain. Feature Chart 1Can The Bond Rally Continue?
Can The Bond Rally Continue?
Can The Bond Rally Continue?
The bond rally continues to rip. The selloff that started last August when Jay Powell officially announced the Federal Reserve’s adoption of an Average Inflation Target ended on March 31st 2021. Since then, the 10-year US Treasury yield has retraced from 1.74% to 1.29% and the Bloomberg Barclays US Treasury index has clawed back 285 bps of excess return versus cash, partially offsetting the 465 bps that were lost between August 2020 and March 2021 (Chart 1). The US Bond Strategy Weekly Report from two weeks ago and last week’s Global Fixed Income Strategy Weekly Report both discuss the reasons for recent bond market strength.1 We won’t re-hash those arguments this week except to reiterate our conclusion that the decline in US bond yields is overdone. We anticipate that strong US employment data will catalyze a jump in bond yields this fall and that the 10-year US Treasury yield will reach a range of 2% - 2.25% by the time that the Fed is ready to lift rates, likely by the end of 2022. The first section of this week’s report looks at whether correlations between different asset classes have held up during the recent bond rally, with a focus on whether those relationships give us any information about the near-term direction for bond yields. The second section considers the outlook for the slope of the US Treasury curve and the third section discusses the recently released results of the European Central Bank’s strategy review. Cross-Market Correlations During The Bond Rally The bond rally has been just as intense as the prior sell-off. The US Treasury index has outperformed a position in cash by an annualized 9% since March 31st, matching the annualized losses of 9% seen between August 2020 and March 2021 (Chart 2). An important question to answer is whether this bond market performance is consistent with other asset classes. If it is, then it may suggest that the economy is experiencing a deflationary episode and that bond yields have further downside. If it isn’t, then it is more likely that the drop in bond yields will be temporary. Chart 2Bonds Versus Credit And Equities
Bonds Versus Credit And Equities
Bonds Versus Credit And Equities
Bonds Versus Equities And Corporate Credit Chart 3Equity Sector Performance Consistent With Yields
Equity Sector Performance Consistent With Yields
Equity Sector Performance Consistent With Yields
Looking first at corporate bonds, we find that – consistent with stronger Treasury performance – excess US corporate bond returns have slowed since March 31st. Baa-rated corporates have been outperforming at an annualized rate of 3% since March 31st compared to an annualized rate of 12% between August 2020 and March 2021 (Chart 2, panel 2). Equities, on the other hand, have maintained their strong performance. The S&P 500 returned an annualized 30% between August 2020 and March 2021 and has returned an even greater 42% (annualized) since the end of March (Chart 2, panel 3). Extremely tight spreads are the most likely explanation for lower corporate bond excess returns. Meanwhile, the fact that equities continue to perform well is an indication that the drop in bond yields may be overdone. Interestingly, while overall equity returns haven’t dropped in line with bond yields, the relative performance of equity sectors has been totally consistent with the movement in yields (Chart 3). Cyclical equity sectors (Industrials, Energy and Materials) have underperformed defensive equity sectors (Healthcare, Telecoms, Consumer Staples and Utilities) and Banks have underperformed the overall index. The correlation between long-maturity real Treasury yields and the relative performance of value and growth stocks has also held up, with growth stocks outperforming since the end of March (Chart 3, bottom panel). Bonds Versus Commodities Chart 4Commodities And Bonds Have Diverged
Commodities And Bonds Have Diverged
Commodities And Bonds Have Diverged
We see the biggest divergence in relative performance between bond yields and commodities. Historically, the ratio between the CRB Raw Industrials commodity price index and Gold is tightly correlated with the 10-year US Treasury yield. However, the CRB/Gold ratio has increased since the end of March while bond yields have fallen (Chart 4). In our view, this is the strongest piece of evidence suggesting that bond yields have overshot to the downside. Bonds Versus Currencies Chart 5Bonds Versus Currencies
Bonds Versus Currencies
Bonds Versus Currencies
Finally, we observe that the US dollar has strengthened as bond yields have dropped. This is not that unusual. There are other periods when significant declines in US bond yields have coincided with dollar strength, 2019 and 2014/15 immediately come to mind (Chart 5). The common theme of those prior episodes is that the global economy was experiencing a deflationary shock. Commodity prices also fell during those periods and Emerging Market (EM) currencies depreciated versus the dollar. However, so far this year, EM currencies have held firm versus the dollar (Chart 5, bottom panel) and commodity prices continue to rise. On balance, financial markets don’t appear to be pricing-in a deflationary economic shock. In summary, since US Treasury yields peaked on March 31st, we have observed a sector rotation within US equities, but overall stock market performance has been strong. Corporate bonds continue to outperform Treasuries, though gains are limited by tight valuations. Commodity prices have held up and while the US dollar has firmed, dollar strength has not bled into EM currency weakness. All in all, we don’t view financial market performance as consistent with a deflationary economic episode. This suggests that bond yields are an outlier within the financial landscape and that the recent drop in yields won’t persist. A Quick Word On Sentiment And Positioning Chart 6A Rebound In Yields May Require A Shift In Sentiment
A Rebound In Yields May Require A Shift In Sentiment
A Rebound In Yields May Require A Shift In Sentiment
One possible reason why bond performance has been inconsistent with some other markets is that there had simply been too much consensus around the “bond-bearish trade”. It’s certainly true that portfolio managers have been running large net-short positions and that the MarketVane survey of bond bullish sentiment is much less bullish than it was last year (Chart 6). We suspect that we may need to see bond market positioning and sentiment get more bullish before yields move meaningfully higher. Chart 6 shows that major troughs in the 30-year US Treasury yield often occur when portfolio manager positioning is “net long” bonds and when bond bullish sentiment is significantly higher than current levels. For this reason, we don’t anticipate an immediate rebound in bond yields. Rather, we suspect that yields will remain near current levels for the next month or two before strong employment data in the fall sets off the next phase of bearish bond action. Position For A Rebound In Bond Yields, But Don’t Expect Much Curve Steepening Chart 7The 5-Year/5-Year Yield Remains Close To Target
The 5-Year/5-Year Yield Remains Close To Target
The 5-Year/5-Year Yield Remains Close To Target
We see bond yields re-gaining their March 2021 highs, and then some, on a 6-12 month investment horizon. However, we don’t think this rebound in yields will coincide with a significant re-steepening of the US Treasury curve. For context, the 2/10 US Treasury slope peaked at 159 bps near the end of March. It is currently 51 bps lower, at 108 bps. We can categorize periods of yield curve steepening as falling into two categories. Bull-steepening: The curve steepens as yields fall. This tends to occur when the Fed is cutting interest rates. Bear-steepening: The curve steepens as yields rise. We can identify these periods as being when the 5-year/5-year forward Treasury yield rises from low levels toward its fair value range. Since 2012, we can identify a fair value range for the 5-year/5-year forward US Treasury yield using survey estimates of the long-run neutral fed funds rate. At present, the fair value range from the New York Fed’s Survey of Primary Dealers is from 2.06% to 2.50%, with a median of 2.31%. The fair value range from the New York Fed’s Survey of Market Participants is from 1.75% to 2.50%, with a median of 2.00%. The 5-year/5-year forward US Treasury yield is currently 1.93% (Chart 7). We identify seven significant periods of 2/10 Treasury curve steepening since 2009 (Table 1). Six of those episodes were bear-steepening episodes that coincided with an increase in the 5-year/5-year yield, the other was a bull-steepening episode that coincided with Fed rate cuts in 2019/20. If we assume that our fair value ranges provide a reasonable target for how high the 5-year/5-year forward US Treasury yield can rise during the next bear-steepening move, it means that – at most – we could see an increase of 57 bps in the 5-year/5-year yield as it moves all the way up to the 2.50% top-end of our target ranges. A linear regression of changes in the 2/10 slope versus changes in the 5-year/5-year forward yield during the six bear-steepening episodes we identified suggests that a 57 bps increase in the 5-year/5-year yield would lead to 12 bps of 2/10 curve steepening (Chart 8). In fact, we can see in both Table 1 and Chart 8 that it would take about 100 bps of upside in the 5-year/5-year yield to bring the 2/10 slope back to its March highs. This is extremely unlikely. Table 1Periods Of US Treasury Curve Steepening In The Zero-Lower-Bound Era
A Bump On The Road To Recovery
A Bump On The Road To Recovery
Chart 8Bear-Steepening Episodes Since 2009
A Bump On The Road To Recovery
A Bump On The Road To Recovery
In fact, if the 5-year/5-year forward Treasury yield only rises back to the middle of its fair value range – somewhere between 2% and 2.31% - then our regression suggests that the yield curve slope will probably stay close to its current level. The bottom line is that while investors should position for a rebound in bond yields by keeping portfolio duration low, they should avoid US Treasury curve steepeners. In fact, we advocate owning 2/10 flatteners on the US Treasury curve as we see ample room for further curve flattening as Fed rate hikes approach in late-2022. The ECB’s New Guidance Solidifies The Defensive Nature Of European Bonds Last week, the European Central Bank (ECB) revised its forward rate guidance in light of its recently concluded Strategy Review.2 The ECB’s new rate guidance is as follows: In support of its symmetric two per cent inflation target and in line with its monetary policy strategy, the Governing Council expects the key ECB interest rates to remain at their present or lower levels until it sees inflation reaching two per cent well ahead of the end of its projection horizon and durably for the rest of the projection horizon, and it judges that realised progress in underlying inflation is sufficiently advanced to be consistent with inflation stabilising at two per cent over the medium term. This may also imply a transitory period in which inflation is moderately above target.3 This may sound familiar, and it should. Though not explicitly an Average Inflation Target, the ECB has moved a long way toward the Federal Reserve’s new dovish reaction function. Specifically, both the ECB and Federal Reserve now acknowledge that a temporary period of above-2% inflation will be tolerated, if not explicitly sought. Also, both central banks have linked the timing of the first rate increase to some form of outcome-based forward guidance. The Federal Reserve has explicitly said that it will not lift rates until inflation is above 2% and the economy has reached “maximum employment”. The ECB now claims that interest rates won’t rise until inflation is seen reaching 2% “well ahead of its projection horizon”, a criterion that Christine Lagarde described as having an element of outcome-based guidance.4 The ECB’s new forward guidance may not be as explicitly dovish as the Fed’s. The ECB has no “maximum employment” target and its inflation trigger for lifting rates still relies on the Governing Council’s forecasts. But for investors, the big signal is that the ECB has recognized that the risk of tightening policy prematurely is greater than the risk of remaining on hold for too long. This gives us even more confidence that there will be no ECB tightening on the horizon, and we should continue to view European bond markets as being highly defensive. This is hardly news. European bond markets performed relatively well during the bearish bond episode that lasted from August 2020 to March 2021, they have then gained less than cyclical bond markets (like US and Canada) since March (Table 2). The ECB’s new reaction function ensures that this relationship will remain place for many years to come. Table 27-10 Year Government Bond Returns (In USD, %)
A Bump On The Road To Recovery
A Bump On The Road To Recovery
The new reaction function is also a boon for peripheral European bond markets (like Italy and Spain) where yields trade at a spread above German bunds. The ECB’s commitment to staying dovish will only reinforce the downward pressure on peripheral European bond spreads versus Germany (Chart 9). Chart 9Grab The Extra Spread In Spanish And Italian Bonds
Grab The Extra Spread In Spanish And Italian Bonds
Grab The Extra Spread In Spanish And Italian Bonds
The bottom line is that investors should continue to overweight European bonds within global fixed income portfolios, with a particular emphasis on peripheral European bond markets like Italy and Spain. The defensive nature of European bonds will protect investors from losses during the next move higher in global yields. Italian and Spanish bond markets may not perform quite as well during the next bond bear market as they did between August 2020 and March 2021, as spreads have already compressed a lot. But ultra-accommodative ECB policy will limit the amount of spread widening that can occur, making any additional spread worth grabbing. Ryan Swift US Bond Strategist rswift@bcaresearch.com Footnotes 1 Please see US Bond Strategy Weekly Report, “Overreaction”, dated July 13, 2021 and Global Fixed Income Strategy Weekly Report, “The Message From Falling US Bond Yields”, dated July 21, 2021. 2 The results of the Strategy Review itself are discussed in Global Fixed Income Strategy Weekly Report, “The Reflationary Backdrop Is Still In Place”, dated July 14, 2021. 3 https://www.ecb.europa.eu/press/pr/date/2021/html/ecb.mp210722~48dc3b436b.en.html 4 https://www.ecb.europa.eu/press/pressconf/2021/html/ecb.is210722~13e7f5e795.en.html Recommended Portfolio Specification Other Recommendations
A Bump On The Road To Recovery
A Bump On The Road To Recovery
Treasury Index Returns
A Bump On The Road To Recovery
A Bump On The Road To Recovery
Spread Product Returns
A Bump On The Road To Recovery
A Bump On The Road To Recovery
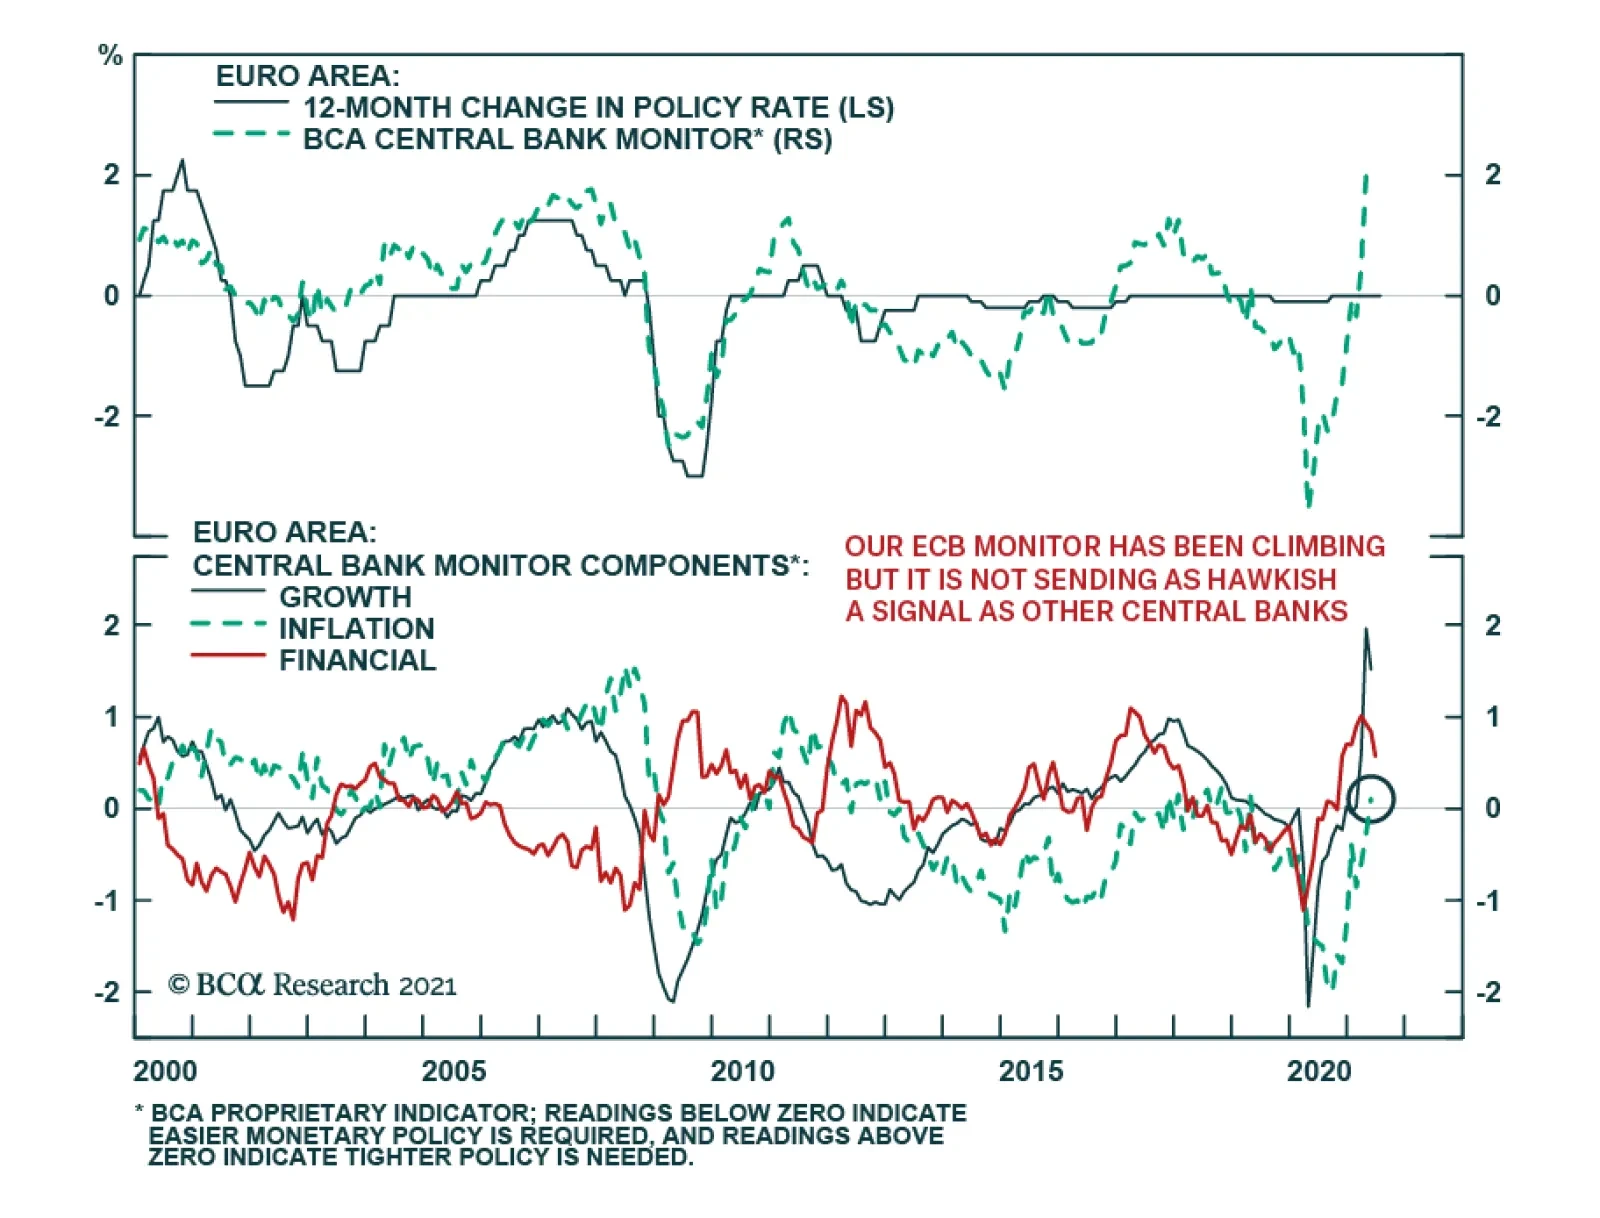
ECB messaging indicates that the central bank is in no rush to tighten policy. ECB President Christine Lagarde highlighted in a Bloomberg Television interview over the weekend that the pandemic remains a threat and that the central bank will continue to…
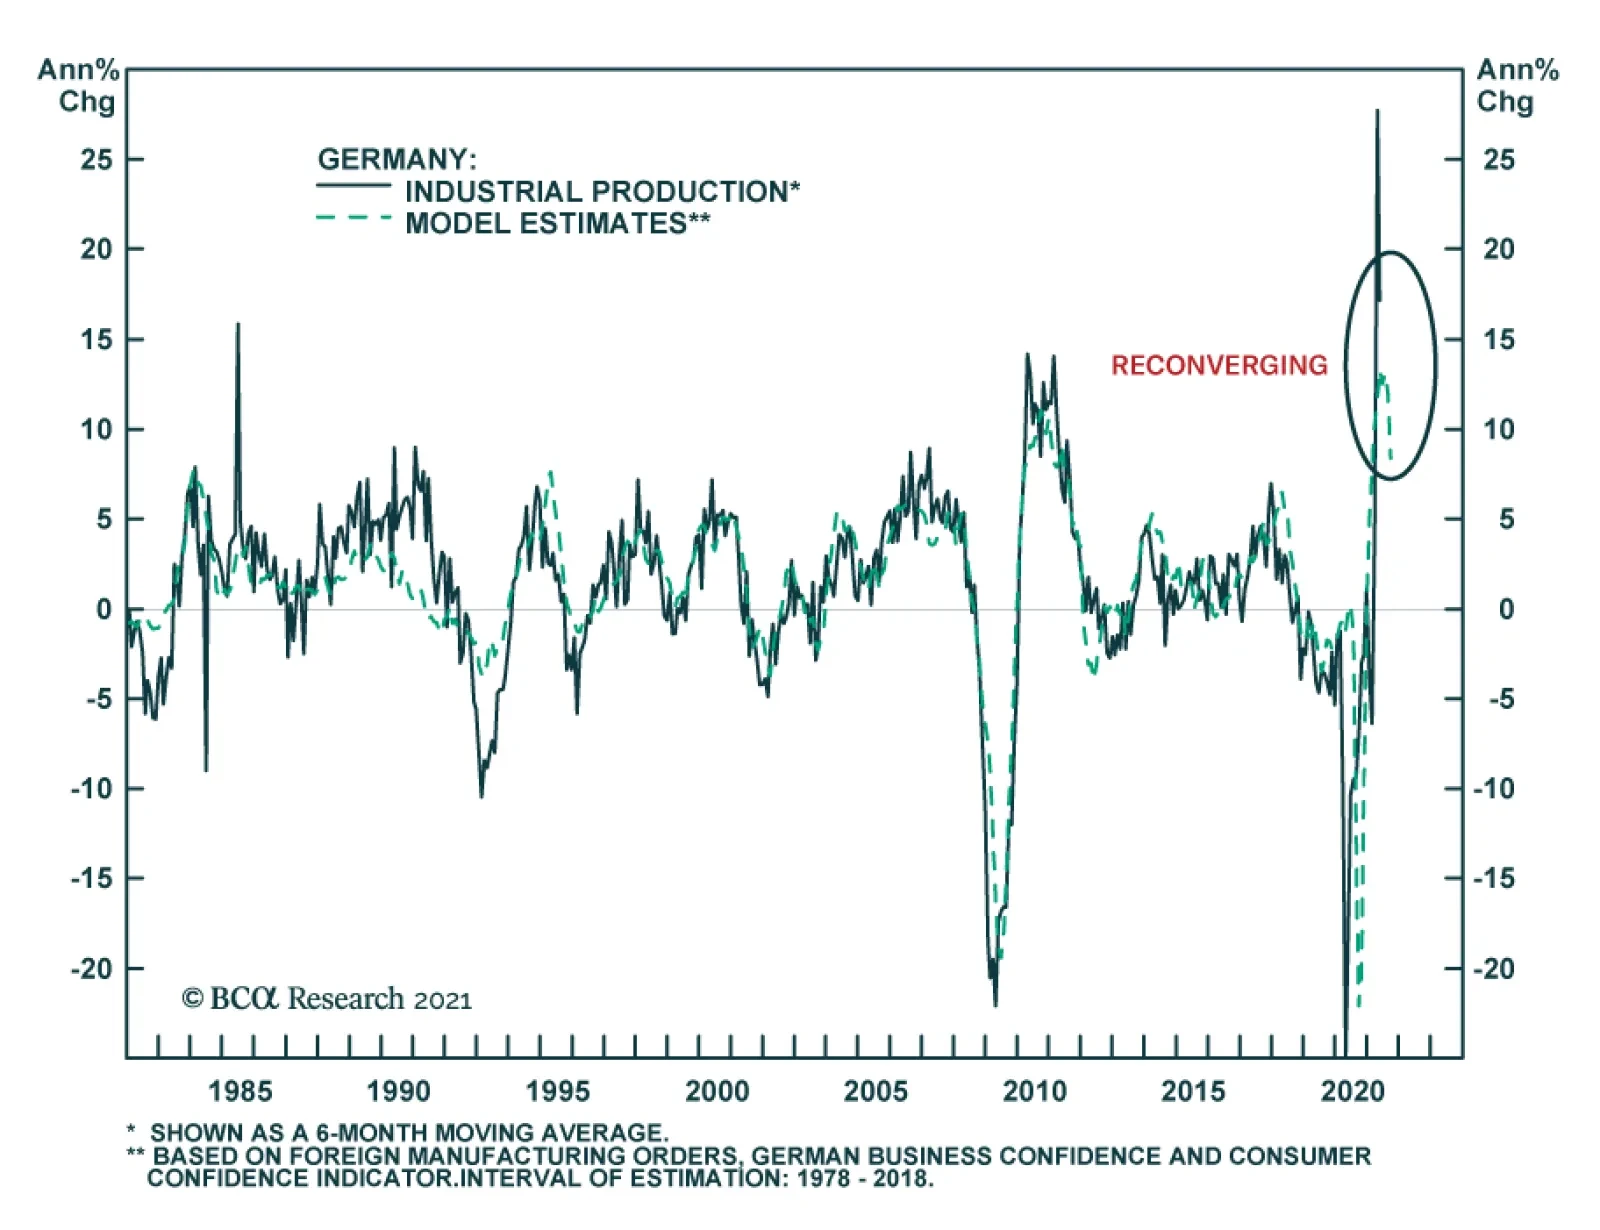
Germany’s May industrial production contracted for the second month in a row. Although it has underperformed market expectations of 0.5%, these results are rather unsurprising given the previous recovery pace of the past few months. In fact, the recent…