Euro Area

Highlights Sweden’s economic recovery is robust and will deepen. Policy is accommodative. Very few advanced economies will benefit as much from the global economic rebound. The labor market will tighten, capacity utilization will increase, and inflation will rise faster than the Riksbank forecasts. On a one- to two-year investment horizon, the SEK is a buy against both the USD and the EUR. Despite their pronounced outperformance, Swedish stocks possess significantly more upside against both Eurozone and US equities over the remainder of the cycle. Swedish industrials will beat their competitors in both these markets. Nonetheless, China’s policy tightening creates a meaningful tactical risk, which selling Norwegian stocks can hedge. Italy’s fiscal plan constitutes a new salvo in Europe’s efforts to avoid last decade’s mistakes. Feature Last week, the Swedish Riksbank did not follow in the footsteps of the Norges Bank. The Swedish central bank acknowledged that the economy is performing better than anticipated and that the housing market is gaining in strength; yet, it refrained from hinting at any forthcoming adjustment to its policy rate or the pace of its asset purchase program. The positive outlook for the Swedish economy will force the Riksbank to tighten policy significantly before the ECB. As a result, we expect the Swedish Krona to outperform the euro and the US dollar. Moreover, investors should continue to overweight Swedish equities due to their large exposure to industrials and financials, even if they have already significantly outperformed the Euro Area. Sweden’s Economic Outlook The Swedish economy will accelerate, which will put pressure on resource utilization and fan inflationary risk in the years ahead. The degree of stimulus supporting Sweden is consequential. Chart 1A Dual Labor Market
A Dual Labor Market
A Dual Labor Market
On the fiscal front, the government support measures that have been announced since the beginning of the COVID-19 crisis currently amount to SEK420bn, or SEK197bn for 2020 (4% of GDP), and SEK223bn for 2021 (4.5% of GDP). Moreover, generous labor market protection and part-time employment schemes meant that the number of employees in permanent employment contracts remained stable during the pandemic (Chart 1). Thus, the bulk of the rise in Swedish unemployment came from workers on fixed-term contracts. Monetary policy remains very accommodative as well. The Riksbank left its repo rate unchanged at 0% through the crisis, but cut its lending rate from 0.75% to 0.1%. More importantly, the Swedish central bank is aggressively injecting liquidity into the economy. It set up a SEK500bn funding-for-lending facility in order to incentivize bank lending to the nonfinancial private sector, and started a SEK700bn QE program, which as of Q1 2021 had purchased SEK380bn securities and which will purchase another SEK120bn in Q2, with covered bonds issued by banks accounting for 70% of it. As a result, the amount of securities held on the Riksbank balance sheet will nearly triple by year end (Chart 2). Chart 2The Riksbank Is Open For Business
Take A Chance On Sweden
Take A Chance On Sweden
Beyond the monetary and fiscal stimulus, many factors point to greater economic strength for Sweden. Despite a slow start to the process, as of last week, nearly 30% of the Swedish population had received at least one vaccine dose, which is broadly in line with vaccination rates prevalent in France or Germany. Crucially, the pace of vaccination is accelerating at a rate of 13% per week. Even if this second derivative slows, more than 70% of the population will have received at least one dose by this summer. Thus, greater mobility is in the cards during the second quarter, which will boost household spending. Chart 3The Wealth Effect
The Wealth Effect
The Wealth Effect
The housing market also favors a pick-up in consumption. The HOX housing price index is growing at a 15% annual rate, its fastest expansion in over 5 years. As a result of the wealth effect, this rapid appreciation is consistent with a swift improvement in the growth rate of household expenditures (Chart 3). Moreover, spending on durable goods now stands 1.3% above its pre-pandemic levels, while spending on non-durables is back to pre-pandemic levels. This context suggests that increased mobility translates into greater spending. The industrial sector remains a particularly bright spot in the Swedish economy. Sweden is extremely sensitive to the global industrial and trade cycle, because exports represent 45% of GDP. Moreover, the highly cyclical intermediate and capital goods comprise 56% of the country’s foreign shipments, which accentuates the beta of the Swedish economy. BCA Research remains optimistic about the global industrial cycle. Sweden will reap a significant dividend. Already the Swedish PMI points to stronger industrial production, and the index’s exports component is roaring ahead (Chart 4). The potential for a greater uptake in consumption, capex, and durable goods spending in the rest of the EU (Sweden’s largest trading partner) bodes well for the Swedish manufacturing sector. Additionally, if the collapse in the US inventory-to-sales ratio is any indication for the rest of the world, a global restocking cycle is forthcoming, which will further boost Swedish industrial activity (Chart 4, bottom panels). Finally, global public infrastructure plans are on the rise, which will also help Sweden. Chart 4Sweden Is well Placed
Sweden Is well Placed
Sweden Is well Placed
Chart 5Brightening Labor Market Prospects
Brightening Labor Market Prospects
Brightening Labor Market Prospects
In this context, the Swedish labor market should tighten significantly in the approaching quarters. Already, job vacancies are rebounding, and redundancy notices have normalized, which matches both the GDP growth surprise in Q1 and the continued rise in the NIER Sweden Economic Tendency Indicator. Furthermore, the employment component of the PMIs stands at 58.9 and is consistent with a sharp improvement in job growth over the coming year (Chart 5). The expected labor market growth will contribute to an increase in capacity utilization, which will place upward pressure on wages and inflation. When the 12-month moving average of US and Eurozone imports rises, so does the Riksbank Resource Utilization Indicator, because global trade has such a pronounced effect on the Swedish economy (Chart 6). Meanwhile, greater resource utilization leads to accelerated inflation, greater labor shortages, and rising unit labor costs (Chart 7). Chart 6CAPU Will Rise
CAPU Will Rise
CAPU Will Rise
Chart 7The Coming Pressure Buildup
The Coming Pressure Buildup
The Coming Pressure Buildup
Bottom Line: As a result of generous stimulus and the global economic recovery, the Swedish economy is set to continue its rebound. Consequently, employment and capacity utilization will improve meaningfully, which will lead to a resurgence of inflation and wages in the coming 24 months. Investment Implications On a 12 to 24 months horizon, we remain positive on the Swedish krona and Swedish equities. Fixed Income And FX Chart 8Three Hikes By 2025
Three Hikes By 2025
Three Hikes By 2025
The backend of the Swedish OIS curve only discounts 75bps of hikes by 2025. This pricing is too modest (Chart 8). The Swedish economy will rebound further as the vaccination campaign advances, and rising house prices and household indebtedness will fan growing long-term risk to financial stability, both of which suggest that the Riksbank will have to change its tack in 2022. The great likelihood that the Fed will start tapering off its asset purchase toward the end this year, that the ECB will follow sometime in 2022, and that the Norges Bank will be increasing interest rates next year will give more leeway to the Swedish central bank. A wider Sweden/Germany 10-year government bond spread is not an appealing vehicle to play a more hawkish Riksbank down the road. This spread hit a 23-year high in March and now rests at 62bps or its 98th percentile since 2000. Moreover, the terminal rate proxy embedded in the German money market curve is currently so low that the spread between Sweden’s and the Eurozone’s terminal rate proxy stands near a record high. Hence, German yields already embed much more pessimism than Swedish ones. Nonetheless, BCA recommends a below benchmark duration exposure within the Swedish fixed-income space, as we do for other government bond markets around the world.1 A bullish bias toward the SEK is a bet on the Riksbank that offers a very appealing risk/reward ratio, according to BCA Research’s Foreign Exchange Strategy strategists.2 The krona is very cheap against both the euro and the US dollar, trading at 9% and 29% discounts to purchasing power parity, respectively. Moreover, the Swedish current account stands at 5.2% of GDP, compared to 2.3% and -3.1% for the Euro Area and the US, creating a natural underpinning under the SEK. Chart 9The SEK Loves Growth
The SEK Loves Growth
The SEK Loves Growth
Over the coming 12 to 24 months, cyclical forces favor selling EUR/SEK and USD/SEK on any strength. The SEK is one of the most cyclical G-10 currencies and has one of the strongest sensitivities to the US dollar. Hence, our positive global economic outlook and our FX strategists negative view on the greenback are synonymous with a weak USD/SEK. These same factors also mean that the krona will appreciate more than the euro, as the negative correlation between EUR/SEK and our Boom/Bust Indicator and global earnings growth illustrate (Chart 9). Equities We also like Swedish equities, but the state of the Swedish economy and the evolution of the Riksbank policy surprise have a limited impact on Swedish equities. The Swedish bourse is mostly about the evolution of the global business cycle. The Swedish benchmark heightened sensitivity to the global business cycle reflects its massive overweight in deep cyclicals, with industrials, financials, consumer discretionary, and materials accounting for 38.4%, 26.1%, 9.7% and 3.7% of the MSCI index respectively, or 78% altogether (Table 1). As a result, BCA’s preference for global cyclicals at the expense of defensives and this publication’s fondness for the recovery laggards like the industrial and financial sectors automatically translate into a favorable bias toward Sweden’s stocks.3 Table 1Mamma Mia! That’s A Lot Of Cyclicals
Take A Chance On Sweden
Take A Chance On Sweden
Valuations offer a more complex picture, but they do not diminish our predilection for Sweden. Swedish equities trade at a discount to US stocks but at a premium to Euro Area ones (Chart 10). However, Swedish stocks offer higher RoEs and profit margins than both the US and the Euro Area, while also sporting lower leverage (Chart 11). Thus, their valuation premium to Euro Area stocks is warranted and their discount to US ones is excessive, especially when rising yields hurt the relative performance of the growth stocks that dominate US indexes. Chart 10Swedish Discounts And Premia
Swedish Discounts And Premia
Swedish Discounts And Premia
Chart 11Profitable Sweden
Profitable Sweden
Profitable Sweden
The outlook for Swedish earnings is appealing, both in absolute and relative terms. The Swedish market’s extreme sensitivity to global economic activity means that Sweden’s EPS increase and beat US profits when the Riksbank Resource Utilization Indicator expands (Chart 12). These relationships are artefacts of the Swedish economy’s pro-cyclicality, which causes capacity utilization to interweave tightly with the global business cycle (Chart 6). Chart 12The Winner Takes It All
The Winner Takes It All
The Winner Takes It All
Chart 13Better Capex Play Than You
Better Capex Play Than You
Better Capex Play Than You
Global capex and infrastructure spending favor Swedish equities compared to Euro Area ones. Over the past thirty years, Sweden’s stocks have outperformed those of the Eurozone when capital goods orders in the advanced economies have expanded (Chart 13). This reflects the Swedish benchmark’s large overweight in industrials, a sector that is the prime beneficiary of global capex. Capital goods orders are recovering well, and their growth rate can climb higher, especially as western multinationals announce capex plans and as governments from the US to Italy intend to ramp up infrastructure spending. Moreover, the large pent-up demand for durable goods in the Eurozone further enhances the potential of industrial firms, and thus, of Swedish equities.4 Chart 14Another Sign Of Pro-Cyclicality
Another Sign Of Pro-Cyclicality
Another Sign Of Pro-Cyclicality
BCA Research’s positive cyclical stance on commodities offers another reason to overweight Sweden’s market relative to that of the US and the Euro Area. Our Commodity and Energy Strategy sister service anticipates significant further upside for natural resources, especially base metals, over the remainder of the business cycle.5 Commodity prices still have room to rally, because demand will grow as the global economy continues to recover and because the supply of natural resources has been constrained by a decade of low investment. As a result, rising metal prices will symptomatize strong economic activity around the world and will incentivize capex in commodity extraction, both of which will boost the revenue of industrial firms. Furthermore, commodity price inflation often corresponds with rising yields, which boosts financials as well. These relationships explain the Swedish stocks’ outperformance of US and Eurozone stocks, when natural resource prices rally, despite the former’s low exposure to materials (Chart 14). At the sector level, the appeal of Swedish industrials relative to those of the Eurozone and the US completes the rationale to favor Swedish equities in a global portfolio. Swedish industrials are just as profitable as US ones and are more so than Euro Area ones, while having significantly lower leverage than either of them (Chart 15). Additionally, for the past two years, the EPS growth of Swedish industrials has bested that of US and Eurozone ones. Yet, their forward P/E ratio trades in line with the US and the Euro Area, while the sell-side’s long-term relative earnings growth estimate is too depressed (Chart 16). The same observations are valid when comparing Swedish industrials to French or German ones. Hence, in the context of a global business cycle upswing, buying Swedish industrials while selling their US and Euro Area competitors is an appealing pair trade, especially since it also involves short USD/SEK and short EUR/SEK bets. Chart 15Attractive Swedish Industrials...
Attractive Swedish Industrials...
Attractive Swedish Industrials...
Chart 16...And Not Expensive
...And Not Expensive
...And Not Expensive
Despite our optimism toward Swedish stocks on a 12 to 24 months basis, investors must hedge a near-term risk. Chinese authorities are aiming to contain financial excesses and trying to restrain credit growth. As we showed four weeks ago, China’s excess reserve ratio is contracting, which points toward a slowdown in the Chinese credit impulse.6 Historically, such a development can hurt global cyclicals, and thus, also Swedish equities. However, BCA Research’s China strategists believe that Beijing will not kill off the Chinese business cycle; thus, the recent disappointment in the Chinese PMI is transitory.7 Chart 17Industrials vs Materials: Europe vs China
Industrials vs Materials: Europe vs China
Industrials vs Materials: Europe vs China
Materials more than industrials will suffer the brunt of a China slowdown, as the re-opening trade and capex cycle among advanced economies will create a buffer for the latter. Indeed, the performance of global industrials relative to materials stocks correlates with the evolution of the spread between the Euro Area and Chinese PMI (Chart 17). Thus, we recommend selling Norwegian equities to hedge the tactical risk inherent in an overweight on Sweden. As Table 1 above shows, Norway overweighs materials and energy (two sectors greatly exposed to China), hence, a temporary pullback in commodity prices should hurt Norwegian stocks more than Swedish ones. Bottom Line: The SEK is an inexpensive and attractive vehicle to bet on both the global business cycle strength and the Swedish economic recovery. Thus, investors should use any rebound in EUR/SEK and USD/SEK to sell these pairs. Moreover, Swedish stocks greatly overweight cyclical sectors, particularly industrials and materials. This sectoral profile renders Swedish equities as attractive bets on the global economy. Additionally, Swedish shares display alluring operating metrics. As a result, we recommend investors go long Swedish industrials relative to those of the US and Euro Area. They should also overweight Swedish equities against the US and the Eurozone. Consequent to some China-related tactical risks, an underweight stance on Norwegian stocks constitutes an attractive hedge to this Swedish exposure. A Few Words On Italy’s National Recovery And Resilience Plan Mario Draghi’s plan to revive the Italian economy, announced last week, is an important marker of Europe’s changing relationship with fiscal policy. Last decade, excessive austerity contributed to subpar growth, ultimately firing up concerns about debt sustainability in many peripheral economies, and fueled risk premia in Italy and Spain. Under the cover of the current crisis, and in the face of the changing political winds in Brussel and Berlin where fiscal rectitude is not the mantra it once was, national European governments are beginning to propose ambitious fiscal stimulus plans. The National Recovery and Resilience program illustrates these dynamics. The EUR248bn plan is a testament to the importance of the NGEU recovery program as well as the REACT EU recovery fund. Through these facilities, the EU will contribute EUR191.5bn to the fiscal plan via grants and loans. Italy will contribute the remainder of the funds. While the total amount disbursed over the next six years corresponds to 14% of Italy’s 2019 GDP, the Draghi government estimates that the program will add 3.2 percentage points to GDP between 2024 and 2026. Importantly, markets are not rebelling. Despite expectations that Italy would continue to run an accommodative fiscal policy, the BTP/Bund spreads remain stable. We can expect this trend of greater stimulus to be mimicked around the EU. Spain is another large recipient of the NGEU program, and it too is likely to increase stimulus beyond what the EU will fund. France will hold an election in May 2022, and President Macron has all the incentives to stimulate the economy between now and then. If, as we wrote last week, Germany shifts to the left in September, then this outcome will be guaranteed. Bottom Line: The Draghi plan is the first salvo of greater fiscal stimulus in the EU. This trend will help Eurozone growth improve relative to the US over the coming few years. Despite a loose fiscal policy, BTPs and other peripheral bonds will continue to outperform on the back of declining risk premia. Mathieu Savary, Chief European Investment Strategist Mathieu@bcaresearch.com Footnotes 1Please see Global Fixed Income Strategy “GFIS Model Bond Portfolio Q1/2021 Performance Review & Current Allocations: Grand Reopening,” dated April 6, 2021, available at gfis.bcaresearch.com 2Please see Foreign Exchange Strategy “2021 Key Views: Tradeable Themes,” dated December 4, 2020, available at fes.bcaresearch.com 3Please see European Investment Strategy “Summer Of ‘21,” dated March 22, 2021, available at eis.bcaresearch.com 4Please see European Investment Strategy “Winds Of Change: Germany Goes Green,” dated April 23, 2021, available at eis.bcaresearch.com 5Please see Commodity & Energy Strategy “Industrial Commodities Super-Cycle Or Bull Market?” dated March 4, 2021, available at ces.bcaresearch.com 6Please see European Investment Strategy “The Euro Dance: One Step Back, Two Steps Forward,” dated March 29, 2021, available at eis.bcaresearch.com 7Please see China Investment Strategy “National People’s Congress Sets Tone For 2021 Growth,” dated March 17, 2021, available at cis.bcaresearch.com Cyclical Recommendations Structural Recommendations Currency Performance
Take A Chance On Sweden
Take A Chance On Sweden
Fixed Income Performance Government Bonds
Take A Chance On Sweden
Take A Chance On Sweden
Corporate Bonds
Take A Chance On Sweden
Take A Chance On Sweden
Equity Performance Major Stock Indices
Take A Chance On Sweden
Take A Chance On Sweden
Geographic Performance
Take A Chance On Sweden
Take A Chance On Sweden
Sector Performance
Take A Chance On Sweden
Take A Chance On Sweden
Closed Trades
Highlights The Greens are likely to win control of Germany’s government in the September 26 federal elections. At least they will be very influential in the new coalition. Germany has achieved may of its long-term geopolitical goals within the EU. There is consensus on dovish monetary and fiscal policy and hawkish environmental policy. The biggest changes will come from the outside. The US and Germany have a more difficult relationship. While they both oppose Russian and Chinese aggression, Germany will resist American aggression. The Christian Democrats have a 65% chance of remaining in government which would limit the Greens’ controversial and ambitious tax agenda. The 35% chance of a left-wing coalition will frontload fiscal stimulus for the sake of recovery. The economy is looking up and a Green-led fiscal easing would supercharge the recovery. However, coalition politics will likely fail to address Germany’s poor demography, deteriorating productivity, and large excess savings. On a cyclical basis, overweight peripheral European bonds relative to bunds; EUR/USD; and Italian and Spanish stocks relative to German stocks. Feature Chart 1Germans Turn To A Young Woman And A Green
Winds Of Change: Germany Goes Green
Winds Of Change: Germany Goes Green
Germany is set to become the first major country to be led by a green party. At very least the German election on September 26 will see an upset in which the ruling party under-performs and the Greens over-perform (Chart 1). At 30%, online betting markets are underrating the odds that Annalena Baerbock will become the first Green chancellor in 2022 – and the first elected chancellor to hail from a third party (Chart 2). The “German question” – the problem of how to unify Germany yet keep peace with the neighbors – lay at the heart of Europe for the past two centuries but today it appears substantially resolved: a peaceful and unified Germany stands at the center of a peaceful and mostly unified Europe. There are a range of risks on the horizon but this positive backdrop should be acknowledged. Chart 2Market Waking Up To Baerbock’s Bid For Chancellorship
Winds Of Change: Germany Goes Green
Winds Of Change: Germany Goes Green
All of the likeliest scenarios for the German election will reinforce the current situation by perpetuating policies that aim for Euro Area solidarity. Even the green shift is already well underway, though a Green-led government would supercharge it. Nevertheless this year’s election is important because it heralds a leftward shift in Germany and will shape fiscal, energy, industrial, and trade policy for at least the coming four years. A left-wing sweep would generate equity market excitement in the short run – a positive fiscal surprise to supercharge the post-pandemic rebound – but over the long run it would bring greater policy uncertainty because it would cause a break with the past and possibly a structural economic shift (Chart 3). The Greens are in favor of substantial increases in taxation and regulation as well as big changes in industrial and energy policy. In the absence of a left-wing sweep, coalition politics will be a muddle and Germany’s existing policies will continue. Chart 3German Policy Uncertainty On The Rise
German Policy Uncertainty On The Rise
German Policy Uncertainty On The Rise
Regardless of what happens within Germany, the geopolitical environment is increasingly dangerous. Germany will try to avoid getting drawn into the US’s great power struggles with Russia and China but it may not have a choice. Germany’s Geopolitics The difficulty of German unification stands at the center of modern European history. Because of the large and productive German-speaking population, unification in 1871 posed a security threat to the neighbors, culminating in the world wars. The peaceful German reunification after the Cold War created the potential for the EU to succeed and establish peace and prosperity on the continent. This arrangement has survived recent challenges. Germany’s relationship with the EU came under threat from the financial crisis, the Arab Spring and immigration influx, Brexit, and President Trump’s trade tariffs. But in the end these events cemented the reality that German and Europe are strengthening their bonds in the face of foreign pressures. Germany achieved what it had long sought – preeminence on the continent – by eschewing a military role, sticking to France economically, and avoiding conflict with Russia. Since Germany has achieved many of its long-sought strategic objectives it has not fallen victim to a nationalist backlash over the past ten years like the US and United Kingdom. However, Germany is not immune to populism or anti-establishment sentiment. The two main political blocs, the Christian Democrats and the Democratic Socialists, have suffered a loss of popular support in recent elections, forcing them into a grand coalition together. Anti-establishment feeling in Germany has moved the electorate to the left, in favor of the Greens. The Greens have risen inexorably over the past decade and have now seized the momentum only five months before an election (Chart 4). Yet the Greens in Germany are basically an establishment political party. They participate in 11 out of 16 state governments and currently hold the top position in Baden-Württemberg, Germany’s third most populous and productive state. From 1998-2005 they participated in government, getting their hands dirty with neoliberal structural reforms and overseas military deployments. Moreover the Greens cannot rule alone but will have to rule within a coalition, which will mediate their more controversial policies. Chart 4Greens Surge, Christian Democrats Falter
Greens Surge, Christian Democrats Falter
Greens Surge, Christian Democrats Falter
Today Germany is in lock step with France and the EU by meeting three key conditions: full monetary accommodation (the German constitutional court’s challenges to the European Central Bank are ineffectual), full fiscal accommodation (Chancellor Angela Merkel agreed to joint debt issuance and loose deficit controls amid the COVID-19 crisis as well as robust green energy policies), and full security accommodation (German rearmament exists within the context of NATO and European security aspirations are undertaken in lock-step with the French). These conditions will not change in the 2021 election even assuming that the Greens take power at the head of a left-wing coalition. Bottom Line: Germany has virtually achieved its grand strategic aims of unifying and ruling Europe. No German government will challenge this situation and every German government will strive to solidify it. The greatest risks to this setup stem from abroad rather than at home. The Return Of The German Question? Germany’s geopolitical position can be summarized by Chart 5, which shows popular views toward different countries and institutions. The Germans look positively upon the EU and global institutions like the United Nations and less so NATO. They look unfavorably upon everything else. They take an unfavorable view toward Russia, but not dramatically so, which shows their lack of interest in conflict with Russia – they do not want to be the battleground or the ramparts of another major European war. They dislike the United States and China even more, and equally. Even if attitudes toward the US have improved since the 2020 election the net unfavorability is telling. Chart 5Germany More Favorable Toward Russia Than US?
Winds Of Change: Germany Goes Green
Winds Of Change: Germany Goes Green
Since the global financial crisis, and especially Russia’s invasion of Ukraine in 2014, Germany has built up its military. This buildup is taking place under the prodding of the United States and in step with NATO allies, who are reacting to Russia’s military action to restore its sphere of influence in the former Soviet space (Chart 6). Germany’s military spending still falls short of NATO’s 2% of GDP target, however. It will not be seen as a threat to its neighbors as long as it remains integrated with France and Europe and geared toward deterring Russia. Chart 6Germany And NATO Increase Military Spending
Winds Of Change: Germany Goes Green
Winds Of Change: Germany Goes Green
Chart 7Watch Russo-German Relations For Cracks In Europe’s Edifice
Winds Of Change: Germany Goes Green
Winds Of Change: Germany Goes Green
Russia’s aggressiveness should continue to drive the Germans and Europeans into each other’s arms. This could change if Putin pursues diplomacy over military coercion, for then he could split Germany from eastern Europe. The possibility is clear from Russia’s and Germany’s current insistence on completing the Nord Stream 2 pipeline despite American and eastern European objections. The pipeline is set to be completed by September, right in time for the elections – in no small part because the Greens oppose it. If the US insists on halting the pipeline then a crisis will erupt with Russia that will humiliate Merkel and the Christian Democrats. But the US may refrain from doing so in the face of Russian military threats (odds are 50/50). The Russian positioning over 100,000 troops on the border with Ukraine this year – and now reportedly ordering them to return to base by May 1 – amounts to a test of Russo-German relations. Putin can easily expand the Russian footprint in Ukraine and tensions will remain elevated at least through the Russian legislative elections in September. Germans would respond to another invasion with sanctions, albeit likely watering down tougher sanctions proposed by the Americans. What would truly change the game would be a Russian conquest of all of Ukraine. This is unlikely – precisely because it would unite Germany, the Europeans, and the Americans solidly against Russia, to its economic loss as well as strategic disadvantage (Chart 7). China’s rise should also keep Germany bound up with Europe. The Germans fear China’s technological and manufacturing advancement, including Chinese involvement in digital infrastructure and networks. The Greens are critical of the way that carbon-heavy Chinese goods undercut the prices of carbon-lite German goods. Baerbock favors carbon adjustment fees, a pretty word for tariffs. However, the Germans want to maintain business with China and are not very afraid of China’s military. Hence there is a risk of a US-German split over the question of China. If Germany should consistently side with Russia and China over US objections then it risks attracting hostile attention from the US as well as from fellow Europeans, who will eventually fear that German power is becoming exorbitant by forming relations with giants outside the EU. But this is not the leading risk today. The US is courting Germany and seeking to renew the trans-Atlantic alliance. Meanwhile Germany needs US support against Russia’s military and China’s trade practices. US-German relations will improve unless the US forces Germany into an outright conflict with the autocratic powers. Bottom Line: The US and Germany have a more difficult relationship now than in the past but they share an interest in deterring Russian aggression and Chinese technological and trade ambitions. Biden’s attempt to confront these powers multilaterally is limited by Germany’s risk-aversion. Scenarios For The 2021 Election There are several realistic scenarios for the German election outcome. Our expectation that the Greens will form a government stems from a series of fundamental factors. Opinion polling has now clearly shifted in favor of our view, with the Greens gaining the momentum with only five months to go. Grouping the political parties into ideological blocs shows that the race is a dead heat. Our bet is that momentum will break in favor of the opposition Greens, which we explain below. Meanwhile the Free Democrats should perform well, stealing votes from the Christian Democrats. The right-wing Alternative für Deutschland (AfD), while not performing well, is persistent enough to poach some votes from the Christian Democrats. These are “lost” votes to the conservatives as none of the parties will join it in a coalition (Chart 8). Chart 8Germany's Median Voters Shifts To the Left
Germany's Median Voters Shifts To the Left
Germany's Median Voters Shifts To the Left
The Christian Democrats bear all the signs of a stale and vulnerable government. They have been in power for 16 years and their performance in state and federal elections has eroded recently, including this year (Table 1). The public is susceptible to the powerful idea that it is time for a change. Chancellor Merkel’s approval rating is still around 60%, but in freefall, and her successful legacy is not enough to save her party, which is showing all the signs of panic: succession issues, indecision, infighting, corruption scandals. The Greens will be “tax-and-spend” lefties but the coalition matters in terms of what can actually be legislated (Table 2).1 Table 1AChristian Democrats Fall, Greens Rise, In Recent State Elections
Winds Of Change: Germany Goes Green
Winds Of Change: Germany Goes Green
Table 1BChristian Democrats Fall, Greens Rise, In Recent State Elections
Winds Of Change: Germany Goes Green
Winds Of Change: Germany Goes Green
Table 2Policy Platforms Of The Green Party
Winds Of Change: Germany Goes Green
Winds Of Change: Germany Goes Green
The fact that Christian Democrats and their Bavarian sister party, the Christian Social Union, saw such a tough race for chancellor candidate is an ill omen. Moreover the party’s elites went for the safe choice of Merkel’s handpicked successor, Armin Laschet, over the more popular Markus Soeder (Chart 9), in a division that will likely haunt the party later this year. Chart 9Christian Democrats And Christian Social Union Divided Ahead Of Election
Winds Of Change: Germany Goes Green
Winds Of Change: Germany Goes Green
Laschet has received a bounce in polls with the nomination but it will be temporary. He has not cut a major figure in any polling prior to now. Chart 10Dissatisfaction Points To Government Change
Winds Of Change: Germany Goes Green
Winds Of Change: Germany Goes Green
He has quarreled openly with Merkel and the coalition over pandemic management. He was not her first choice of successor anyway – that was Annagret Kramp-Karrenbauer, who fell from grace due to controversy over the faintest hint of cooperation with the AfD. There is a manifest problem filling Merkel’s shoes. Even more important than coalition infighting is the fact that Germany, like the rest of the world, has suffered a historic shock to its economy and society. The pandemic and recession were then aggravated by a botched vaccine rollout. General dissatisfaction is high, another negative sign for the incumbent party (Chart 10). Of course, the election is still five months away. The vaccine will make its way around, the economy will reopen, and consumers will look up – see below for the very positive macro upturn that Germany should expect between now and the election. Voters have largely favored strict pandemic measures and Merkel will have long coattails. This Christian Democrats and Christian Social Union have ruled modern Germany for all but 15 years and have not fallen beneath 33% of the popular vote since reunification. The Greens have frequently aroused more energy in opinion polling than at the voting booth. With these points in mind, we offer the following election scenarios with our subjective probabilities: Green-Red-Red Coalition – Greens rule without Christian Democrats – 35% odds. Green-Black Coalition – Greens rule with Christian Democrats – 30% odds. Black-Green Coalition – Christian Democrats rule with Greens – 25% odds. Grand Coalition (Status Quo) – Christian Democrats rule without Greens – 10% odds. Our subjective probabilities are based on the opinion polls and online betting cited above but adjusted for the Greens’ momentum, the Christian Democrats’ internal divisions, the “time for change” factor, and the presence of a historic exogenous economic and social shock. Geopolitical surprises could occur before the election but they would most likely reinforce the Greens, since they have taken a hawkish line against Russia and China. Bottom Line: The Greens are likely to lead the next German government but at very least they will have a powerful influence. Policy Impacts Of Election Scenarios The makeup of the ruling coalition will determine the parameters of new policy. Fiscal policy will change based on the election outcome – both spending and taxes. The Greens will be “tax-and-spend” lefties but the coalition matters in terms of what can actually be legislated.2 The Greens’ idea is to “steer” the rebuilding process through environmental policy. But if the left lacks a strong majority then the Greens’ more controversial and punitive measures will not get through. Transformative policies will weigh heavily on the lower classes (Chart 11). Chart 11Ambitious Climate Policy Will Face Resistance
Winds Of Change: Germany Goes Green
Winds Of Change: Germany Goes Green
The policy dispositions of the various chancellor candidates help to illustrate Germany’s high degree of policy consensus. Table 3 looks at the candidates based on whether they are “hawkish” (active or offensive) or “dovish” (passive or defensive) on a given policy area. What stands out is the agreement among the different candidates despite party differences. Nobody is a fiscal or monetary hawk. Only Baerbock can be classified as a hawk on trade.3 Nobody is a hawk on immigration. Nearly everyone is a hawk on fighting climate change. And attitudes are turning more skeptical of Russia and China, though not outright hawkish. Table 3Policy Consensus Among German Chancellor Candidates
Winds Of Change: Germany Goes Green
Winds Of Change: Germany Goes Green
Germany will not abandon its green initiatives even if the Greens underperform. The current grand coalition pursued a climate package due to popular pressure even with the Greens in opposition. Germans are considerably more pro-environment even than other Europeans (Chart 12). The green shift is also happening across the world. The US is now joining the green race while China is doubling down for its own reasons. See the Appendix for current green targets and measures, which have been updated in the wake of a slew of announcements before Biden’s Earth Day climate summit on April 22-23. Chart 12Germans Care Even More About Environment Than Other Europeans
Winds Of Change: Germany Goes Green
Winds Of Change: Germany Goes Green
Any coalition will raise spending more than taxes since it will be focused on post-COVID economic recovery. There has been a long prelude to Germany’s proactive fiscal shift – it has staying power and is not to be dismissed. A Christian Democratic coalition would try to restore fiscal discipline sooner than otherwise but there is only a 5% chance that it will have the power to do so according to the scenarios given above. The rest of Europe will be motivated to spend aggressively while EU fiscal caps are on hold in 2022, especially if the German government is taking a more dovish turn. Even more than the US and UK, Germany is turning away from the neoliberal Washington Consensus. But Germans are not experiencing any kind of US-style surge of polarization and populism. At least not yet. It may be a risk over the long run, depending on the fate of the Christian Democrats, the AfD, and various internal and external developments. Bottom Line: Germany has a national consensus that consists of dovish monetary, fiscal, trade, and immigration policies and hawkish (pro-green) environmental policy. Germany is turning less dovish on geopolitical conflicts with Russia and China. Given that a coalition government is likely, this consensus is likely to determine actual policy in the wake of this year’s election. A few things are clear regardless of the ruling coalition. First, Germany is seeking domestic demand as a new source of growth, to rebalance its economy and deepen EU integration. Second, Germany is accelerating its green energy drive. Third, Germany cannot accept being in the middle of a new cold war with Russia. Fourth, Germany has an ambivalent policy on China. Germany’s Macro Outlook Even before considering the broader fiscal picture, the outlook for German economic activity over the course of the coming 12 to 24 months was already positive. Our base case scenario for the September election, which foresees a coalition government led by the Green Party, only confirms this optimistic view. However, Germany is still facing significant long-term challenges, and, so far, there has not been a political consensus to address these structural headwinds adequately. The Greens offer some solutions but not all of their proposals are constructive and much will depend on their parliamentary strength. Peering Into The Near-Term… Germany’s economy is set to benefit from the continued recovery of the global business cycle, which is a view at the core of BCA Research’s current outlook.4 Germany remains a trading and manufacturing powerhouse, and thus, it will reap a significant dividend from the continued global manufacturing upswing. Manufacturing and trade amount to 20% and 88% of Germany’s GDP, the highest percentage of any major economy. Alternatively, according to the OECD, foreign demand for German goods accounts for nearly 30% of domestic value added, a share even greater than that for a smaller economy like Korea (Chart 13). Moreover, road vehicles, machinery and other transport equipment, as well as chemicals and related products, account for 53% of Germany’s exports. These products are all particularly sensitive to the global business cycle. They will therefore enhance the performance of the German economy over the next two years. Trade with the rest of Europe constitutes another boost to Germany’s economy going forward. Shipments to the euro area and the rest of the EU account for 34% and 23% of Germany’s exports, or 57% overall. Right now, the lagging economy of Europe is a handicap for Germany; however, Europe has more pent-up demand than the US, and the consumption of durable goods will surge once the vaccination campaign progresses further (Chart 14). This will create a significant boon for Germany, since we expect European consumption to pick up meaningfully over the coming 12 to 18 months.5 Chart 13Germany Depends On Global Trade
Winds Of Change: Germany Goes Green
Winds Of Change: Germany Goes Green
Chart 14Europe Has More Pent-Up Demand Than The US
Europe Has More Pent-Up Demand Than The US
Europe Has More Pent-Up Demand Than The US
Chart 15Vaccination Progress
Vaccination Progress
Vaccination Progress
Domestic forces also point toward a strong Germany economy, not just foreign factors. The pace of vaccination is rapidly accelerating in Germany (Chart 15). The recent announcement of 50 million additional doses purchases for the quarter and up to 1.8 billion more doses over the next two years by the EU points to further improvements. A more broad-based vaccination effort will catalyze underlying tailwinds to consumption. German household income will also progress significantly. The Kurzarbeit program was instrumental in containing the unemployment rate during the crisis, which only peaked at 6.4% from 5% in early 2020. However, the program could not prevent a sharp decline in total hours worked of 7%, since by definition, it forced six million employees to work reduced hours (Chart 16). One of the great benefits of the program is that it prevents a rupture of the link between workers and employers. Thus, the economy suffers less frictional unemployment as activity recovers and household income does not suffer long lasting damage. Meanwhile, the German government is likely to extend the support for households and businesses as a result of the delayed use of the debt-brake. The Greens propose revising the debt brake rather than restoring it in 2022 like the conservatives pledge to do. Chart 16Kurtzarbeit Saved The Day
Kurtzarbeit Saved The Day
Kurtzarbeit Saved The Day
The balance-sheet strength of German households means that they will have the wherewithal to spend these growing incomes. Residential real estate prices are rising at an 8% annual pace, which is pushing the asset-to-disposable income ratio to record highs. Meanwhile, the debt-to-assets ratio, and the level of interest rates are also very low, which means that the burden of serving existing liabilities is minimal (Chart 17). In this context, durable goods spending will accelerate, which will lift overall cyclical spending, even if German households do not spend much of the EUR120 billion in excess savings built up over the past year. As Chart 18 shows, while US durable goods spending has already overtaken its pre-COVID highs, Germany’s continues to linger near its long-term trend. Thus, as the economy re-opens this summer, and income and employment increase, the concurrent surge in consumer confidence will allow for a recovery in cyclical spending. Chart 17Strong Household Balance Sheets
Strong Household Balance Sheets
Strong Household Balance Sheets
Chart 18Germany Too Has More Pent-up Demand Than The US
Germany Too Has More Pent-up Demand Than The US
Germany Too Has More Pent-up Demand Than The US
Chart 19Positive Message From Many Indicators
Positive Message From Many Indicators
Positive Message From Many Indicators
Various economic indicators are already pointing toward the coming German economic boom.Manufacturing orders are strong, and economic sentiment confidence is rising across most sectors. Meanwhile, consumer optimism is forming a trough, and new car registrations are climbing rapidly. Most positively, the stocks of finished goods have collapsed, which suggests that production will be ramped up to fulfill future demand (Chart 19). Bottom Line: The German economy is set to accelerate in the second half of the year and into 2022. As usual, Germany will enjoy a healthy dividend from robust global growth, but the expanding vaccination program, as well durable employee-employer relations, strong household balance sheets, and significant pent-up demand for durable goods will also fuel the domestic economy. Our base case scenario that fiscal policy will remain accommodative in the wake of a political shift to the left in Berlin in September will only supercharge this inevitable recovery. … And The Long-Term In contrast to the bright near-term perspective, the long-term outlook for the German economy remains poor. The policies of any new ruling coalition are unlikely to address the problems of Germany’s poor demography, deteriorating productivity, and large excess savings. There is potential for a productivity boost in the context of a global green energy and high-tech race but for now that remains a matter of speculation. The most obvious issue facing Germany is its ageing population, counterbalanced by its fertility rate of only 1.6. Over the course of the next three decades, Germany’s dependency ratio will surge to 80%, driven by an increase in the elderly dependency ratio of 20% (Chart 20). The working age population is set to decline by 18% by 2050, which will curtail potential GDP growth. The outlook for German productivity growth is also poor. Germany’s productivity growth has been in a long-term decline, falling from 5% in 1975 to less than 1% in 2019. Contrary to commonly-held ideas, from 1999 to 2007, German labor productivity growth has only matched that of France or Spain; since 2008, it has lagged behind these two nations, although it has bested Italy. One crucial reason for Germany’s uninspiring productivity performance is a lack of investment. Some of this reflects the country’s austere fiscal policy. For example, in 2019, Germany’s public investment stood at 2.4% of GDP, which compares poorly to the OECD’s average of 3.8%, or even to that of the US, where public investment stood at 3.6% of GDP. This poor statistic does not even account for the depreciation of the German public capital stock. Since the introduction of the euro, net public investment has averaged 0.03% of GDP. The biggest problem remains at the municipal level. From 2012 to 2019, federal and state level net investment averaged 0.2% of GDP, while municipal net investment subtracted 0.2% of GDP on average. Hopefully, the new government will be able to address this deficiency of the German economy. The Greens are most proactive but they will face obstacles. The bigger problem for German productivity is corporate capex. Corporate investments have been low in this country. Since the introduction of the euro, the contribution of capital intensity to productivity in Germany has equaled that of Italy and has underperformed France and Spain. As a result, the age of the German capital stock is at a record high and stands well above the US or Eurozone average (Chart 21). Chart 20Germany Has Poor Demographics
Germany Has Poor Demographics
Germany Has Poor Demographics
Chart 21Germany's Capital Stock Is Ageing
Germany's Capital Stock Is Ageing
Germany's Capital Stock Is Ageing
The make-up of Germany’s capex aggravates the productivity-handicap. According to a Bundesbank study, the contribution to labor productivity from information and communication technology (ICT) capital spending has averaged 0.05 percentage points annually from 2008 to 2012. On this metric, Germany lagged behind France and the US, but still bested Italy. From 2013 to 2017, the contribution of ICT investment to productivity fell to 0.02 percentage points, still below France and the US, but in line with Italy. Looking at the absolute level of ICT or knowledge-based capital (KBC) investment further highlights Germany’s challenge. In 2016, total investment in ICT equipment, software and database, R&D and intellectual property products, and other KBC assets (which include organizational capital and training) represented less than 8% of GDP. In France, the US, or Sweden, these outlays accounted for 11%, 12%, and 13% of GDP, respectively (Chart 22, top panel). This lack of investment directly hurts Germany’s capacity to innovate. The bottom panel of Chart 22 shows that, for the eight most important categories of ICT patents (accounting for 80% of total ICT patents), Germany remarkably lags behind the US, Japan, Korea, or China. Chart 22Germany Lags In ICT investment
Winds Of Change: Germany Goes Green
Winds Of Change: Germany Goes Green
A major source of Germany’s handicap in ICT and KBC investment comes from small businesses, which have been particularly reluctant to deploy capital. A study by the OECD shows that, between 2010 and 2019, the gap of ICT tools and activities adoption between Germany’s small and large companies deteriorated relative to the OECD average (Chart 23). The lack of venture capital investing probably exacerbates these problems. In 2019, venture capital investing accounted for 0.06% of Germany’s GDP. This is below the level of venture investing in France or the UK (0.08% and 0.1% of GDP, respectively), let alone South Korea, Canada, Israel, or the US (0.16%, 0.2%, 0.4% and 0.65%, respectively). The Greens claim they will create new venture capital funds but their capability in this domain is questionable. Chart 23The Lagging ICT Capabilities Of Small German Businesses
Winds Of Change: Germany Goes Green
Winds Of Change: Germany Goes Green
Since Germany’s productivity growth is likely to remain sub-par compared to rest of the OECD and to lag behind even that of France or the UK, the only way for Germany to protect its competitiveness will be to control costs. This means that Germany cannot allow its recent loss of competitiveness to continue much further (Chart 24). Thus, low productivity growth will limit Germany’s real wages. Chart 24Germany's Competitiveness Is Declining
Germany's Competitiveness Is Declining
Germany's Competitiveness Is Declining
This wage constraint will negatively impact consumption. Beyond a pop over the coming 12 to 24 months, German consumption is likely to remain depressed, as it was in the first decade and a half of the century, following the Hartz IV labor market reforms that also hurt real wages. The Greens for their part aim to boost welfare payments, raise the minimum wage, and reduce enforcement of Hartz IV. Bottom Line: German excess savings will remain wide on a structural basis. Without a meaningful pick-up in capex, German nonfinancial businesses will remain net lenders. Meanwhile, households that were worried about their financial future in a world of low real-wage growth will also continue to save a significant share of their income. Consequently, the excess savings Germany developed since the turn of the millennia are here to stay (Chart 25). In other words, Germany will continue to sport a large current account surplus and exert a deflationary influence on Europe and the rest of the world. The policy prescribed by the various parties contesting the September election will not necessarily result in new laws that will reverse the issues of low capex and low ICT investment. The Greens will worsen the over-regulation of the economy. Barring a policy revolution that succeeds in all its aims (a tall order), we can expect more of the same for Germany – that is, a slowly declining economy. Chart 25Too Much Savings, Not Enough Investments
Too Much Savings, Not Enough Investments
Too Much Savings, Not Enough Investments
Chart 26Germany Scores Well On Renewable Power
Winds Of Change: Germany Goes Green
Winds Of Change: Germany Goes Green
That being said, some bright spots exist. Germany is becoming a leader in renewable energy, and it can capitalize on the broadening of this trend to enlarge its export market (Chart 26). Investment Implications Bond Markets The economic outlook for Germany and the euro area at large is consistent with the underweighting of German bunds within European fixed-income portfolios. Bunds rank among the most expensive bond markets in the world, which will make them extremely vulnerable to positive economic surprise in Europe later this year, especially if Germany’s fiscal policy loosens up further in the wake of the September election (Chart 27). Moreover, easier German fiscal policy should help European peripheral bonds, especially the inexpensive Italian BTPs that the ECB currently buys aggressively. Thus, we continue to overweight BTPs, and add Greek and Portuguese bonds to the list. Chart 27German Bunds Are Expensive
Winds Of Change: Germany Goes Green
Winds Of Change: Germany Goes Green
Chart 28German Yields Already Embed Plenty Pessimism About Europe
German Yields Already Embed Plenty Pessimism About Europe
German Yields Already Embed Plenty Pessimism About Europe
Relative to US Treasurys, the outlook for Bunds is more complex. On the one hand, the ECB will not tighten policy as much as the Fed later this cycle; moreover, European inflation is likely to remain below US levels this year, as well as through the business cycle. On the other hand, Bunds already embed a significantly lower real terminal rate proxy and term premium than Treasury Notes (Chart 28). Netting it all out, BCA Research Global Fixed Income Strategy service believes Bunds should outperform Treasurys this year, because they have a lower beta, which is a valuable feature in a rising yield environment.6 We will closely monitor risks around this view, because it is likely that the European economic recovery will be the catalyst for the next up leg in global yields, in which case German bunds could temporarily underperform. On a structural basis, as long as Germany’s productivity issues are not addressed by Berlin, German Bunds are likely to remain an anchor for global yields. Germany will remain awash in excess savings, which will act as a deflationary anchor, while also limiting the long-term upside for European real rates. Excess savings results in a large current account surplus; thus, Germany will continue to export its savings abroad and act as a containing factor for global yields. The Euro The medium-term outlook points to significant euro upside. Our expectation of a European and German positive growth surprise over the coming 12 months is consistent with an outperformance of the euro. The fact that investors have been moving funds out of the Eurozone and into the US at an almost constant rate for the past 10 years only lends credence to this argument (Chart 29). Our view on Germany’s fiscal policy contributes to the euro’s luster. Greater German budget deficits help European economic activity and curtail risk premia across the Eurozone. This process is doubly positive for the euro. First, lower risk premia in the periphery invite inflows into the euro area, especially since Greek, Portuguese, Italian, or Spanish yields offer better value than alternatives. Second, stronger growth and lower risk premia relieve pressure on the ECB as the sole reflator for the Eurozone. At the margin, this process should boost the extremely depressed terminal rate proxy for Europe and help EUR/USD. Robust global economic activity adds to the euro’s appeal, beyond the positive domestic forces at play in Europe. The dollar is a countercyclical currency; thus, global business cycle upswings coincide with a weak USD, which increases EUR/USD’s appeal. Nonetheless, if the boost to global activity emanates from the US, then the dollar can strengthen. This phenomenon was at play in the first quarter of 2021. However, the global growth leadership is set to move away from the US over the next 12 months, which implies that the normal inverse relationship between the dollar and global growth will reassert itself to the euro’s benefit. The European balance of payments dynamics will consolidate the attraction of the euro. Germany’s and the Eurozone’s current account surplus will remain wide, especially in comparison to the expanding twin deficit plaguing the US. Beyond the next 12 to 24 months, the lack of structural vigor of Germany’s and Europe’s economy is likely to shift the euro into a safe-haven currency, like the yen and the Swiss franc. A strong balance of payments and low interest rates (all symptoms of excess savings) are the defining features of funding currencies, and will be permanent attributes of the euro area if reforms do not address its productivity malaise. The Eurozone’s net international position is already rising and its low inflation will put a structural upward bias to the Euro’s purchasing power parity estimates (Chart 30). Those developments have all been evident in Japan and Switzerland, and will likely extinguish the euro’s pro-cyclicality as time passes. Chart 29Investors Already Underweight European Assets
Investors Already Underweight European Assets
Investors Already Underweight European Assets
Chart 30Upward Bias In The Euro's Fair Value
Upward Bias In The Euro's Fair Value
Upward Bias In The Euro's Fair Value
Chart 31Germany Has Not Outperformed The Rest Of The Eurozone
Germany Has Not Outperformed The Rest Of The Eurozone
Germany Has Not Outperformed The Rest Of The Eurozone
German Equities In absolute terms, the DAX and German equities still possess ample upside over the next 12 to 24 months. BCA Research is assuming a positive stance on equities, and a high beta market like Germany stands to benefit.7 Moreover, the elevated sensitivity to global economic activity of German equities accentuate their appeal. BCA Research likes European stocks, and German ones are no exception.8 The more complex question is how to position German equities within a European stock portfolio. After massively outperforming from 2003 to 2012, German equities have moved in line with the rest of the Eurozone ever since (Chart 31). Moreover, German equities now trade at a discount on all the major valuation metrics relative to the rest of the Eurozone (Chart 31, bottom panel). The global macro forces that dictate the outlook for German equities relative to the rest of the Eurozone are currently sending conflicting messages. On the one hand, German equities normally outperform when commodity prices rally or when the euro appreciates (Chart 32). On the other hand, however, German equities also underperform when global yields rise, or following periods when Chinese excess reserves fall, such as what we are witnessing today. With this lack of clarity from global forces, the answer to Germany’s relative performance question lies within European economic dynamics. Germany is losing competitiveness relative to the rest of the Eurozone (Chart 24 page 22) which suggests that German stocks will benefit less than their peers from a stronger euro in comparison to their performance in the last decade. Moreover, German equities outperform when the German manufacturing PMI increases relative to that of the broad euro area. The gap between the German and euro area manufacturing PMI stands near record highs and is likely to narrow as the rest of the Eurozone catches up. This should have a bearing on the performance of German stocks (Chart 33). Chart 32Mixed Global Backdrop For Germany's Relative Performance
Mixed Global Backdrop For Germany's Relative Performance
Mixed Global Backdrop For Germany's Relative Performance
Chart 33A European Economic Catch-Up Would Hurt German Equities
A European Economic Catch-Up Would Hurt German Equities
A European Economic Catch-Up Would Hurt German Equities
Finally, sectoral dynamics may prove to be the ultimate arbiter. Table 4 highlights the limited difference in sectoral weightings between Germany and the rest of the Eurozone, which helps explain the stability in the relative performance over the past nine years. However, the variance is greater between Germany and specific European nations. In this approach, BCA’s negative stance on growth stocks correlates with an overweight of Germany relative to the Netherlands. Moreover, our positive outlook on financials and bond yields suggests that Germany should underperform Italian and Spanish stocks. Table 4Sectoral Breakdown Across Europe Major Bourses
Winds Of Change: Germany Goes Green
Winds Of Change: Germany Goes Green
Matt Gertken Vice President Geopolitical Strategy mattg@bcaresearch.com Mathieu Savary, Chief European Investment Strategist Mathieu@bcaresearch.com Appendix: Global Climate Policy Commitments
Winds Of Change: Germany Goes Green
Winds Of Change: Germany Goes Green
Winds Of Change: Germany Goes Green
Winds Of Change: Germany Goes Green
Footnotes 1 See Matthew Karnitschnig, "German Conservatives Mired In ‘The Swamp,’" Politico, March 24, 2021, politico.eu. 2 The Greens are interested in a range of taxes, including a carbon tax, a digital services tax, and a financial transactions tax. They are also interested in industrial quotas requiring steel and car makers to sell a certain proportion of carbon-neutral steel and electric vehicles. See an excellent interview with Ms. Baerbock in Ileana Grabitz and Katharina Schuler, "I don’t have to convert the SUV driver in Prenzlauer Berg," Zeit Online, January 2, 2020, zeit.de. 3 See her comments to Zeit Online. 4 Please see BCA Research Global Investment Strategy Strategy Outlook "Second Quarter 2021 Strategy Outlook: Inflation Cometh?", dated March 26, 2021, available at gis.bcareseach.com. 5 Please see BCA Research European Investment Strategy Special Report "A Temporary Decoupling", dated April 5, 2021, available at eis.bcareseach.com. 6 Please see BCA Research Global Fixed Income Strategy Strategy Report "Harder, Better, Faster, Stronger", dated March 16, 2021, available at gfis.bcareseach.com. 7 Please see BCA Research Global Income Strategy Strategy Outlook "Second Quarter 2021 Strategy Outlook: Inflation Cometh?", dated March 26, 2021, available at gis.bcareseach.com. 8 Please see BCA Research European Income Strategy Strategy Report "Time And Attraction", dated April 12, 2021, available at eis.bcareseach.com.
Highlights Stronger global growth in the wake of continued and expected fiscal and monetary stimulus, and progress against COVID-19 are boosting oil demand assumptions by the major data suppliers for this year. We lifted our 2021 global demand estimate by 640k b/d to 98.25mm b/d, and assume OPEC 2.0 will make the necessary adjustments to keep Brent prices closer to $60/bbl than not, so as not to disrupt a fragile recovery. We are maintaining our 2022 and 2023 Brent forecasts at $65/bbl and $75/bbl. Commodity markets are ignoring the rising odds of armed conflict involving the US, Russia and China and their clients and allies. Russia has massed troops on Ukraine’s border and warned the US not to interfere. China has massed warships off the coast of the Philippines, and continues its incursions in Taiwan’s air-defense zone, keeping US forces on alert. Intentional or accidental engagement would spike oil prices. Two-way price risk abounds. In addition to the risk of armed hostilities, faster distribution of vaccines would accelerate recovery and boost prices above our forecasts. Downside risk of a resurgence in COVID-19-induced lockdowns remains, as rising death and hospitalization rates in Brazil, India and Europe attest (Chart of the Week). Feature Oil-demand estimates – ours included – are reviving in the wake of measurable progress in combating the COVID-19 pandemic in major economies, and an abundance of fiscal and monetary stimulus, particularly out of the US.1 On the back of higher IMF GDP projections, we lifted our 2021 global demand estimate by 640k b/d to 98.25mm b/d in this month’s balances. In our modeling, we assume OPEC 2.0 will make the necessary adjustments to keep Brent prices closer to $60/bbl than not, so as not to disrupt a fragile recovery. In an unusual turn of events, the early stages of the recovery in oil demand will be led by DM markets, which we proxy using OECD oil consumption (Chart 2). Thereafter, EM economies, re-take the growth lead next year and into 2023. Chart of the WeekCOVID-19 Deaths, Hospitalizations Threaten Global Recovery
Upside Oil Price Risks Are Increasing
Upside Oil Price Risks Are Increasing
Chart 2DM Demand Surges This Year
DM Demand Surges This Year
DM Demand Surges This Year
Absorbing OPEC 2.0 Spare Capacity We continue to model OPEC 2.0, the producer coalition led by the Kingdom of Saudi Arabia (KSA) and Russia, as the dominant producer in the market. The growth we are expecting this year will absorb a significant share of OPEC 2.0’s spare capacity, most of which – ~ 6mm b/d of the ~ 8mm b/d – is to be found in KSA (Chart 3). The core producers’ spare capacity allows them to meet recovering demand faster than the US shale producers can mobilize rigs and crews and get new supply into gathering lines and on to main lines. We model the US shale producers as a price-taking cohort, who will produce whatever the market allows them to produce. After falling to 9.22mm b/d in 2020, we expect US production to recover to 9.56mm b/d this year, 10.65mm b/d in 2022, and 11.18mm in 2023 (Chart 4). Lower 48 production growth in the US will be led by the shales, which will account for ~ 80% of total US output each year. Chart 3Core OPEC 2.0 Spare Capacity Will Respond First To Higher Demand
Core OPEC 2.0 Spare Capacity Will Respond First To Higher Demand
Core OPEC 2.0 Spare Capacity Will Respond First To Higher Demand
Chart 4Shale Is The Marginal Barrel In The Price Taking Cohort
Shale Is The Marginal Barrel In The Price Taking Cohort
Shale Is The Marginal Barrel In The Price Taking Cohort
OPEC 2.0’s dominant position on the supply side allows it to capture economic rents before non-coalition producers, which will remain a disincentive to them until the spare capacity is exhausted. Thereafter, the price-taking cohort likely will fund much of its E+P activities out of retained earnings, given their limited ability to attract capital. Equity investors will continue to demand dividends that can be maintained and grown, or return of capital via share buybacks. This will restrain production growth to those firms that are profitable. We expect the OPEC 2.0 coalition’s production discipline will keep supply levels just below demand so that inventories continue to fall, just as they have done during the COVID-19 pandemic, despite the demand destruction it caused (Chart 5). These modeling assumptions lead us to continue to expect supply and demand will continue to move toward balance into 2023 (Table 1). Chart 5Supply-Demand Balances in 2021
Supply-Demand Balances in 2021
Supply-Demand Balances in 2021
Table 1BCA Global Oil Supply - Demand Balances (MMb/d, Base Case Balances)
Upside Oil Price Risks Are Increasing
Upside Oil Price Risks Are Increasing
We continue to expect this balancing to induce persistent physical deficits, which will keep inventories falling into 2023 (Chart 6). As inventories are drawn, OPEC 2.0’s dominant-producer position will allow it to will keep the Brent and WTI forward curves backwardated (Chart 7).2 We are maintaining our 2022 and 2023 Brent forecasts at $65/bbl and $75/bbl (Chart 8). Chart 6OPEC 2.0 Policy Continues To Keep Supply Below Demand...
OPEC 2.0 Policy Continues To Keep Supply Below Demand...
OPEC 2.0 Policy Continues To Keep Supply Below Demand...
Chart 7OECD Inventories Fall to 2023
OECD Inventories Fall to 2023
OECD Inventories Fall to 2023
Chart 8Brent Forecasts Rise As Global Economy Recovers
Brent Forecasts Rise As Global Economy Recovers
Brent Forecasts Rise As Global Economy Recovers
Two-Way Price Risk Abounds Risks to our views abound on the upside and the downside. To the upside, the example of the UK and the US in mobilizing its distribution of vaccines is instructive. Both states got off to a rough start, particularly the US, which did not seem to have a strategy in place as recently as January. After the US kicked its procurement and distribution into high gear its vaccination rates soared and now appear to be on track to deliver a “normal” Fourth of July holiday in the US. The UK has begun its reopening this week. Both states are expected to achieve herd immunity in 3Q21.3 The EU, which mishandled its procurement and distribution likely benefits from lessons learned in the UK and US and achieves herd immunity in 4Q21, according to McKinsey’s research. Any acceleration in this timetable likely would lead to stronger growth and higher oil prices. The next big task for the global community will be making vaccines available to EM economies, particularly those in which the pandemic is accelerating and providing the ideal setting for mutations and the spread of variants that could become difficult to contain. The risk of a resurgence in large-scale COVID-19-induced lockdowns remains, as rising death and hospitalization rates in Brazil, India and Europe attest. Cry Havoc The other big upside risk we see is armed conflict involving the US, Russia, China and their clients and allies. Commodity markets are ignoring these risks at present. Even though they do not rise to the level of war, the odds of kinetic engagement – planes being shot down or ships engaging in battle in the South China Sea – are rising on a daily basis. This is not unexpected, as our colleagues in BCA Research’s Geopolitical Strategy pointed out recently.4 Indeed, our GPS service, led by Matt Gertken, warned the Biden administration would be tested in this manner by Russia and China from the get-go. Russia has massed troops on Ukraine’s border and warned the US not to interfere. China has massed warships off the coast of the Philippines, and continues its incursions in Taiwan’s air-defense zone, keeping US forces on alert. Political dialogue between the US and Russia and the US and China is increasingly vitriolic, with no sign of any leavening in the near future. Intentional or accidental engagement could let slip the dogs of war and spike oil prices briefly. Finally, OPEC 2.0 is going to have to accommodate the “official” return of Iran as a bona fide oil exporter, if, as we expect, it is able to reinstate its nuclear deal – i.e., the Joint Comprehensive Plan of Action (JCPOA) – with Western states, which was abrogated by then-President Donald Trump in 2018. This may prove difficult, given our view that the oil-price collapse of 2014-16 was the result of the Saudis engineering a market-share war to tank prices, in an effort to deny Iran $100+ per-barrel prices that had prevailed between end-2010 and mid-2014. OPEC 2.0, particularly KSA, has not publicly involved itself in the US-Iran negotiations. However, it is worthwhile recalling that following the disastrous market-share war launched in 2014, KSA and the rest of OPEC 2.0 did accommodate Iran’s return to markets post-JCPOA. Robert P. Ryan Chief Commodity & Energy Strategist rryan@bcaresearch.com Ashwin Shyam Research Associate Commodity & Energy Strategy ashwin.shyam@bcaresearch.com Commodities Round-Up Energy: Bullish Brent and WTI prices rallied sharply following the release of the EIA’s Weekly Petroleum Status Report showing a 9.1mm-barrel decline in US crude and product stocks for the week ended 9 April 2021. This was led by a huge draw in commercial crude and distillate inventories (5.9mm barrels and 2.1mm barrels, respectively). These draws came on the back of generally bullish global demand upgrades by the major data services (EIA, IEA and OPEC) over the past week. These assessments were supported by EIA data showing refined-product demand – i.e., “product supplied” – jumped 1.1mm b/d for the week ended 9 April. With vaccine distributions picking up steam, despite setbacks on the Johnson & Johnson jab, the storage draws and improved demand appear to have catalyze the move higher. Continued weakness in the USD also provided a tailwind, as did falling real interest rates in the US. Base Metals: Bullish Nickel prices fell earlier this week, as China’s official Xinhua news agency reported that Chinese Premier, Li Keqiang stressed the need to strengthen raw materials’ market regulation, amidst rising commodities prices, which been pressuring corporate financial performance (Chart 9). This statement came after China’s top economic advisor, Liu He also called for authorities to track commodities prices last week. Nickel prices fell by around $500/ ton earlier this week on this news, and were trading at $16,114.5/MT on the London Metals exchange as of Tuesday’s close. Other base metals were not affected by this news. Precious Metals: Bullish The US dollar and 10-year treasury yields fell after March US inflation data was released earlier this week. US consumer prices rose by the most in nearly nine years. The demand for an inflation hedge, coupled with the falling US dollar and treasury yields, which reduce the opportunity cost of purchasing gold, caused gold prices to rise (Chart 10). This uncertainty, coupled with the increasing inflationary pressures due to the US fiscal stimulus will increase demand for gold. Spot COMEX gold prices were trading at $1,746.20/oz as of Tuesday’s close. Ags/Softs: Neutral The USDA reported ending stocks of corn in the US stood at 1.35 billion bushels, well below market estimates of 1.39 billion and the 1.50 billion-bushel estimate by the Department last month, according to agriculture.com’s tally. Global corn stocks ended at 283.9mm MT vs a market estimate of 284.5mm MT and a Department estimate of 287.6mm MT. Chart 9Base Metals Are Being Bullish
Base Metals Are Being Bullish
Base Metals Are Being Bullish
Chart 10Gold Prices To Rise
Gold Prices To Rise
Gold Prices To Rise
Footnotes 1 Please see US-Russia Pipeline Standoff Could Push LNG Prices Higher, which we published on 8 April 2021 re the IMF’s latest forecast for global growth. Briefly, the Fund raised its growth expectations for this year and next to 6% and 4.4%, respectively, nearly a full percentage-point increase versus its January forecast update for 2021 2 A backwardated forward curve – prompt prices trading in excess of deferred prices – is the market’s way of signaling tightness. It means refiners of crude oil value crude availability right now over availability a year from now. This is exactly the same dynamic that drives an investor to pay $1 today for a dollar bill delivered tomorrow than for that same dollar bill delivered a year from now (that might only fetch 98 cents today, e.g.). 3 Please see When will the COVID-19 pandemic end?, published 26 March 2021 by McKinsey & Co. 4 Please see The Arsenal Of Democracy, a prescient analysis published 2 April 2021 by BCA’s Geopolitical Strategy. The report notes the Biden administration “still faces early stress-tests on China/Taiwan, Russia, Iran, and even North Korea. Game theory helps explain why financial markets cannot ignore the 60% chance of a crisis in the Taiwan Strait. A full-fledged war is still low-probability, but Taiwan remains the world’s preeminent geopolitical risk.” Investment Views and Themes Recommendations Strategic Recommendations Tactical Trades Commodity Prices and Plays Reference Table Trades Closed in 2021 Summary of Closed Trades
Higher Inflation On The Way
Higher Inflation On The Way
Highlights Global Inflation: The case for maintaining a strategic overall allocation to inflation-linked bonds (ILBs) versus nominal government debt in dedicated global fixed income portfolios remains intact. Global growth expectations are accelerating as vaccinations increase, spare capacity is increasingly being absorbed across the developed world and central banks (led by the Federal Reserve) continue to show no inclination to tighten policy anytime soon. Inflation-Linked Bond Allocations: ILB valuations, however, are no longer uniformly cheap across all countries. Real yields are now moving in a less coordinated fashion as markets try to sort out the timing and pace of eventual future central bank tightening. We recommend shifting inflation-linked bond exposure from Canada to Germany, as both markets have similar valuations but the Bank of Canada is likely to turn less dovish well ahead of the ECB. Feature Chart of the WeekMarkets Remain Unconcerned About An Inflation Overshoot
Markets Remain Unconcerned About An Inflation Overshoot
Markets Remain Unconcerned About An Inflation Overshoot
The global reflation trade over the past year has been highly rewarding to investors. Equity and credit markets worldwide have delivered outstanding returns on the back of highly stimulative monetary and fiscal policies implemented to deal with the negative economic effects of COVID-19. The global INflation trade has also paid off for investors in inflation-linked bonds (ILBs), which have outperformed nominal government debt across the developed economies dating back to last spring. The rising trend for global inflation breakevens remains intact, but is approaching some potential resistance points. A GDP-weighted average of 10-year breakeven inflation rates among the major developed economies is just shy of the 2% level that has represented a firm ceiling over the past decade (Chart of the Week). At the same time, the Bloomberg consensus forecast for headline CPI inflation for that same group of countries calls for an increase to only 1.8% by year-end before slowing to 1.7% in 2022. The latest forecasts from the IMF are similar, calling for headline inflation in the advanced economies to reach 1.6% in 2021 and 1.7% in 2022. If those modest forecasts for realized inflation come to fruition, then there is likely not much more upside in inflation breakevens, in aggregate. Country selection within the ILB universe will become more important over the next 6-12 months, as divergences in growth, realized inflation and central bank reactions will lead to a more heterogeneous path for global inflation breakevens. Underlying Inflation Backdrop Still Supports Rising Breakevens On a total return basis, ILBs enjoyed an extended run of success prior to this year. The cumulative total return of the asset class (in local currency terms) between 2012 and 2020 was a whopping 61% in the UK, 25% in Canada, 22% in the US and 21% in the euro area (aggregating the individual countries in the region with inflation-linked bonds). However, the absolute performance of ILBs has been more disperse on a country-by-country basis so far in 2021. ILBs are down year-to-date in Canada (-6.2%), the UK (-5.0%) and the US (-1.4%). On the other hand, euro area ILBs have delivered a positive total return of +0.5% so far in 2021. Real bond yields have climbed off the lows in the US, UK and, most notably, Canada where the overall index yield on the Bloomberg Barclays inflation-linked bond index is now in positive territory for the first time since before the pandemic started (Chart 2). At the same time, real bond yields have been drifting lower in the euro area. These real yield moves are related to shifting perceptions of central bank responses to the global growth upturn. For example, pricing in overnight index swap (OIS) curves have pulled forward the timing and pace of future interest rate increases in the US and Canada – i.e. real policy rates will become less negative - while there has been comparatively little change in euro zone rate expectations. While the absolute returns for ILBs have become less correlated, the relative trade between nominal and inflation-linked government bonds in all countries remains intact. 10-year breakeven inflation rates have been steadily climbing in the US and UK, while depressed Japanese breakevens have crept modestly higher (Chart 3). Even Europe, where inflation has remained subdued for years, has seen a significant shift higher in inflation breakevens. (Chart 4). The turn in breakevens has occurred alongside a major change in investor perceptions of future inflation, with surveys like the ZEW showing an overwhelming majority of financial professionals expecting higher inflation in the US, Europe and the UK. Chart 2A Fading Bull Market In Inflation-Linked Bonds
A Fading Bull Market In Inflation-Linked Bonds
A Fading Bull Market In Inflation-Linked Bonds
Chart 3A Solid Recovery In Inflation Expectations
A Solid Recovery In Inflation Expectations
A Solid Recovery In Inflation Expectations
Chart 4European Inflation Expectations Starting To Normalize
European Inflation Expectations Starting To Normalize
European Inflation Expectations Starting To Normalize
Inflation forecasts have shifted in response to faster global growth expectations on the back of vaccine optimism and aggressive US fiscal stimulus. Yet inflation forecasts remain modest compared to the huge growth figures expected for 2021 and 2022. In its latest World Economic Outlook published last week, the IMF upgraded its global real GDP forecast to 6.0% for 2021 and 4.4% for 2022. This represented an increase of 0.5 and 0.4 percentage points, respectively, from the last set of forecasts published back in January. While growth upgrades occurred across all major developed and emerging economies, the biggest upgrades came in the US and Canada, for both 2021 and 2022. As a result, the IMF projects the output gap in both countries to turn positive over 2022 and 2023, and be nearly closed in core Europe, Australia and Japan (Chart 5). The IMF is not projecting a major inflation surge on the back of those upbeat growth forecasts, though. While headline inflation in the US is expected to climb to 2.3% in 2021 and 2.4% in 2022, the same measure in Canada is only projected to rise to 1.7% and 2.0% over the same two years. European inflation is expected to remain subdued, reaching only 1.4% this year and drifting back to 1.2% in 2022 despite real GDP growth averaging 4.1% over the two-year period. The IMF attributes the benign inflation outcomes, even in the face of booming growth rates and the rapid elimination of output gaps, to the structural disinflationary backdrop for so-called “non-cyclical” inflation (Chart 6). The IMF defines this as the components of inflation indices that are less sensitive to changes in aggregate demand. The IMF estimates show that the contribution from non-cyclical components to overall inflation in the advanced economies had fallen to essentially zero at the end of 2020. Chart 5A Big Expected Narrowing Of Output Gaps
How Much More Juice Is Left In The Global Inflation Breakeven Trade?
How Much More Juice Is Left In The Global Inflation Breakeven Trade?
Chart 6Non-Cyclical Components Still Weighing On Global Inflation
Non-Cyclical Components Still Weighing On Global Inflation
Non-Cyclical Components Still Weighing On Global Inflation
There is considerable upside risk for the more cyclical components of inflation that could result in inflation overshooting the IMF projections (Chart 7). Chart 7Cyclical Backdrop Is Inflationary
Cyclical Backdrop Is Inflationary
Cyclical Backdrop Is Inflationary
For example, in the US, the Prices Paid component of the ISM Manufacturing index remains elevated at post-2008 highs, while the year-over-year change in the Producer Price Index soared to 6% in March. Across the Atlantic, the European Commission business and consumer surveys have shown a big surge in the net balance of respondents expecting higher inflation in manufacturing and retail trade. Previous weakness in the US dollar and surging commodity prices are playing a major role in this rapid pick-up in price pressures seen in many countries. Given the current backdrop of strong global growth expectations, with actual activity accelerating as vaccinations increase and more parts of the global economy reopen, inflation pressures are unlikely to fade in the near term. With realized inflation rates set to spike due to base effect comparisons to the pandemic-fueled collapse one year ago, the upward pressure on global ILB inflation breakevens will persist in the coming months – especially with breakevens still below levels that would prompt central banks to turn less dovish sooner than expected. Bottom Line: The case for maintaining a strategic overall allocation to inflation-linked bonds (ILBs) versus nominal government debt in dedicated global fixed income portfolios remains intact. Global growth expectations are accelerating as vaccinations increase, spare capacity is increasingly being absorbed across the developed world and central banks (led by the Federal Reserve) continue to show no inclination to tighten policy anytime soon. Assessing Value In Developed Market Inflation-Linked Bonds Chart 8USD Outlook Now More Mixed
USD Outlook Now More Mixed
USD Outlook Now More Mixed
Although the current backdrop remains conducive to a continuation of the rising trend in global ILB breakevens, there are factors that could begin to slow the upward momentum. The future path of the US dollar is now a bit less certain (Chart 8). While the DXY index is still down 7.4% compared to a year ago, it is up 2.4% so far in 2021. Shorter-term real interest rate differentials between the US and the other major developed markets remain dollar-bearish. At the same time, longer-term real yield differentials have risen in favor of the US (middle panel). Furthermore, US growth is outperforming other developed economies, typically a dollar-bullish factor (bottom panel). Given the usual negative correlation between the US dollar and commodity prices, a loss of downside dollar momentum could also slow the pace of commodity price appreciation. This represents a risk to additional global ILB outperformance versus government bonds. Our GDP-weighted aggregate of 10-year ILB breakevens for the major developed economies is currently just under 2% - levels more consistent with oil prices over $80/bbl than the current price closer to $60/bbl (Chart 9). Chart 9Breakevens Consistent With Much Higher Oil Prices
Breakevens Consistent With Much Higher Oil Prices
Breakevens Consistent With Much Higher Oil Prices
Given some of these uncertainties over the strength of any future inflationary push from a weaker US dollar and rising commodity prices, a broad overweight allocation to ILBs across the entire developed market universe may no longer generate the same strong returns versus nominal government bonds seen over the past year. With the “easy money” already having been made in the global breakeven widening trade, country allocation within the ILB universe has now become a more important dimension for bond investors to consider. To assess the relative attractiveness of individual ILB markets, we turn to a few valuation tools. Our regression-based valuation models for 10-year ILB breakevens in the US, UK, France, Italy, Germany, Japan, Canada and Australia are all presented in the Appendix on pages 14-17. The two inputs into the model are the annual rate of change of the Brent oil price in local currency terms (as a measure of shorter-term inflation pressure) and a five-year moving average of realized headline CPI inflation (as a longer-term trend that provides a structural “anchor” for breakevens based off actual inflation outcomes). We first presented these models in April 2020, but we have now made a change in response to some of the unprecedented developments witnessed over the past year.1 Despite the strong visual correlation between the level of oil prices and inflation breakevens in most countries, we chose to use the annual growth of oil prices, rather than the level, in our breakeven models. This is because we found it more logical to compare a rate of change concept like inflation (and breakevens) to the rate of change of oil. However, the oil input into our breakeven models could produce nonsensical results during periods of extreme oil volatility that did not generate equivalent swings in breakeven inflation rates. A good example of that occurred in 2016, when the annual rate of change of the Brent oil price briefly surged toward 100%, yet 10-year US TIPS breakevens did not rise above 2% (Chart 10). An even bigger swing in oil prices has occurred over the past year, with oil prices up over +200% compared to the collapse in prices that occurred one year ago. Putting such an extreme move into our US model would have pushed the “fair value” level of the 10-year TIPS breakeven to 4% - an implausible outcome given that the 10-year breakeven has never risen to even as high as 3% in the entire 24-year history of the TIPS market. Chart 10Pass-Through Of Extreme Oil Moves Has Limits
Pass-Through Of Extreme Oil Moves Has Limits
Pass-Through Of Extreme Oil Moves Has Limits
To deal with this problem, we have truncated the rate of change of oil prices in all our breakeven models at levels consistent with past peaks of breakevens. Going back to the US example, we have “capped” the rate of change of the Brent oil price at +40%, as past periods when oil price momentum was greater than 40% did not translate into any additional increase in TIPS breakevens. We then re-estimated the model using this truncated oil price series to generate fair value breakeven levels. Chart 11A Mixed Impact Of USD Moves On Non-US Breakevens
A Mixed Impact Of USD Moves On Non-US Breakevens
A Mixed Impact Of USD Moves On Non-US Breakevens
We did this for all eight of our individual country breakeven models and in all cases, truncating extreme oil moves improved the accuracy of the model. Interestingly, we did not truncate the downside momentum of oil prices, as there was no obvious “cut-off” point where periods of collapsing oil prices did not generate equivalent declines in breakevens. Oil prices remain the most critical short-term variable to determine ILB breakeven valuation. While it is intuitive to think that currency movements should also have a meaningful impact on inflation (both realized and expected), the effect is not consistent across countries. For example, euro area breakevens appear to be positively correlated to the euro, while Japanese breakevens rarely rise without yen weakness (Chart 11). One other factor to consider when evaluating the value of breakevens is the possible existence of an inflation risk premium component during periods of higher uncertainty over future inflation. Such uncertainty could result in increased demand for ILBs from investors driving up the price of ILBs (thus lowering the real yield) relative to nominal yielding bonds, leading to wider breakevens that do not necessarily reflect a true rise in expected inflation. A simple way to measure such an inflation risk premium is to compare market-based breakevens to survey-based measures of inflation forecasts taken from sources like the Philadelphia Fed's Survey of Professional Forecasters and the Bank of Canada’s Survey Of Consumer Expectations. The assumption here is that the survey-based measures represent a more accurate (or, at least, less biased) depiction of underlying inflation expectations in an economy. We present these simple measures of inflation risk premia, comparing 10-year breakevens to survey-based measures of inflation expectations, in Chart 12 and Chart 13. Breakevens had been trading well below survey-based measures of inflation expectations after the negative pandemic growth shock in 2020 in all countries shown. After the steady climb in global breakevens seen over the past year, those gaps have largely disappeared, with breakevens now trading slightly above survey based inflation expectations in the US, UK and Australia. Chart 12No Major Inflation Risk Premia In These Markets
No Major Inflation Risk Premia In These Markets
No Major Inflation Risk Premia In These Markets
Chart 13Canadian & Australian Breakevens In Line With Inflation Surveys
Canadian & Australian Breakevens In Line With Inflation Surveys
Canadian & Australian Breakevens In Line With Inflation Surveys
Chart 14Assessing The Value Of Breakevens
Assessing The Value Of Breakevens
Assessing The Value Of Breakevens
In Chart 14, we show the valuation residuals from our 10-year ILB breakeven models, along with two other measures of potential breakeven valuation: a) the distance between current breakeven levels and their most recent pre-pandemic peaks; and b) the difference between breakevens and the survey-based measures of inflation expectations. The model results show that breakevens are furthest below fair value in France, Japan and Germany, and the most above fair value in the UK and Australia. The message of undervaluation from our models is confirmed in the other two metrics for France, Japan, Germany, Canada and Italy. The overvaluation message for Australia is consistent across all three valuation metrics, while the signals are mixed for US and UK breakevens. In Japan, while the combined signals of all three valuation metrics indicate that breakevens are far too low, the very robust positive correlation between Japanese breakevens and the USD/JPY exchange rate implies that a bet on wider breakevens requires a much weaker yen. In Canada, while the 10-year breakeven does appear cheap, the real yield has also climbed faster than any of the other countries over the past several months as markets have rapidly repriced a more hawkish path for the Bank of Canada. Recent comments from Bank of Canada officials have leaned a bit hawkish, hinting at a possible taper of its bond-buying program, as the central bank appears unhappy with the renewed boom in Canadian housing values. An early tightening of monetary conditions would likely cap any additional upside in Canadian inflation breakevens. In Europe, the undervaluation of breakevens is more compelling. The ECB is likely to maintain its dovish policy settings into at least 2023, even if growth recovers later this year as increased vaccinations lead to the end of lockdowns. As shown earlier, European breakevens can continue to rise even if the euro is also appreciating versus the US dollar, especially if growth is recovering and oil prices are rising. Euro area breakevens are likely to continue drifting higher over at least the rest of 2021. Currently in our model bond portfolio, we have allocations to ILBs out of nominal government bonds in the US, France, Canada and Italy, with no allocations in Germany, Japan, Australia or the UK. After assessing our valuation measures, we are comfortable with the ILB exposure in France and Italy and lack of positions in the UK and Australia. We still see the upside case for US breakevens, with the economy reopening rapidly fueled further by fiscal policy, and the Fed likely to maintain its current highly dovish forward guidance until much later in 2021. We are reluctant to add exposure to Japanese ILBs, despite attractive valuations, as we are not convinced that USD/JPY has enough upside potential to help realize that undervaluation of Japanese breakevens. Thus, as a new change to our model portfolio this week that reflects our assessment of ILB breakeven valuations and risks, we are closing out the exposure to Canadian ILBs and adding a new position in German ILBs of equivalent size (see the model bond portfolio tables on pages 18-19). Bottom Line: ILB valuations are no longer uniformly cheap across all countries. Real yields are now moving in a less coordinated fashion as markets try to sort out the timing and pace of eventual future central bank tightening. We recommend shifting inflation-linked bond exposure from Canada to Germany, as both markets have similar valuations but the Bank of Canada is likely to turn less dovish well ahead of the ECB. Robert Robis, CFA Chief Fixed Income Strategist rrobis@bcaresearch.com Footnotes 1 Please see BCA Research Global Fixed Income Strategy Report, "Global Inflation Expectations Are Now Too Low", dated April 28, 2020, available at gfis.bcaresearch.com. Appendix Chart A1Our US 10-Year Inflation Breakeven Model
How Much More Juice Is Left In The Global Inflation Breakeven Trade?
How Much More Juice Is Left In The Global Inflation Breakeven Trade?
Chart A2Our UK 10-Year Inflation Breakeven Model
How Much More Juice Is Left In The Global Inflation Breakeven Trade?
How Much More Juice Is Left In The Global Inflation Breakeven Trade?
Chart A3Our France 10-Year Inflation Breakeven Model
How Much More Juice Is Left In The Global Inflation Breakeven Trade?
How Much More Juice Is Left In The Global Inflation Breakeven Trade?
Chart A4Our Italy 10-Year Inflation Breakeven Model
How Much More Juice Is Left In The Global Inflation Breakeven Trade?
How Much More Juice Is Left In The Global Inflation Breakeven Trade?
Chart A5Our Japan 10-Year Inflation Breakeven Model
How Much More Juice Is Left In The Global Inflation Breakeven Trade?
How Much More Juice Is Left In The Global Inflation Breakeven Trade?
Chart A6Our Germany 10-Year Inflation Breakeven Model
How Much More Juice Is Left In The Global Inflation Breakeven Trade?
How Much More Juice Is Left In The Global Inflation Breakeven Trade?
Chart A7Our Canada 10-Year Inflation Breakeven Model
How Much More Juice Is Left In The Global Inflation Breakeven Trade?
How Much More Juice Is Left In The Global Inflation Breakeven Trade?
Chart A8Our Australia 10-Year Inflation Breakeven Model
How Much More Juice Is Left In The Global Inflation Breakeven Trade?
How Much More Juice Is Left In The Global Inflation Breakeven Trade?
Recommendations
How Much More Juice Is Left In The Global Inflation Breakeven Trade?
How Much More Juice Is Left In The Global Inflation Breakeven Trade?
The GFIS Recommended Portfolio Vs. The Custom Benchmark Index Duration Regional Allocation Spread Product Tactical Trades Yields & Returns Global Bond Yields Historical Returns
Highlights The Swiss economy will benefit from the pickup in global growth. The recent weakness in the franc has been a welcome development for the Swiss National Bank, but technicals suggest a coiled spring rally in CHF is likely. However, as a low-beta currency, the Swiss franc will lag the upturn in other pro-cyclical currencies over the longer term. We remain long EUR/CHF as a tactical trade but maintain tight stops at 1.095. Long CHF/NZD and CHF/GBP positions look attractive at current levels. Similar to our short EUR/JPY position, this is an excellent portfolio hedge. Feature Chart I-1The Swiss Economy Is On The Mend
The Swiss Economy Is On The Mend
The Swiss Economy Is On The Mend
The Swiss economy has recovered smartly. As of March, the manufacturing PMI was at 66.3, the highest since 2006. If past manufacturing sentiment is prologue, the Swiss economy is about to experience its biggest rebound in decades (Chart I-1). This will quell any deflationary fears about domestic conditions in Switzerland and begin to re-anchor inflation expectations upwards. This will also be a very welcome development for the SNB. The Swiss franc has been one of the worst performing currencies this year, but that might be about to change. For one, dollar sentiment has been reset with the rise in the DXY index this year. Second, the global economy is transitioning from disinflationary to a gentle tilt towards inflation. This will lift global prices, including import prices into Switzerland. Rising import prices will ease the need for the SNB to maintain emergency monetary settings. Finally, the weakness in the currency has eased financial conditions for Swiss concerns. The Reopening Trade Most economies are entering into a third wave of the Covid-19 pandemic and the Swiss economy is no exception. However, the Swiss authorities have been able to bring the number of new infections down to levels below the euro area in general and Sweden in particular. Vaccinations are progressing smoothly with almost 20% of the population inoculated as of today. This provides a coiled springboard to lift the Swiss economy into robust growth later this year. Switzerland is one of the most open economies in the G10. Exports of goods and services account for over 65% of Swiss GDP, much higher than the euro area (Chart I-2). The constituent of Swiss exports tends to be defensive (medical goods, gold, watches, jewelry) so the franc does not necessarily outperform in a global growth upswing, but definitely does better than the dollar which anchors a more closed economy. Inflation dynamics in Switzerland will be particularly beholden to improvement in the private sector. As we show in Chart I-1, employment should remain robust in the months ahead, which will support wages. Import prices in Switzerland are also about to catapult upwards, which will help lift the consumer price basket (Chart I-3). For a small, open economy like Switzerland, the exchange rate often dictates the trend in domestic inflation, and the weakness in the franc has been a beneficial cushion for good prices. The rise in global tradeable prices is also acting as a catalyst. For the first time in many years, the pendulum might be swinging towards a worry about inflation in SNB corridors. Chart I-2Switzerland Has A Huge Exposure To Trade
Switzerland Has A Huge Exposure To Trade
Switzerland Has A Huge Exposure To Trade
Chart I-3Swiss Inflation Will Rise
Swiss Inflation Will Rise
Swiss Inflation Will Rise
Particularly, a rise in Swiss inflation will lessen the need for the SNB to keep rates at the -0.75 level in place for over half a decade. It will also lessen to need for the SNB to fight against franc strength. Global Developments In A CHF Context There are some additional tailwinds to a strong CHF in today’s context. Volatility has collapsed, with the VIX index well below 20. If one could predict with absolute certainty what will happen with global growth, equity prices, bond yields, or even Covid-19, then low volatility makes sense. However, in the current context of elevated valuations, high uncertainty and a precarious health landscape, it almost makes perfect sense that volatility should rise. The franc tends to do well in an environment where volatility is rising (Chart I-4). Chart I-4The Swiss Franc Tracks The VIX
The Swiss Franc Tracks The VIX
The Swiss Franc Tracks The VIX
Chart I-5Long-Term Support On CHF/NZD Has Held
Long-Term Support On CHF/NZD Has Held
Long-Term Support On CHF/NZD Has Held
In fact, from a broad picture perspective, a rotation from US growth outperformance to other parts of the globe that are also stimulating their domestic economies could be met with higher dollar volatility. This has historically been beneficial for the Swiss franc (Chart I-6). Ergo, being long the franc could constitute a “heads, I win; tails I do not lose too much” proposition. Rising global growth and a lower dollar will help the franc, but so will a rise in volatility. Chart I-6CHF/NZD Tracks Dollar Volatility
CHF/NZD Tracks Dollar Volatility
CHF/NZD Tracks Dollar Volatility
Our Geopolitical Strategy team has also been recommending long Swiss franc positions since February as they believe the Biden administration faces several imminent and serious foreign policy tests, namely over Russia’s military buildup on the Ukraine border, China’s military pressure tactics against Taiwan, and Middle East tensions ahead of any revived US-Iran nuclear deal. They see a 60% chance of some kind of crisis – if not war – over the Taiwan Strait and any of these other issues could also motivate safe haven demand for the rest of this year. With regard to CHF/GBP, an upside surprise for the Scottish National Party in the May 6 parliamentary election could also hurt the pound since it would herald a second Scots independence referendum in the not-too-distant future. Trading Dynamics As A Safe Haven Chart I-7CHF And The Copper/Gold Ratio
CHF AND THE COPPER/GOLD RATIO
CHF AND THE COPPER/GOLD RATIO
Switzerland ticks off all the characteristics of a safe-haven currency. Its large net international investment position of over 100% of GDP generates huge income inflows. Meanwhile, rising productivity over the years has led to a structural surplus in its trading balance and a rising fair value for the currency. Consequently, the franc has tended to have an upward bias over the years, supercharged during periods of risk aversion. This makes the franc a useful constituent of any currency portfolio. More specifically, the franc has tracked the gold-to-copper ratio in recent years. Copper is a good barometer for global economic health while gold is a good proxy for the demand for safety. If the overarching theme is that complacency reigns across markets, a nudge towards safety will benefit flows into the franc (Chart I-7). The current interest-rate regime could also affect the franc-dollar relationship. Global yields have risen. To the extent that we are due for some reprieve, the franc will benefit, given its “low beta” status. Meanwhile, net portfolio flows into Switzerland suffered from the Trump tax cuts that pushed US affiliates in Switzerland to repatriate investments. President Biden’s tax reform will halt and/or reverse this process. SNB Action And Market Implications The past weakness in the franc has been a welcome development for the SNB. In fact, since the start of this year, Swiss central bankers have not had to ramp up asset purchases. Both the dollar and the euro have been relatively strong (Chart I-8). In other words, global dynamics have eased monetary conditions for the Swiss authorities. The latest Article IV report from the IMF also justifies the SNB’s monetary stance. Currency intervention was cited as a viable tool should the SNB do a policy review, especially given the potential inefficacies from QE due to the small bond market in Switzerland. Herein lies the key takeaway for the franc – while it could appreciate in an environment where the dollar resumes its downtrend, it will likely lag other pro cyclical currencies over the longer term. This is because the SNB will be loath to see the franc unanchor inflation expectations. We are long EUR/CHF on this basis, but are keeping tight stops at 1.095. Three key factors suggest this trade could still work well in the coming 12-18 months. Rising interest rates benefit EUR/CHF (Chart I-9). With interest rates in Switzerland well below other countries, the Swiss franc rapidly becomes a funding currency for carry trades. Carry trades, especially towards peripheral bonds in Europe hurt the franc. Chart I-8A Weaker Franc Is Doing The Heavy Lifting For The SNB
A Weaker Franc Is Doing The Heavy Lifting For The SNB
A Weaker Franc Is Doing The Heavy Lifting For The SNB
Chart I-9EUR/CHF Tracks German ##br## Yields
EUR/CHF Tracks German Yields
EUR/CHF Tracks German Yields
The Swiss trade balance has suffered in the face of a global slowdown. It will also lag the European rebound (Chart I-10). In a downturn, commoditized goods prices are the first to drop and recover, while more specialized goods prices eventually gain ground later. Swiss goods are not easily substitutable which is a benefit, but prices are also slower to adjust. Our models suggest the franc is still about 5% overvalued versus the euro. Over the history of the model, this has been a modest premium, but allows the euro to outperform the Swiss franc (Chart I-11). Chart I-10Structural Appreciation In The Swiss Franc
Structural Appreciation In The Swiss Franc
Structural Appreciation In The Swiss Franc
Chart I-11EUR/CHF Is Still Cheap
EUR/CHF Is Still Cheap
EUR/CHF Is Still Cheap
Economically, the SNB has to walk a fine line between a predominantly deflationary backdrop in Switzerland and a rising debt-to-GDP ratio that pins it among the highest in the G10 (Chart I-12). Too little stimulus and the economy runs the risk of entering a debt-deflation spiral, as inflation expectations are revised downwards. Too much stimulus and the result will be a build-up of imbalances, leading to an eventual bust. Chart I-12Lots Of Private Debt In Switzerland
Lots Of Private Debt In Switzerland
Lots Of Private Debt In Switzerland
Today, the SNB is in a sweet spot. Almost every other G10 country is providing the fiscal and monetary stimulus necessary to lift Switzerland from its deflationary paradigm. Investment Conclusions Chart I-13Structural Appreciation In The Franc Still Possible
Structural Appreciation In The Franc Still Possible
Structural Appreciation In The Franc Still Possible
Our long-term fair value models suggest the Swiss franc is currently cheap versus the dollar (Chart I-13). This makes it attractive from a strategic perspective. Usually, the Swiss franc tends to be more of a dormant currency, gently appreciating towards fair value but periodically interspersed with bouts of intense volatility. Interestingly, we may be entering such a riot point. The VIX is low and countries are reintroducing lockdowns, yet overall sentiment remains unequivocally bullish. Finally, Switzerland ticks off all the characteristics of a safe-haven currency. As such, while the dollar has benefited from its reserve status, the franc remains an appropriate hedge in any currency portfolio. In a nutshell, our recommendations are as follows: USD/CHF will stay under parity. EUR/CHF can hit 1.2. NZD/CHF is a sell in the short-term. So is GBP/CHF. The Scandinavian currencies will outperform the franc on a 12-18 month horizon. Chester Ntonifor Foreign Exchange Strategist chestern@bcaresearch.com Currencies U.S. Dollar Chart II-1USD Technicals 1
USD Technicals 1
USD Technicals 1
Chart II-2USD Technicals 2
USD Technicals 2
USD Technicals 2
US economic data has been spectacular this week: Starting with the jobs report, the US added 916K jobs in March versus a consensus of 660K jobs. The unemployment rate fell from 6.2% to 6% and wages increased by 4.2% year-on-year. The boost to domestic demand dented the trade balance. The deficit widened from $68.2bn to $71.1bn in February. The FOMC minutes were a non event for markets. The DXY index is giving back some of the gains it accumulated this year, rising over 1% this week. With the US 10-year yield now facing strong resistance near the 1.7% level, the case for a stronger USD is fading. As consensus forecasts coagulate towards a stronger USD, positioning has also been reset towards USD long positions auguring for some volatility in the months ahead. Report Links: Arbitrating Between Dollar Bulls And Bears - March 19, 2021 The Dollar Bull Case Will Soon Fade - March 5, 2021 Are Rising Bond Yields Bullish For The Dollar? - February 19, 2021 The Euro Chart II-3EUR Technicals 1
EUR Technicals 1
EUR Technicals 1
Chart II-4EUR Technicals 2
EUR Technicals 2
EUR Technicals 2
Recent data from the euro area are mending: The Sentix investor index catapulted from 5 to 13.1 in April. The Eurozone remains the unsung hero in this recovery. PPI increased to 1.5% year-on-year in February from 0% last month. The euro rose by 1.2% against the dollar this week. To be clear, there are still stale euro longs among more fundamental holders of the currency. This suggests the flushing out of weak hands has more to go. However, the balance of evidence suggests euro area data could reward long positions later this year. Report Links: Portfolio And Model Review - February 5, 2021 On Japanese Inflation And The Yen - January 29, 2021 The Dollar Conundrum And Protection - November 6, 2020 Japanese Yen Chart II-5JPY Technicals 1
JPY Technicals 1
JPY Technicals 1
Chart II-6JPY Technicals 2
JPY Technicals 2
JPY Technicals 2
Recent data from Japan has been improving: PMI indices remain under 50, but reflect a possible coiled-spring rebound underway. Consumer confidence rebounded from 33.8 to 36.1 in March. The Eco Watchers survey was also encouraging. Sentiment rebounded from 41.3 to 49 in March. The Japanese yen rose by 1.24% against the US dollar this week, and remains the strongest G10 currency in recent trading days. Falling yields have seen Japanese investors retreat from overseas markets such as the UK, pushing up the yen. Speculative positioning is also net yen bearish, which is constructive from a contrarian standpoint. Report Links: The Dollar Bull Case Will Soon Fade - March 5, 2021 On Japanese Inflation And The Yen - January 29, 2021 The Dollar Conundrum And Protection - November 6, 2020 British Pound Chart II-7GBP Technicals 1
GBP Technicals 1
GBP Technicals 1
Chart II-8GBP Technicals 2
GBP Technicals 2
GBP Technicals 2
Recent data out of the UK have been positive: Car registrations are picking up smartly, suggesting durable demand might be returning to the UK. Registrations rose 11.5% year-on-year in March versus -35.5% the year before. The UK construction PMI hit a high of 61.7, the highest since 2014. The pound fell by almost 2% versus the euro this week. The violent correction in EURGBP might be a harbinger of the rotation brewing for both UK and US assets versus their global counterparts. Stay tuned. Report Links: Portfolio And Model Review - February 5, 2021 The Dollar Conundrum And Protection - November 6, 2020 Revisiting Our High-Conviction Trades - September 11, 2020 Australian Dollar Chart II-9AUD Technicals 1
AUD Technicals 1
AUD Technicals 1
Chart II-10AUD Technicals 2
AUD Technicals 2
AUD Technicals 2
Recent data in Australia was robust: The RBA kept rates unchanged at 0.1%. Both the services and manufacturing PMIs remained at an expansionary 55.5 level. The Aussie rose by 0.4% this week. We like the AUD, and are long AUD/NZD as a trade. However, the outperformance of the US economy is also handsomely rewarding AUD/MXN shorts. Mexico benefits a lot more from a pick-up in the US economy than Australia. Report Links: The Dollar Bull Case Will Soon Fade - March 5, 2021 Portfolio And Model Review - February 5, 2021 Australia: Regime Change For Bond Yields & The Currency? - January 20, 2021 New Zealand Dollar Chart II-11NZD Technicals 1
NZD Technicals 1
NZD Technicals 1
Chart II-12NZD Technicals 2
NZD Technicals 2
NZD Technicals 2
Recent data out of New Zealand have been positive: The ANZ commodity price index ticked up by 6.1% in March. ANZ Business confidence deteriorated in March. The activity outlook fell from 16.6 to 16.4 and confidence fell from -4.1 to -8.4. The New Zealand dollar rose by 60bps against the US dollar this week. New Zealand will start taking the back seat in the coming economic rotation as other economies play catch up. The improvement in kiwi terms of trade has been a boon for the currency, and will limit downside on NZD. However, shorting the NZD at the crosses remains an attractive proposition. Report Links: Portfolio And Model Review - February 5, 2021 Currencies And The Value-Versus-Growth Debate - July 10, 2020 Updating Our Balance Of Payments Monitor - November 29, 2019 Canadian Dollar Chart II-13CAD Technicals 1
CAD Technicals 1
CAD Technicals 1
Chart II-14CAD Technicals 2
CAD Technicals 2
CAD Technicals 2
There was scant data out of Canada this week: The Bloomberg Nanos confidence index continues to suggest that Canadian GDP will surprise to the upside. The index rose from 63.7 to 64.1 last week. Demand for Canadian goods remains robust. The trade surplus came in at C$1.04bn in February. The Ivey purchasing managers’ index catapulted to 72.9 from 60 in March. The Canadian dollar was flat against the US dollar this week. While this might come as a surprise, three reasons explain this performance. First, the loonie is one of the best-performing G10 currencies this year and some specter of rotation was in play this week. Second, the correction in oil prices hurt the loonie. Finally, should US economic optimism become more widespread, other currencies could benefit. Report Links: Will The Canadian Recovery Lead Or Lag The Global Cycle? - February 12, 2021 Currencies And The Value-Versus-Growth Debate - July 10, 2020 More On Competitive Devaluations, The CAD And The SEK - May 1, 2020 Swiss Franc Chart II-15CHF Technicals 1
CHF Technicals 1
CHF Technicals 1
Chart II-16CHF Technicals 2
CHF Technicals 2
CHF Technicals 2
There was scant data out of Switzerland this week: Sight deposits were relatively flat at CHF700bn last week. The Swiss Franc rose by 2% against the US dollar this week. This week’s piece is dedicated to the possibility that the franc has a coiled-spring rebound in the near term. Safe-haven currencies are now benefitting from the drop in yields, while the franc has underperformed other currencies this year. This is welcome news for the SNB. We have been long EUR/CHF on this expectation, and recommend investors stick with this trade. Report Links: Portfolio And Model Review - February 5, 2021 The Dollar Conundrum And Protection - November 6, 2020 On The DXY Breakout, Euro, And Swiss Franc - February 21, 2020 Norwegian Krone Chart II-17NOK Technicals 1
NOK Technicals 1
NOK Technicals 1
Chart II-18NOK Technicals 2
NOK Technicals 2
NOK Technicals 2
There was scant data out of Norway this week: The March DNB manufacturing PMI came in at 56.1 from 57.5. Industrial production rose by 5.9% year-on-year versus expectations of a 1.5% increase. The NOK rose by 0.75% against the dollar this week. Norway has handled the Covid-19 crisis admirably and it is an added boon that oil prices, a key export and income valve for Norway, are rising smartly. This has prompted the Norges bank to rapidly bring forward rate hike expectations. This leaves little scope for the NOK to fall durably. We are long the Norwegian krone as a high-conviction bet against both the dollar and the euro. Report Links: Portfolio And Model Review - February 5, 2021 Revisiting Our High-Conviction Trades - September 11, 2020 A New Paradigm For Petrocurrencies - April 10, 2020 Swedish Krona Chart II-19SEK Technicals 1
SEK Technicals 1
SEK Technicals 1
Chart II-20SEK Technicals 2
SEK Technicals 2
SEK Technicals 2
Swedish data releases were above expectations: The Swedbank manufacturing PMI came in at 63.7 in March versus expectations of 62.5. Industrial orders came in at 8.5% year-on-year versus expectations of 5.3% in February. The Swedish krona rose by 2% this week ranking it as the best performing G10 currency. Sweden needs to do a better job at containing the Covid-19 crisis, which will unlock tremendous value in the krona. As a positive, the global manufacturing cycle continues humming and will buffeting Swedish industrial production. Report Links: Revisiting Our High-Conviction Trades - September 11, 2020 Updating Our Balance Of Payments Monitor - November 29, 2019 Where To Next For The US Dollar? - June 7, 2019 Trades & Forecasts Forecast Summary Core Portfolio Tactical Trades Limit Orders Closed Trades
Highlights Continued upgrades to global economic growth – most recently by the IMF this week –will support higher natgas prices. In our estimation, gas for delivery at Henry Hub, LA, in the coming withdrawal season (November – March) is undervalued at current levels at ~ $2.90/MMBtu. Inventory demand will remain strong during the current April-October injection season, following the blast of colder-than-normal weather in 1Q21 that pulled inventories lower in the US, Europe and Northeast Asia. The odds the US will succeed in halting completion of the final leg of the Russian Nord Stream 2 natural gas pipeline into Germany are higher than the consensus expectation. Our odds the pipeline will not be completed this year stand at 50%, which translates into higher upside risk for natural gas prices. We are getting long 1Q22 calls on CME/NYMEX Henry Hub-delivered natgas futures struck at $3.50/MMBtu vs. short 1Q22 $3.75/MMBtu calls at tonight's close. The probability of Nord Stream 2 cancellation is underpriced, which means European TTF and Asian JKM prices will have to move higher to attract LNG cargoes next winter from the US, if the pipeline is cancelled (Chart of the Week). Feature As major forecasting agencies continue to upgrade global growth prospects, expectations for industrial-commodity demand – energy, bulks, and base metals – also are moving higher. This week, the IMF raised its growth expectations for this year and next to 6% and 4.4%, respectively, nearly a full percentage-point increase versus its January forecast update for 2021.1 This upgrade follows a similar move by the OECD last month.2 In the US, the EIA is expecting industrial demand for natural gas to rise 1.35 Bcf/d this year to 23.9 Bcf/d; versus 2019 levels, industrial demand will be 0.84 Bcf/d higher in 2021. For 2022, industrial demand is expected to be 24.2 Bcf/d. US industrial demand likely will recover faster than the EU's, given the expectation of a stronger recovery on the back of massive fiscal and monetary stimulus. Overall natgas demand in the US likely will move lower this year, given higher natgas prices expected this year and next will incentivize electricity generators to switch to coal at the margin, according to the EIA. Total demand is expected to be 82.9 Bcf/d in the US this year vs. 83.3 Bcf/d last year, owing to lower generator demand. Pipeline-quality gas output in the US – known as dry gas, since its liquids have been removed for other uses – is expected to average 91.4 Bcf/d this year, essentially unchanged. Lower consumption by the generators and flat production will allow US gas inventories to return to their five-year average levels of 3.7 Tcf by the end of October, in the EIA's estimation (Chart 2). Chart of the WeekUS-Russia Geopolitical Risk Underpriced
US-Russia Pipeline Standoff Could Push LNG Prices Higher
US-Russia Pipeline Standoff Could Push LNG Prices Higher
Chart 2US Natgas Inventories Return To Five-Year Average
US-Russia Pipeline Standoff Could Push LNG Prices Higher
US-Russia Pipeline Standoff Could Push LNG Prices Higher
US Liquified Natural Gas (LNG) exports are likely to expand, as Asian and European demand grows (Chart 3). Prior to the boost in US LNG demand from colder weather, exports set monthly records of 9.4 Bcf/d and 9.8 Bcf/d in November and December of last year, respectively, with Asia accounting for the largest share of exports (Chart 4). This also marked the first time LNG exports exceeded US pipeline exports to Mexico and Canada. The EIA is forecasting US LNG exports will be 8.5 bcf/d and 9.2 Bcf/d this year and next, versus pipeline exports of 8.8 Bcf/d and 8.9 Bcf/d in 2021 and 2022, respectively. Chart 3US LNG Exports Continue Growing
US-Russia Pipeline Standoff Could Push LNG Prices Higher
US-Russia Pipeline Standoff Could Push LNG Prices Higher
Chart 4US LNG Exports Set Records In November And December 2020
US-Russia Pipeline Standoff Could Push LNG Prices Higher
US-Russia Pipeline Standoff Could Push LNG Prices Higher
US LNG exports – and export potential given the size of the resource base at just over 500 Tcf – now are of a sufficient magnitude to be a formidable force in global markets, particularly in Europe. This puts it in direct conflict with Russia, which has targeted Europe as a key market for its pipeline natural gas exports. US-Russia Standoff Looming Over Nord Stream 2 Given the size and distribution of global oil and gas production and consumption, it comes as no surprise national interests can, at times, become as important to pricing these commodities as supply-demand fundamentals. This is particularly true in oil, and increasingly is becoming the case in natural gas. That the same dramatis personae – the US and Russia – should feature in geopolitical contests in oil and gas markets also should not come as a surprise. In an attempt to circumvent transporting its natural gas through Ukraine, Russia is building a 1,230 km underwater pipeline from Narva Bay in the Kingisepp district of the Leningrad region of Russia to Lubmin, near Greifswald, in Germany (Map 1). The Biden administration, like the Trump administration and US Congress, is officially attempting to halt the final leg of the pipeline from being built, although Biden has not yet put America’s full weight into stopping it. Biden claims it will be up to the Europeans to decide what to do. At the same time, any major Russian or Russian-backed military operation in Ukraine could trigger an American action to halt the pipeline in retaliation. Map 1Nord Stream 2 Route
US-Russia Pipeline Standoff Could Push LNG Prices Higher
US-Russia Pipeline Standoff Could Push LNG Prices Higher
In our estimation, there is a 50% chance that the Nord Stream 2 natural gas pipeline will not be completed this year or go into operation as planned given substantial geopolitical risks. The $11 billion pipeline would connect Russia directly to Germany with a capacity of about 55 billion cubic meters, which, combined with the existing Nord Stream One pipeline, would equal 110 BCM in offshore capacity, or 55% of Russia's natural gas exports to Europe in 2019. The pipeline’s construction is 94% complete, with the Russian ship Akademik Cherskiy entering Danish waters in late March to begin laying pipes to finish the final 138-kilometer stretch, according to Reuters. The pipeline could be finished in early August at the pace of 1 kilometer per day.3 The Russian and German governments are speeding up the project to finish it before US-Russia tensions, or the German elections in September, interrupt the construction process again. It is not too late for the US to try to halt the pipeline through sanctions. But for the Americans to succeed, the Biden administration would have to make an aggressive effort. Notably the Biden administration took office with a desire to sharpen US policy toward Russia.4 While Biden seeks Russian engagement on arms reduction treaties and the Iranian nuclear negotiations, he mainly aims to counter Russia, expand sanctions, provide weapons to Ukraine, and promote democracy in Russia’s sphere of influence. The result will almost inevitably be a new US-Russia confrontation, which is already taking shape over Russia’s buildup of troops on the border with Ukraine, where US and Russian meddling could cause civil war to reignite (Map 2). Map 2Russia’s Military Tensions With The West Escalate In Wake Of Biden’s Election And Ukraine’s Renewed Bid To Join NATO
US-Russia Pipeline Standoff Could Push LNG Prices Higher
US-Russia Pipeline Standoff Could Push LNG Prices Higher
Tensions in Ukraine are directly tied to US military cooperation with Ukraine and any possibility that Ukraine will join the NATO military alliance, a red line for Putin. Nord Stream 2 is Russia’s way of bypassing Ukraine but a new US-Russia conflict, especially a Russian attack on Ukraine, would halt the pipeline. The pipeline’s completion would improve Russo-German strategic relations, undercut US liquefied natural gas exports to Germany and the EU, and reduce the US’s and eastern Europe’s leverage over Russia (and Germany). Biden says his administration is planning to impose new sanctions on firms that oversee, construct, or insure the pipeline, and such sanctions are required under American law.5 Yet Biden also wants a strong alliance with Germany, which favors the pipeline and does not want to escalate the conflict with Russia. The American laws against Nord Stream have big loopholes and give the president discretion regarding the use of sanctions, which means Biden would have to make a deliberate decision to override Germany and impose maximum sanctions if he truly wanted to halt construction.6 This would most likely occur if Russia committed a major new act of aggression in Ukraine or against other European democracies. The German policy, under the current ruling coalition led by Chancellor Angela Merkel’s Christian Democratic Union, is to finish the pipeline despite Russia’s conflicts with the West and political repression at home. Russia provides more than a third of Germany’s natural gas imports and this pipeline would bypass eastern Europe’s pipeline network and thus secure Germany’s (and Austria’s and the EU’s) natural gas supply whenever Russia cuts off the flow to Ukraine (through which roughly 40% of Russian natural gas still must pass to reach Europe). Germany's Election And Natgas Politics Germany wants to use natural gas as a bridge while it phases out nuclear energy and coal. Natural gas has grown 2.2 percentage points as a share of Germany’s total energy mix since the Fukushima disaster of 2011, and renewable energy has grown 7.7ppt, while coal has fallen 7.3ppt and nuclear has fallen 2.5ppt (Chart 5). The German federal election on September 26 complicates matters because Merkel and the Christian Democrats are likely to underperform their opinion polls and could even fall from power. They do not want to suffer a major foreign policy humiliation at the hands of the Americans or a strategic crisis with Russia right before the election. They will insist that Biden leave the pipeline alone and will offer other forms of cooperation against Russia in compensation. Therefore, the current German government could push through the pipeline and complete the project even in the face of US objections. But this outcome is not guaranteed. The German Greens are likely to gain influence in the Bundestag after the elections and could even lead the German government for the first time – and they are opposed to a new fossil fuel pipeline that increases Russia’s influence. Chart 5Germany Sees Nord Stream 2 Gas As Bridge To Low-Carbon Economy
US-Russia Pipeline Standoff Could Push LNG Prices Higher
US-Russia Pipeline Standoff Could Push LNG Prices Higher
Hence there is a fair chance that the pipeline does not become operational: either Americans halt it out of strategic interest, or the German Greens halt it out of environmental and strategic interest, or both. True, there is a roughly equal chance that Merkel’s policy status quo survives in Germany, which would result in an operational pipeline. The best case for Germany might be that the current government completes the pipeline physically but the next government has optionality on whether to make it operational. But 50/50 odds of cancellation is a much higher risk than the consensus holds. The Russian policy is to finish Nord Stream 2 while also making an aggressive military stance against the West’s and NATO’s influence in Ukraine. This would expand Russian commodity and energy exports and undercut Ukraine’s natgas transit income. It would also increase Russian leverage over Germany – and it would divide Germany from the eastern Europeans and Americans. A preemptive American intervention would elicit Russian retaliation. The Russians could respond in the strategic sphere or the economic sphere. Economically they could react by cutting off natural gas to Europe, but that would undermine their diplomatic goals, so they would more likely respond by increasing production of natural gas or crude oil to steal American market share. In any scenario Russian retaliation would likely cause global price volatility in one or more energy markets, in addition to whatever volatility is induced by the cancellation of Nord Stream 2 itself. US-Russia tensions are likely to escalate but only Ukraine and Nord Stream 2, or the separate Iranian negotiations, have a direct impact on global energy supply. If Germany goes forward with the pipeline, then Russia would need to be countered by other means. The Americans, not the Germans, would provide these “other means,” such as military support to ensure the integrity of Ukraine and other nations’ borders. The Russians may gain a victory for their energy export strategy but they will never compromise on Ukraine and they will still need to focus on the broader global shift to renewable energy, which threatens their economic model and hence ultimately their regime stability. So, the risk of a market-moving US-Russia conflict can be delayed but probably not prevented (Chart 6). Chart 6US-Russia Conflit Likely
US-Russia Conflit Likely
US-Russia Conflit Likely
Bottom Line: The Nord Stream 2 pipeline is not guaranteed to be completed this year as planned. The US is more likely to force a halt to the Nord Stream 2 pipeline than the consensus holds, especially if Russia attacks Ukraine. If the US fails to do so, then the German election will become the next signpost for whether the pipeline will become operational. If the Americans halt the pipeline, then US-Russian conflict either already erupted or will occur sooner rather than later and will likely impact global oil or natural gas prices. Investment Implications Our subjective assessment of 50% odds the US will succeed in halting completion of the final leg of Nord Stream 2 are higher than the consensus expectation. This translates directly into higher upside risk for natural gas prices in the US and Europe later this year and next. Given our view, we are getting long 1Q22 calls on CME/NYMEX Henry Hub-delivered natgas futures struck at $3.50/MMBtu vs. short 1Q22 $3.75/MMBtu calls at tonight's close. The probability of Nord Stream 2 cancellation is underpriced, which means the odds of higher prices in the LNG market are underpriced (Chart 7). The immediate implication of our view is European TTF prices will have to move higher to attract LNG cargoes next winter from the US, if the Nord Stream 2 pipeline's final leg is cancelled. This also would tighten the Asian markets, causing the JKM to move higher as well (Chart 8). Any indication of colder-than-normal weather in the US, Europe or Asian markets would mean a sharper move higher. Chart 7Natgas Tails Are Too Narrow For Next Winter
US-Russia Pipeline Standoff Could Push LNG Prices Higher
US-Russia Pipeline Standoff Could Push LNG Prices Higher
Chart 8Nord Stream 2 Cancellation Would Boost JKM Prices
Nord Stream 2 Cancellation Would Boost JKM Prices
Nord Stream 2 Cancellation Would Boost JKM Prices
Robert P. Ryan Chief Commodity & Energy Strategist rryan@bcaresearch.com Matt Gertken Vice President Geopolitical Strategy mattg@bcaresearch.com Commodities Round-Up Energy: Bullish The US and Iran began indirect talks earlier this week in Vienna aimed at restoring the Joint Comprehensive Plan of Action (JCPOA), otherwise known as the "Iran nuclear deal." All of the other parties of the deal – Britain, China, France, Germany and Russia – are in favor of restoring the deal. BCA Research believes this is most likely to occur prior to the inauguration of a new president who is expected to be a hardliner willing to escalate Iran’s demands. US President Biden can unilaterally ease sanctions and bring the US into compliance with the deal, and Iran could then reciprocate. If a deal is not reached by August it could take years to resolve US-Iran tensions. China could offer to cooperate on sanctions and help to broker negotiations following the signing of its 25-year trade deal with Iran last week. Russia likely would demand the US not pressure its allies to cancel the Nord Stream 2 deal, in return for its assistance in brokering a deal. Base Metals: Bullish Iron ore prices continue to be supported by record steel prices in China, trading at more than $173/MT earlier this week. Even though steel production reportedly is falling in the top steel-producer in China, Tangshan, as a result of anti-pollution measures, for iron ore remains stout. As we have previously noted, we use steel prices as a leading indicator for copper prices. We remain long Dec21 copper and will be looking for a sell-off to get long Sep21 copper vs. short Sep21 copper if the market trades below $4/lb on the CME/COMEX futures market (Chart 9). Precious Metals: Bullish Gold held support ~ $1,680/oz at the end of March, following an earlier test in the month. We remain long the yellow metal, despite coming close to being stopped out last week (Chart 10). The earlier sell-off appeared to be caused by a need to raise liquidity to us. We continue to expect the Fed to hold firm to its stated intent to wait for actual inflation to become manifest before raising rates, and, therefore, continue to expect real rates to weaken. This will be supportive of gold and commodities generally (Chart 10). Ags/Softs: Neutral Corn continues to be well supported above $5.50/bu, following last week's USDA report showing farmers intend to increase acreage planted to just over 91mm acres, which is less than 1% above last year's level. Chart 9
Copper Prices Surge As Global Storage Draws
Copper Prices Surge As Global Storage Draws
Chart 10
Gold Disconnected From US Dollar And Rates
Gold Disconnected From US Dollar And Rates
Footnotes 1 Please see the Fund's April 2021 forecast Managing Divergent Recoveries. 2 We noted last week these higher growth expectations generally are bullish for industrial commodities – energy, metals, and bulks. Please see Fundamentals Support Oil, Bulks, And Metals, which we published 1 April 2021. It is available at ces.bcaresearch.com. 3 For the rate of construction see Margarita Assenova, “Clouds Darkening Over Nord Stream Two Pipeline,” Eurasia Daily Monitor 18: 17 (February 1, 2021), Jamestown Foundation, jamestown.org. For the current status, see Robin Emmott, “At NATO, Blinken warns Germany over Nord Stream 2 pipeline,” Reuters, March 23, 2021, reuters.com. 4 The Democratic Party blames Russia for what it sees as a campaign to undermine the democratic West and recreate the Soviet sphere of influence. See for example the 2008 invasion of Georgia, the failure of the Obama administration’s 2009-11 diplomatic “reset,” the Edward Snowden affair, the seizure of Crimea and civil war in Ukraine, the survival of Syria’s dictator, and Russian interference in US elections in 2016 and 2020. 5 The Countering Russian Influence in Europe and Eurasia Act of 2017, and the Protecting Europe’s Energy Security Act of 2019/2020, contain provisions requiring sanctions on firms that have contributed in any way a minimum of $1 million to the project, or provide pipe-laying services or insurance. There are exceptions for services provided by the governments of the EU member states, Norway, Switzerland, or the UK. The president has discretion over the implementation of sanctions as usual. 6 The German state of Mecklenburg-Vorpommern is creating a shell foundation to enable the completion of the pipeline. It can shield companies from American sanctions aimed at private companies, not sovereigns. Investment Views and Themes Recommendations Strategic Recommendations Tactical Trades Commodity Prices and Plays Reference Table Summary of Closed Trades
Higher Inflation On The Way
Higher Inflation On The Way
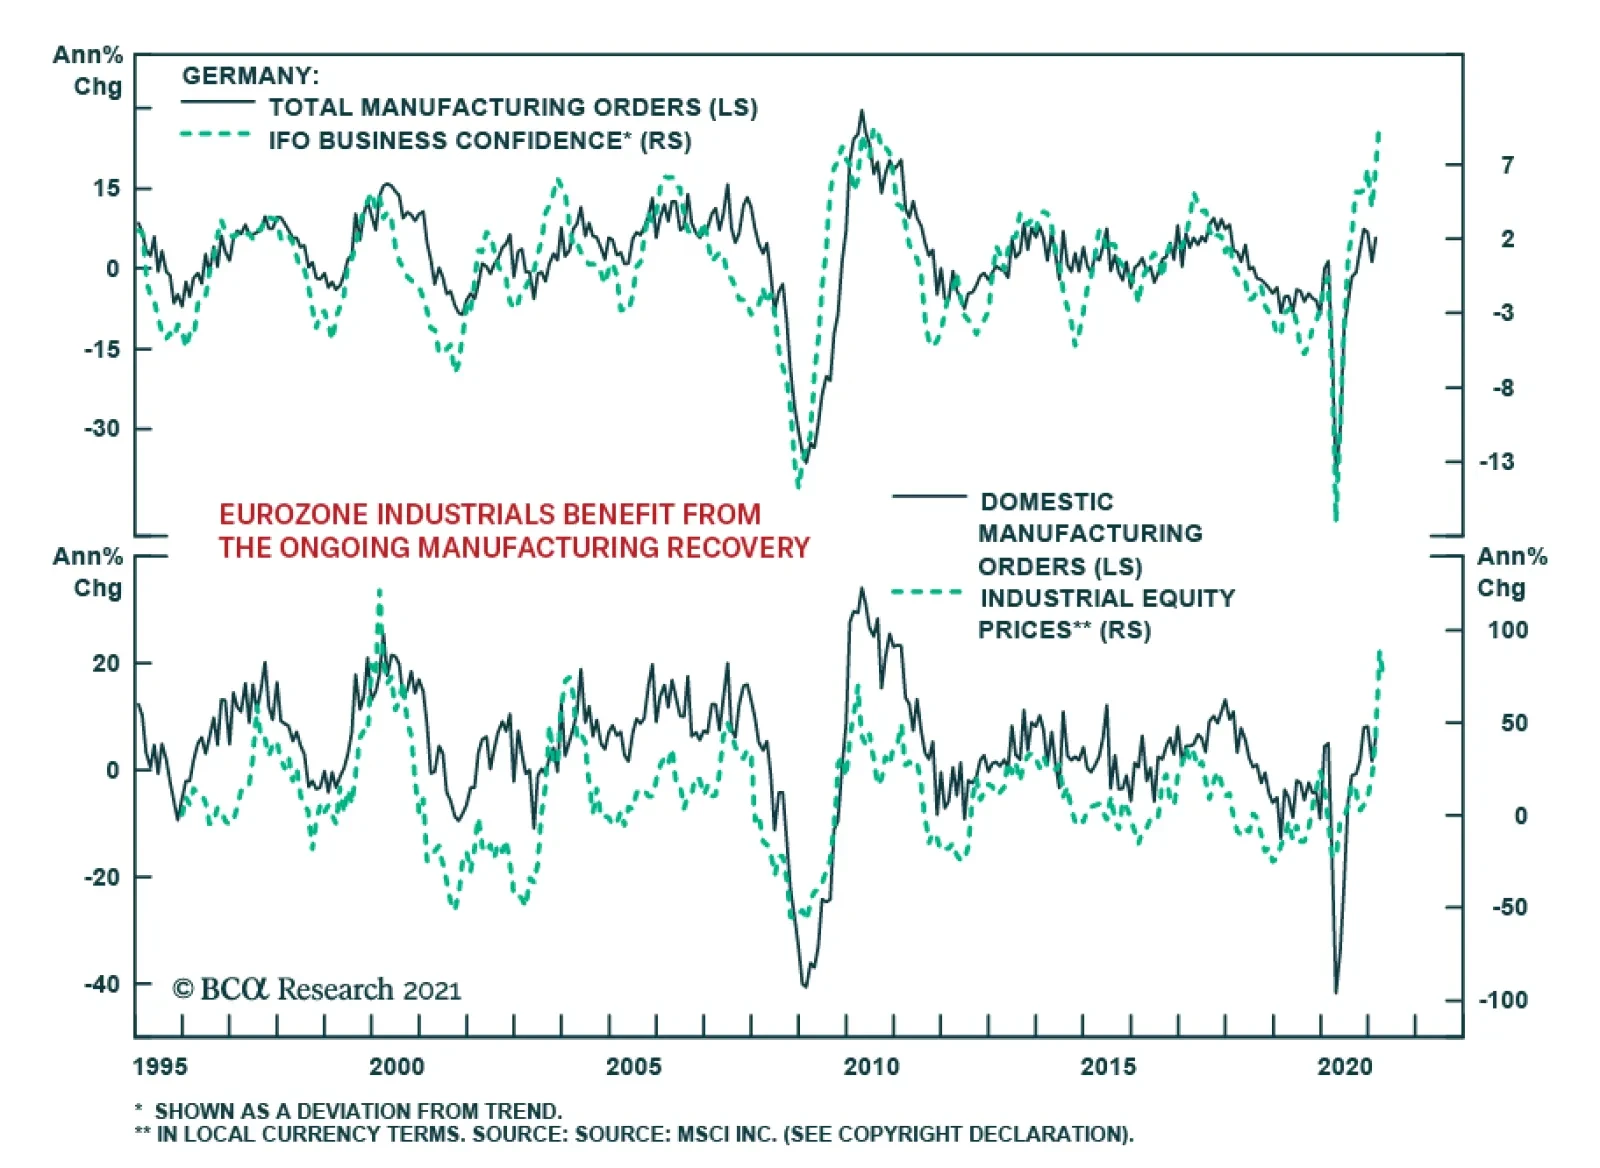
German factory orders accelerated 1.2% m/m in February from 0.8% m/m in January, indicating that the manufacturing recovery is intact. On an annual basis, factory orders jumped 5.6% y/y from 2.5% y/y. The monthly improvement reflects ameliorations in both…
Highlights Q1/2021 Performance Breakdown: Our recommended model bond portfolio outperformed the custom benchmark index by +55bps during the first quarter of the year. Winners & Losers: The government bond side of the portfolio outperformed by +68bps, led overwhelmingly by our underweight to US Treasuries (+63bps). Spread product allocations underperformed by -11bps, primarily due to an overweight on UK corporates (-8bps). Portfolio Positioning For The Next Six Months: We are sticking with an overall below-benchmark portfolio duration stance, given accelerating global growth momentum, expanding vaccinations and a highly stimulative fiscal/monetary policy mix. We are maintaining a moderate overweight to global spread product versus government debt, concentrated on an overweight to US high-yield given more stretched valuations in other credit sectors. On the margin, we are making the following changes to the portfolio allocations: downgrading both UK Gilts and UK investment grade corporates to neutral, while cutting the overall allocation to EM USD credit to neutral. Feature The first quarter of 2021 saw a sharp sell-off in global bond markets on the back of rising growth expectations, fueled by US fiscal stimulus and vaccine optimism. The US was near the front of the pack, with 10-year Treasuries having their biggest first quarter sell-off since 1994. Accommodative financial conditions, fueled by a highly stimulative mix of monetary and fiscal policies and improving sentiment, have lit a fire under a global economy set to reopen from pandemic lockdowns. Going forward, we expect US growth to continue leading the way, with implications for the dollar, commodity prices, and the expected path of policy rates. With that in mind, this week we are reviewing the performance of the BCA Research Global Fixed Income Strategy (GFIS) model bond portfolio during the first quarter of 2021. We also present our recommended positioning for the portfolio for the next six months (Table 1), as well as portfolio return expectations for our base case and alternative investment scenarios. Table 1GFIS Model Bond Portfolio Recommended Positioning For The Next Six Months
GFIS Model Bond Portfolio Q1/2021 Performance Review & Current Allocations: Grand Reopening
GFIS Model Bond Portfolio Q1/2021 Performance Review & Current Allocations: Grand Reopening
As a reminder to existing readers (and to new clients), the model portfolio is a part of our service that complements the usual macro analysis of global fixed income markets. The portfolio is how we communicate our opinion on the relative attractiveness between government bond and spread product sectors. We do this by applying actual percentage weightings to each of our recommendations within a fully invested hypothetical bond portfolio. Q1/2021 Model Portfolio Performance Breakdown: Steering Clear Of Duration Chart 1Q1/2021 Performance: Bearish UST Bets Pay Off
Q1/2021 Performance: Bearish UST Bets Pay Off
Q1/2021 Performance: Bearish UST Bets Pay Off
The total return for the GFIS model portfolio (hedged into US dollars) in the first quarter was -1.83%, dramatically outperforming the custom benchmark index by +55bps (Chart 1).1 This follows modest outperformance in 2020 which was driven largely by overweights on spread product initiated after the pandemic shock to markets. In terms of the specific breakdown between the government bond and spread product allocations in our model portfolio, the former generated +68bps of outperformance versus our custom benchmark index while the latter underperformed by -11bps. Our allocations to inflation-linked bonds in the US, Canada and Europe - which were a source of outperformance in 2020 - modestly underperformed this quarter (-2bps) as global real yields finally began to pick up. Our outperformance this quarter was driven overwhelmingly by our decision to go significantly underweight US Treasuries, and to position for a bearish steepening of the Treasury curve, ahead of last November’s US presidential election (Table 2). That resulted in the US Treasury allocation generating a massive +63bps of excess return in Q1/2022 as longer-term US yields surged higher. Table 2GFIS Model Bond Portfolio Q1/2021 Overall Return Attribution
GFIS Model Bond Portfolio Q1/2021 Performance Review & Current Allocations: Grand Reopening
GFIS Model Bond Portfolio Q1/2021 Performance Review & Current Allocations: Grand Reopening
The size of the US underweight was unusually large as we maintained only a neutral exposure to the other “high beta” markets that are typically positively correlated to US yield moves, Canada and Australia. Although the returns for those two government bond markets were very similar to that of US Treasuries in Q1, so the choice to stay neutral even with a bearish directional view on US yields did not impact the overall portfolio performance. Overweights to the more defensive “low beta” markets of Germany, France and Japan contributed a combined +4bps. We did see some losses on nominal government bonds in peripheral Europe (Italy: -0.6bps; Spain: -1.9bps), however, with the narrowing in spreads thrown off by a botched vaccine rollout. In spread product, underperformance came from overweights to UK investment grade corporates (-8bps), US CMBS (-4bps), and EM USD-denominated corporates (-2bps). This was despite the fact that spreads for UK corporates remained flat while US CMBS spreads actually narrowed. These losses were slightly offset by the overweight to lower-rated US high-yield (+3bps) and underweight to US agency MBS (+2bps). Our spread product losses, in total return terms, highlight the importance of considering duration risk when making a call on spread product, especially at a time when sovereign yields are rising and spreads offer little “cushion”. Duration also played a big part in nominal government bond outperformance, with a whopping +43bps of our total +55bps outperformance concentrated in just US Treasuries with a maturity greater than 10 years. In other words, overweighting overall global spread product and underweighting government bonds still generated major portfolio outperformance, even if there was a more mixed bag of returns within that credit overweight. The bar charts showing the total and relative returns for each individual government bond market and spread product sector are presented in Charts 2 & 3. Chart 2GFIS Model Bond Portfolio Q1/2021 Government Bond Performance Attribution
GFIS Model Bond Portfolio Q1/2021 Performance Review & Current Allocations: Grand Reopening
GFIS Model Bond Portfolio Q1/2021 Performance Review & Current Allocations: Grand Reopening
Chart 3GFIS Model Bond Portfolio Q1/2021 Spread Product Performance Attribution By Sector
GFIS Model Bond Portfolio Q1/2021 Performance Review & Current Allocations: Grand Reopening
GFIS Model Bond Portfolio Q1/2021 Performance Review & Current Allocations: Grand Reopening
Biggest Outperformers: Underweight US Treasuries with a maturity greater than 10 years (+43bps), maturity between 7 and 10 years (+11bps), and with a maturity between 5 and 7 years (+7bps) Overweight US high-yield (+3bps) Underweight US agency MBS (+2bps) Overweight Italian inflation-indexed BTPs (+2bps) Biggest Underperformers: Overweight UK investment grade corporates (-8bps) Overweight US agency CMBS (-4bps) Overweight Spanish government bonds (-2bps) Chart 4 presents the ranked benchmark index returns of the individual countries and spread product sectors in the GFIS model bond portfolio for Q1/2021. Returns are hedged into US dollars (we do not take active currency risk in this portfolio) and adjusted to reflect duration differences between each country/sector and the overall custom benchmark index for the model portfolio. We have also color coded the bars in each chart to reflect our recommended investment stance for each market during Q1 (red for underweight, dark green for overweight, gray for neutral). Chart 4Ranking The Winners & Losers From The GFIS Model Bond Portfolio Universe In Q1/2021
GFIS Model Bond Portfolio Q1/2021 Performance Review & Current Allocations: Grand Reopening
GFIS Model Bond Portfolio Q1/2021 Performance Review & Current Allocations: Grand Reopening
Ideally, we would look to see more green bars on the left side of the chart where market returns are highest, and more red bars on the right side of the chart were returns are lowest. On that front, our portfolio allocations performed exceptionally well in Q1. In total return terms, the global bond market sell-off was a disaster for both government bonds and spread product. US high-yield, one of our longer-standing overweights, was the only sector to emerge unscathed, delivering a positive return of +42bps. Within our government bond allocation, the “defensive” markets—Japan (-44bps), Germany, (-261bps) and France (-371bps)—were nevertheless shaken by rising yields. On the other hand, we limited our downside by maintaining a neutral stance on the higher beta markets such as Canada (-406bps), New Zealand (-415bps), and the UK (-1389bps). Gilts sold off especially sharply as the UK outperformed global peers on COVID-19 vaccinations while inflation expectations continued to pick up. Our two underweights, US Treasuries (-426bps) and European high-yield (-426bps), were prescient. The latter market was one we chose to underweight given that spreads didn’t offer nearly enough compensation on a default-adjusted and breakeven basis. Bottom Line: Our model bond portfolio outperformed its benchmark index in the first quarter of the year by +55bps – a positive result driven by our underweight allocation to the US Treasury market and overall below-benchmark global duration stance. Future Drivers Of Portfolio Returns & Scenario Analysis Chart 5More Growth-Driven Upside For Global Yields Ahead
More Growth-Driven Upside For Global Yields Ahead
More Growth-Driven Upside For Global Yields Ahead
Looking ahead, the performance of the model bond portfolio will continue to be driven predominantly by the future moves of global government bond yields, most notably US Treasuries. Our most favored leading indicators for global bond yields continue to signal more upside over at least the next six months (Chart 5). Our Global Duration Indicator, comprised of measures of future economic sentiment and momentum, remains at an elevated level. The ongoing climb in the global manufacturing PMI, which typically leads global real bond yields by around six months, suggests that the recent uptick in real yields can continue into the second half of 2021. We are still maintaining a bias towards bearish yield curve steepening across all the countries in the model bond portfolio. It is still far too soon to see bearish flattening of yield curves given the dovish bias of global central banks, many of which are actively targeting an overshoot of their own inflation targets. The US will be the first central bank to see any bearish flattening pressure, as the market more aggressively pulls forward the liftoff date of the next Fed tightening cycle in response to strong US growth, but that is an outcome we do not expect until well into the second half of 2021. With regards to country allocations within the government bond segment of the model bond portfolio, we continue to focus our maximum underweight on the US, while limiting exposure to the markets that are more sensitive to changes in US interest rates (Chart 6). Those “lower yield beta” markets (Germany, France and Japan) will continue to outperform the higher beta markets (Canada, Australia) over the latter half of 2021. We currently have Canada on “downgrade watch”, as economic momentum is accelerating and the housing bubble looks to be reflating, both of which will make the Bank of Canada turn more hawkish shortly after the Fed does. We are more comfortable keeping Australia at neutral, as Australian inflation is likely to remain too underwhelming for the Reserve Bank of Australia to turn less dovish and risk a surge in the Australian dollar. UK Gilts are a more difficult case, atypically acting like a lower beta market over the past few years. As we discussed in a Special Report published last month, we attribute the declining Gilt yield beta to the rolling shocks the UK has suffered over the past thirteen years – the 2008 global financial crisis, the 2012 euro area debt crisis, Brexit and, now, COVID-19 – that have hamstrung the Bank of England’s ability to try even modest interest rate hikes.2 With the impact of those shocks on UK growth now diminishing, we see the central bank under greater pressure to begin normalizing UK monetary policy over the couple of years. We downgraded our cyclical stance on UK Gilts and UK investment grade corporates to neutral from overweight in that Special Report and, this week, we are making the same reduction in UK weightings in our model bond portfolio (see the portfolio tables on pages 20-21). After that change, the overall duration of the model bond portfolio remains below that of the custom benchmark index, now by -0.75 years (Chart 7). Chart 6Low-Beta Markets Will Continue To Outperform USTs
Low-Beta Markets Will Continue To Outperform USTs
Low-Beta Markets Will Continue To Outperform USTs
Chart 7Overall Portfolio Duration: Stay Below Benchmark
Overall Portfolio Duration: Stay Below Benchmark
Overall Portfolio Duration: Stay Below Benchmark
We continue to see the dovish bias of global central bankers as being conducive to the outperformance of inflation-linked bonds versus nominal government debt (Chart 8). Yes, the “easy money” has been made betting on a recovery of inflation expectations from the bombed-out levels seen after the COVID-19 recession in 2020. However, within the major developed economies with inflation-linked bond markets, 10-year breakevens have already climbed beyond the pre-pandemic levels of early 2020 (Chart 9). The next targets are the previous cyclical highs seen in 2018 (and 2019 for the UK). Chart 8Dovish Central Banks Still Positive For Inflation-Linked Bonds
Dovish Central Banks Still Positive For Inflation-Linked Bonds
Dovish Central Banks Still Positive For Inflation-Linked Bonds
Chart 9Inflation Breakevens Returning To Past Cyclical Peaks
Inflation Breakevens Returning To Past Cyclical Peaks
Inflation Breakevens Returning To Past Cyclical Peaks
Chart 10Still A Supportive Backdrop For Global Corporates
Still A Supportive Backdrop For Global Corporates
Still A Supportive Backdrop For Global Corporates
The 10-year US TIPS breakeven is already past that 2018 peak of 2.18%, and with the Fed showing no sign of concern about US growth and inflation accelerating, the 10-year US breakeven should end up moving into the high end of our expected 2.3-2.5% target range before the Fed begins to turn less dovish. Thus, we are maintaining a core allocation to linkers in the portfolio, focused on US TIPS and inflation-linked bonds in Italy, France and Canada. The same aggressive easing of global monetary policy that has been good for relative inflation-linked bond performance continues to benefit global corporate bonds. The annual rate of growth of the combined balance sheets of the Fed, ECB, Bank of Japan and Bank of England remains an excellent leading indicator of the excess returns of both global investment grade and high-yield corporates over the past decade (Chart 10). With the combined balance sheet now expanding at a 55% pace, corporate bonds are still likely to continue to outperform government debt over the remainder of 2021. Much of that expected return outperformance of corporates will come via carry rather than spread compression, though. Our preferred measure of the attractiveness of credit spreads, the historical percentile ranking of 12-month breakeven spreads, shows that only US high-yield spreads are above the bottom quartile of their history among the credit sectors in our model portfolio (Chart 11). Given the absence of spread cushion in those other markets, we are maintaining an overweight stance on US high-yield in the model bond portfolio – especially versus euro area high-yield where we are underweight - while staying neutral investment grade credit in the US and Europe. Chart 11US High-Yield: The Last Bastion Of Attractive Spreads
GFIS Model Bond Portfolio Q1/2021 Performance Review & Current Allocations: Grand Reopening
GFIS Model Bond Portfolio Q1/2021 Performance Review & Current Allocations: Grand Reopening
Within the euro area, we continue to prefer owning Italian government bonds over investment grade corporates, given the European Central Bank’s more explicit support for the former through quantitative easing (Chart 12). We expect Italian yields and spreads to converge down to Spanish levels, likely within the next 6-12 months, while there is limited downside for euro area investment grade spreads given tight valuations. Chart 12Favor Italian BTPs Over Euro Area IG
Favor Italian BTPs Over Euro Area IG
Favor Italian BTPs Over Euro Area IG
We are not only looking at relative valuation considerations in developed market credit. Emerging market (EM) USD-denominated credit has benefited from a bullish combination of global policy stimulus, a weakening US dollar and rising commodity prices. We have positioned for that in our model portfolio through an overall overweight stance on EM USD credit, but one that favors investment grade corporates over sovereigns. Now, with the Chinese credit impulse likely to slow in the latter half of 2021 as Chinese policymakers look to rein in stimulus, a slower pace of Chinese economic growth represents a risk to EM credit (Chart 13). The same can be said for the US dollar, which is no longer depreciating with US bond yields rising and the markets questioning the Fed’s dovish forward guidance on future rate hikes (Chart 14). A strong US dollar would also be a risk to the commodity price rally that has supported EM financial assets. Chart 13Global Policy Mix Becoming Less Supportive For EM
Global Policy Mix Becoming Less Supportive For EM
Global Policy Mix Becoming Less Supportive For EM
Chart 14A Stronger USD Is A Risk For EM Corporates Vs Sovereigns
A Stronger USD Is A Risk For EM Corporates Vs Sovereigns
A Stronger USD Is A Risk For EM Corporates Vs Sovereigns
Chart 15A Moderate Overweight To Spread Product Vs Government Debt
GFIS Model Bond Portfolio Q1/2021 Performance Review & Current Allocations: Grand Reopening
GFIS Model Bond Portfolio Q1/2021 Performance Review & Current Allocations: Grand Reopening
In response to these growing risks to the bullish EM backdrop, we are downgrading our overall EM USD credit exposure in the model bond portfolio to neutral from overweight. We are maintaining our relative preference for EM investment grade corporates over sovereigns, however, within that overall neutral allocation. Summing it all up, we are sticking with a moderately overweight stance on global spread product versus government debt in the model portfolio, equal to four percentage points (Chart 15). That overweight comes entirely from the US high-yield allocation. After the changes made to our UK and EM positions, the tracking error of the portfolio, or its expected volatility versus that of the benchmark index, is quite low at 41bps (Chart 16). This is an unsurprising outcome given that the current positioning is focused so heavily on the US (Treasury underweight, high-yield overweight), with much of the other positioning close to neutral. That will change as 2021 progresses but, for now, our highest conviction views are in US fixed income. One final point – the relatively concentrated positioning leaves the portfolio “flat carry”, with a yield roughly equal to that of the benchmark index (Chart 17). Chart 16Limited Use Of Portfolio 'Tracking Error'
Limited Use Of Portfolio 'Tracking Error'
Limited Use Of Portfolio 'Tracking Error'
Chart 17Model Portfolio Yield Close To Benchmark
Model Portfolio Yield Close To Benchmark
Model Portfolio Yield Close To Benchmark
Scenario Analysis & Return Forecasts After making the shifts to our model bond portfolio allocations in the UK and EM, we now turn to scenario analysis to determine the return expectations for the portfolio for the next six months. On the credit side of the portfolio, we use risk-factor-based regression models to forecast future yield changes for global spread product sectors as a function of four major factors - the VIX, oil prices, the US dollar and the fed funds rate (Table 2A). For the government bond side of the portfolio, we avoid using regression models and instead use a yield-beta driven framework, taking forecasts for changes in US Treasury yields and translating those in changes in non-US bond yields by applying a historical yield beta (Table 2B). For our scenario analysis over the next six months, we use a base case scenario plus two alternate “tail risk” scenarios, based on the following descriptions and inputs: Table 2AFactor Regressions Used To Estimate Spread Product Yield Changes
GFIS Model Bond Portfolio Q1/2021 Performance Review & Current Allocations: Grand Reopening
GFIS Model Bond Portfolio Q1/2021 Performance Review & Current Allocations: Grand Reopening
Table 2BEstimated Government Bond Yield Betas To US Treasuries
GFIS Model Bond Portfolio Q1/2021 Performance Review & Current Allocations: Grand Reopening
GFIS Model Bond Portfolio Q1/2021 Performance Review & Current Allocations: Grand Reopening
Base case: Ongoing global vaccinations lead to more of the global economy reopening over the summer, with excess savings built up during the pandemic – augmented by ongoing fiscal support – starting to be spent. US economic growth will be most robust out of the major economies, given the additional boost from fiscal stimulus, while China implements actions to slow credit growth and the euro area lags on vaccinations. The Fed stands its ground and maintains no rate hikes until at least 2023, and US TIPS breakevens climb to levels consistent with the Fed’s 2% inflation mandate (2.3-2.5%). The US Treasury curve continues to bear-steepen, with the 10-year US yield rising to 2%. The VIX falls to 15, the US dollar is flat, the Brent oil price rises +5%, and the fed funds rate is unchanged at 0%. Optimistic case: A rapid pace of global vaccinations leads to booming growth led by the US but including a reopening euro area. Chinese policymakers tighten credit by less than expected. Markets begin to pull forward the timing and pace of future central bank interest rate hikes, most notably in the US but also in the other countries like Canada and the UK. Real bond yields continue to climb globally, but inflation breakevens stay elevated. The steepening trend of the US Treasury curve ends, and mild bear flattening begins with the 10-year reaching 2.2% and the 2-year yield climbing to 0.4%. The VIX stays unchanged at 18, the US dollar rises +5%, the Brent oil price climbs +2.5% and the fed funds rate stays unchanged. Pessimistic case: Setbacks on the pandemic, either from struggles with vaccine distribution or a surge in variant cases, lead to a slower pace of global growth momentum. Europe cannot reopen, China tightens credit policy faster than expected, and US households hold onto to excess savings amid lingering virus uncertainty. Diminished economic optimism leads to a pullback in global equity values and wider global credit spreads. The US Treasury curve bull flattens as longer-maturity yields fall in a risk-off move, with the 10-year yield moving back down to 1.5%. The VIX rises to 25, the US dollar falls -2.5% and the fed funds rate stays at 0%. The inputs into the scenario analysis are shown in Chart 18 (for the USD, VIX, oil and the fed funds rate), while the US Treasury yield scenarios are in Chart 19. The excess return scenarios for the model bond portfolio, using the above inputs in our simple quantitative return forecast framework, are shown in Table 3A (the scenarios for the changes in US Treasury yields are shown in Table 3B). Chart 18Risk Factor Assumptions For The Scenario Analysis
Risk Factor Assumptions For The Scenario Analysis
Risk Factor Assumptions For The Scenario Analysis
Chart 19US Treasury Yield Assumptions For The Scenario Analysis
US Treasury Yield Assumptions For The Scenario Analysis
US Treasury Yield Assumptions For The Scenario Analysis
Table 3AGFIS Model Bond Portfolio Scenario Analysis For The Next Six Months
GFIS Model Bond Portfolio Q1/2021 Performance Review & Current Allocations: Grand Reopening
GFIS Model Bond Portfolio Q1/2021 Performance Review & Current Allocations: Grand Reopening
Table 3BUS Treasury Yield Assumptions For The 6-Month Forward Scenario Analysis
GFIS Model Bond Portfolio Q1/2021 Performance Review & Current Allocations: Grand Reopening
GFIS Model Bond Portfolio Q1/2021 Performance Review & Current Allocations: Grand Reopening
The model bond portfolio is expected to deliver an excess return over the next six months of +46bps in the base case and +54bps in the optimistic scenario, but is only projected to underperform by -27bps in the pessimistic scenario. Bottom Line: We are sticking with an overall below-benchmark portfolio duration stance, given accelerating global growth momentum, expanding vaccinations and a highly stimulative fiscal/monetary policy mix. We are maintaining a moderate overweight to global spread product versus government debt, concentrated on an overweight to US high-yield given more stretched valuations in other credit sectors. On the margin, we are making the following changes to the portfolio allocations: downgrading both UK Gilts and UK investment grade corporates to neutral, while cutting the overall allocation to EM USD credit to neutral. Robert Robis, CFA Chief Fixed Income Strategist rrobis@bcaresearch.com Shakti Sharma Research Associate ShaktiS@bcaresearch.com Footnotes 1 The GFIS model bond portfolio custom benchmark index is the Bloomberg Barclays Global Aggregate Index, but with allocations to global high-yield corporate debt replacing very high quality spread product (i.e. AA-rated). We believe this to be more indicative of the typical internal benchmark used by global multi-sector fixed income managers. 2 Please see BCA Research Global Fixed Income Strategy/Foreign Exchange Strategy Special Report, "Why Are UK Interest Rates Still So Low?", dated March 10, 2021, available at gfis.bcaresearch.com. Recommendations The GFIS Recommended Portfolio Vs. The Custom Benchmark Index
GFIS Model Bond Portfolio Q1/2021 Performance Review & Current Allocations: Grand Reopening
GFIS Model Bond Portfolio Q1/2021 Performance Review & Current Allocations: Grand Reopening
Duration Regional Allocation Spread Product Tactical Trades Yields & Returns Global Bond Yields Historical Returns
Highlights The Eurozone economy and assets remain beholden to the global manufacturing cycle. This sensitivity reflects the large share of output generated by capex and exports. Yet, the second half of 2021 and first half of 2022 could see euro area growth follow the beat of its own drum. This is a consequence of the unique role of consumption in the COVID-19 recession. European growth will therefore outperform expectations, even if economic momentum slows outside of Europe. Consequently, the euro and Eurozone equities will outperform for the coming 12 to 18 months. Feature For the past 20 years, investors have used a simple rule of thumb to understand European growth and markets. Europe is a derivative of global growth because of its large manufacturing sector and torpid domestic economy. A reductionist approach would even argue that China’s economy is what matters most for Europe. Is this model still valid to analyze Europe? In general, this approach still holds up well. However, the nature of the 2020 COVID-19 recession suggests that the European economy could still accelerate in the second half of the year, despite a small slowdown in the Chinese economy and global manufacturing sector. The Origin Of The Pro-Cyclicality Narrative Investors in European markets have long understood that Eurozone equities outperform when the global manufacturing cycle accelerates. This pro-cyclicality of European stocks is a consequence of their heavy weighting toward cyclical and value stocks, such as industrials, consumer discretionary and financials. Chart 1German/US Spreads: Global Manufacturing Cycle
German/US Spreads: Global Manufacturing Cycle
German/US Spreads: Global Manufacturing Cycle
Historically, European yields have also moved in a very pro-cyclical fashion. Over the past 30 years, periods when German 10-year yields rose relative to that of US Treasury Notes have coincided with an improvement in the global manufacturing sector as approximated by the ISM Manufacturing survey (Chart 1). Investors also understand that the euro is a pro-cyclical currency. Some of this behavior reflects the counter-cyclicality of the US dollar. However, if German yields rise more than US ones when global growth improves and European equities outperform under similar conditions, the euro naturally attracts inflows when the global manufacturing sector strengthens. Chart 2China Is A Key Determinant Of European Activity
China Is A Key Determinant Of European Activity
China Is A Key Determinant Of European Activity
Ultimately, the responsiveness of the euro and European assets to global growth is rooted in the nature of the European economy. Trade and manufacturing account for nearly 40% and 14% of GDP, respectively, compared to 26% and 11% for the US. This economic specialization has made Europe extremely sensitive to the gyrations of the Chinese economy, the largest contributor to fluctuation in the global demand for capital goods. As Chart 2 highlights, European IP and PMI outperform the US when China’s marginal propensity to consume (as approximated by the growth in M1 relative to M2) picks up. Is The Pro-Cyclical Narrative Still Valid? Despite the euro area debt crisis and the slow health and fiscal policy response of European authorities to COVID-19, evidence suggests that the Eurozone’s pro-cyclicality is only increasing. Chart 3Europe Is Becoming More Sensitive To The Rest Of The World Europe Is Becoming More Sensitive To The Rest Of The World
Europe Is Becoming More Sensitive To The Rest Of The World Europe Is Becoming More Sensitive To The Rest Of The World
Europe Is Becoming More Sensitive To The Rest Of The World Europe Is Becoming More Sensitive To The Rest Of The World
A simple statistical analysis confirms this hypothesis. A look at the beta of European GDP growth against the Global PMI reveals that the sensitivity of Eurozone growth and German growth to the Global PMI has steadily increased over the past 20 years (Chart 3, top panel). Moreover, the beta of euro area growth to the global PMI is now higher than that of the US, despite a considerably lower potential GDP growth, which means that a greater proportion of the Eurozone’s GDP growth is affected by globally-driven fluctuations. The bottom panel of Chart 3 shows a more volatile but similar relationship with Chinese economic activity. Correlation analysis confirms that Europe remains very sensitive to global factors. Currently, the rolling correlation of a regression of Eurozone GDP growth versus that of China stands near 0.7, which is comparable to levels that prevailed between 2005 and 2012. The correlation between German and Chinese GDP growth is now higher than at any point during the past two decades. Chart 4The Declining Role Of Consumption
The Declining Role Of Consumption
The Declining Role Of Consumption
The increasing influence of global economic variables on the European economy reflects the evolution of the composition of the Eurozone’s GDP. Over the past 11 years, the share of consumption within GDP has decreased from 57% to 52%. For comparison’s sake, consumption accounts for 71% of US GDP. The two sectors that have taken the primacy away from consumption are capex and net exports, whose combined share has grown from 22% to 26% of GDP (Chart 4). This shift in the composition of GDP echoes the structural forces facing the Eurozone. An ageing population, a banking system focused on rebuilding its balance sheet, and the tackling of the competitiveness problems of peripheral economies have hurt wage growth, consumption and imports. Meanwhile, exports have remained on a stable trend, thanks to both the comparative vigor of the euro area’s trading partners and a cheap euro. Therefore, net exports expanded. Capex benefited from the strength in European exports. A Granger causality test reveals that consumption has little impact on fixed-capital formation in the euro area. However, the same method shows that fluctuations in export growth cause changes in investment. This makes sense. The variance in exports is an important contributor to the variability of Eurozone profits (Chart 5). Thus, rising exports incentivize the European corporate sector to expand its capital stock to fulfill foreign demand. The expanding share of output created by exports and capex along with the role of exports as a driver of capex explains why Europe economic activity is bound to remain so sensitive to the fluctuations in global trade and manufacturing activity. Moreover, the capex/exports interplay even affects consumption. As Chart 6 shows, the growth of euro area personal expenditures often bottoms after the annual rate of change of the new orders of capital goods has troughed, which reflects the role of exports as a driver of European income. Chart 5Profits And Exports
Profits And Exports
Profits And Exports
Chart 6Consumption Doesn't Move In A Vacuum
Consumption Doesn't Move In A Vacuum
Consumption Doesn't Move In A Vacuum
Bottom Line: European economic activity remains a high beta play on global and Chinese growth. The decrease in consumption to the benefit of exports and capex explains why this reality will not change anytime soon. 2021, An Idiosyncratic Year? In 2021, consumption will be the key input to the European economic performance, despite the long-term relationship between European GDP and foreign economic activity. This will allow European growth to narrow some of its gap with the US and the rest of the world in the second half of this year and the first half of 2022, even if the global manufacturing sector comes off its boil soon. The 2020 recession was unique. In a normal recession, capex, real estate investment, spending on durable goods and the manufacturing sector are the main contributors to the decline in GDP. This time, consumption and the service sector generated most of the contraction in output. These two sectors also caused the second dip in GDP following the tightening of lockdown measures across Europe last winter. Once the more recent wave of lockdowns is behind us, consumption will most likely slingshot to higher levels. More than the US, where the economy has been partially open for months now, Europe remains replete with significant pent-up demand. Obviously, fulfilling this demand will require further progress in the European vaccination campaign, something we recently discussed. Chart 7The Money Supply Forecasts A Rapid Recovery
The Money Supply Forecasts A Rapid Recovery
The Money Supply Forecasts A Rapid Recovery
The surge in M1 also points to a sharp rebound in consumption once governments lift the current lockdowns (Chart 7). M1 is a much more reliable predictor of economic activity in Europe than in the US, because disintermediation is not as prevalent in the Eurozone, where banks account for 72% and 88% of corporate and household credit, respectively, compared to 32% and 29% in the US. We cannot dismiss the explosion in the money supply as only a function of the ECB’s actions. European banks are in much better shape today than they were 10 years ago. Non-performing loans have been steadily decreasing. A rise in delinquencies is likely in the coming quarters due to the pandemic; however, the EUR3 trillion in credit guarantees by governments will limit the damages to the private sector’s and banking system’s balance sheets. Moreover, the Tier-1 capital ratio of the banking system ranges between 14% for Spain and 17% for Germany, well above the 10.5% threshold set by Basel-III (Chart 8). In this context, the pick-up in money supply mirrored credit flows. Thus, even if some of that credit reflects precautionary demand, the likelihood is high that a significant proportion of the built-up cash balances will find its way into the economy. Another positive sign for consumption comes from European confidence surveys. Despite tighter lockdown measures, consumer confidence has sharply rebounded, which historically heralds stronger consumption. Moreover, according to the ECB’s loan survey, stronger consumer confidence is causing an improvement in credit demand, which foreshadows a decline in savings intentions, especially now that wage growth is stabilizing (Chart 9). Nonetheless, there is still a risk that the advance in wages peters off. The recent wage agreement reached by Germany’s IG Metall union in North Rhine Westphalia was a paltry 1.3% annual pay raise, and once the Kurzarbeit programs end, the true level of labor market slack will become evident. However, for consumption to grow, all that we need to see now is stable wage growth, even if at a low rate. Chart 8European Banks Are Feeling Better
European Banks Are Feeling Better
European Banks Are Feeling Better
Chart 9Confidence Points To Stronger Consumption
Confidence Points To Stronger Consumption
Confidence Points To Stronger Consumption
Beyond consumption, Europe’s fiscal policy will be positive compared to the US next year. The NGEU plan will add roughly 1% to GDP in both 2021 and 2022. As a result, the Eurozone’s net fiscal drag should be no greater than 1% of GDP next year. This compares to a fiscal thrust of -7% in the US in 2022, even after factoring in the new “American Jobs Act” proposed by the Biden Administration last week, according to our US Political Strategy team. Bottom Line: The revival in European consumption in the second half of 2021 and the first half of 2022 will allow the gap between European and global growth to narrow. This dynamic will be reinforced next year, when the fiscal drag will be lower in Europe than in the US. These forces will create a rare occasion when European growth will improve despite a deceleration (albeit a modest one) in global manufacturing activity. Investment Conclusions The continued sensitivity of the euro area economy to the global industrial and trade cycle indicates that over the long-term, European assets will remain beholden to the gyrations of global growth. In other words, the euro and European stocks will outperform in periods of accelerating global manufacturing activity, as they have done over the past 30 years. The next 12 to 18 month may nonetheless defy this bigger picture, allowing European assets to generate alpha for global investors. Chart 10The Euro Will Like Idiosyncratic European Growth
The Euro Will Like Idiosyncratic European Growth
The Euro Will Like Idiosyncratic European Growth
First, the gap between US and euro area growth will narrow over the coming 12 to 18 months, thus the euro will remain well bid, even if the maximum acceleration in global industrial activity lies behind. As investors re-assess their view of European economic activity and the current period of maximum relative pessimism passes, inflows into the euro area will accelerate and the euro will appreciate (Chart 10). Hence, we continue to see the recent phase of weakness in EUR/USD as transitory. Second, European equities have scope to outperform US ones over that window. Some of that anticipated outperformance reflects our positive stance on the euro. However, a consumption-driven economic bounce will be positive for European financials as well. Such a recovery will let investors ratchet down their estimates of credit losses in the financial system. Moreover, banks are well capitalized, thus the ECB will permit the resumption of dividend payments. Under these circumstances, European banks have scope to outperform US ones temporarily, especially since Eurozone banks trade at a 56% discount to their transatlantic rivals on a price-to-book basis. An outperformance of financials will be key for Europe’s performance. Chart 11German/US Spreads Near Equilibrium?
German/US Spreads Near Equilibrium?
German/US Spreads Near Equilibrium?
Finally, we could enter a period of stability in US/German yield spreads over the coming months. The ECB remains steadfast at limiting the upside in European risk-free rates, as Christine Lagarde reiterated last week. However, BCA’s US bond strategist, Ryan Swift, believes US yields will enter a temporary plateau, as the Federal Reserve will not adjust rates until well after the US economy has reached full employment. Hence, the Fed is unlikely to let the OIS curve bring forward the date of the first hike currently priced in for August 2022 on a durable basis, which also limits the upside to US yields. Thus, looking at core CPI and policy rate differences, US yields have reached a temporary equilibrium relative to Germany (Chart 11). Mathieu Savary, Chief European Investment Strategist Mathieu@bcaresearch.com
Highlights The Biden Administration's $2.25 trillion infrastructure plan rolled out yesterday will, at the margin, boost global demand for energy and base metals more than expected later this year and next. Global GDP growth estimates – and the boost supplied by US stimulus – once again will have to be adjusted higher (Chart of the Week). Energy and metals fundamentals continue to tighten. OPEC 2.0's so-far-successful production management strategy will keep the level of supply just below demand, which will keep Brent crude oil on either side of $60/bbl. Base-metals output will struggle to meet higher demand from the ongoing buildout of renewables infrastructure and growing electric-vehicle sales. Of late, concerns that speculative positioning suggests prices will head lower – or, at other times, higher – are entirely misplaced: Spec positioning conveys no information on price levels or direction. Energy and metals prices, on the other hand, do convey useful information on spec positioning, demonstrating specs do not lead the news or prices, they follow them. Short-term headwinds caused by halting recoveries and renewed lockdowns – particularly in the EU – will fade in 2H21 as vaccines roll out, if the experience of the UK and US are any guide. Continued USD strength, however, would remain a headwind. Feature If the Biden administration is successful in getting its $2.25 trillion infrastructure-spending bill through Congress, the US will join the rest of the world in the race to re-build – in some cases, build anew – its long-neglected bridges, roads, schools, communications and high-speed transportation networks, and, critically, its electric-power grid. There's a lot of game left to play on this, but our Geopolitical Strategy group is giving this bill an 80% of passage later this year, after all the wrangling and log-rolling in Congress is done. In and of itself, the infrastructure-directed spending coming out of Biden's plan will be a catalyst for higher US industrial commodity demand – energy, metals and bulks. In addition, it will support the lift in the demand boost coming out of higher GDP growth globally, which will be pushed higher by US fiscal spending, as the Chart of the Week shows. Of note is the extremely robust growth expected in India, China and the US, which are among the largest consumers of industrial commodities globally. Overall growth in the G20 and globally will be expansive in 2022 as well. Chart of the WeekBiden's $2.25 Trillion Infrastructure Bill Will Boost Global Commodity Demand
Fundamentals Support Oil, Bulks, And Metals
Fundamentals Support Oil, Bulks, And Metals
Higher GDP growth translates directly into higher demand for commodities, all else equal, as can be seen in the relationship between EM and DM GDP, supply and inventories and Brent crude oil prices in Chart 2. While we have reduced our Brent forecast for this year to $60/bbl on the back of renewed demand-side weakness in the EU due to problems in acquiring and distributing COVID-19 vaccines, we expect this to be reversed next year and into 2025, with prices trading between $60-$80/bbl (Chart 3). OPEC 2.0, the oil-producer coalition led by the Kingdom of Saudi Arabia (KSA) and Russia, has done an excellent job of keeping the level of oil supply below demand over the course of the pandemic, which we expect to continue to the end of 2025.1 Chart 2Higher GDP Growth Presages Higher Commodity Demand
Higher GDP Growth Presages Higher Commodity Demand
Higher GDP Growth Presages Higher Commodity Demand
Chart 3Brent Crude Oil Prices Will Average - / bbl to 2025
Brent Crude Oil Prices Will Average $60 - $80 / bbl to 2025
Brent Crude Oil Prices Will Average $60 - $80 / bbl to 2025
As the Biden plan makes its way through Congress, markets will get a better idea of how much diesel fuel, copper, steel, iron ore, etc., will be required in the US alone. What is important to note here that the US is just moving to the starting line, whereas other economies like China and the EU already have begun their investment cycles in renewables and EVs. At present, key markets already are tight, particularly copper (Chart 4) and aluminum (Chart 5). In both markets, we expect physical deficits this year and next, which inclines us to believe the metals leg of this renewables buildout is just beginning – higher prices will be required to incentivize the development of new supply.2 Chart 4Copper Will Post Physical Deficit...
Copper Will Post Physical Deficit...
Copper Will Post Physical Deficit...
Chart 5...As Will Aluminum
...As Will Aluminum
...As Will Aluminum
This is particularly important in copper, where growth in mining output of ore has been flat for the past two years. Copper is the one metal that spans all renewables technologies, and is a bellwether commodity for global growth. We expect copper to trade to $4.50/lb (up ~ $0.50/lb vs spot) on the COMEX in 4Q21 on the back of increasing demand and tight supplies – i.e., falling mining supply and refined copper output growth (Chart 6). Worth noting also is steel rebar and hot-rolled coil prices traded at record highs this week on Chinese futures markets. Stronger steel markets continue to support iron ore prices, although the latter is trading off its recent highs and likely will move lower toward the end of the year as Brazilian supply returns to the market.3 We use steel prices as a leading indicator for copper prices – steel leads copper prices by ~ 9 months. This makes sense when one considers steel is consumed early in infrastructure and construction projects, while copper consumption occurs later as airports and houses are fitted with copper for electric, plumbing and communications applications. Chart 6Copper Ore Output Flat
Copper Ore Output Flat
Copper Ore Output Flat
Does Speculative Positioning Matter? Of late, media pundits and analysts have cited an unwinding of speculative positions in oil and metals markets following sharp run-ups in net long positions as a harbinger of weaker prices in the near future (Chart 7).4 At other times, speculation has been invoked as a reason for price surges – e.g., when oil rocketed toward $150/bbl in mid-2008, which was followed by a price collapse at the start of the Global Financial Crisis (GFC).5 Brunetti et al note, "The role of speculators in financial markets has been the source of considerable interest and controversy in recent years. Concern about speculative trading also finds support in theory where noise traders, speculative bubbles, and herding can drive prices away from fundamental values and destabilize markets." (p. 1545) Chart 7Speculative Positioning Lower In Brent Than WTI
Speculatives Positioning Lower in Brent Than WTI
Speculatives Positioning Lower in Brent Than WTI
We recently re-tested earlier findings in our research, which found that knowledge of how specs are positioned – either on the long or the short side of the market – conveys no information on the level of prices or the change that should be expected given that knowledge. However, knowledge of the price level does convey useful information on how speculators are positioned in futures markets.6 In cointegrating regressions of speculative positions in crude oil, natural gas and copper futures on price levels for these commodities, we find the level of prices to be a statistically significant determinant of spec positions. We find no such relationship using spec positions as an explanatory variable for prices.7 On the other hand, Chart 2 above is an example of statistically significant relationships for Brent and WTI price as a function of supply-demand fundamentals displaying coefficients of determination (r-squares) of close to 90% in the post-GFC period (2010 to now). This supports our earlier findings regarding spec behavior: They follow prices, they don't lead them.8 We are not dismissive of speculation. It plays a critical role in markets, by providing the liquidity that enables commodity producers and consumers to hedge their price exposures, and to investors seeking to diversify their portfolios with commodity exposures that are uncorrelated to their equity and bond holdings. Short-Term Headwinds Likely Dissipate COVID-19 remains the largest risk to markets generally, commodities in particular. The mishandling of vaccine rollouts in the EU has pushed back our assumption for demand recovery deeper into 2H21, but it has not derailed it. We expect COVID-related deaths and hospitalizations to fall in the EU as they have in the UK and the US following the widespread distribution of vaccines, which should occur in the near future as Brussels organizes its pandemic response (Chart 8). Making vaccines available for other states in dire straits will follow, which will allow the global re-opening to progress as lockdowns are lifted (Chart 9). Chart 8EU Vaccination Rollouts Will Boost Global Economic Recovery
Fundamentals Support Oil, Bulks, And Metals
Fundamentals Support Oil, Bulks, And Metals
Chart 9Global Re-Opening Has Slowed, But Will Resume In 2H21
Fundamentals Support Oil, Bulks, And Metals
Fundamentals Support Oil, Bulks, And Metals
The other big risk we see to commodities is persistent USD strength (Chart 10). The dollar has rallied for the better part of 2021, largely on the back of improving US economic prospects relative to other states, and success in its vaccination efforts. The resumption of the USD's bear market may have to wait until the rest of the world catches up with America's public-health response to the pandemic, and the global economy ex-US and -China enters a stronger expansionary mode. Bottom Line: We remain bullish industrial commodities expecting demand to improve as the EU rolls out vaccines and begins to make progress in arresting the pandemic and removing lockdowns. Global fiscal and monetary policy, which likely will be bolstered by a massive round of US infrastructure spending beginning in 4Q21 will catalyze demand growth for oil and base metals. This will prompt another round of GDP revisions to the upside. The dollar remains a headwind for now, but we expect it to return to a bear market in 2H21. Chart 10The USD's Evolution Remains Important
The USD's Evolution Remains Important
The USD's Evolution Remains Important
Robert P. Ryan Chief Commodity & Energy Strategist rryan@bcaresearch.com Ashwin Shyam Research Associate Commodity & Energy Strategy ashwin.shyam@bcaresearch.com Commodities Round-Up Energy: Bullish Going into the April 1 meeting of OPEC 2.0 today, we are not expecting any increase in production. OPEC earlier this week noted demand had softened, mostly due to the slow recovery from the COVID-19 pandemic in the EU, which, based on their previous policy decisions, suggests the producer coalition will not be increasing production. The coalition led by KSA and Russia will have to address Iran's return as a major exporter to China this year, which appears to have been importing ~ 1mm b/d of Iranian crude this month (Chart 11). This puts Iran in direct competition with KSA as a major exporter to China, in defiance of the US re-imposition of sanctions against Iranian exports. China and Iran over the weekend signed a 25-year trade pact that also could include military provisions, which could, over time, alter the balance of power in the Persian Gulf if Chinese military assets – naval and land warfare – deploy to Iran under their agreement. Details of the deal are sparse, as The Guardian noted in its recent coverage. Among other things, government officials in Tehran have come under withering criticism for entering the deal, which they contend was signed with a "politically bankrupt regime." The Guardian also noted US President Joe Biden " is prepared to make a new offer to Iran this week whereby he will lift some sanctions in return for Iran taking specific limited steps to come back into compliance with the nuclear agreement, including reducing the level to which it enriches uranium," in the wake of the signing of this deal. Base Metals: Bullish Copper fell this week, initially on an inventory build, and has now settled right under the $4/lb mark, as investors await details on the US infrastructure bill unveiled in Pittsburgh, PA, on Wednesday. According to mining.com, a major chunk of the proposed bill will be devoted to investments in infrastructure, which will be metals-intensive. Precious Metals: Bullish Gold fell further this week, as US treasury yields rose, buoyed by the increased US vaccine efforts and President Biden’s proposed spending plans (Chart 12). USD strength also worked against the yellow metal, which has been steadily declining since the beginning of this year. COMEX gold fell below the $1,700/oz mark for the third time this month and settled at $1,683.90/oz on Tuesday. Chart 11
Sporadic Producers Will Be Accomodated
Sporadic Producers Will Be Accomodated
Chart 12
Gold Trading Lower On The Back of A Strong Dollar
Gold Trading Lower On The Back of A Strong Dollar
Footnotes 1 Please see Five-Year Brent Forecast Update: Expect Price Range of $60 - $80/bbl, which we published 25 March 2021. It is available at ces.bcaresearch.com. 2 Please see Industrial Commodities Super-Cycle Or Bull Market?, which we published 4 March 2021 for additional discussion, particularly regarding the need for additional capex in energy and metals markets. 3 Please see UPDATE 1-Strong industrial activity, profit lift China steel futures, published by reuters.com 29 March 2021. 4 See, e.g., Column: Frothy oil market deflates as virus fears return published 23 March 2021. 5 Brunetti, Celso, Bahattin Büyüksahin, and Jeffrey H. Harris (2016), " Speculators, Prices, and Market Volatility," Journal of Financial and Quantitative Analysis, 51:5, pp. 1545-74, for further discussion. 6 Please see Specs Back Up The Truck For Oil, which we published 26 April 2018, and Feedback Loop: Spec Positioning & Oil Price Volatility published 10 May 2018. Both are available at ces.bcaresearch.com. 7 We group money managers (registered commodity trading advisors, commodity pool operators and unregistered funds) and swap dealers (banks and trading companies providing liquidity to hedgers and speculators) together to test these relationships. 8 In our earlier research, we also noted our results generally were supported in the academic literature. See, e.g., Fattouh, Bassam, Lutz Kilian and Lavan Mahadeva (2012), "The Role of Speculation in Oil Markets: What Have We Learned So Far?" published by The Oxford Institute For Energy Studies. Investment Views and Themes Strategic Recommendations Commodity Prices and Plays Reference Table Summary of Closed Trades
Higher Inflation On The Way
Higher Inflation On The Way