Euro Area

In the decade following the global financial crisis, investor concerns that the Fed’s monetary policies have artificially boosted equity market valuation have been mostly overblown. But today, it is now true that US equities are increasingly dependent on persistently low bond yields, as stocks can only avoid near bubble-like relative pricing if yields remain below trend rates of economic growth. Macroeconomic theory and the historical record both support the notion that nominal interest rates are normally in equilibrium when they are roughly equal to the trend rate of nominal income growth. A gap between interest rates and trend rates of growth was indeed justified for a few years following the global financial crisis, but in the few years prior to the pandemic, it is altogether possible that the neutral rate of interest (or “r-star”) was in fact meaningfully higher than academic estimates suggested. In a scenario where the US output gap closes quickly, inflation rises above target, and where permanent damage to the labor market from the pandemic is relatively limited, we expect the narrative of secular stagnation to be challenged and for investor expectations for the neutral rate to move closer to trend rates of economic growth. That would imply that the 5-year/5-year forward Treasury yield could hypothetically rise above 3%, and possibly as high as 4% or more. Such a shift would push the US equity risk premium back to 2002 levels based on current stock market pricing. This is not necessarily negative for equities, but it is also not clear what equity risk premium investors will require to contend with the myriad risks to the economic outlook that did not exist in the early 2000s. A low ERP that is technically not as low as that of the tech bubble era could thus still threaten stock prices, as T.I.N.A., “There Is No Alternative,” may not prevail. Many investors have questioned what asset allocation strategy should be pursued in a scenario where stock prices and bond yields are no longer positively correlated. While they are not likely to be without cost, options exist for investors to potentially earn positive absolute returns in a scenario where a significant shift in the interest rate outlook threatens both stock and bond prices. Chart II-1Equity Valuation Concerns Have Persisted For The Past Decade...
Equity Valuation Concerns Have Persisted For The Past Decade...
Equity Valuation Concerns Have Persisted For The Past Decade...
For the better part of the last decade, many investors have argued that the Fed’s monetary policies have artificially boosted equity market valuation. Based on the cyclically-adjusted P/E ratio metric originated by Robert Shiller, stocks reached pre-global financial crisis (GFC) multiples in late 2014 and early 2015 (Chart II-1). Based on metrics such as the price-to-sales ratio, stocks rose to pre-GFC valuation in late 2013, and are now even more richly valued than they were at the height of the dotcom bubble. These concerns have mostly occurred in response to absolute changes in stock multiples, but equity valuation cannot be divorced from the prevailing level of interest rates. Relative to bond yields, stocks were extraordinarily cheap for many years following the GFC. Measured by one simple approach to calculating the equity risk premium, the spread between the 12-month forward earnings yield (the inverse of the forward P/E ratio) and the real 10-year Treasury yield, stocks were the cheapest following the GFC that they had been since the mid 1980s, and remain reasonably priced today (Chart II-2). Chart II-2...But Stocks Have Actually Been Cheap Versus Bonds
...But Stocks Have Actually Been Cheap Versus Bonds
...But Stocks Have Actually Been Cheap Versus Bonds
The fact that stocks have appeared to be expensive for several years but quite cheap (or reasonably priced) relative to bonds underscores the fact that longer-term bond yields have been extraordinarily low following the global financial crisis. Still, equities were not dependent on low bond yields prior to the pandemic, as illustrated in Chart II-3. The chart highlights the range of 10-year Treasury yields that would be consistent with the pre-GFC equity risk premium range (measured from 2002-2007), alongside the actual 10-year yield and trend nominal GDP growth. The chart shows that for years following the financial crisis, bond yields could have risen to levels well above trend rates of economic growth and stocks would still have been priced in line with pre-crisis norms. This “normal pricing” range for the 10-year declined as the expansion continued, but remained consistent with trend growth rates and above the actual 10-year yield up until the beginning of the pandemic. Chart II-3 also highlights, however, that the circumstances changed last year. The equity risk premium briefly rose at the onset of the pandemic as stocks initially sold off sharply, but then quickly fell as stock prices recovered in response to aggressive fiscal and monetary easing. Today, it is true that US equities are increasingly dependent on persistently low bond yields, as stocks can only avoid bubble-like relative pricing if yields remain below trend rates of economic growth. Chart II-3Now, Stocks Are Increasingly Dependent On Low Bond Yields
Now, Stocks Are Increasingly Dependent On Low Bond Yields
Now, Stocks Are Increasingly Dependent On Low Bond Yields
Prior to the pandemic, most fixed-income investors would have viewed the risk of bond yields rising to trend nominal GDP growth, let alone above it, as minimal. Global investors have come to accept the secular stagnation narrative as described by Larry Summers in November 2013, and have gravitated to academic estimates of the neutral rate of interest (“R-star”) that show a substantial gap between the natural rate and trend real growth (Chart II-4). This view has manifested itself in a decline in surveyed estimates of the long-run Fed funds rate, but at present the 5-year/5-year forward Treasury yield has pushed well above this survey-derived fair value range (Chart II-5). It is possible that the fiscal response to the pandemic will cause investor views about r-star to evolve even further over the coming 12-24 months, and in this report we explore the potential headwind that such an evolution could present to stock prices at some point – potentially as early as next year. Chart II-4Investors Have Accepted Secular Stagnation, And The View That R-star Is Well Below Trend Rates Of Growth
Investors Have Accepted Secular Stagnation, And The View That R-star Is Well Below Trend Rates Of Growth
Investors Have Accepted Secular Stagnation, And The View That R-star Is Well Below Trend Rates Of Growth
Chart II-5The Market's Views About R-star May Be Shifting
The Market's Views About R-star May Be Shifting
The Market's Views About R-star May Be Shifting
R-star: A Brief Primer Macroeconomic theory and the historical record both support the notion that nominal interest rates are normally in equilibrium when they are roughly equal to the trend rate of nominal income growth. From the perspective of macro theory, the neutral rate of interest is determined by the supply of and demand for savings. But in practical terms, this implies that the neutral rate should normally be closely linked to the trend rate of economic growth. For example, if interest rates – and thus the cost of capital – were persistently below aggregate income growth, then demand for capital (and thus credit and likely labor demand) should increase as firms seek to profit from the gap between the interest rate and the expected rate of return from real investment. As such, the trend rate of growth acts as a good proxy for the interest rate that will balance the supply and demand for credit during normal economic circumstances. Empirically, academic estimates of r-star closely followed estimates of trend real GDP growth prior to the global financial crisis, as shown in Chart II-4 above. In addition, we noted in our January report that the stance of monetary policy, as defined by the difference between nominal GDP growth and the 10-year Treasury yield, has generally done a good job of explaining the US output gap prior to 2000. This supports the notion that monetary policy is stimulative (restrictive) when bond yields are below (above) trend growth rates. However, in the years following the GFC, investors’ estimates of r-star collapsed, as evidenced by the sharp decline in 5-year / 5-year forward Treasury yields (Chart II-6). This was followed by a decline in primary dealer and FOMC expectations for the long-term Fed funds rate, which investors took as validating their view that the neutral rate of interest has permanently declined. Chart II-6Investors Led The Fed And Others In Expecting A Lower Nominal Neutral Rate
Investors Led The Fed And Others In Expecting A Lower Nominal Neutral Rate
Investors Led The Fed And Others In Expecting A Lower Nominal Neutral Rate
R-star And Trend Growth: Is A Gap Between The Two Really Justified? Chart II-7R-star Likely Did Decline Following The GFC (For A Time)
R-star Likely Did Decline Following The GFC (For A Time)
R-star Likely Did Decline Following The GFC (For A Time)
It seems clear that r-star did indeed decline for a time after the GFC. The US and select European economies suffered a balance sheet recession in 2008/2009 that impacted credit demand for an extended period of time (Chart II-7), and extraordinarily low interest rates for several years did not fuel major credit excesses (at least in the household sector). But as we detailed in a Special Report last year,1 we doubt that the decline in r-star was permanent, for several reasons. The first, and most important, is that there have been at least four deeply impactful non-monetary shocks to both the US and global economies since 2008 that magnified the impact of prolonged household deleveraging and help explain the disconnect between growth and interest rates during the last economic cycle: The euro area sovereign debt crisis Premature fiscal austerity in the US, the UK, and euro area from 2010 – 2012/2014 The US dollar / oil price shock of 2014 The Trump administration’s aggressive use of tariffs beginning in 2018, impacting China but also other developed market economies. Chart II-8Recent Trends In US Private Sector Leverage Do Not Suggest R-star Is Very Low
Recent Trends In US Private Sector Leverage Do Not Suggest R-star Is Very Low
Recent Trends In US Private Sector Leverage Do Not Suggest R-star Is Very Low
Except for the oil price shock of 2014 (which was driven by technological developments and a price war among producers), all of these non-monetary shocks were caused or exacerbated by policymakers – often for political reasons or due to regulatory failures. Second, the trend in US private sector credit growth last cycle does not suggest that r-star fell permanently. Chart II-8 underscores two points: the first is that while US household sector credit contracted for several years following the global financial crisis, it started growing again in 2013 and had largely closed the gap with income growth prior to the pandemic. The second point is that the nonfinancial corporate sector clearly leveraged itself over the course of the last expansion, arguing that interest rates have not in any way been restrictive for businesses. Third, we disagree with a common view in the marketplace that the 2018-2019 period supported the validity of low academic estimates of the neutral rate. Chart II-9 highlights that monetary policy ceased to be stimulative in 2019 according to the Laubach & Williams r-star estimate, which some investors have argued explains the late 2018 equity market selloff, the 2019 slowdown in the US housing market, the inversion of the yield curve, and the global manufacturing recession. Chart II-9Monetary Policy Ceased To Be Stimulative In 2019, According To The LW R-star Estimate
Monetary Policy Ceased To Be Stimulative In 2019, According To The LW R-star Estimate
Monetary Policy Ceased To Be Stimulative In 2019, According To The LW R-star Estimate
But this narrative ignores other important factors that contributed to the slowdown. For example, Chart II-10 highlights that this period of economic weakness exactly coincided with the most intense phase of the Sino-US trade war, as well as a significant slowdown in Chinese credit growth. The chart highlights that the selloff in the US equity market began almost immediately after a surge in the effective tariff rates levied by the two countries against each other, and after the Chinese credit impulse fell three percentage points (from 30% to 27% of GDP). Chart II-10The 2018 Stock Market Selloff Occurred Once Sino-US Tariffs Exploded
The 2018 Stock Market Selloff Occurred Once Sino-US Tariffs Exploded
The 2018 Stock Market Selloff Occurred Once Sino-US Tariffs Exploded
Chart II-11 highlights that interest rates did likely impact the housing market, but that it was the speed at which rates rose that was damaging rather than their level. The chart shows that the rise in mortgage rates from late 2016 to late 2018 was among the largest 2-year increases that has occurred since the early 1980s, so it is unsurprising that the growth in home sales and real residential investment slowed for a time. Additionally, Chart II-12 highlights that the rise in mortgage rates during this period did not cause a downtrend in mortgage credit growth, which only occurred in Q4 2018 in response to the impact of the sharp selloff in the equity market on household net worth. Chart II-11Mortgage Rates Rose Very Significantly From Late 2016 To Late 2018
Mortgage Rates Rose Very Significantly From Late 2016 To Late 2018
Mortgage Rates Rose Very Significantly From Late 2016 To Late 2018
Chart II-12A Record Rise In Mortgage Rates Did Not Crack The Housing Market
A Record Rise In Mortgage Rates Did Not Crack The Housing Market
A Record Rise In Mortgage Rates Did Not Crack The Housing Market
In short, the late 2018 / 2019 period saw a major global aggregate demand shock occur following an already-established slowdown in Chinese credit growth and a rapid rise in interest rates in the DM world. It is these factors that were likely responsible for the 2019 slowdown in economic growth, not the fact that interest rates reached levels that restricted economic activity on their own. R-star In A Post-Pandemic World Charts II-7 – II-12 above suggest that a gap between interest rates and trend rates of growth was indeed justified for a few years following the global financial crisis, but that a decline in r-star only appeared to be permanent due to persistent, non-monetary policy shocks to aggregate demand. In the few years prior to the pandemic, it is altogether possible that r-star was in fact meaningfully higher than academic estimates suggested. But that is now a counterfactual assertion, as the pandemic has transformed the outlook for interest rates and bond yields in conflicting ways. A 10% decline in the level of real output was the most intensely negative non-monetary shock to aggregate demand since the 1930s (Chart II-13), and we agree that another depression would have occurred without extraordinary government assistance. The economic damage caused by the pandemic certainly does not work in favor of a higher neutral rate, and we highlighted in Section 1 of our report that the Fed expects there to be some lingering and persistent slack in the labor market even once the pandemic is over. Chart II-13Without Major Monetary And Fiscal Policy Support, The Pandemic Would Probably Have Caused A Depression
Without Major Monetary And Fiscal Policy Support, The Pandemic Would Probably Have Caused A Depression
Without Major Monetary And Fiscal Policy Support, The Pandemic Would Probably Have Caused A Depression
Chart II-14A Huge Increase In Government Transfers And Spending Is Underway
April 2021
April 2021
On the other hand, Larry Summers, the chief proponent of the theory of secular stagnation, has argued for several years that increased fiscal spending was warranted in order to address an imbalance between private sector savings and investment. Summers himself now characterizes US fiscal policy as the “least responsible” that he has seen over the past 40 years, because of too-large government spending that risks overheating the economy (Chart II-14). Summers’ critique rests in large part on the fact that new government spending has not occurred in the form of investment (to balance out the existence of excess savings), but is instead providing transfers to households that in many cases have already accumulated significant excess savings. But the key point for investors is that the pandemic has completely shifted the narrative about fiscal spending, from “arguably insufficient for several years following the global financial crisis” to now “risking a dramatic overheating of the economy.” Some elements of Summers’ criticism of the Biden administration’s fiscal policy are justified, particularly the policy of large direct transfer payments to workers who have suffered no loss in employment or income as a result of the pandemic. Despite this, as detailed in Section 1 of our report, we are more sanguine about the risks of aggressive overheating for three reasons: it does seem likely that some portion of the spending on services that has been “missing” over the past year will never return or will be slow to return, some of the excess savings that have accumulated will not be immediately (or ever) spent, and the rise in consumer inflation expectations that has occurred over the past year has happened from an extremely low starting point and has yet to even rise above its post-GFC range. The low odds that we assign to dangerously above-target inflation over the coming 12-24 months does not, however, mean that investors’ expectations for r-star will stay low. For right or for wrong, the US government has aggressively dis-saved over the past year, in an environment where low expectations for the neutral rate were anchored by a view of excessive private sector savings and insufficient demand from governments. In a scenario where the US output gap closes quickly, inflation rises modestly above target, and where permanent damage to the labor market from the pandemic is relatively limited, it seems reasonable to conclude that the narrative of secular stagnation will be challenged and that investor expectations for the neutral rate will converge towards trend rates of economic growth. That would imply that the 5-year/5-year forward Treasury yield could hypothetically rise above 3%, possibly as high as 4% or more. This is not our base case view, but it will be an important possibility to monitor as the decisive end to social distancing and other pandemic control measures draws nearer. Investment Conclusions A rise in the 5-year/5-year forward Treasury yield does not, in and of itself, suggest that 10-year Treasury yields will rise to levels that would threaten a significant decline in stock prices. The Fed does not control the long-end of the Treasury curve, but it does exert a very strong influence on the short-end. For example, were the Fed to follow the median current projection of FOMC participants and refrain from raising interest rates until sometime after 2023, it would limit how high current 10-year Treasury yields could rise. But it is not difficult to envision plausible scenarios where the 10-year Treasury yield rises above the range consistent with the pre-GFC US equity risk premium. Chart II-15 presents three hypothetical fair value paths for the 10-year yield assuming a mid-2022 liftoff date and a 4% terminal Fed funds rate for the following three scenarios: Chart II-1510-Year Yields Could Rise Meaningfully Further If Investors Shift Their Expectations For R-star
10-Year Yields Could Rise Meaningfully Further If Investors Shift Their Expectations For R-star
10-Year Yields Could Rise Meaningfully Further If Investors Shift Their Expectations For R-star
The Fed raises rates at a pace of 1% (4 hikes) per year, with a term premium of 10 basis points The Fed raises rates at a pace of 1% (4 hikes) per year, with a term premium of 50 basis points The Fed raises rates at a pace of 1.5% (6 hikes) per year, with a term premium of 50 basis points In the first scenario, based on the current US 12-month forward P/E ratio, the fair value of the 10-year Treasury yield would rise above the range consistent with a reasonable ERP in the middle of 2022, the liftoff point assumed in all three scenarios. In the second and third scenarios, the US equity ERP would already be quite low. When using the late 1999 / early 2000 bubble period as a reference point, even the scenarios shown in Chart II-15 are not very threatening to stock prices. Given current equity market pricing, the third scenario would take the US equity risk premium back to mid 2002 levels, which were still meaningfully higher than during the peak of the bubble. And that is assuming an earlier liftoff than the market currently expects, a faster pace of rate hikes than experienced during the last economic cycle, and a very meaningful increase in the market’s expectations for the neutral rate. But it is not clear what equity risk premium investors will require to contend with the myriad risks to the economic outlook that did not exist in the early 2000s. For example, equity investors are today faced with a riskier policy environment than existed 20 years ago in the US and in other developed economies that is at least partially driven by populist sentiment, potentially impacting earnings via lower operating margins or higher taxes. These or other risks existed at several points over the past decade and T.I.N.A. (“There Is No Alternative”) prevailed, but that occurred precisely because the equity risk premium was very elevated. A low ERP that is technically not as low as what prevailed during the tech bubble era could thus still threaten stock prices, raising the specter of negative absolute returns from stocks and nominal government bonds for a period of time, beginning potentially at or in the lead-up to the first Fed rate hike. Chart II-16There Are Alternatives To A Traditional 60/40 Portfolio In A Rising Rate Environment
There Are Alternatives To A Traditional 60/40 Portfolio In A Rising Rate Environment
There Are Alternatives To A Traditional 60/40 Portfolio In A Rising Rate Environment
Many investors have questioned what asset allocation strategy should be pursued in a scenario where stock prices and bond yields are no longer positively correlated. Chart II-16 provides some perspective on the question, by comparing the total return of a 60/40 stock/bond portfolio to a strategy involving the opportunistic redeployment of cash into stocks. The strategy rule maintains a 50/50 stock/cash allocation during normal market conditions, but it then shifts the entire cash allocation into equities following a 15% selloff in the stock market. The portfolio is shifted back to a 50/50 allocation once stocks rise to a new rolling 1-year high. The chart highlights that 60/40 balanced portfolio-style returns may be achievable with cash as the diversifier without a significant reduction in the Sharpe ratio. In fact, the strategy has the effect of lowering average volatility due to prolonged periods of comparatively lower equity exposure, although this occurs at the cost of higher volatility during periods of high market stress (precisely when investors most want protection from volatility). But the bottom line for investors is that while they are not likely to be without cost, options exist for investors to potentially earn positive absolute returns in a scenario where a significant shift in the interest rate outlook threatens both stock and bond prices. As noted above, this remains a risk to our view rather than our expectation, but we will continue to monitor the potential threat posed to stock prices as the pandemic draws to a decisive close later this year. Jonathan LaBerge, CFA Vice President The Bank Credit Analyst Footnotes 1 2020-03-20 GIS SR “Revisiting The Neutral Rate Of Interest: A Contrarian View In A Time Of Crisis.”
Highlights Extremely accommodative fiscal policy and a rapid pace of vaccination puts the US on track to close its output gap by the end of the year. The situation is different in Europe, and the euro area economy will likely continue to underperform the US until at least the summer. Investors are now unusually more hawkish than the Fed, whose caution is driven by the expectation of some lingering and persistent slack in the labor market even once the pandemic is over. The Fed’s rate projections, coupled with the extraordinary size of the American Rescue Plan, have stoked investor concerns about a significant rise in inflation. For inflation to rise dangerously above the Fed’s target, the US would likely need to see a persistently strong and positive output gap, and/or a major upward shift in expectations among consumers and firms. We expect a meaningful recovery in inflation this year, perhaps to above-target levels even without factoring in transitory supply-chain effects, but probably not to levels that investors deem to be “out of control.” Over the coming 6 to 12 months, a comparatively sanguine perspective on inflation supports a bullish view on stocks and an overweight stance towards equities within a multi-asset portfolio. We recommend that investors maintain below-benchmark portfolio duration, and overweight US speculative over investment-grade corporate bonds. The fact that Europe may lag growth-wise for a few months could continue to impact regional equity performance as well as the trend in the dollar over the coming 0-3 months. But over a 6-12 month time horizon, we continue to favor global ex-US vs. US stocks, and expect the dollar to be lower than it is today. A Brighter Light At The End Of The Tunnel Chart I-1Even Better Than Some Optimists Would Have Predicted
Even Better Than Some Optimists Would Have Predicted
Even Better Than Some Optimists Would Have Predicted
Over the past 4-6 weeks, the US has continued to make incredible progress in vaccinating its population against COVID-19. Chart I-1 highlights that the pace of vaccination is now well within the range required for herd immunity to be in place by the end of the third quarter. If this pace continues at an average of 2.5 million doses per day, the US will have vaccinated 90% of its population by the end of September (if it is determined that the vaccine is safe to give to children). And these calculations assume the continuation of a two-dose regime, meaning that the eventual rollout of Johnson & Johnson's Janssen vaccine – which requires only one dose and has shown to be extremely effective at preventing severe illness and death – could shorten the time to herd immunity rates of vaccination among adults even further. The situation is clearly different in Europe. The vaccination progress in several European countries is woefully behind that of the US and the UK (Chart I-2), and per capita cases in the euro area have again risen significantly above that of the US (Chart I-3). This reality motivated last week’s news that the European Union is reportedly planning on banning exports of the AstraZeneca vaccine for a period of time, as European policymakers grow increasingly concerned about the potential economic consequences of lengthened or additional pandemic control measures over the coming few months. Chart I-2Europe Is Badly Lagging The Vaccine Race…
April 2021
April 2021
There was at least some positive economic news from Europe this month, as reflected by the flash manufacturing and services PMIs (Chart I-4). The euro area manufacturing PMI surpassed that of the US this month, reflecting that the prospects for goods-producing companies in Europe remain solidly linked to the strong global manufacturing cycle. Services, on the other hand, have been the weak spot in Europe, having remained below the boom/bust line since last summer (in contrast to the US). The March services PMI highlighted that this gap is now starting to narrow, although the euro area economy will likely continue to underperform the US until at least the summer. Chart I-3...And It Is Starting To Show
...And It Is Starting To Show
...And It Is Starting To Show
Chart I-4Some Closure Of The Services Gap, But Still A Ways To Go
Some Closure Of The Services Gap, But Still A Ways To Go
Some Closure Of The Services Gap, But Still A Ways To Go
The underperformance of the European services sector over the past nine months has been due in part to more severe pandemic control measures, but also a comparatively timid fiscal policy. The IMF’s October Fiscal Monitor highlighted that the US had provided roughly eight percentage points more of GDP in above-the-line fiscal measures versus the European Union as a whole, and that was before the US December 2020 relief bill and this month’s $1.9 trillion American Rescue Plan (ARP) act were passed. The CBO estimates that the ARP will result in about US$1 trillion in outlays in 2021, which is roughly 5% of nominal GDP. Consequently, Chart I-5 highlights that consensus expectations now suggest that the output gap will be marginally positive by the end of the year, with the Fed’s most recent forecast implying that real GDP will be more than 1% above the CBO’s estimate of potential output. Chart I-5The US Output Gap Will Likely Be Closed By The End Of This Year
The US Output Gap Will Likely Be Closed By The End Of This Year
The US Output Gap Will Likely Be Closed By The End Of This Year
The Fed Versus The Market Despite this, the Fed held pat during this month’s FOMC meeting and did not validate market expectations of rate hikes beginning in early 2023. Chart I-6 highlights the Fed funds rate path over the coming years as implied by the OIS curve, alongside the Fed’s median projection of the Fed funds rate. This means that investors are now more hawkish than the Fed, which is the opposite of what has typically prevailed since the global financial crisis. Chart I-6The Market Is Now, Unusually, More Hawkish Than The Fed
The Market Is Now, Unusually, More Hawkish Than The Fed
The Market Is Now, Unusually, More Hawkish Than The Fed
Fed Chair Jerome Powell implied during the March 17 press conference that some FOMC participants were unwilling to change their projections for the path of interest rates based purely on a forecast, which argues that the median dot in the Fed’s “dot plot” will shift higher in the second half of the year if participants’ growth and inflation forecasts come to fruition. But Charts I-7A and I-7B suggest that the Fed’s caution is also driven by the expectation of some lingering and persistent slack in the labor market even once the pandemic is over. Chart I-7AA Positive Output Gap Implies…
April 2021
April 2021
Chart I-7B…An Unemployment Rate Below NAIRU
April 2021
April 2021
The charts highlight the historical relationship between the output gap and the deviation of NAIRU from the unemployment rate, from 2000 and 2010. In both cases, the charts show that the unemployment rate would be below the CBO’s estimate of NAIRU at the end of this year (roughly 4.5%) given the CBO’s estimate for potential (i.e. full employment) GDP and the Fed's forecast for growth. However, the Fed is forecasting that the unemployment rate will essentially be at NAIRU, which is itself above the Fed’s longer-run unemployment rate projection of 4%. As such, the Fed does not see the unemployment rate falling to “full employment” levels this year, a precondition for the onset of rate normalization. Investors should note that the relationships shown in Charts I-7A and I-7B suggest that the unemployment rate will be closer to 3-3.5% at the end of this year if the Fed’s growth forecast is correct, which would constitute full employment based on the Fed’s 4% unemployment rate target. The difference between a 3-3.5% unemployment rate and the Fed’s estimate of 4.5% translates to a gap of roughly 1.5-2.5 million jobs at the end of this year, which underscores that the Fed expects either a significant shift in temporary to permanent unemployment or an influx of unemployed workers back into the labor force who don’t quickly find jobs once social distancing ends and pandemic restrictions are no longer required. Chart I-8The Full Employment Level Of GDP Has Not Been Significantly Revised
The Full Employment Level Of GDP Has Not Been Significantly Revised
The Full Employment Level Of GDP Has Not Been Significantly Revised
There are three possible circumstances that would resolve this seeming contradiction. The first is that the Fed’s estimate for growth this year is simply too high, and that the output gap will be close to zero at the end of the year (i.e., more in line with consensus market expectations). The second is that the CBO is understating the level of GDP that is consistent with full employment, namely that potential GDP is higher than what they currently project. But Chart I-8 shows that the CBO’s current estimate for potential output at the end of this year is only 0.4% below what it had estimated prior to the pandemic, which is smaller than the positive gap implied by the Fed’s growth estimate for this year (roughly 1.2%). The third possibility is that the Fed is overestimating the extent to which the pandemic will cause permanent damage to the labor market. As we noted in our February report, even once social distancing is no longer required, it does seem likely that some portion of the spending on services that has been “missing” over the past year will never return. While it seems reasonable to expect that the gap in spending on hospitality and travel will close quickly once the health situation allows, it also seems reasonable to expect that some service areas, particularly retail, will experience a permanent loss in demand owing to durable shifts in consumer behavior that occurred during the pandemic (greater familiarity and use of online shopping, a permanent reduction of some magnitude in commuting, etc). A gap of 1.5-2.5 million jobs accounts for roughly 10-15% of pre-pandemic employment in retail trade, or 4-7% of the sum of retail trade, leisure & hospitality, and other services. It is possible that permanent job losses or significantly deferred job recovery of this size will occur, but it is far from clear that it will. Were job losses / deferred jobs recovery of this magnitude to not materialize, it would suggest that the US will reach full employment earlier than the Fed is currently projecting, and would significantly increase the odds that the Fed will begin to taper its asset purchases and/or raise interest rates at some point next year – which is earlier than investors currently expect. For Now, Dangerously Above-Target Inflation Is Unlikely Fed projections of a 0% Fed funds rate for the next 2 1/2 years, coupled with the extraordinary size of the American Rescue Plan, have understandably stoked investor concerns about a significant rise in inflation. Larry Summers’ recent interview with Bloomberg was emblematic of the concern, during which he criticized the Biden administration’s fiscal policy as the “least responsible” that the US has experienced in four decades and warned of the potential inflationary consequences of overheating the economy.1 It is true that the Federal Reserve is explicitly aiming to generate a temporary overshoot of inflation relative to its target, the Biden administration’s fiscal plan is legitimately large, and there is a tremendous pool of excess savings that could be deployed later this year once the pandemic is essentially over. Clearly, the risks of overheating must be higher than they have been in the past. But from our perspective, out-of-control inflation over the coming 12-24 months would very likely necessitate one of two things to occur, and possibly both: US consumers decide to spend an overwhelmingly large amount of the excess savings that have been accumulated. Main street expectations for consumer prices rise sharply, prompted by a public discussion about the likelihood of a shifting inflation regime. Our view is rooted in the examination of the modern-day Phillips Curve that we presented in our January report, which considers both the impact of economic/labor market slack and inflation expectations as a driver of actual inflation. The modern-day Phillips Curve posits that expectations act as the trend for inflation, and slack in the economy determines whether actual inflation is above or below that baseline. Chart I-9 highlights that the output gap worked well prior to the global financial crisis at explaining the difference between actual and exponentially-smoothed inflation, the latter acting as a long-history proxy for expectations. Pre-GFC, the chart highlights that there have been only two exceptions to the relationship that concerned the magnitude rather than the direction of inflation. Post-GFC, the relationship deviated substantially, but in a way that implied that actual inflation was too strong during the last expansion, not too weak – particularly during the early phase of the economic recovery. This likely occurred because expectations initially stayed very well anchored due to the Fed’s strong record of maintaining low and stable inflation, but ultimately declined due to a persistently negative output gap as well as in response to the 2014 collapse in oil prices (Chart I-10). Chart I-9Pre-GFC, The Output Gap Generally Explained Inflation Surprises
Pre-GFC, The Output Gap Generally Explained Inflation Surprises
Pre-GFC, The Output Gap Generally Explained Inflation Surprises
Chart I-10Inflation Expectations Eventually Succumbed Post-GFC To Collapsing Energy Prices
Inflation Expectations Eventually Succumbed Post-GFC To Collapsing Energy Prices
Inflation Expectations Eventually Succumbed Post-GFC To Collapsing Energy Prices
Thus, for inflation to rise dangerously above the Fed’s target, the US would likely need to see a persistently strong and positive output gap, and/or a major upward shift in expectations among consumers and firms. Chart I-11 highlights that the amount of excess savings that have accumulated as a percentage of GDP does indeed significantly exceed the magnitude of the output gap, but some of those savings have been and will be invested in financial markets (boosting valuation), some will be used to pay down debt, some will eventually be spent on international travel (boosting services imports), and some will likely be permanently held as deposits in anticipation of future tax increases. And while long-term household expectations for prices have risen since the passing of the CARES act last year, the rise has merely unwound the decline that took place following the 2014 oil price collapse (Chart I-12). Chart I-11A Huge Pool Of Savings Exists, But Not All Of It Will Be Spent
A Huge Pool Of Savings Exists, But Not All Of It Will Be Spent
A Huge Pool Of Savings Exists, But Not All Of It Will Be Spent
Chart I-12Long-Term Consumer Inflation Expectations Have Risen From A Very Low Base
Long-Term Consumer Inflation Expectations Have Risen From A Very Low Base
Long-Term Consumer Inflation Expectations Have Risen From A Very Low Base
For now, this framework points to a meaningful recovery in inflation this year, perhaps to above-target levels even without factoring in transitory supply-chain effects, but probably not to levels that investors deem to be “out of control.” Investment Conclusions Over the coming 6 to 12 months, a comparatively sanguine perspective on inflation supports a bullish view on stocks and an overweight stance towards equities within a multi-asset portfolio. While the Fed is likely to shift in a hawkish direction compared with its current projections, it is highly unlikely to become meaningfully more hawkish than current market expectations unless economic growth and the recovery in the labor market is much stronger than the Fed or the market is projecting. In fact, even if the market’s expectations for the first Fed rate hike shift to mid-2022 over the coming several months, Chart I-13 highlights that the impact on the equity market is likely to be minimal unless investors shift up their expectations for the terminal Fed funds rate. The chart presents a fair value estimate for the 10-year Treasury yield based on the OIS-implied path of the Fed funds rate out to December 2024, and assumes that short rates ultimately rise to the Fed’s long-term Fed funds rate projection of 2.5%. The second fair value series assumes that the shape of the OIS curve stays the same, but shifts closer by 6 months. Chart I-13The Market’s Assumed Rate Hike Path And Terminal Rate Are Not Threatening For Stocks
April 2021
April 2021
The chart underscores that the 10-year yield will rise to at most between 2-2.2% by the end of the year based on these scenarios. A shift forward in the timing of Fed rate hikes will impact the short end of the curve, but the long end will remain relatively unchanged if terminal rate expectations stay constant and the term premium on long-term bonds remains near zero. These levels would in no way be economically damaging nor threatening to stock market valuation. It is possible, however, that investor expectations for the neutral rate of interest (“r-star”) will shift higher once the pandemic is over, and we explore this risk to stocks in Section 2 of our report. For now, this remains a risk to our view rather than our expectation, but it is likely to remain an important possibility to monitor as the decisive end to social distancing and other pandemic control measures draws nearer. Within fixed income, we recommend that investors maintain below-benchmark portfolio duration even though investors are already pricing in a more hawkish path for the Fed funds rate. First, Chart I-13 highlighted that yields at the long end of the curve are likely to continue to move modestly higher this year even if the projected path for the Fed funds rate remains relatively unchanged. But more importantly, barring a substantially negative development on the health or vaccine front that prolongs the pandemic, the risk appears to be clearly to the upside in terms of the timing of the first Fed rate hike and the terminal Fed funds rate. As such, from a risk-reward perspective, a long duration stance remains unattractive. We would also recommend overweighting US speculative over investment-grade corporate bonds, as spreads are not as historically depressed for the former than the latter (Chart I-14). Finally, in terms of the dimensions of equity market performance and the dollar, we recommend that investors overweight global ex-US equities vs. the US, overweight value vs. growth, overweight cyclicals vs. defensives, and overweight small vs. large caps. We are also bearish on the dollar on a 12-month time horizon. However, there are two caveats that investors should bear in mind. First, global cyclicals versus defensives (especially in equally-weighted terms) as well as small versus large caps have already mostly normalized not just the impact of the pandemic but as well that of the 2018-2019 Trump trade war (Chart I-15). We would expect, at best, modest further gains from both positions this year. Chart I-14Speculative-Grade Corporate Bonds Are Less Expensive Than Investment-Grade
Speculative-Grade Corporate Bonds Are Less Expensive Than Investment-Grade
Speculative-Grade Corporate Bonds Are Less Expensive Than Investment-Grade
Chart I-15Going Forward, Expect More Modest Gains From Cyclicals And Small Caps
Going Forward, Expect More Modest Gains From Cyclicals And Small Caps
Going Forward, Expect More Modest Gains From Cyclicals And Small Caps
Second, the fact that Europe may lag growth-wise for a few months could continue to impact regional equity performance as well as the trend in the dollar on a 0-3 month time horizon. The US dollar is typically a counter-cyclical currency, but there have been exceptions to that rule. And historically, exceptions have tended to revolve around periods when US growth has been quite strong, as is currently the case (Chart I-16). A continued counter-trend rally in the dollar is thus possible over the course of the next few months, but we would expect USD-EUR to be lower than current levels 12 months from now. Chart I-16A Short-Term Counter-Trend Dollar Move Is Possible
A Short-Term Counter-Trend Dollar Move Is Possible
A Short-Term Counter-Trend Dollar Move Is Possible
A counter-trend dollar move could also correspond with a period of US outperformance versus global ex-US, or at a minimum, a period of flat performance when global ex-US stocks would normally outperform. Our China strategists expect that the Chinese credit impulse will decelerate later this year (Chart I-17), which would weigh on EM stocks and heighten the importance of European equities in driving global ex-US outperformance. European equity outperformance, in turn, will likely necessitate the outperformance of euro area financials. Chart I-18 highlights that euro area equity underperformance versus the US last year was mostly a tech story, but today there is little difference between the relative performance of euro area stocks overall versus indexes that exclude the broadly-defined technology sector. In both cases, the euro area index is roughly 10% below its US counterpart relative to pre-pandemic levels, which exactly matches the extent to which euro area financials have underperformed. Chart I-17A Slowing Chinese Credit Impulse Means EM Equities Will Struggle To Outperform
A Slowing Chinese Credit Impulse Means EM Equities Will Struggle To Outperform
A Slowing Chinese Credit Impulse Means EM Equities Will Struggle To Outperform
Chart I-18Euro Area Financials Need To Outperform For Europe To Outperform
Euro Area Financials Need To Outperform For Europe To Outperform
Euro Area Financials Need To Outperform For Europe To Outperform
Euro area financials have demonstrated very poor fundamental performance over the past decade, but they are likely to outperform for some period once the European vaccination campaign gains enough traction to alter the disease’s transmission and hospitalization dynamics. Chart I-19 highlights that euro area bank 12-month forward earnings have further room to recover to pre-pandemic levels than for banks in the US, and Chart I-20 highlights that euro area banks trade at their deepest price-to-book discount versus their US peers since the euro area financial crisis. Chart I-19Euro Area Bank Earnings Have Catch-Up Potential
Euro Area Bank Earnings Have Catch-Up Potential
Euro Area Bank Earnings Have Catch-Up Potential
Chart I-20Euro Area Banks Are Extremely Cheap Versus The US
Euro Area Banks Are Extremely Cheap Versus The US
Euro Area Banks Are Extremely Cheap Versus The US
Thus, while euro area and global ex-US equities may not outperform on the back of rising global stock prices over the coming few months, investors focused on a 6-12 month time horizon should respond by increasing their allocation to European stocks and to further reduce dollar exposure. Jonathan LaBerge, CFA Vice President The Bank Credit Analyst March 31, 2021 Next Report: April 29, 2021 II. R-star, And The Structural Risk To Stocks In the decade following the global financial crisis, investor concerns that the Fed’s monetary policies have artificially boosted equity market valuation have been mostly overblown. But today, it is now true that US equities are increasingly dependent on persistently low bond yields, as stocks can only avoid near bubble-like relative pricing if yields remain below trend rates of economic growth. Macroeconomic theory and the historical record both support the notion that nominal interest rates are normally in equilibrium when they are roughly equal to the trend rate of nominal income growth. A gap between interest rates and trend rates of growth was indeed justified for a few years following the global financial crisis, but in the few years prior to the pandemic, it is altogether possible that the neutral rate of interest (or “r-star”) was in fact meaningfully higher than academic estimates suggested. In a scenario where the US output gap closes quickly, inflation rises above target, and where permanent damage to the labor market from the pandemic is relatively limited, we expect the narrative of secular stagnation to be challenged and for investor expectations for the neutral rate to move closer to trend rates of economic growth. That would imply that the 5-year/5-year forward Treasury yield could hypothetically rise above 3%, and possibly as high as 4% or more. Such a shift would push the US equity risk premium back to 2002 levels based on current stock market pricing. This is not necessarily negative for equities, but it is also not clear what equity risk premium investors will require to contend with the myriad risks to the economic outlook that did not exist in the early 2000s. A low ERP that is technically not as low as that of the tech bubble era could thus still threaten stock prices, as T.I.N.A., “There Is No Alternative,” may not prevail. Many investors have questioned what asset allocation strategy should be pursued in a scenario where stock prices and bond yields are no longer positively correlated. While they are not likely to be without cost, options exist for investors to potentially earn positive absolute returns in a scenario where a significant shift in the interest rate outlook threatens both stock and bond prices. Chart II-1Equity Valuation Concerns Have Persisted For The Past Decade...
Equity Valuation Concerns Have Persisted For The Past Decade...
Equity Valuation Concerns Have Persisted For The Past Decade...
For the better part of the last decade, many investors have argued that the Fed’s monetary policies have artificially boosted equity market valuation. Based on the cyclically-adjusted P/E ratio metric originated by Robert Shiller, stocks reached pre-global financial crisis (GFC) multiples in late 2014 and early 2015 (Chart II-1). Based on metrics such as the price-to-sales ratio, stocks rose to pre-GFC valuation in late 2013, and are now even more richly valued than they were at the height of the dotcom bubble. These concerns have mostly occurred in response to absolute changes in stock multiples, but equity valuation cannot be divorced from the prevailing level of interest rates. Relative to bond yields, stocks were extraordinarily cheap for many years following the GFC. Measured by one simple approach to calculating the equity risk premium, the spread between the 12-month forward earnings yield (the inverse of the forward P/E ratio) and the real 10-year Treasury yield, stocks were the cheapest following the GFC that they had been since the mid 1980s, and remain reasonably priced today (Chart II-2). Chart II-2...But Stocks Have Actually Been Cheap Versus Bonds
...But Stocks Have Actually Been Cheap Versus Bonds
...But Stocks Have Actually Been Cheap Versus Bonds
The fact that stocks have appeared to be expensive for several years but quite cheap (or reasonably priced) relative to bonds underscores the fact that longer-term bond yields have been extraordinarily low following the global financial crisis. Still, equities were not dependent on low bond yields prior to the pandemic, as illustrated in Chart II-3. The chart highlights the range of 10-year Treasury yields that would be consistent with the pre-GFC equity risk premium range (measured from 2002-2007), alongside the actual 10-year yield and trend nominal GDP growth. The chart shows that for years following the financial crisis, bond yields could have risen to levels well above trend rates of economic growth and stocks would still have been priced in line with pre-crisis norms. This “normal pricing” range for the 10-year declined as the expansion continued, but remained consistent with trend growth rates and above the actual 10-year yield up until the beginning of the pandemic. Chart II-3 also highlights, however, that the circumstances changed last year. The equity risk premium briefly rose at the onset of the pandemic as stocks initially sold off sharply, but then quickly fell as stock prices recovered in response to aggressive fiscal and monetary easing. Today, it is true that US equities are increasingly dependent on persistently low bond yields, as stocks can only avoid bubble-like relative pricing if yields remain below trend rates of economic growth. Chart II-3Now, Stocks Are Increasingly Dependent On Low Bond Yields
Now, Stocks Are Increasingly Dependent On Low Bond Yields
Now, Stocks Are Increasingly Dependent On Low Bond Yields
Prior to the pandemic, most fixed-income investors would have viewed the risk of bond yields rising to trend nominal GDP growth, let alone above it, as minimal. Global investors have come to accept the secular stagnation narrative as described by Larry Summers in November 2013, and have gravitated to academic estimates of the neutral rate of interest (“R-star”) that show a substantial gap between the natural rate and trend real growth (Chart II-4). This view has manifested itself in a decline in surveyed estimates of the long-run Fed funds rate, but at present the 5-year/5-year forward Treasury yield has pushed well above this survey-derived fair value range (Chart II-5). It is possible that the fiscal response to the pandemic will cause investor views about r-star to evolve even further over the coming 12-24 months, and in this report we explore the potential headwind that such an evolution could present to stock prices at some point – potentially as early as next year. Chart II-4Investors Have Accepted Secular Stagnation, And The View That R-star Is Well Below Trend Rates Of Growth
Investors Have Accepted Secular Stagnation, And The View That R-star Is Well Below Trend Rates Of Growth
Investors Have Accepted Secular Stagnation, And The View That R-star Is Well Below Trend Rates Of Growth
Chart II-5The Market's Views About R-star May Be Shifting
The Market's Views About R-star May Be Shifting
The Market's Views About R-star May Be Shifting
R-star: A Brief Primer Macroeconomic theory and the historical record both support the notion that nominal interest rates are normally in equilibrium when they are roughly equal to the trend rate of nominal income growth. From the perspective of macro theory, the neutral rate of interest is determined by the supply of and demand for savings. But in practical terms, this implies that the neutral rate should normally be closely linked to the trend rate of economic growth. For example, if interest rates – and thus the cost of capital – were persistently below aggregate income growth, then demand for capital (and thus credit and likely labor demand) should increase as firms seek to profit from the gap between the interest rate and the expected rate of return from real investment. As such, the trend rate of growth acts as a good proxy for the interest rate that will balance the supply and demand for credit during normal economic circumstances. Empirically, academic estimates of r-star closely followed estimates of trend real GDP growth prior to the global financial crisis, as shown in Chart II-4 above. In addition, we noted in our January report that the stance of monetary policy, as defined by the difference between nominal GDP growth and the 10-year Treasury yield, has generally done a good job of explaining the US output gap prior to 2000. This supports the notion that monetary policy is stimulative (restrictive) when bond yields are below (above) trend growth rates. However, in the years following the GFC, investors’ estimates of r-star collapsed, as evidenced by the sharp decline in 5-year / 5-year forward Treasury yields (Chart II-6). This was followed by a decline in primary dealer and FOMC expectations for the long-term Fed funds rate, which investors took as validating their view that the neutral rate of interest has permanently declined. Chart II-6Investors Led The Fed And Others In Expecting A Lower Nominal Neutral Rate
Investors Led The Fed And Others In Expecting A Lower Nominal Neutral Rate
Investors Led The Fed And Others In Expecting A Lower Nominal Neutral Rate
R-star And Trend Growth: Is A Gap Between The Two Really Justified? Chart II-7R-star Likely Did Decline Following The GFC (For A Time)
R-star Likely Did Decline Following The GFC (For A Time)
R-star Likely Did Decline Following The GFC (For A Time)
It seems clear that r-star did indeed decline for a time after the GFC. The US and select European economies suffered a balance sheet recession in 2008/2009 that impacted credit demand for an extended period of time (Chart II-7), and extraordinarily low interest rates for several years did not fuel major credit excesses (at least in the household sector). But as we detailed in a Special Report last year,2 we doubt that the decline in r-star was permanent, for several reasons. The first, and most important, is that there have been at least four deeply impactful non-monetary shocks to both the US and global economies since 2008 that magnified the impact of prolonged household deleveraging and help explain the disconnect between growth and interest rates during the last economic cycle: The euro area sovereign debt crisis Premature fiscal austerity in the US, the UK, and euro area from 2010 – 2012/2014 The US dollar / oil price shock of 2014 The Trump administration’s aggressive use of tariffs beginning in 2018, impacting China but also other developed market economies. Chart II-8Recent Trends In US Private Sector Leverage Do Not Suggest R-star Is Very Low
Recent Trends In US Private Sector Leverage Do Not Suggest R-star Is Very Low
Recent Trends In US Private Sector Leverage Do Not Suggest R-star Is Very Low
Except for the oil price shock of 2014 (which was driven by technological developments and a price war among producers), all of these non-monetary shocks were caused or exacerbated by policymakers – often for political reasons or due to regulatory failures. Second, the trend in US private sector credit growth last cycle does not suggest that r-star fell permanently. Chart II-8 underscores two points: the first is that while US household sector credit contracted for several years following the global financial crisis, it started growing again in 2013 and had largely closed the gap with income growth prior to the pandemic. The second point is that the nonfinancial corporate sector clearly leveraged itself over the course of the last expansion, arguing that interest rates have not in any way been restrictive for businesses. Third, we disagree with a common view in the marketplace that the 2018-2019 period supported the validity of low academic estimates of the neutral rate. Chart II-9 highlights that monetary policy ceased to be stimulative in 2019 according to the Laubach & Williams r-star estimate, which some investors have argued explains the late 2018 equity market selloff, the 2019 slowdown in the US housing market, the inversion of the yield curve, and the global manufacturing recession. Chart II-9Monetary Policy Ceased To Be Stimulative In 2019, According To The LW R-star Estimate
Monetary Policy Ceased To Be Stimulative In 2019, According To The LW R-star Estimate
Monetary Policy Ceased To Be Stimulative In 2019, According To The LW R-star Estimate
But this narrative ignores other important factors that contributed to the slowdown. For example, Chart II-10 highlights that this period of economic weakness exactly coincided with the most intense phase of the Sino-US trade war, as well as a significant slowdown in Chinese credit growth. The chart highlights that the selloff in the US equity market began almost immediately after a surge in the effective tariff rates levied by the two countries against each other, and after the Chinese credit impulse fell three percentage points (from 30% to 27% of GDP). Chart II-10The 2018 Stock Market Selloff Occurred Once Sino-US Tariffs Exploded
The 2018 Stock Market Selloff Occurred Once Sino-US Tariffs Exploded
The 2018 Stock Market Selloff Occurred Once Sino-US Tariffs Exploded
Chart II-11 highlights that interest rates did likely impact the housing market, but that it was the speed at which rates rose that was damaging rather than their level. The chart shows that the rise in mortgage rates from late 2016 to late 2018 was among the largest 2-year increases that has occurred since the early 1980s, so it is unsurprising that the growth in home sales and real residential investment slowed for a time. Additionally, Chart II-12 highlights that the rise in mortgage rates during this period did not cause a downtrend in mortgage credit growth, which only occurred in Q4 2018 in response to the impact of the sharp selloff in the equity market on household net worth. Chart II-11Mortgage Rates Rose Very Significantly From Late 2016 To Late 2018
Mortgage Rates Rose Very Significantly From Late 2016 To Late 2018
Mortgage Rates Rose Very Significantly From Late 2016 To Late 2018
Chart II-12A Record Rise In Mortgage Rates Did Not Crack The Housing Market
A Record Rise In Mortgage Rates Did Not Crack The Housing Market
A Record Rise In Mortgage Rates Did Not Crack The Housing Market
In short, the late 2018 / 2019 period saw a major global aggregate demand shock occur following an already-established slowdown in Chinese credit growth and a rapid rise in interest rates in the DM world. It is these factors that were likely responsible for the 2019 slowdown in economic growth, not the fact that interest rates reached levels that restricted economic activity on their own. R-star In A Post-Pandemic World Charts II-7 – II-12 above suggest that a gap between interest rates and trend rates of growth was indeed justified for a few years following the global financial crisis, but that a decline in r-star only appeared to be permanent due to persistent, non-monetary policy shocks to aggregate demand. In the few years prior to the pandemic, it is altogether possible that r-star was in fact meaningfully higher than academic estimates suggested. But that is now a counterfactual assertion, as the pandemic has transformed the outlook for interest rates and bond yields in conflicting ways. A 10% decline in the level of real output was the most intensely negative non-monetary shock to aggregate demand since the 1930s (Chart II-13), and we agree that another depression would have occurred without extraordinary government assistance. The economic damage caused by the pandemic certainly does not work in favor of a higher neutral rate, and we highlighted in Section 1 of our report that the Fed expects there to be some lingering and persistent slack in the labor market even once the pandemic is over. Chart II-13Without Major Monetary And Fiscal Policy Support, The Pandemic Would Probably Have Caused A Depression
Without Major Monetary And Fiscal Policy Support, The Pandemic Would Probably Have Caused A Depression
Without Major Monetary And Fiscal Policy Support, The Pandemic Would Probably Have Caused A Depression
Chart II-14A Huge Increase In Government Transfers And Spending Is Underway
April 2021
April 2021
On the other hand, Larry Summers, the chief proponent of the theory of secular stagnation, has argued for several years that increased fiscal spending was warranted in order to address an imbalance between private sector savings and investment. Summers himself now characterizes US fiscal policy as the “least responsible” that he has seen over the past 40 years, because of too-large government spending that risks overheating the economy (Chart II-14). Summers’ critique rests in large part on the fact that new government spending has not occurred in the form of investment (to balance out the existence of excess savings), but is instead providing transfers to households that in many cases have already accumulated significant excess savings. But the key point for investors is that the pandemic has completely shifted the narrative about fiscal spending, from “arguably insufficient for several years following the global financial crisis” to now “risking a dramatic overheating of the economy.” Some elements of Summers’ criticism of the Biden administration’s fiscal policy are justified, particularly the policy of large direct transfer payments to workers who have suffered no loss in employment or income as a result of the pandemic. Despite this, as detailed in Section 1 of our report, we are more sanguine about the risks of aggressive overheating for three reasons: it does seem likely that some portion of the spending on services that has been “missing” over the past year will never return or will be slow to return, some of the excess savings that have accumulated will not be immediately (or ever) spent, and the rise in consumer inflation expectations that has occurred over the past year has happened from an extremely low starting point and has yet to even rise above its post-GFC range. The low odds that we assign to dangerously above-target inflation over the coming 12-24 months does not, however, mean that investors’ expectations for r-star will stay low. For right or for wrong, the US government has aggressively dis-saved over the past year, in an environment where low expectations for the neutral rate were anchored by a view of excessive private sector savings and insufficient demand from governments. In a scenario where the US output gap closes quickly, inflation rises modestly above target, and where permanent damage to the labor market from the pandemic is relatively limited, it seems reasonable to conclude that the narrative of secular stagnation will be challenged and that investor expectations for the neutral rate will converge towards trend rates of economic growth. That would imply that the 5-year/5-year forward Treasury yield could hypothetically rise above 3%, possibly as high as 4% or more. This is not our base case view, but it will be an important possibility to monitor as the decisive end to social distancing and other pandemic control measures draws nearer. Investment Conclusions A rise in the 5-year/5-year forward Treasury yield does not, in and of itself, suggest that 10-year Treasury yields will rise to levels that would threaten a significant decline in stock prices. The Fed does not control the long-end of the Treasury curve, but it does exert a very strong influence on the short-end. For example, were the Fed to follow the median current projection of FOMC participants and refrain from raising interest rates until sometime after 2023, it would limit how high current 10-year Treasury yields could rise. But it is not difficult to envision plausible scenarios where the 10-year Treasury yield rises above the range consistent with the pre-GFC US equity risk premium. Chart II-15 presents three hypothetical fair value paths for the 10-year yield assuming a mid-2022 liftoff date and a 4% terminal Fed funds rate for the following three scenarios: Chart II-1510-Year Yields Could Rise Meaningfully Further If Investors Shift Their Expectations For R-star
10-Year Yields Could Rise Meaningfully Further If Investors Shift Their Expectations For R-star
10-Year Yields Could Rise Meaningfully Further If Investors Shift Their Expectations For R-star
The Fed raises rates at a pace of 1% (4 hikes) per year, with a term premium of 10 basis points The Fed raises rates at a pace of 1% (4 hikes) per year, with a term premium of 50 basis points The Fed raises rates at a pace of 1.5% (6 hikes) per year, with a term premium of 50 basis points In the first scenario, based on the current US 12-month forward P/E ratio, the fair value of the 10-year Treasury yield would rise above the range consistent with a reasonable ERP in the middle of 2022, the liftoff point assumed in all three scenarios. In the second and third scenarios, the US equity ERP would already be quite low. When using the late 1999 / early 2000 bubble period as a reference point, even the scenarios shown in Chart II-15 are not very threatening to stock prices. Given current equity market pricing, the third scenario would take the US equity risk premium back to mid 2002 levels, which were still meaningfully higher than during the peak of the bubble. And that is assuming an earlier liftoff than the market currently expects, a faster pace of rate hikes than experienced during the last economic cycle, and a very meaningful increase in the market’s expectations for the neutral rate. But it is not clear what equity risk premium investors will require to contend with the myriad risks to the economic outlook that did not exist in the early 2000s. For example, equity investors are today faced with a riskier policy environment than existed 20 years ago in the US and in other developed economies that is at least partially driven by populist sentiment, potentially impacting earnings via lower operating margins or higher taxes. These or other risks existed at several points over the past decade and T.I.N.A. (“There Is No Alternative”) prevailed, but that occurred precisely because the equity risk premium was very elevated. A low ERP that is technically not as low as what prevailed during the tech bubble era could thus still threaten stock prices, raising the specter of negative absolute returns from stocks and nominal government bonds for a period of time, beginning potentially at or in the lead-up to the first Fed rate hike. Chart II-16There Are Alternatives To A Traditional 60/40 Portfolio In A Rising Rate Environment
There Are Alternatives To A Traditional 60/40 Portfolio In A Rising Rate Environment
There Are Alternatives To A Traditional 60/40 Portfolio In A Rising Rate Environment
Many investors have questioned what asset allocation strategy should be pursued in a scenario where stock prices and bond yields are no longer positively correlated. Chart II-16 provides some perspective on the question, by comparing the total return of a 60/40 stock/bond portfolio to a strategy involving the opportunistic redeployment of cash into stocks. The strategy rule maintains a 50/50 stock/cash allocation during normal market conditions, but it then shifts the entire cash allocation into equities following a 15% selloff in the stock market. The portfolio is shifted back to a 50/50 allocation once stocks rise to a new rolling 1-year high. The chart highlights that 60/40 balanced portfolio-style returns may be achievable with cash as the diversifier without a significant reduction in the Sharpe ratio. In fact, the strategy has the effect of lowering average volatility due to prolonged periods of comparatively lower equity exposure, although this occurs at the cost of higher volatility during periods of high market stress (precisely when investors most want protection from volatility). But the bottom line for investors is that while they are not likely to be without cost, options exist for investors to potentially earn positive absolute returns in a scenario where a significant shift in the interest rate outlook threatens both stock and bond prices. As noted above, this remains a risk to our view rather than our expectation, but we will continue to monitor the potential threat posed to stock prices as the pandemic draws to a decisive close later this year. Jonathan LaBerge, CFA Vice President The Bank Credit Analyst III. Indicators And Reference Charts BCA’s equity indicators highlight that the “easy” money from expectations of an eventual end to the pandemic have already been made. Our technical, valuation, and sentiment indicators are very extended, highlighting that investors should expect positive but more modest returns from stocks over the coming 6-12 months. Our monetary indicator has aggressively retreated from its high last year, reflecting a meaningful recovery in government bond yields. The indicator remains above the boom/bust line, however, highlighting that monetary policy remains supportive for risky asset prices. Forward equity earnings already price in a complete earnings recovery, but for now there is no meaningful sign of waning forward earnings momentum. Net revisions remain very strong, and positive earnings surprises have ticked slightly lower from their strongest levels on record. Within a global equity portfolio, US stocks have recently risen versus global ex-US, reflecting a countertrend rise in the US dollar and a lagging vaccination campaign in Europe. We expect a deceleration in the Chinese credit impulse later this year, which will weigh on EM stocks and heighten the importance of European equities in driving global ex-US outperformance. European equity outperformance, in turn, will likely necessitate the outperformance of euro area financials. The US 10-Year Treasury yield has risen well above its 200-day moving average. Long-dated yields are technically stretched to the upside, but our valuation index highlights that bonds are still extremely expensive and that yields could move higher over the cyclical investment horizon. The recent bounce in the US dollar has reflected improved relative US growth expectations, but also previously oversold levels. The dollar may continue to strengthen on a 0-3 month time horizon, but we expect it to be lower in 12 months’ time than it is today. Commodity prices have recovered not just back to pre-pandemic levels, but also back to 2014 levels. This underscores that many commodity prices are extended, and may be due for a breather once the Chinese credit impulse begins to decline. US and global LEIs remain in a solid uptrend, and global manufacturing PMIs are strong. This underscores that the global demand for goods is robust, and that output is below pre-pandemic levels in most economies because of very weak services spending. The latter will recover significantly later this year, as social distancing and other pandemic control measures disappear. EQUITIES: Chart III-1US Equity Indicators
US Equity Indicators
US Equity Indicators
Chart III-2Willingness To Pay For Risk
Willingness To Pay For Risk
Willingness To Pay For Risk
Chart III-3US Equity Sentiment Indicators
US Equity Sentiment Indicators
US Equity Sentiment Indicators
Chart III-4Revealed Preference Indicator
Revealed Preference Indicator
Revealed Preference Indicator
Chart III-5US Stock Market Valuation
US Stock Market Valuation
US Stock Market Valuation
Chart III-6US Earnings
US Earnings
US Earnings
Chart III-7Global Stock Market And Earnings: Relative Performance
Global Stock Market And Earnings: Relative Performance
Global Stock Market And Earnings: Relative Performance
Chart III-8Global Stock Market And Earnings: Relative Performance
Global Stock Market And Earnings: Relative Performance
Global Stock Market And Earnings: Relative Performance
FIXED INCOME: Chart III-9US Treasurys And Valuations
US Treasurys And Valuations
US Treasurys And Valuations
Chart III-10Yield Curve Slopes
Yield Curve Slopes
Yield Curve Slopes
Chart III-11Selected US Bond Yields
Selected US Bond Yields
Selected US Bond Yields
Chart III-1210-Year Treasury Yield Components
10-Year Treasury Yield Components
10-Year Treasury Yield Components
Chart III-13US Corporate Bonds And Health Monitor
US Corporate Bonds And Health Monitor
US Corporate Bonds And Health Monitor
Chart III-14Global Bonds: Developed Markets
Global Bonds: Developed Markets
Global Bonds: Developed Markets
Chart III-15Global Bonds: Emerging Markets
Global Bonds: Emerging Markets
Global Bonds: Emerging Markets
CURRENCIES: Chart III-16US Dollar And PPP
US Dollar And PPP
US Dollar And PPP
Chart III-17US Dollar And Indicator
US Dollar And Indicator
US Dollar And Indicator
Chart III-18US Dollar Fundamentals
US Dollar Fundamentals
US Dollar Fundamentals
Chart III-19Japanese Yen Technicals
Japanese Yen Technicals
Japanese Yen Technicals
Chart III-20Euro Technicals
Euro Technicals
Euro Technicals
Chart III-21Euro/Yen Technicals
Euro/Yen Technicals
Euro/Yen Technicals
Chart III-22Euro/Pound Technicals
Euro/Pound Technicals
Euro/Pound Technicals
COMMODITIES: Chart III-23Broad Commodity Indicators
Broad Commodity Indicators
Broad Commodity Indicators
Chart III-24Commodity Prices
Commodity Prices
Commodity Prices
Chart III-25Commodity Prices
Commodity Prices
Commodity Prices
Chart III-26Commodity Sentiment
Commodity Sentiment
Commodity Sentiment
Chart III-27Speculative Positioning
Speculative Positioning
Speculative Positioning
ECONOMY: Chart III-28US And Global Macro Backdrop
US And Global Macro Backdrop
US And Global Macro Backdrop
Chart III-29US Macro Snapshot
US Macro Snapshot
US Macro Snapshot
Chart III-30US Growth Outlook
US Growth Outlook
US Growth Outlook
Chart III-31US Cyclical Spending
US Cyclical Spending
US Cyclical Spending
Chart III-32US Labor Market
US Labor Market
US Labor Market
Chart III-33US Consumption
US Consumption
US Consumption
Chart III-34US Housing
US Housing
US Housing
Chart III-35US Debt And Deleveraging
US Debt And Deleveraging
US Debt And Deleveraging
Chart III-36US Financial Conditions
US Financial Conditions
US Financial Conditions
Chart III-37Global Economic Snapshot: Europe
Global Economic Snapshot: Europe
Global Economic Snapshot: Europe
Chart III-38Global Economic Snapshot: China
Global Economic Snapshot: China
Global Economic Snapshot: China
Jonathan LaBerge, CFA Vice President The Bank Credit Analyst Footnotes 1 “Summers Sees ‘Least Responsible’ Fiscal Policy in 40 Years,” Bloomberg News, March 20, 2021. 2 2020-03-20 GIS SR “Revisiting The Neutral Rate Of Interest: A Contrarian View In A Time Of Crisis.”
Highlights Central Bank Expectations: Market expectations of short-term interest rate moves over the next few years are inching higher. The potential for markets to offer a greater bond-bearish challenge to the current highly dovish forward guidance of the major central banks should not be dismissed given the growth-positive mix of expanding global vaccinations and US fiscal stimulus. Global Golden Rule: The gap between market expectations of global central bank policy rates and realized interest rate outcomes is a reliable predictor of government bond returns – a dynamic we have dubbed the “Global Golden Rule of Bond Investing”. Given our expectation that no major developed market central bank will hike rates within the next twelve months, the Global Golden Rule is calling for the recent government bond market laggards to outperform over the next year. Tapering & The Golden Rule: Government bonds in countries where central banks are most likely to begin tapering in 2022 well before considering rate hikes – most notably, the US and Canada – are likely to suffer returns worse than implied by the Global Golden Rule. It is too soon to raise allocations to those higher-beta bond markets. Feature As the first quarter of 2021 draws to a close, fixed income investors are licking their wounds from a rough start to the year. Government bonds across the developed world have absorbed heavy losses as yields have climbed higher, led by US Treasuries which are down -4.0% year-to-date in total return terms. Other markets have also been hit hard, like Canada (-3.9%), Australia (-3.5%) and the UK (-6.3%). The trend in rising yields has been concentrated at longer maturities, with shorter ends of yield curves seeing much smaller moves (Chart 1). Two-year government bond yields are still being pinned down by the dovish forward guidance of the major central banks. The Fed is signaling no rate hikes through at least the end of 2023, while other central banks are sending similar messages on the timing of any potential future rate moves. However, global growth expectations continue to gain upward momentum, fueled by the optimistic combination of expanding COVID-19 vaccinations and aggressive US fiscal stimulus. Real GDP growth is expected to soar to a mid-single digit pace in the US, UK, Canada and even the euro zone - moves heralded by the steady climb of the OECD leading economic indicators and composite purchasing manager indices (Chart 2). Chart 1Rising Yields Reflect Reflation
Rising Yields Reflect Reflation
Rising Yields Reflect Reflation
Chart 2A Bond-Bearish Surge In Global Growth
Revisiting Our Global Golden Rule Of Bond Investing
Revisiting Our Global Golden Rule Of Bond Investing
Markets will continue to pull forward the timing and pace of the next monetary tightening cycle if those faster above-trend growth forecasts are realized. This will represent a change of “leadership” in the global bond bear market from faster inflation breakevens to increased policy rate expectations helping drive real yields higher. That shift may already be underway according to the ZEW survey of global investor expectations which now shows that the net number of respondents expecting higher short-term interest rates in the US and UK has turned positive (Chart 3). Already, our Central Bank Monitors for the US, Canada and Australia (Chart 4) have climbed back to neutral levels suggesting that easier monetary policy is no longer required. Similar trends can be seen to a lesser extent in the UK, euro area and even Japan (Chart 5). These moves are already coinciding with increased cyclical upward pressure on global bond yields, even without any change in dovish central bank guidance alongside ongoing buying of government bonds via quantitative easing programs. Chart 3Shifting Expectations For Policy Rates?
Shifting Expectations For Policy Rates?
Shifting Expectations For Policy Rates?
Chart 4Diminishing Need For Easy Monetary Policy Here
Diminishing Need For Easy Monetary Policy Here
Diminishing Need For Easy Monetary Policy Here
Chart 5Easy Policy Still Required Here
Easy Policy Still Required Here
Easy Policy Still Required Here
How will a trend of rising short-term interest rate expectations translate into future expected returns on government bonds? For that, we revisit a framework temporarily set aside during the pandemic era of crisis monetary policies – the Global Golden Rule (GGR) of bond investing. An Update Of The Global Golden Rule, By Country In September 2018, we published a Special Report introducing a government bond return forecasting methodology called the “Global Golden Rule.” This was an extension of a framework introduced by our sister service, US Bond Strategy, that links US Treasury returns (versus cash) to changes in the fed funds rate that were not already discounted in the US Overnight Index Swap (OIS) curve.1 The historical results convincingly showed that investors who "get the Fed right" by making correct bets on changes in the funds rate versus expectations were very likely to make the right call on the direction of Treasury yields. We discovered that relationship also held in other developed market countries. Thus, we now had a framework to help project expected bond returns simply based on a view for future central bank interest rate moves versus market expectations.2 Specific details on the calculation of the Global Golden Rule can be found in those original 2018 papers. In the following pages, we present the latest results of the Global Golden Rule for the US, Canada, Australia, the UK, the euro area and Japan. The set-up for the chart shown for each country is the same. We show the 12-month policy rate “surprise”, defined as the actual change in the central bank policy rate over the preceding 12-months versus the expected 12-month change in the policy rate from a year earlier extracted from OIS curves (aka our 12-month discounters). We then compare the 12-month policy rate surprise to the annual excess return over cash (treasury bills) of the Bloomberg Barclays government bond index for each country. We also show the 12-month policy rate surprise versus the 12-month change in the government bond index yield. The very strong historical correlation between those latter two series is the backbone of the Global Golden Rule framework. After that, we present tables showing expected yield changes and excess returns for various maturity points, as well as the overall government bond index, derived from the Global Golden Rule regressions. The expected change in yield is derived from regressions on the policy rate surprises, with different estimations done for each maturity point. In the tables, we show the results for different scenarios for changes in policy rates. For example, the row in the return tables called “1 rate hike” would show the expected yield changes and excess returns if the central bank for that particular country lifts the policy interest rate by +25bps over the next 12 months. This allows us to pick the scenario(s) that most closely correlate to our own expectation for central bank actions, translating that into government bond return expectations. Global Golden Rule: US Chart 6UST Selloff Akin To A Hawkish Surprise
UST Selloff Akin To A Hawkish Surprise
UST Selloff Akin To A Hawkish Surprise
The Golden Rule would have underestimated the losses realized by US Treasuries over the past year (-4.5%), as negative excess returns over cash typically occur when the Fed is more hawkish than expectations – an outcome that did not occur (Chart 6). The trailing 12-month policy rate surprise for the US is currently zero, as last year’s massively dovish rate cuts have rolled off. The US OIS curve now discounts only 5bps of interest rate increases over the next 12 months, a period that runs to the end of first quarter of 2022. This is in line with the Fed’s guidance that no rate hikes will take place before the end of 2023. Our base case is the “Flat” scenario shown in Table 1 and Table 2, with the Fed keeping the funds rate unchanged near 0% for the next twelve months – a very modest “dovish” surprise. This produces a Golden Rule forecast of the overall US Treasury index yield falling -2bps that generates a total return of +1.1%. This is essentially a coupon-clipping return equivalent to the current index yield. Table 1US: Government Bond Index Total Return Forecasts Over The Next 12 Months
Revisiting Our Global Golden Rule Of Bond Investing
Revisiting Our Global Golden Rule Of Bond Investing
Table 2US: Expected Changes In Treasury Yields Over The Next 12 Months
Revisiting Our Global Golden Rule Of Bond Investing
Revisiting Our Global Golden Rule Of Bond Investing
Global Golden Rule: Canada Chart 7Canadian Bond Selloff Worse Than Implied By Golden Rule
Canadian Bond Selloff Worse Than Implied By Golden Rule
Canadian Bond Selloff Worse Than Implied By Golden Rule
Canadian government bonds have sold off smartly over the past 12 months, delivering an excess return over cash of -2.8%. That is a smaller loss, however, compared to other developed economy government bond markets. The Canadian OIS curve did not move as aggressively to price in rate cuts last year, so the rapid pace of Bank of Canada (BoC) easing that was actually delivered constituted a modest “dovish surprise” that helped mute Canadian bond losses to some degree (Chart 7). The trailing 12-month policy rate surprise for Canada is +37bps (a dovish surprise), but rate expectations are more aggressive on forward basis. The Canadian OIS curve now discounts +28bps of interest rate increases over the next 12-months, a period that runs to the end of first quarter of 2022. This stands out as the highest such figure among the countries discussed in this report. This is likely due to the relatively less dovish messaging from BoC officials who have hinted that QE could be tapered sooner than expected if the economy outperforms the BoC’s forecasts for 2021. Our base case is the “Flat” scenario shown in Table 3 and Table 4, with the BoC keeping the policy interest rate at 0.25% for the next twelve months. This produces a Golden Rule forecast of a decline in the overall Canadian government bond index yield of -12bps, delivering a projected total return of +1.69%. That return may turn out to be overly optimistic if the BoC does indeed begin tapering QE later this year. Table 3Canada: Government Bond Index Total Return Forecasts Over The Next 12 Months
Revisiting Our Global Golden Rule Of Bond Investing
Revisiting Our Global Golden Rule Of Bond Investing
Table 4Canada: Expected Changes In Government Bond Yields Over The Next 12 Months
Revisiting Our Global Golden Rule Of Bond Investing
Revisiting Our Global Golden Rule Of Bond Investing
Global Golden Rule: Australia Chart 8Australian Bonds Acting Like The RBA Was Hawkish
Australian Bonds Acting Like The RBA Was Hawkish
Australian Bonds Acting Like The RBA Was Hawkish
Australian government bonds have delivered a negative excess return over cash of -3.6% over the past year (Chart 8). This underperformed the projection from the Golden Rule, as the Reserve Bank of Australia (RBA) was not more hawkish than market expectations. The central bank actually delivered a dovish surprise in 2020, not only cutting policy rates dramatically but starting up a bond-buying QE program and instituting yield curve control to cap 3-year bond yields. The trailing 12-month policy rate surprise for Australia is zero, as last year’s massively dovish surprise rate cuts have rolled off. The Australia OIS curve now discounts only 7bps of interest rate increases over the next 12-months, a period that runs to the end of first quarter of 2022. This is in line with the RBA’s highly dovish guidance suggesting that there will be no change to current policy settings until Australian wage growth picks up to the 3% level consistent with the RBA’s 2-3% CPI inflation target. The central bank does not expect that to occur before 2023. We agree with dovish guidance from the RBA, thus our base case is the “Flat” scenario shown in Table 5 and Table 6, with the RBA keeping the Cash Rate unchanged at 0.1% for the next twelve months. This generates a Golden Rule forecast of an -5bps decline in the overall Australian government bond index yield, producing a total return projection of +1.4%. Table 5Australia: Government Bond Index Total Return Forecasts Over The Next 12 Months
Revisiting Our Global Golden Rule Of Bond Investing
Revisiting Our Global Golden Rule Of Bond Investing
Table 6Australia: Expected Changes In Government Bond Yields Over The Next 12 Months
Revisiting Our Global Golden Rule Of Bond Investing
Revisiting Our Global Golden Rule Of Bond Investing
Global Golden Rule: UK Chart 9A UK Gilt Selloff Without A Hawkish BoE
A UK Gilt Selloff Without A Hawkish BoE
A UK Gilt Selloff Without A Hawkish BoE
UK Gilts underperformed the Golden Rule forecast over the past 12 months, delivering a negative excess return over cash of –5.1% even with the Bank of England (BoE) not delivering any hawkish surprise versus market expectations (Chart 9). The trailing 12-month policy rate surprise for the UK is currently zero. The UK OIS curve now discounts only 5bps of interest rate increases over the next 12-months, a period that runs to the end of first quarter of 2022. This is in line with the BoE’s guidance that no monetary tightening will take place until there is clear evidence that the excess capacity created by the pandemic shock is clearly being absorbed. Yet while the BoE has still left the door open to moving to a negative policy rate if needed, markets are not discounting any such move. Our base case is the “Flat” scenario shown in Table 7 and Table 8, with the BoE keeping the Bank Rate unchanged at 0.1% for the next twelve months. This produces a Golden Rule forecast of the overall UK Gilt index yield falling -2bps that generates a total return of +1.0%. This is a return only slightly above the current index yield. Table 7UK: Government Bond Index Total Return Forecasts Over The Next 12 Months
Revisiting Our Global Golden Rule Of Bond Investing
Revisiting Our Global Golden Rule Of Bond Investing
Table 8UK: Expected Changes In Gilt Yields Over The Next 12 Months
Revisiting Our Global Golden Rule Of Bond Investing
Revisiting Our Global Golden Rule Of Bond Investing
Global Golden Rule: Germany Chart 10Even Bunds Acting Like ECB Is "Hawkish"
Even Bunds Acting Like ECB Is "Hawkish"
Even Bunds Acting Like ECB Is "Hawkish"
German government bonds have produced an excess return over cash of -1.6% over the past year. There was no surprise from the European Central Bank (ECB) during that time relative to market expectations (Chart 10), so that negative return reflected the modest rise in German bond yields on the back of improving global growth. The trailing 12-month policy rate surprise for Germany (and the overall euro area) remains stuck near zero, as has been the case since the ECB cut its deposit rate below zero and instituted QE back in 2016. The euro area OIS curve now discounts only -4bps of interest rate cuts over the next 12 months, a period that runs to the end of first quarter of 2022. This is in line with the ECB’s guidance that rates will be kept unchanged until at least 2023, as the central bank’s projections call for euro area inflation to not climb above 1.5% - below the ECB’s 2% target – through 2023. The OIS curve is discounting a small probability that the ECB could be forced to deliver a small rate cut given the degree of the euro area inflation undershoot. Our base case, however, is that the ECB will keep rates steady over the next 12 months (and likely for a few more years after that). Thus, the “Flat” scenarios shown in Table 9 and Table 10 are most relevant, with the German government bond index yield rising +2bps according to the Golden Rule. This produces a total return projection of -0.6%. Table 9Germany: Government Bond Index Total Return Forecasts Over The Next 12 Months
Revisiting Our Global Golden Rule Of Bond Investing
Revisiting Our Global Golden Rule Of Bond Investing
Table 10Germany: Expected Changes In Bund Yields Over The Next 12 Months
Revisiting Our Global Golden Rule Of Bond Investing
Revisiting Our Global Golden Rule Of Bond Investing
Global Golden Rule: Japan Chart 11JGBs Bucking The Global "Hawkish" Selloff
JGBs Bucking The Global "Hawkish" Selloff
JGBs Bucking The Global "Hawkish" Selloff
Japanese government bonds (JGBs) have delivered an excess return versus cash of -0.8% over the past twelve months (Chart 11). Although it may sound unusual for Japan, there was actually a tiny “hawkish” surprise as the Bank of Japan (BoJ) kept policy rates steady over the past year even as markets had priced in a possibility of a small rate cut in response to the COVID-19 growth shock. Admittedly, the Golden Rule framework is poorly suited to project Japanese bond returns. The Bank of Japan (BoJ) has been unable to lift policy rates for many years, while they have instituted yield curve control on 10-year JGBs since 2016, anchoring yields near zero. With no variability on policy rates or bond yields, a methodology that links bond returns to unexpected policy interest rate changes will have poor predictive power. The Japan OIS curve now discounts -5bps of interest rate cuts over the next 12 months, a period that runs to the end of first quarter of 2022. The BoJ has not ruled out the possibility of a small rate cut sometime in the next few months, as Japanese inflation remains far below the 2% BoJ target. Our base case is the “Flat” scenarios shown in Table 11 and Table 12, with the BoJ keeping policy rates unchanged near 0% for the next twelve months. That generates a Golden Rule forecast of a +5bp increase in the Japanese government bond index yield, with a total return projection of -0.4%. This would be consistent with the BoJ producing a small hawkish “surprise” by not cutting rates deeper into negative territory. Table 11Japan: Government Bond Index Total Return Forecasts Over The Next 12 Months
Revisiting Our Global Golden Rule Of Bond Investing
Revisiting Our Global Golden Rule Of Bond Investing
Table 12Japan: Expected Changes In JGB Yields Over The Next 12 Months
Revisiting Our Global Golden Rule Of Bond Investing
Revisiting Our Global Golden Rule Of Bond Investing
Investment Implications Of The Global Golden Rule Projections Among all the scenarios laid out above, our base case has been that no change in policy rates should be expected over the next 12 months in any of the countries. This fits with our view that central banks will be reluctant to consider any changes to the current dovish forward guidance on future rate hikes until there is clear evidence that the global economy has moved beyond the pandemic. That means taking some near-term inflation risks given the very robust pace of growth expected over the rest of 2021. In Table 13, we rank all the return projections generated by the Global Golden Rule for the “Flat” scenarios on policy rates over the next year. Returns are shown both in local currency terms and in USD-hedged terms. Table 13Government Bond Index Total Return Forecasts Over The Next 12 Months Assuming Policy Rates Remain Unchanged
Revisiting Our Global Golden Rule Of Bond Investing
Revisiting Our Global Golden Rule Of Bond Investing
The return rankings are a mirror image of the performance seen year-to-date, with the “higher beta” bond markets (Canada, Australia and the US) outperforming the more defensive low-yielding markets (the UK, Germany and Japan). Returns are projected to be moderate, however, with Canada leading the way both unhedged (+1.69%) and currency hedged (+1.73%). The return rankings excluding the +10-year maturity buckets of the government bond indices are shown in Table 14. We present these to allow a more “apples to apples” comparison of the six regions shown, as the UK index has a huge weighting in the +10-year bucket while there is no +10-year benchmark for Australia. On this basis, Australia stands out as having the best Global Golden Rule generated return projections, both unhedged (+1.44%) and USD-hedged (+1.66%).3 Table 14
Revisiting Our Global Golden Rule Of Bond Investing
Revisiting Our Global Golden Rule Of Bond Investing
These return rankings run counter to our current recommended country allocation: underweight the US, overweight Germany and Japan and neutral the UK, Canada and Australia. We still believe there is more near-term upside for global bond yields, led by US Treasuries, thus it is too soon to begin to position for the results projected by the Global Golden Rule. There is one other factor that leads us to interpret the results cautiously – the likelihood that some central banks will begin tapering their bond purchases within the next 12 months. Our expectation is that the Fed will begin to signal a need to slow the pace of its QE bond buying in the fourth quarter of this year, with actual tapering beginning in Q1 of 2022. The BoC is likely to follow suit shortly thereafter. Thus, the Fed and BoC will begin tapering within the 12-month forecasting window of the Global Golden Rule. The RBA and BoE will debate a need to taper later in 2022 – beyond that 12-month window – while the ECB and BoJ will maintain their current pace of bond buying until at least the end of 2022. From the point of view of bond markets, tapering by the Fed and BoC will likely feel as if those central banks were actually delivering rate hikes. Bond yields will likely rise by more than projected by the Global Golden Rule in the “Flat” scenarios highlighted earlier. Quantitative models that attempt to translate QE into interest rate changes, so-called “shadow rates”, show that the Fed’s QE bond buying over the past year has been equivalent to nearly 250bp of additional Fed rate cuts after the funds rate was slashed to 0% (Chart 12). Thus, when the Fed begins to taper QE, it will conceptually be as if the Fed started a rate hike cycle with the starting point of a fed funds rate at minus -2.5%. When looking at the historical correlation of changes in the US shadow rate and US Treasury yields, the +40bps rise in the Treasury index yield over the past 12 months is equivalent to roughly a 100bp increase in the shadow fed funds rate (Chart 13, top panel). That would line up with a fairly aggressive pace of Fed tapering when looking at the correlation of changes in the shadow rate to changes in the size of the Fed balance sheet (middle panel). Chart 12"Shadow Policy Rates" Are Below 0%
"Shadow Policy Rates" Are Below 0%
"Shadow Policy Rates" Are Below 0%
Chart 13UST Yields Discount A Lot Of Fed Tapering
UST Yields Discount A Lot Of Fed Tapering
UST Yields Discount A Lot Of Fed Tapering
US Treasury yields have been rising for more fundamental reasons like improving growth expectations alongside rising inflation expectations. If the Fed is forced to signal a tapering of QE later this year because that robust growth outlook comes to fruition, it is a stretch to think that Treasury yields will not see additional upward pressure. Thus, we are sticking with our current country allocations, despite the message from our Global Golden Rule. US Treasury returns may look more like the “1 rate hike” or “2 rate hikes” scenarios shown in Table 1 when the Fed begins tapering early in 2022. The same goes for Canadian bond yields once the BoC moves to taper soon after the Fed, as we expect, which is why we are keeping Canada on “downgrade watch.” Bottom Line: The Global Golden Rule is calling for the recent government bond market laggards to outperform over the next year if central banks keep rates on hold. Government bonds in countries where central banks are most likely to begin tapering in 2022 well before considering rate hikes – most notably, the US and Canada – are likely to suffer returns worse than implied by the Global Golden Rule. It is too soon to raise allocations to those higher-beta bond markets. Robert Robis, CFA Chief Fixed Income Strategist rrobis@bcaresearch.com Footnotes 1 Please see BCA Research US Bond Strategy Special Report, "The Golden Rule Of Bond Investing", dated July 24, 2018, available at usbs.bcarearch.com. 2 Please see BCA Research Global Fixed Income Strategy Special Report, "The Global Golden Rule Of Bond Investing", dated September 25, 2018, available at gfis.bcaresearch.com. 3 Note that in Table 14, we rescale the other maturity buckets after removing the +10-year bucket. The index returns are presented as a market-capitalization weighted combination of the expected returns of the remaining maturity buckets. Recommendations The GFIS Recommended Portfolio Vs. The Custom Benchmark Index
Revisiting Our Global Golden Rule Of Bond Investing
Revisiting Our Global Golden Rule Of Bond Investing
Duration Regional Allocation Spread Product Tactical Trades Yields & Returns Global Bond Yields Historical Returns
Highlights Biden’s policy on China is hawkish so far, as expected, but temporary improvement is possible. We are cyclically bearish on the dollar but are taking a neutral tactical stance as the greenback’s bounce could go higher than expected if US-China relations take another downward dive. US-Iran tensions are on track to escalate in the second quarter as the pressure builds toward what we think will be a third quarter restoration of the 2015 nuclear deal. Oil price volatility is the takeaway. The anticipated US-Russia conflict has emerged and will bring negative surprises, especially for Russian and emerging European markets. Europe still enjoys relative political stability. A German election upset would bring upside risk to the euro and bund yields, while Scottish independence risk is contained for now. In this report we are launching the first in a new series of regular quarterly outlook reports that will supplement our annual Geopolitical Strategy strategic outlook. Feature The decline in global policy uncertainty and geopolitical risk that attended the US election and COVID-19 vaccine discovery has largely played out. Global investors have witnessed successful vaccine rollouts in the US and UK and can look forward to other countries, namely the EU-27, catching up. They have witnessed a splurge of US fiscal spending – $2.8 trillion since December – unprecedented in peacetime. And they have seen the Chinese government offer assurances that monetary tightening will not undermine the economic recovery. The risk of the US doubling down on belligerent trade protectionism has fallen by the wayside along with the Trump presidency. Going forward, there are signs that policy uncertainty and geopolitical risk will revive. First, as the global semiconductor shortage and Suez Canal blockage highlight, the world economy will sputter and strain at the sudden eruption of economic activity as the pandemic subsides and vast government spending takes effect. Financial instability is a likely consequence of the sudden, simultaneous adoption of debt monetization across a range of economies combined with a global high-tech race and energy overhaul. Second, the defeat of the Trump presidency does not reverse the secular increase in geopolitical tensions arising from America’s internal divisions and weakening hand relative to China, Russia, and others. On the contrary, large monetary and fiscal stimulus lowers the economic costs of conflict and encourages autarkic, self-sufficiency policies that make governments more likely to struggle with each other to secure their supply chains. Chart 1AThe Return Of Geopolitical Risk
The Return Of Geopolitical Risk
The Return Of Geopolitical Risk
Chart 1BThe Return Of Geopolitical Risk
The Return Of Geopolitical Risk
The Return Of Geopolitical Risk
If we look at simple, crude measures of geopolitical risk we can see the market awakening to the new wall of worry for this business cycle – Great Power struggle, the persistence of “America First” with a different figurehead, China policy tightening, and a vacuum of European leadership. The US dollar is rising, developed market equities are outperforming emerging markets, safe-haven currencies are ticking up against commodity currencies, and gold is perking back up (Charts 1A & 1B). The cyclical upswing should reverse most of these trends over the medium term but investors should be cautious in the short term. US Stimulus, Chinese Tightening, And The Greenback The US remains the world’s preponderant power despite its political dysfunction and economic decline relative to emerging markets. The US has struggled to formulate a coherent way to deal with declining influence, as shown by dramatic policy reversals toward Iraq, Iran, China, and Russia. The pattern of unpredictability will continue. The Biden administration’s longevity is unknown so foreign states will be cautious of making firm commitments, implementing deals, or taking irrevocable actions. This does not mean the Biden administration will have a small impact – far from it. Biden’s national policy seeks to fire up the American economy, refurbish alliances, export liberal democratic ideology, and compete with China and Russia. The firing up is largely already accomplished – the American Rescue Plan Act (ARPA) and Biden’s forthcoming “Build Back Better” proposals will ultimately rank with Johnson’s Great Society. The Fed estimates that US GDP growth will hit 6.5% this year, higher than the consensus of economic forecasts estimates 5.5%, driven by giant government pump-priming (Chart 2). The US, which is already an insulated economy, is virtually inured to foreign shocks for the time being. Chart 2US Injects Steroids
Second Quarter Outlook 2021: Geopolitics Upsets The "Return To Normalcy"
Second Quarter Outlook 2021: Geopolitics Upsets The "Return To Normalcy"
Next comes the courting of allies to form a united democratic front against the world’s ambitious dictatorships. This process will be very difficult as the allies are averse to taking risks, especially on behalf of an erratic America. Chart 3US Stimulus Briefly Halts Decline In Global Economic Share
Second Quarter Outlook 2021: Geopolitics Upsets The "Return To Normalcy"
Second Quarter Outlook 2021: Geopolitics Upsets The "Return To Normalcy"
The Obama administration spent six full years creating a coalition to pressure an economically miniscule Iran into signing the 2015 nuclear deal. Imagine how long it will take Biden to convince the EU-27 and small Asian states to stick their necks out against Xi Jinping’s China. Especially if they suspect that the US’s purpose is to force China to open its doors primarily for the Americans. If the US grows at the rate of consensus forecasts then its share of global GDP will be 17.6% by 2025 (Chart 3). However, the US’s decline should not be exaggerated. Consider the lesson of the past year, in which the US seemed to flounder in the face of the pandemic. The US’s death count, on a population basis, was in line with other developed markets and yet its citizens exercised a greater degree of individual freedom. It maintained the rule of law despite extreme polarization, social unrest, and a controversial election. Its development of mRNA vaccines highlighted its ongoing innovation edge. And it has rolled out the vaccines rapidly. Internal divisions are still extreme and likely to produce social instability (we are still in the zone of “peak polarization”). But the US economic foundation is now fundamentally supported – political collapse is improbable. Chart 4US Vs China: The Stimulus Impulse
US Vs China: The Stimulus Impulse
US Vs China: The Stimulus Impulse
In short, the US saw the “Civil War Lite” and has moved onto “Reconstruction Lite,” with a big expansion of the social safety net and infrastructure as well as taxes already being drafted. Meanwhile General Secretary Xi has managed to steer China into a good position for the much-ballyhooed 100th anniversary of the Communist Party on July 1. His administration is tightening monetary and fiscal policy marginally to resume the fight against systemic financial risk. China faces vast socioeconomic imbalances that, if left unattended, could eventually overturn the Communist Party’s rule. So far the tightening of policy is modest but the risk of a policy mistake is non-negligible and something global financial markets will have to grapple with in the second quarter. Comparing the US and China reveals an impending divergence in relative monetary and fiscal stimulus (Chart 4). China’s money and credit impulse is peaking – some signs of economic deceleration are popping up – even as the US lets loose a deluge of liquidity and pump-priming. The result is that the world is likely to experience waning Chinese demand and waxing US demand in the second half of the year. It is almost the mirror image of 2009-10, when China’s economy skyrocketed on a stimulus splurge while the US recovered more slowly with less policy support. The medium-to-long-run implication is that the US will have a bumpy downhill ride over the coming decade whereas China will recover more smoothly. Yet the analogy only goes so far. The structural transition facing China’s society and economy is severe and US-led international pressure on its economy will make it more severe. The short-run implication – for Q2 2021 – is that the US dollar’s bounce could run longer than consensus expects. Commodity prices, commodity currencies, and emerging market assets face a correction from very toppy levels. The global cyclical upswing will continue as long as China avoids a policy mistake of overtightening as we expect but the near-term is fraught with downside risk. Bottom Line: We are neutral on the dollar from a tactical point of view. While our bias is to expect the dollar to relapse, in line with the BCA House View and our Foreign Exchange Strategy, we are loathe to bet against the greenback given US stimulus and Chinese tightening. This is not to mention geopolitical tensions highlighted below that would reinforce the dollar. Biden’s China Policy And The Semiconductor Shortage Any spike in US-China strategic tensions in Q2 would exacerbate the above reasoning on the dollar. It would also lead to a deeper selloff in Chinese and EM Asian currencies and risk assets. A spike in tensions is not guaranteed but investors should plan for the worst. One of our core views for many years has been that any Democratic administration taking office in 2020 would remain hawkish on China, albeit less so than the Trump administration. So far this view is holding up. It may not have been the cause of the drop in Chinese and emerging Asian equities but it has not helped. However, the jury is still out on Biden’s China policy and the second quarter will likely see major actions that crystallize the relative hawkish or dovish change in policy. The acrimonious US-China meeting in Alaska meeting does not necessarily mean anything. The Biden administration has a full China policy review underway that will not be completed until around early June. The first bilateral summit between Biden and Xi could occur on Earth Day, April 22, or sometime thereafter, as the countries are looking to restart strategic dialogue and engage on nuclear non-proliferation and carbon emission reductions. Specifically China wants to swap its help on North Korea – which restarted ballistic missile launches as we go to press – for easier US policies on trade and tech. Only if and when a new attempt at engagement breaks down will the Biden administration conclude that it has a basis for pursuing a more offensive policy toward China. The problem is that new engagement probably will break down, sooner or later, for reasons we outlined last week: the areas of cooperation are limited – obviously so on health and cybersecurity, but even on climate change. Engagement on Iran and North Korea may have more success but the bigger conflicts over tech and Taiwan will persist. Ultimately China is fixated on strategic self-sufficiency and rapid tech acquisition in the national interest, leaving little room for US market access or removal of high-tech export controls. The threat that Biden will ultimately adopt and expand on Trump’s punitive measures will hang over Beijing’s head. The risk of a Republican victory in 2024 will also discourage China from implementing any deep structural concessions. The crux of the conflict remains the tech sector and specifically semiconductors.1 China is rapidly gaining market share but the US is using its immense leverage over chip design and equipment to cut off China’s access to chips and industry development. The ongoing threat of an American chip blockade is now being exacerbated by a global shortage of semiconductors as the economy recovers (Chart 5), exposing China’s long-term economic vulnerability. Chart 5Global Semiconductor Shortage
Global Semiconductor Shortage
Global Semiconductor Shortage
There is room for some de-escalation but not much – and it is not to be counted on. The Biden administration, like the Obama administration, subscribes to the view that the US should prioritize maintaining its lead in tech innovation rather than trying to compete with China’s high-subsidy model, which is gobbling up the lower end of the computer chip market. Biden’s policy will at first be defensive rather than offensive – focused on improving US supply chain security rather than curtailing Chinese supply. Biden’s proposal for domestic infrastructure program will include funds for the semiconductor industry and research. While the Biden administration likely prizes leadership and innovation over the on-shoring of US chip production, the US government must also look to supply security, specifically for the military, so some on-shoring of production is inevitable.2 Ultimately the Biden administration can continue using export controls to slow China’s semiconductor development or it can pare these controls back. If it does nothing then China’s state-backed tech program will lead to a rapid increase in Chinese capabilities and market share as has occurred in other industries. If it maintains restrictions then it will delay China’s development, especially on the highest end of chips, but not prevent China from gaining the technology through circumventing export controls, subsidizing its domestic industry, and poaching from Taiwan and South Korea. Given that technological supremacy will lead to military supremacy the US is likely to maintain restrictions. But a full chip blockade on China would require expanding controls and enforcing them on third parties, and massively increases strategic tensions, should Biden ever decide to go this ultra-hawkish route. The Biden administration can adjust the pace and intensity of export controls but cannot give China free rein. Biden will want to block China’s access to the US market, or funds, or parts when these feed its military-industrial complex but relax pressure on China’s commercial trade. This is only a temporary fix. The commercial/military distinction is hard to draw when Beijing continually pursues “civil-military fusion” to maximize its industrial and strategic capabilities. Therefore US-China strategic tensions over tech will worsen over the long run even if Biden pursues engagement in the short run. Bottom Line: Biden’s China policy has started out hawkish as expected but the real policy remains unknown. The second quarter will reveal key details. Biden could pursue engagement, leading to a reduction in tensions. Investors should wait and see rather than bet on de-escalation, given that tensions will escalate anew over the medium and long term and therefore may never really decline. Iran And Oil Price Volatility Biden’s other foreign policy challenges in the second quarter hinge on Iran and Russia. The Biden administration aims to restore the 2015 Iranian nuclear deal and is likely to move quickly. This is not merely a matter of intention but of national capability since US grand strategy is pushing the US to shift focus to Asia Pacific, and an Iranian nuclear crisis divides US attention and resources. Biden has the ability to return to the 2015 deal with a flick of his wrist. The Iranians also have that ability, at least until lame duck President Hassan Rouhani leaves office in August – beyond that, a much longer negotiation would be necessary. US-Iran talks will lead to demonstrations of credible military threats, which means that geopolitical attacks and tensions in the Middle East will likely go higher before they fall on any deal. The past several years have already seen a series of displays of military force by the Iranians and the US and its allies and this process may escalate all summer (Map 1). Map 1Military Incidents In Persian Gulf Since Abqaiq Refinery Attack, 2019
Second Quarter Outlook 2021: Geopolitics Upsets The "Return To Normalcy"
Second Quarter Outlook 2021: Geopolitics Upsets The "Return To Normalcy"
It is too soon to draw conclusions regarding the Israeli election on March 23 but it is possible that Prime Minister Benjamin Netanyahu will remain in power (Chart 6). If this is the case then Israel will oppose the American effort to rejoin the Iranian nuclear deal, culminating in a crisis sometime in the summer (or fall) in which the Israelis make a major show of force against Iran. Even if Netanyahu falls from power, the new Israeli government will still have to show Iran that it cannot be pushed around. Fundamentally, however, a change in leadership in Israel would bring the US and Israel into alignment and thus smooth the process for a deal that seeks to contain Iran’s nuclear program at least through 2025. Any better deal would require an entirely new diplomatic effort. Chart 6Israeli Ruling Coalition Share Of Knesset Shares In Recent Elections
Second Quarter Outlook 2021: Geopolitics Upsets The "Return To Normalcy"
Second Quarter Outlook 2021: Geopolitics Upsets The "Return To Normalcy"
The Russians or Saudi Arabians might reduce their oil production discipline once a deal becomes inevitable, so as not to lose market share to Iranian oil that will come back onto global markets. Thus oil markets could face unexpected oil supply outages due to conflict followed by OPEC or Iranian supply increases, implying that prices will be volatile. Our Commodity & Energy Strategy expects prices to average $65/barrel in 2021, $70/barrel in 2022, and $60-$80/barrel through 2025. Bottom Line: Oil prices will be volatile in the second quarter as they may be affected by the twists and turns of US-Iran negotiations, which may not reach a new equilibrium until July or August at earliest. Otherwise a multi-year diplomatic process will be required, which will suck away the Biden administration’s foreign policy capital, resulting either in precipitous reduction in Middle East focus or a neglect of greater long-term challenges from China and Russia. Russian Risks, Germany Elections, And Scottish Independence European politics are more stable than elsewhere in the world – marked by Italy’s sudden formation of a technocratic unity government under Prime Minister Mario Draghi. Draghi is focused on using EU recovery funds to boost Italian productivity and growth. Europe’s economic growth has underperformed that of the US so far this year. The EU is not witnessing the same degree of fiscal stimulus as the US (Chart 7). The core member states all face a fiscal drag in the coming two years and meanwhile the bloc has struggled to roll out COVID-19 vaccines efficiently. However, the vaccines are proven to be effective and will eventually be rolled out, so investors should buy into the discount in the euro and European stocks as a result of the various mishaps. Global and European industrial production and economic sentiment are bouncing back and German yields are rising albeit not as rapidly as American (Chart 8). Chart 7EU Stimulus Lags But Targets Productivity
Second Quarter Outlook 2021: Geopolitics Upsets The "Return To Normalcy"
Second Quarter Outlook 2021: Geopolitics Upsets The "Return To Normalcy"
Chart 8Global And Euro Area Production To Accelerate
Global And Euro Area Production To Accelerate
Global And Euro Area Production To Accelerate
Chart 9German Conservatives Waver in Polls
German Conservatives Waver in Polls
German Conservatives Waver in Polls
The main exceptions to Europe’s relative political stability come from Germany and Scotland. German Chancellor Angela Merkel is a lame duck and her party is falling in opinion polls with only six months to go before the general election on September 26 (Chart 9). Merkel even faced the threat of a no-confidence motion in the Bundestag this week due to her attempt to extend COVID lockdowns over Easter and sudden retreat in the face of a public backlash. Merkel apologized but her party is looking extremely shaky after recent election losses on the state level. The rise of a new left-wing German governing coalition is much more likely than the market expects. The second quarter will see the selection of a chancellor-candidate for her Christian Democratic Union and its Bavarian sister party the Christian Social Union. Table 1 highlights the likeliest chancellor-candidates of all the parties and their policy stances, from the point of view of whether they have a “hawkish,” hard-line policy stance or “dovish,” easy policy stance on the major issues. What stands out is that the entire German political spectrum is now effectively centrist or dovish on monetary and fiscal policy following the lessons of the 13 years since the global financial crisis. Table 1German Chancellor Candidates, 2021
Second Quarter Outlook 2021: Geopolitics Upsets The "Return To Normalcy"
Second Quarter Outlook 2021: Geopolitics Upsets The "Return To Normalcy"
In other words, while Germany’s conservatives will seek an earlier normalization of policy in the wake of the crisis, none of them are as hawkish as in the past, and an election upset would bring even more dovish leaders into power. Thus the German election is a political risk but not a global market risk. It should not fundamentally alter the trajectory of German equities or bond yields – which is up amid global and European recovery – and if anything it would boost the euro. The potential German chancellor candidates show more variation when it comes to immigration, the environment, and foreign policy. Germany has been leading the charge for renewable energy and will continue on that trajectory (Chart 10). However it has simultaneously pursued the NordStream II natural gas pipeline with Russia, which would bring 55 billion cubic meters of natural gas straight into Germany, bypassing eastern Europe and its fraught geopolitics. This pipeline, which could be completed as early as August, would improve Germany’s energy security and Russia’s economic security, which remain closely intertwined despite animosity in other areas (Chart 11). But the pipeline would come at the expense of eastern Europe’s leverage – and American interests – and therefore opposition is rising, including among the ascendant German Green Party. Chart 10Germany’s Switch To Renewables
Second Quarter Outlook 2021: Geopolitics Upsets The "Return To Normalcy"
Second Quarter Outlook 2021: Geopolitics Upsets The "Return To Normalcy"
Chart 11Germany Puts Multilateralism To The Test
Second Quarter Outlook 2021: Geopolitics Upsets The "Return To Normalcy"
Second Quarter Outlook 2021: Geopolitics Upsets The "Return To Normalcy"
Chart 12UK-EU Trade Deal Dampens Scots Nationalism
UK-EU Trade Deal Dampens Scots Nationalism
UK-EU Trade Deal Dampens Scots Nationalism
While Merkel and the Christian Democrats are dead-set on completing the pipeline, global investors are underrating the possibility of a major incident in which the US uses diplomacy and sanctions to halt the project. This is not intuitive because Biden is focused on restoring the US alliance with Europe, particularly Germany. But he is doing so in order to counter Russian and Chinese authoritarianism. Therefore the pipeline could mark the first real test of Biden’s – and Germany’s – understanding of multilateralism. Importantly the US is not pursuing a diplomatic “reset” with Russia at the outset of Biden’s term. This has now been confirmed with Biden’s accusation that Russian President Vladimir Putin is a “killer” and the ensuing, highly symbolic Russian withdrawal of its ambassador to the United States, unseen even in the Cold War. The Americans are imposing sanctions in retaliation for Russia’s alleged interference in the 2016 and 2020 elections. Russia is largely inured to US sanctions at this point but if the US wanted to make a difference it would insist on a stop to NordStream by cutting off access to the US market to the various European engineering and insurance companies critical to construction.3 Yet German leaders would have to be cajoled and it may be more realistic for the US to demand other concessions from Germany, particularly on countering China. The US-German arrangement will go a long way toward defining Germany’s and the EU’s risk appetite in the context of Biden’s proposal to build a more robust democratic alliance to counter revisionist authoritarian states. The Russians say they want to avoid a permanent deterioration in relations with the US, which they warn is on the verge of occurring. There is some space for engagement, such as on restoring the Iran deal, which Russia ostensibly supports. Biden may want to keep Russia pacified until he has an Iranian deal in hand. Ultimately, however, US-Russian relations are headed to new lows as the Biden administration brings counter-pressure on the Russians in retribution for the past decade of actions to undermine the United States. Germany’s place in this conflict will determine its own level of geopolitical risk. Clearly we would favor German assets over those of emerging Europe or Russian in this environment. One final risk from Europe is worth mentioning for the second quarter: the UK and Scotland. Scottish elections on May 6 could enable the Scottish National Party to push for a second independence referendum. So far our assessment is correct that Scottish independence will lose momentum after Prime Minister Boris Johnson’s post-Brexit trade deal with the European Union. Scottish nationalists are falling (Chart 12) and support for independence has dropped back toward the 45% level where the 2014 referendum ended up. Nevertheless elections can bring surprises and this narrative bears vigilance as a threat to the pound’s sharp rebound. Bottom Line: Europe’s relative political stability is challenged by US-Russia geopolitical tensions, the higher-than-expected risk of a German election upset, and the tail risk of Scottish independence. Of these only a US-Russia blowup, over NordStream or other issues, poses a major downside risk to global investors. We continue to underweight EM Europe and Russian currency and financial assets. Investment Takeaways Our three key views for 2021, in addition to coordinated monetary and fiscal stimulus, are largely on track for the year so far: China’s Headwinds: China’s renminbi and stock market are indeed suffering due to policy tightening and US geopolitical pressure. Risk to our view: if Biden and Xi make major compromises to reengage, and Xi eases monetary and fiscal policy anew, then the global reflation trade and Chinese equities will receive another boost. US-Iran Triggered Oil Volatility: The US and Iran are still in stalemate and the window of opportunity for a quick restoration of the 2015 deal is rapidly narrowing. Tensions are indeed escalating prior to any resolution, which would come in the third quarter, thus producing first upside then downside pressures for oil prices. Risk to our view: the Biden administration has no need for a new Iran deal and tensions escalate in a major way that causes a major risk premium in oil prices and forces the US to downgrade its pressure campaign against China. Europe’s Outperformance: So far this year the dollar has rallied and the EU has botched its vaccine rollout, challenging our optimistic assessment of Europe. But as highlighted in this report, we anticipated the main risks – government change in Germany, a Scots referendum – and the former is positive for the euro while the downside risk to the pound is contained. The major geopolitical problem is Russia, where we always expected substantial market-negative risks to materialize after Biden’s election. Risk to our view: A US-Russian reset that lowers geopolitical tensions across eastern Europe or a German status quo election followed by a tightening of fiscal policy sooner than the market expects. Matt Gertken Vice President Geopolitical Strategy mattg@bcaresearch.com Footnotes 1 For an excellent recent review of the issues see Danny Crichton, Chris Miller, and Jordan Schneider, "Labs Over Fabs: How The U.S. Should Invest In The Future Of Semiconductors," Foreign Policy Research Institute, March 2021, issuu.com. 2 Alex Fang, "US Congress pushes $100bn research blitz to outcompete China," Nikkei Asia, March 23, 2021, asia.nikkei.com. In anticipation of the Biden administration’s dual attempt to promote, on one hand, innovation, and on the other hand, semiconductor supply security, the US semiconductor giant Intel has announced that it will build a $20 billion chip fabrication plant in Arizona. This is in addition to TSMC’s plans to build a plant in Arizona manufacturing chips that are necessary for the US Air Force’s F-35 jets. See Kif Leswing, "Intel is spending $20 billion to build two new chip plants in Arizona," CNBC, March 23, 2021, cnbc.com. 3 See Margarita Assenova, "Clouds Darkening Over Nord Stream Two Pipeline," Eurasia Daily Monitor 18:17 (2021), Jamestown Foundation, February 1, 2021, Jamestown.org. Appendix: GeoRisk Indicator China
China: GeoRisk Indicator
China: GeoRisk Indicator
Russia
Russia: GeoRisk Indicator
Russia: GeoRisk Indicator
UK
UK: GeoRisk Indicator
UK: GeoRisk Indicator
Germany
Germany: GeoRisk Indicator
Germany: GeoRisk Indicator
France
France: GeoRisk Indicator
France: GeoRisk Indicator
Italy
Italy: GeoRisk Indicator
Italy: GeoRisk Indicator
Canada
Canada: GeoRisk Indicator
Canada: GeoRisk Indicator
Spain
Spain: GeoRisk Indicator
Spain: GeoRisk Indicator
Taiwan
Taiwan: GeoRisk Indicator
Taiwan: GeoRisk Indicator
Korea
Korea: GeoRisk Indicator
Korea: GeoRisk Indicator
Turkey
Turkey: GeoRisk Indicator
Turkey: GeoRisk Indicator
Brazil
Brazil: GeoRisk Indicator
Brazil: GeoRisk Indicator
Section III: Geopolitical Calendar
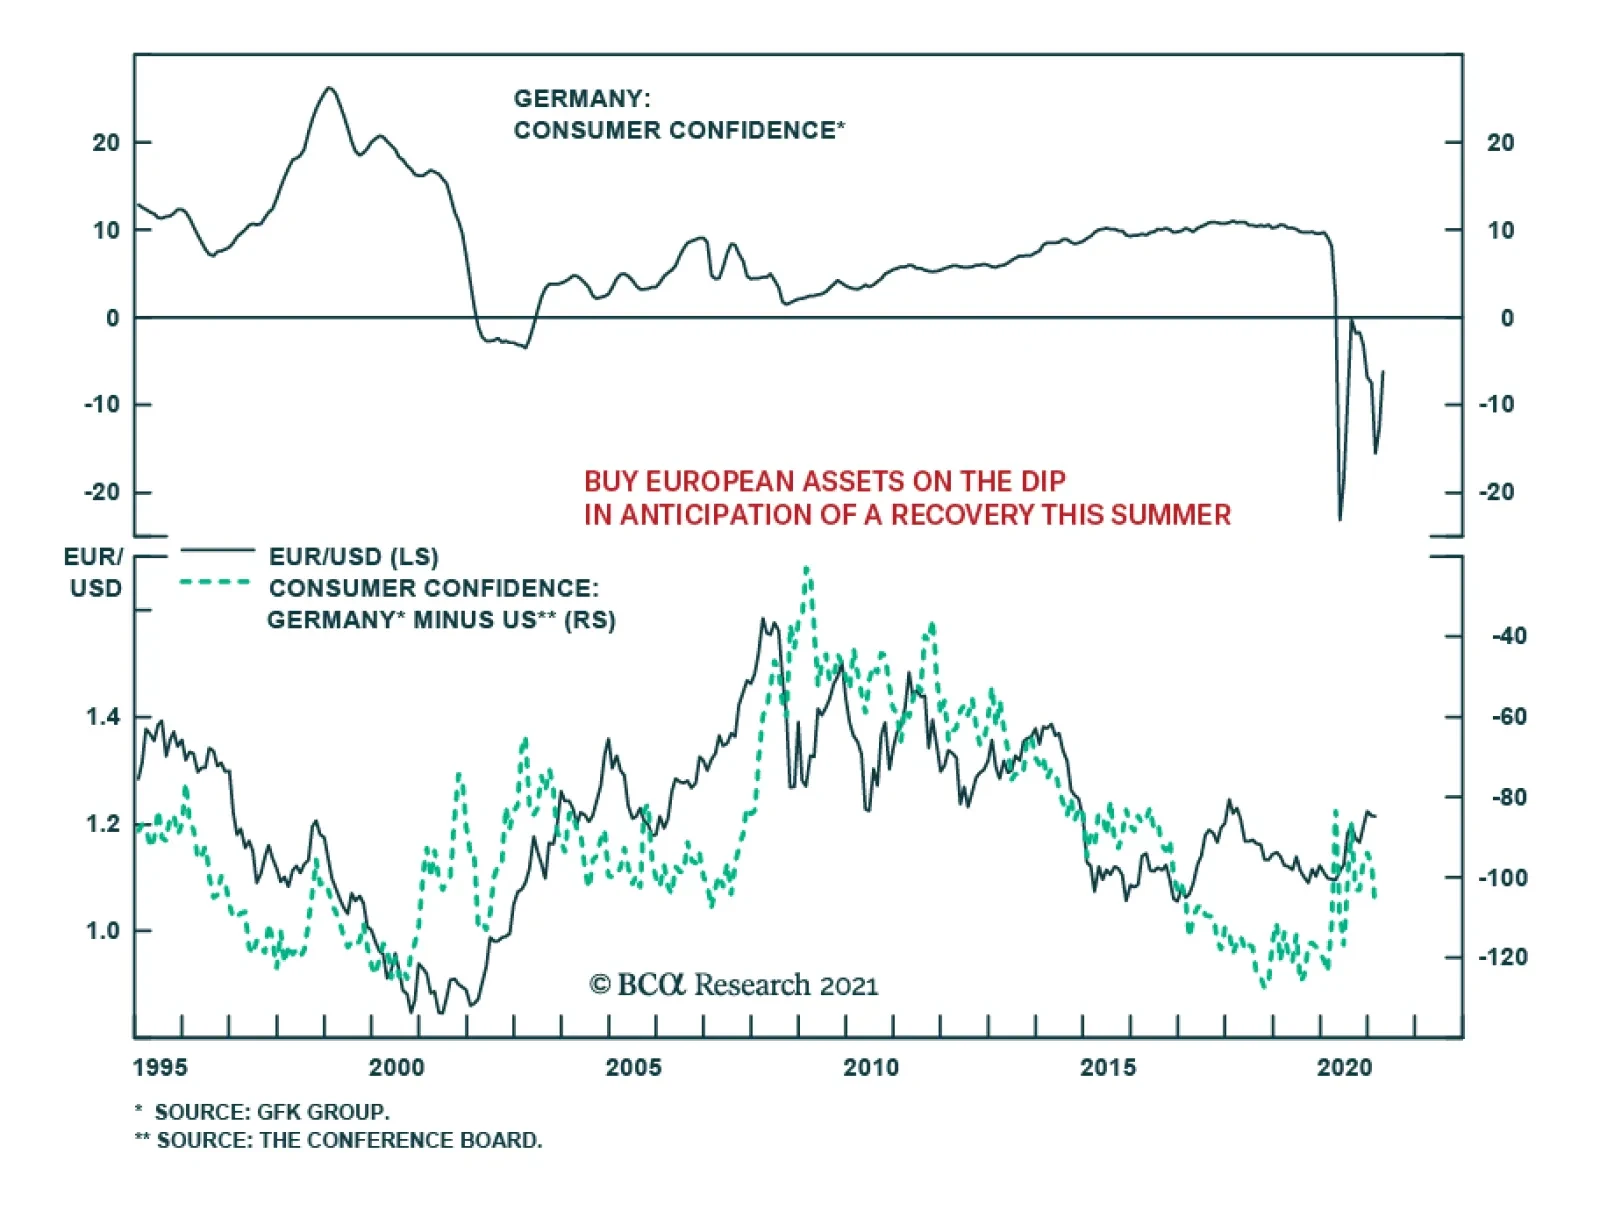
European sentiment is improving. The GfK survey in Germany rebounded from -12.7 to -6.2 in April, the highest level since November. This progress came on the back of a surge in income expectations, which hit a 12-month high, and also helped the survey’s…
Dear Client, Dhaval Joshi has started publishing the new BCA Research Counterpoint product, in which he will continue to apply his unique process to dig up original investment opportunities around the globe. I trust many of you will continue to read Dhaval’s excellent and thought-provoking work. I also hope to keep your readership as I take the helm of the European Investment Strategy product, where I will apply BCA’s time-tested method which emphasizes analysis of global liquidity and economic trends to forecast European market outcomes. Thank you for your continued trust and support. Best regards, Mathieu Savary Highlights The Eurozone’s economy lags the US’s because of weakness in the service sector. Poor vaccine rollouts and tighter fiscal policy explain this bifurcated outcome. Even though Europe will continue to trail the US this year, the summer period will see a sharp European recovery. Investors can take advantage of this rebound by buying the cyclical equities that have lagged during last year’s rally. Favor the French, Italian and Spanish equity markets over the German and Dutch markets. The Bank of England does not need to fight rising Gilt yields; favor the pound over the euro as the UK-German spread widens. The Norges Bank will be the first G-10 central bank to lift rates, which will hurt EUR/NOK. Fade any hawkish noise coming from the German election season. Feature The service sector constitutes the biggest drag on the Eurozone’s economy, which will cause European growth to trail that of the US further. The euro area’s fundamental problem is that it lags the US significantly on both vaccination and fiscal stimulus fronts. Nonetheless, by the summer, the European service sector will start catching up, which will favor a basket of sectors exposed to the economic re-opening that have lagged until now. The Service Sector Remains Under The Weather The consensus is correct to expect European growth to lag that of the US in 2021, even if the extent of the shortfall does not hit the 4% currently penciled in by Bloomberg. Chart 1The Service Sector Is the Problem
The Service Sector Is the Problem
The Service Sector Is the Problem
Unlike normal business cycles, the service sector is now Europe’s biggest handicap, while the manufacturing sector is performing in line with that of the US (Chart 1, top panel). On both sides of the Atlantic, industrial activity has benefited from the same set of positives in recent quarters. Goods purchases were the only outlet for pent-up demand built up in the first and second quarter of 2020. Extraordinarily accommodative global liquidity conditions and record-low interest rates boosted spending on big-ticket items, especially in light of the housing boom that has engulfed the globe. Finally, China’s rapid recovery fueled a swift rebound in the demand for natural resources, autos and machinery that benefited manufacturers the world over. Service activity did not enjoy a similar unified tailwind. Consequently, while the US Services PMI stands at a seven-year high, the Eurozone’s lingers at 45.7, in contraction territory (Chart 1, middle panel). The weaker confidence of European households sheds light on this bifurcated performance (Chart 1, bottom panel). Health and fiscal policies are the main headwinds in the Eurozone that have hurt its service sector and hampered the mood of its households, at least compared to the US. With regard to health policy, the poor vaccination rates on the European continent create the greatest problem. The vaccination effort has only reached 11.8, 11.1, 11.9 and 12.5 doses per 100 person in Germany, France, Italy and Spain respectively. In the US and the UK, authorities have already delivered more than 30 doses per 100 person (Chart 2). As a result, while infection and death per capita are rapidly declining in the US and in the UK, mortality is once again rising in France as well as in Italy and caseloads are increasing there and in Germany. Moreover, hospitalization rates and ICU usage in France, Germany, Italy or Portugal are once again trending up, and in some cases they are hitting threatening levels for the healthcare system. In response to these COVID-19 dynamics, governments in many major Eurozone countries are resorting to the re-imposition of restrictions. Italy has announced new lockdowns in half of its 20 regions while France just entered its third lockdown over the weekend. By contrast, the stringency of restrictions is set to ease in the UK and the US. In the US, limitations were already imposed or followed more laxly relative to the euro area (depending on the state) and mobility was improving (Chart 3). Chart 2Slow Vaccination In The Eurozone
Slow Vaccination In The Eurozone
Slow Vaccination In The Eurozone
Chart 3The Stringency Of Lockdowns Matter
The Stringency Of Lockdowns Matter
The Stringency Of Lockdowns Matter
Despite the lower mobility created by stricter restrictions in the Eurozone, the US government has opened the fiscal tap much more aggressively than European governments (Chart 4). Since the beginning of the crisis, the US fiscal help has reached 25% of GDP, while in Italy, Germany, France or Spain the budget deficits have swelled by a more modest 14%, 10%, 9% and 13% of GDP, respectively. True, European governments have also offered credit guarantees totaling EUR3 trillion euros, but these sums only have a very indirect impact on aggregate demand and should mostly be understood as liquidity insurance to prevent a liquidity crisis from morphing into a solvency crisis. Chart 4Tight Fists On The Continent
Summer Of ‘21
Summer Of ‘21
For the remainder of 2021, European fiscal policy is unlikely to be eased compared to the US. BCA Research’s Geopolitical strategy team anticipates the Biden government to add a further $2 trillion dollars of spending by the end of 2021, mostly in the form of long-term and infrastructure outlays, in addition to the $1.9 trillion recently legislated.While the European Union’s NGEU plan is an important step in the integration of European fiscal policy, its generous EUR750 billion envelope will be disbursed over five years. This implies a debt-based fiscal expansion of 1% per annum between 2021 and 2024 (the years of maximum disbursements). Individual state plans are also limited. Bottom Line: The European economy is lagging the US economy because of the inferior performance of its service sector. This disadvantage is the consequence of both a slower vaccine rollout that is negatively impacting mobility and a much more timid fiscal policy. Relief Is On Its Way The Eurozone’s service sector and domestic economic performance is nonetheless set to improve, despite the current health and fiscal policy deficiencies. First, the economy continues to adapt to its new socially distanced form. In the second quarter of 2020, the imposition of lockdowns caused the euro area’s quarterly GDP to collapse by 11%. The contribution to GDP of the retail, wholesale, artistic, entertainment, and hospitality sectors tumbled to -7.3%. In Q4 2020, as European governments were imposing equally stringent lockdowns, quarterly GDP growth fell to -0.1% and the contribution to growth of the same sectors only hit -0.54%. Second, the continental vaccination campaign is progressing. It is easy to worry that it will take a very long time to vaccinate the entire population, but the main reason to impose lockdowns is to preserve capacity in the healthcare system. Thus, the priority is to inoculate 50-year olds and above because they constitute 90% of hospitalizations. Through this aperture, even if the pace of vaccination remains tepid in Europe, the goal to decrease economic restrictions can reasonably be achieved by summer. Moreover, with Pfizer’s logistical issues corrected, the pace of vaccination can accelerate. Concerns remain over the population’s willingness to receive the vaccines, but these issues will fade as well. The current worries surrounding the AstraZeneca vaccines provide an example. The incidence of thromboembolic events is marginally higher than for the general population and the European Medicines Agency deemed the AstraZeneca vaccines safe, especially in light of the human costs of the disease it prevents. As caseloads and mortality rates decline in Israel, the UK and the US, even French elderlies will become more willing to receive their vaccines. Table 1Parsimonious But Constant Fiscal Stimulus…
Summer Of ‘21
Summer Of ‘21
Third, fiscal policy will remain easy. True, European government support is tepid compared to the US, but the continual drip of new policy measures shows that authorities are not intransigent (Table 1). In all likelihood, the various furlough and employment protection schemes implemented since the spring of 2020 are likely to remain in place this year even if lockdowns decrease. Their impact on employment was major and they contributed meaningfully to preserve household income (Chart 5). Finally, COVID-19 is a seasonal illness and summer is on its way in Europe. The experience of 2020, when vaccines and testing were much more limited than they are today, has taught us that in the summer months, this coronavirus spreads much less. Therefore, seasonal patterns will allow a relaxation of social distancing measures. Chart 5Furloughs Played A Crucial Role
Summer Of ‘21
Summer Of ‘21
In this context, service activity in the Eurozone will improve, which will boost GDP. European households, like their US counterparts, have accumulated significant excess savings (Chart 6). Furthermore, global manufacturing activity will remain robust, which will support employment and household income in the Eurozone. Hence, consumer confidence will improve and some of the EUR300 billion in excess savings will make its way into the economy. The service sector should be the prime beneficiary of this money because households have already fulfilled a large proportion of their pent-up demand for goods. What they now want to do is to go out, go to restaurants and spend their income on experiences. The rebound in the contribution to GDP of the retail and recreation sectors will be accretive to job and household income, unleashing a virtuous circle of activity (Chart 7). Chart 6European Are Building Their Nest Egg too
European Are Building Their Nest Egg too
European Are Building Their Nest Egg too
Chart 7Services Will Contribute Again to Growth
Services Will Contribute Again to Growth
Services Will Contribute Again to Growth
Bottom Line: In 2021, the euro area’s economy will further lag that of the US, but investors should nonetheless expect a robust uptick in service activity this summer. How To Play The Summer Recovery? Chart 8Buy The Laggards / Sell the Leaders
Summer Of ‘21
Summer Of ‘21
Five weeks ago, BCA Research’s US Equity Sector Strategy service designed a strategy to buy the laggards within a basket of sectors that should benefit from the recovery while selling the “back-to-work” stocks that had already priced in that recovery. This recommendation protects investors against potential hiccups in the re-opening trade and is simple to implement: sell/underweight the pro-cyclical sectors that stand above their February 19 relative peak and buy/overweight those that remain below their relative highs (Chart 8). In the Eurozone context, this strategy involves focusing on the cyclical sectors, and buying/overweighting these cyclical stocks that stand below their pre-COVID high relative to the MSCI benchmark while selling/underweighting those that have punched above this threshold. Chart 9 illustrates the sectors to favor and the ones to avoid using this methodology. In essence, not only should the “laggards” baskets experience a catch up in earnings, but also, the shift in sentiment should prompt a re-rating of relative valuations (Chart 10). Chart 9Who Are the Laggards And the Leaders?
Summer Of ‘21
Summer Of ‘21
This strategy makes sense beyond the COVID-19 dynamics. From a global perspective, the basket of sectors purchased (the laggards”) outperforms the former “leaders” after global bond yields increase (Chart 11, top panel). This relationship reflects the heavy representation of financials in the “laggards” basket while tech and the interest rates-sensitive automobile sector are key constituents of the “leaders” basket. Additionally, the former “leaders” are more exposed to the Chinese business cycle than the “laggards". Chart 10Relative Valuations will Adjust
Relative Valuations will Adjust
Relative Valuations will Adjust
Chart 11Macro Forces Favor The Laggards over the Leaders
Macro Forces Favor The Laggards over the Leaders
Macro Forces Favor The Laggards over the Leaders
The deceleration in the Chinese economy is a problem for the “leaders” relative performance (Chart 11, bottom panel). China’s credit impulse has rolled over as Beijing aims to prevent excess speculation in the real estate sector. Moreover, a regulatory tightening is taking place in the Middle Kingdom, which will further slow its economy. Already, the new orders-to-inventories ratio from the NBS PMI reflects the downside risk for the Chinese economy, which highlights the threat to the previous high-flying leaders. A strategy that favors the former “laggards” at the expense of the previous “leaders” also has implications for geographical allocation within euro area equities. As Table 2 shows, Italy, France and Spain over represent the “laggards” in their national benchmarks while the Netherlands and Germany overweight the “leaders”. On a net basis, the tech-heavy Netherlands is the country to avoid, with a 27% relative underweight for the “laggards”, while Spain and Italy should be favored, with their 24% and 22% overweight in the “laggards” relative to the “leaders”. Spain and Italy in particular will also benefit from a further narrowing in sovereign spreads that will boost the performance of their financial sector while the re-opening of trade continues. Additionally, investors should favor France at the expense of Germany. Table 2France, Italy, and Spain Over The Netherlands And Germany
Summer Of ‘21
Summer Of ‘21
Bottom Line: The economic re-opening favors the Eurozone cyclicals that still trade below their February 19 2020 relative highs as the expense of those cyclicals that have already overtaken their pre-COVID peaks. This means buying/overweighting the Banks, Insurance, Energy and Aerospace & Defense sectors at the expense of the IT, Automobiles and Building products sectors. It also implies a preference for Italian and Spanish equities, especially relative to Dutch equities. Country Focus: The BoE Follows the Fed, Not The ECB Last Thursday, the Bank of England followed in the Fed’s footprints, not the ECB’s. The BoE refrained from adding to its asset purchases, even if this year, 10-year Gilt yields are rising in line with the Treasuries and rapidly outpacing Bund yields. However, the BoE remains committed to keeping short rates at record lows and it keeps the window open for rate cuts if economic conditions ever warrant it. We agree with the Bank of England that the UK’s economic outlook has improved in recent months. The extension of both the furlough schemes and tax holidays, along with the rapid pace of vaccination in the British Islands point to robust growth in the coming quarters. Nonetheless, the picture is not without blemish. Specifically, the UK’s exports to the EU are collapsing in wake of Brexit. Moreover, the pace of vaccination in the UK is set to slow a bit over the coming months. These risks to the outlook are unlikely to topple the economy, because the vigor of the UK’s housing market is an important support to domestic demand. While the UK’s labor market remains frail, the strength of the RICS housing survey suggests that real wages will stay well bid (Chart 12). The increase in household income will cause consumption to accelerate sharply once lockdowns are eased. This could accentuate inflationary pressures this year, and cause inflation over the next few years to trend higher relative to the euro area. Chart 12UK Real Wages Have Upside
UK Real Wages Have Upside
UK Real Wages Have Upside
With this economic backdrop, the market’s pricing of the SONIA curve is appropriate. Over the past month, the OIS curve has steepened significantly (Chart 13). The BoE is comfortable with that pricing and considers the back up in interest rates to be reflective of stronger growth and not constraining of activity. In fact, financial conditions are roughly unchanged since the MPC’s last meeting, which highlights that rising risk asset prices have compensated for an appreciating pound and rising gilt yields. Chart 13SONIA Is Climbing Up, And The BoE Is Fine With It
SONIA Is Climbing Up, And The BoE Is Fine With It
SONIA Is Climbing Up, And The BoE Is Fine With It
Bottom Line: The SONIA curve will continue to shift higher relative to the EONIA curve. Consequently, the spread between Gilt and Bund yields will widen further and EUR/GBP will depreciate more over the coming six to nine months, especially because the pound keeps trading at a discount. Moreover, thanks to their domestic focus and lower sensitivity to the pound, UK mid-cap and small-cap stocks will outperform the FTSE-100. Country Focus: Norges Bank, First Out Of The Gate Chart 14The Norges Bank Will Raise Rates First
The Norges Bank Will Raise Rates First
The Norges Bank Will Raise Rates First
Last Thursday, Governor Øystein Olsen indicated that the Norges Bank would increase interest rates from zero later this year, which validates the message of the Norwegian swap curve. Looking at economic fundamentals, investors should not bet against this outcome. BCA’s Central Bank Monitor confirms that the Norges Bank will be the first central bank in the West to lift interest rates (Chart 14). It is the only one of our Monitors in “Tight Money Required” territory. The message from our Norges Bank Monitor reflects the prompt recovery of the Norwegian economy. Thanks to rebounding Brent prices and rapidly expanding production at the new Johan Sverdrup oil field (the largest in the North Sea), Norwegian nominal exports are growing at a double-digit pace. Meanwhile Norwegian retail sales are increasing at a 16% annual rate. Beyond some near-term COVID worries, consumer spending will remain robust because the strong employment component of the PMI points to solid job gains and a rapidly rising consumer confidence. Finally, Norwegian inflation is already above the central bank’s target of 2%, with core CPI at 2.05% and headline inflation at 3.3%. Chart 15A Weaker EUR/NOK ahead
A Weaker EUR/NOK ahead
A Weaker EUR/NOK ahead
Thanks to Norway’s economic performance, the krone remains one of the favorite currencies of BCA’s Foreign Exchange Strategy service. The global economic environment creates additional tailwind for the NOK. A continued global economic recovery will allow oil prices to rise further on a 12- to 18-month basis, which should lead to a weaker EUR/NOK (Chart 15). In a similar vein, the NOK is particularly sensitive to the USD dollar’s fluctuations. As a result, BCA’s negative cyclical stance toward the USD will create an important support for the NOK, even if the greenback’s countertrend bounce could last another quarter or so. Finally, along with the SEK, the NOK is the cheapest pro-cyclical currency in the G10, trading at a 5% discount to its fair value. Thus, the Norwegian krone should benefit greatly from continued risk taking this year. Bottom Line: The Norwegian krone remains one of the most attractive currencies in the world. The status of the Norges Bank as the front-runner to lift rates this year only amplifies the NOK’s appeal. A Few Words On Germany’s State Elections Chart 16German Party Polling
German Party Polling
German Party Polling
The defeat of Angela Merkel’s CDU party in the states of Baden-Wurttemberg and Rhineland-Palatinate highlights that the German electorate is moving slowly to the left. According to BCA’s Geopolitical Strategy Service, it is too early to tell whether a left-wing coalition will take power in Germany this fall. However, the marginal shift toward the SPD and the Green Party indicates that even the CDU will have to listen to the median voter’s demands (Chart 16). Practically, this means that German politics will push for more European integration and that ultimately, more fiscal stimulus will materialize in Europe over the coming years. As a result, investors should fade any hit to the euro or European assets caused by hawkish sounds made by CDU potential leaders during the campaign for the September federal election. Mathieu Savary, Chief European Investment Strategist Mathieu@bcaresearch.com Cyclical Recommendations Structural Recommendations Trades Closed Trades Currency Performance
Summer Of ‘21
Summer Of ‘21
Fixed Income Performance Government Bonds
Summer Of ‘21
Summer Of ‘21
Corporate Bonds
Summer Of ‘21
Summer Of ‘21
Equity Performance Major Stock Indices
Summer Of ‘21
Summer Of ‘21
Geographic Performance
Summer Of ‘21
Summer Of ‘21
Sector Performance
Summer Of ‘21
Summer Of ‘21
Highlights The Federal Reserve’s ultra-dovish stance is not the only reason for markets to cheer. The US is booming, China is unlikely to overtighten monetary and fiscal policy, and Europe remains a source of positive political surprises. Still, the cornerstone of this cycle’s wall of worry has been laid: Biden faces a series of foreign policy challenges, the US is raising taxes, China is tightening policy, and Europe’s stimulus is not large enough to qualify as a game changer for potential GDP growth. Stay the course by maintaining strategic pro-cyclical trades yet building up tactical hedges and safe-haven plays. Feature Chart 1US Stimulus, Chinese Tightening, German Vaccine Hiccups
US Stimulus, Chinese Tightening, German Vaccine Hiccups
US Stimulus, Chinese Tightening, German Vaccine Hiccups
The US is turning to tax hikes, China is returning to structural reforms, and Europe is bungling its vaccine rollout. Yet synchronized global debt monetization is nothing to underrate. Especially not in the context of a Great Power struggle that features a green energy race as well as a high-tech race. Governments are generating a cyclical growth boom and it is conceivably that their simultaneous pump-priming combined with a new capex cycle and private innovation could generate a productivity breakthrough. This upside risk is keeping global equity markets bullish even as it becomes apparent that construction has begun on this cycle’s wall of worry. The US dollar bounce should be watched closely in this context (Chart 1). After passing the $1.9 trillion American Rescue Plan Act, which consists largely but not entirely of short-term cash handouts (Chart 2), President Joe Biden’s policy agenda will now turn to tax hikes. Thus far the tax hike proposals are in line with Biden’s campaign literature (Table 1). It remains to be seen whether the market will “sell the news” that Biden is pivoting to tax hikes. After all, Biden was the most moderate of the Democratic candidates and his tax proposals only partially reverse President Trump’s tax cuts. Chart 2American Rescue Plan Act
Building Back … The Wall Of Worry
Building Back … The Wall Of Worry
Table 1Biden’s Tax Hike Proposals On The Campaign Trail
Building Back … The Wall Of Worry
Building Back … The Wall Of Worry
Nevertheless higher taxes symbolize a regime change in the US – it is very unlikely tax rates will go down anytime soon but they could go easily higher than expected in the coming decade – and the drafting process will bring negative surprises, as Treasury Secretary Janet Yellen highlighted by courting Europe to cooperate on a 12% minimum corporate tax and halt the global race to the bottom in taxes on multinational corporations. At the same time Biden’s foreign policy challenges are rising across the board: China is demanding a rollback of Trump’s policies: If Biden says yes, he will sacrifice hard-won American leverage on matters of national interest. If he says no, the Phase One trade deal will be null and void, as will sanctions on Iran and North Korea, and the new economic sanctions on Taiwan will expand beyond mere pineapples.1 Russia is recalling its US ambassador: Biden vowed to make Russia pay for alleged interference in the 2020 US election and sanctions are forthcoming.2 The real way to make Russia pay is to halt the construction of the Nordstream II natural gas pipeline, which reduces the leverage of eastern European democracies while increasing Germany’s energy dependence on Russia. But Germany is dead-set on that pipeline. If Biden levies sanctions the centerpiece of his diplomatic outreach to Europe will be further encouraged to chart an independent course from Washington (though the rest of Europe might cheer). North Korea is threatening to restart missile tests: North Korea is pouring scorn on the Biden administration for trying to restart negotiations.3 The North wants sanctions relief and it knows that Biden is willing to offer it but it may need to create an atmosphere of crisis first. China would be happy were that to happen as it could offer the US its good services on North Korea instead of concrete trade concessions. Iran is refusing to rejoin negotiations over the 2015 nuclear deal: Biden has about five months to arrange for the US and Iran to rejoin the 2015 nuclear deal. Beyond that he will enter into another long negotiation with the master negotiators, the Persians. But unlike President Obama from 2009-15, he will not have support from Russia and China … unless he sacrifices his doctrine of “extreme competition” from the get-go. It is not clear which of these challenges will be relevant to financial markets, or when. However, with US and global equities skyrocketing, it must be said that the geopolitical backdrop is not nearly as reassuring as the Federal Reserve, which announced on Saint Patrick’s Day that it will not hike interest rates until 2024 even in the face of a 6.5% growth rate and the prospect of an additional, yet-to-be passed $2 trillion in US deficit spending. Herein lies Biden’s first victory. He has stressed that boosting the American economy and middle class is critical to his foreign policy. He envisions the US regaining its global standing by defeating the virus, super-charging the economy, and then orchestrating a grand alliance of European and Asian democracies to write new global rules that will put pressure on China to reform its economy. “I say it to foreign leaders and domestic alike. It's never, ever a good bet to bet against the American people. America is coming back. The development, manufacturing, and distribution of vaccines in record time is a true miracle of science.”4 The pandemic and economic part of this agenda are effectively done and now comes the hard part: creating a grand alliance while China and Russia demonstrate to their neighbors the hard consequences of joining any new US crusade. The contradiction of Biden’s foreign policy is his desire to act multilaterally and yet also get a great deal done. The Europeans are averse to conflict with China and Russia. The Russians and Chinese are not inclined to do any great favors on Iran or North Korea. Nobody is opening up their economy – Biden himself is coopting Trump’s protectionism, if less brashly. Cooperation with Presidents Xi Jinping and Vladimir Putin on nuclear proliferation is possible – as long as Biden aborts his democracy agenda and his trade agenda. We continue with our pro-cyclical investment stance but have started building up hedges as we are convinced that geopolitical risk will deliver a rude awakening. This awakening will be a buying opportunity given the ultra-stimulating backdrop … unless it portends war in continental Europe or the Taiwan Strait. In the remainder of this report we highlight the takeaways from China’s National People’s Congress as well as recent developments in Germany. Our key views remain the same: China will not overtighten monetary/fiscal policy; Biden will be hawkish on China; Germany’s election may see an upset but that would be market-positive. China: No Overtightening So Far China concluded its National People’s Congress – the “Two Sessions” of legislation every year – and issued its 2021 Government Work Report. It also officially released the fourteenth five-year plan covering economic development for 2021-25. Table 2 shows the new plan’s targets as compared to the just expired thirteenth five-year plan that covered 2016-20. Table 2China’s Fourteenth Five Year Plan (2021-25)
Building Back … The Wall Of Worry
Building Back … The Wall Of Worry
For a full run-down of the National People’s Congress we recommend clients peruse BCA’s latest China Investment Strategy report. From a geopolitical point of view we would highlight the following takeaways: The Tech Race: China added a new target for strategic emerging industry value added as percent of GDP – it wants this number to reach 17% by 2025 but there is nothing solid to benchmark this against. The point is that by including such a target China is putting more emphasis on emerging industries, including: information technology, robotics, green energy, electric vehicles, 5G networks, new materials, power equipment, aerospace and aviation equipment, and others. China’s technological “Great Leap Forward” continues, with a focus on domestic production and upgrading the manufacturing sector that is bound to stiffen the competition with the United States. China’s removal of a target for service industry growth suggests that Beijing does not want de-industrialization to occur any faster – another reason for global trade tensions to stay high. Research and Development: For R&D spending, previous five-year plans set targets for the desired level. For example, over the last five years China vowed to increase annual R&D spending to 2.5% of GDP. A reasonable expectation for the coming five years would have been a 3% target of GDP. However, this time the government set a target of an annual growth rate of no less than 7% during 2021-2025. The point is that China is continuing to ascend the ranks in R&D spending relative to the US and West in coordination with the overarching goal of forging an innovative and high-tech economy. Unemployment: China has restored an unemployment rate target. In its twelfth five-year plan Beijing aimed to keep the urban surveyed unemployment rate below 5% but over the past five years this target vanished. Now China restored the target and bumped it up slightly to 5.5%. This target should not be hard to meet given the reported sharp decline in urban unemployment to 5.2% already. However, China’s unemployment statistics are notoriously unreliable. The real takeaway is that unemployment will be higher as trend growth slows, while social stability remains the Communist Party’s ultimate prize – and any reform or deleveraging process will occur within that context. The Green Energy Race: China re-emphasized its pledge to tackle climate change, aiming for peak carbon emissions by 2030 and carbon neutrality by 2060. However, no detailed action plans were mentioned. Presumably China will not loosen its enforcement of existing environmental targets. Most of these were kept the same as over the past five years, except for pollution (PM2.5 concentration). Previously the government sought to reduce PM2.5 concentration by 18%. Now the target is set at 10% aggregate reduction, which is lower, though further reduction will be difficult after a 43% drop since 2014. Overall, China has not loosened up its environmental targets – if anything, enforcement will strengthen, resulting in an ongoing regulatory headwind to “Old China” industries. Military Power: Last week we noted that the government’s goals for the military have changed in a way that reinforces themes of persistently high geopolitical tensions. The info-tech upgrades to the People’s Liberation Army were supposed to be met by 2020, with full “modernization” achieved by 2035. However, last October the government created a new deadline, the one-hundredth anniversary of the PLA in 2027 (“military centenary goal”). No specific measures or targets are given but the point is that there is a new deadline of serious importance – an importance that matches the party’s much-ballyhooed centennial on July 1 of 2021 and the People’s Republic’s centennial in 2049. The fact that this deadline is only six years away suggests that a rapid program of military reform and upgrade is beginning. The official defense spending growth target of 6.8% is only slightly bigger than last year’s 6.6% but these targets mask the significance of the announcement. The takeaway is that the Chinese military is preparing for an earlier-than-expected contingency with the United States and its allies. What about China’s all-important monetary, fiscal, and quasi-fiscal credit targets? There is no doubt that China is tightening policy, as we highlight in our updated China Policy Tightening Checklist (Table 3). But will China overtighten? Probably not, at least not judging by the Two Sessions, but the risk is not negligible. Table 3A Checklist For Chinese Policy Tightening
Building Back … The Wall Of Worry
Building Back … The Wall Of Worry
The government reiterated that money and credit growth should remain in a reasonable range in 2021, with “reasonable range” referring to nominal economic growth. Chinese economists estimate that the nominal growth rate will be around 8%-9% in 2021. The IMF projection is 8.1%, while latest OECD forecast is at 7.8%.5 Because China’s total private credit (total social financing) growth is inherently higher than M2 growth, we would use pre-pandemic levels as our benchmark for whether the government will tighten policy excessively: If total social financing growth plunges below 12%, then our view is disproved and Beijing is over-tightening (Chart 3). If M2 growth plunges below 8%, we can call it over-tightening. Anything above these benchmarks should be seen as reasonable and expected tightening, anything below as excessive. However, the Chinese and global financial markets could grow jittery at any time over the perennial risk of a policy mistake whenever governments try to prevent excessive leverage and bubbles. As for fiscal policy, the new quotas for local government net new bond issuance point to expected rather than excessive tightening. New bonds can be used to finance capital investment projects. The quota for total new bond issuance is 4.47 trillion CNY, down by 5.5% from last year. Though local governments may not use up all of the quota, the reduction is small. In fact, total local government bond issuance will be a whisker higher in 2021 than in 2020. The quota for net new bonds is only slightly below the 2020 level and much higher than the 2019 level. Therefore the chance of fiscal overtightening is small – and smaller than monetary overtightening. Chart 3China Policy Overtightening Benchmark
China Policy Overtightening Benchmark
China Policy Overtightening Benchmark
Chart 4China’s Real Budget Deficit Is Huge
Building Back … The Wall Of Worry
Building Back … The Wall Of Worry
China’s official budget balance is a fiction so we look at the IMF’s augmented net lending and borrowing, which reached a whopping -18.2 % of GDP in 2020. It is expected to decrease gradually to -13.8% by 2025. That level will be slightly higher than the pre-pandemic level from 2017-2019 (Chart 4).6 By contrast, China’s total augmented debt is expected to keep rising in the coming years and reach double the 2015 level by 2025. Efforts to constrain debt could lead to a larger debt-to-GDP ratio if growth suffers as a consequence, as our Global Investment Strategy points out. So China will tighten cautiously – especially given falling productivity, higher unemployment, and the threat of sustained pressure from the US and its allies. US-China: Biden As Trump-Lite Chinese and US officials will convene in Alaska on March 18-19. This is the first major US-China meeting under the Biden administration and global investors will watch closely to see whether tensions will drop. So far tensions have not fallen, highlighting a persistent and once again underrated risk to the global equity rally. Biden’s foreign policy team has not completed its review of China policy and Presidents Biden and Xi Jinping are trying to schedule a bilateral summit in April – so nothing concrete will be decided before then. Chart 5US-China: Beijing's Standing Offer
US-China: Beijing's Standing Offer
US-China: Beijing's Standing Offer
The Biden administration is setting up a pragmatic policy, offering areas to engage with China while warning that it will not compromise on democratic values or national interests. China would welcome the opportunity to work with the Americans on nuclear non-proliferation, namely North Korea and Iran, as this would expend US leverage on an area of shared interest while leaving China a free hand over its economic and technological policies. China at least partially enforced sanctions on these countries in response to President Trump’s demands during the trade war and official statistics suggest it continues to do so. Oil imports from Iran remain extremely low while Chinese business with North Korea is, on paper, nil (Chart 5). If this data is accurate then North Korea’s economy has not benefited from China’s stimulus and snapback. If true, then Pyongyang will offer partial concessions on its nuclear program in exchange for sanctions relief. At the moment, instead of staging any major provocations to object to US-Korean military drills, the North is using fiery language and threatening to restart missile tests. This suggests a diplomatic opening. But investors should be prepared for Pyongyang to stage much bigger provocations than missile tests. In March 2010, while the world focused on the financial crisis, the North Koreans torpedoed a South Korean corvette, the Chonan, and shelled some islands, at the risk of a war. The problem under the Trump administration was that Trump wanted a verifiable and durable deal of economic opening for denuclearization whereas the North Koreans wanted to play for time, reduce sanctions, study the data from their flurry of missile tests during the Obama and early Trump years, and see if Trump would get reelected before offering any concrete concessions. Trump’s stance was not really different from Bill Clinton’s but he tried to accelerate the timeline and go for a big win. By Trump’s losing the election North Korea bought four more years on the clock. Chart 6US-China: Biden Lukewarm On China
Building Back … The Wall Of Worry
Building Back … The Wall Of Worry
The Biden administration is willing to play for time if it gets concrete results in phases. This would keep North Korea at bay and retain a line of pragmatic engagement with Beijing. But if North Korea stages a giant provocation Biden will not hesitate to use threats of destruction like Clinton and Trump did. The American public is not much concerned about North Korea (or Iran) but is increasingly concerned about China, with a recent Gallup opinion poll showing that nearly 50% view China as America’s greatest enemy and Americans consistently overrate China’s economic power (Chart 6). Biden will not let grassroots nationalism run his policy. But it is true that he has little to gain politically from appearing to appease China. With progress at hand on the pandemic and economic recovery, Biden will devote more attention to courting the allies and attempting to construct his alliance of democracies to meet global challenges and to “stand up” to China and Russia. The allies, however, are risk-averse when it comes to confronting China. This is as true for the Europeans as it is for China’s Asian neighbors, who stand directly in its firing line. In fact, Europe’s total trade with China is equivalent to that of the US (Chart 7). The Europeans have said that they will pursue tougher trade enforcement through the World Trade Organization, which would tie the Biden administration’s hands. Biden and his cabinet officials insist that they will use the “full array” of tools at their disposal (e.g. tariffs and sanctions) to punish China for mercantilist trade policies. Chinese negotiators are said to be asking explicitly for Biden to roll back Trump’s policies. Some of these policies relate to trade and tech acquisition, others to strategic disputes. We doubt that Biden will compromise on the trade issues to get cooperation on North Korea and Iran. But he will have to offer major concessions if he wants durable denuclearization agreements on these rogue states. Otherwise it will be clear that his administration is mostly focused on competition with China itself and willing to sideline the minor nuclear aspirants. Our expectation is that Americans care about the China threat and the smaller threats will be used as pretexts with which to increase pressure and sanctions on China. Asian equities have corrected after going vertical, as expected. But contrary to our expectations geopolitics was not the cause (Chart 8). This selloff could eventually create a buying opportunity if the Biden administration is revealed to take a more dovish line on China, trade, and tech in exchange for progress on strategic disputes like North Korea. Any discount due to North Korean provocations in particular would be a buy. On Taiwan, however, China’s new 2027 military target underscores our oft-recited red flag. Chart 7EU Risk Averse On China
EU Risk Averse On China
EU Risk Averse On China
Chart 8Asian Equity Correction And GeoRisk Indicators
Asian Equity Correction And GeoRisk Indicators
Asian Equity Correction And GeoRisk Indicators
Bottom Line: Investors should stay focused on the US-China relationship. What matters is Biden’s first actions on tariffs and high-tech exports. So far Biden is hawkish as we anticipated. Investors should fade rumors of big new US-China cooperation prior to the first Biden-Xi summit. Any major North Korean aggression will create a buy-on-the-dips opportunity. Unless it triggers a war, that is – and the threshold for war is high given the Chonan incident in 2010. Germany: Markets Wake Up To Election Risk – And Smile This week’s election in the Netherlands delivered a fully expected victory to Prime Minister Mark Rutte’s liberal coalition. The German leadership ranks next to the Dutch in terms of governments that received an increase in popular support as a result of the COVID-19 crisis (Chart 9). However, in Germany’s case the election outcome is not a foregone conclusion. Chart 9German Leadership Saw Popularity Bounce
Building Back … The Wall Of Worry
Building Back … The Wall Of Worry
As we highlighted in our annual forecast, an upset in which a left-wing bloc forms the government for the first time since 2005 is likelier than the market expects. This scenario presents an upside risk for equities and bund yields since Germany would become even more pro-Europe, pro-integration, and proactive in its fiscal spending. In the current context that would be greeted warmly by financial markets as it would reinforce the cyclical rotation into the euro, industrials, and European peripheral debt. Incidentally, it would also reduce tensions with Russia and China – even as the Biden administration is courting Germany. Recent state elections confirm that the electorate is moving to the left rather than the right. In Baden-Wurttemberg, the third largest state by population and economic output, and a southern state, the Christian Democrats slipped from the last election (-2.9%), the Social Democrats slipped by less (-1.7%), the Free Democrats gained (2.2%), the Greens gained (2.3%), and the far-right Alternative for Germany saw a big drop (-5.4%). In the smaller state of Rhineland-Palatinate the results were largely the same although the Greens did even better (Tables 4A & 4B).7 In both cases the Christian Democrats saw the worst result since prior to the financial crisis while the Greens tripled their support in Baden and doubled their support in the Palatinate over the same time frame. Table 4AGerman State Elections Show Voters’ Leftward Drift Continues
Building Back … The Wall Of Worry
Building Back … The Wall Of Worry
Table 4BGerman State Elections Show Voters’ Leftward Drift Continues
Building Back … The Wall Of Worry
Building Back … The Wall Of Worry
To put this into perspective: Outgoing Chancellor Angela Merkel and her coalition have seen a net 6% increase in popular support since COVID-19. The coalition, led by the Christian Democratic Union and its Bavarian sister party, the Christian Social Union, still leads national opinion polling. What we are highlighting are chinks in the armor. The gap with the combined left-leaning bloc is less than 10% points (Chart 10). Chart 10German Party Polling
German Party Polling
German Party Polling
Merkel is a lame duck whose party has been in power for 17 years. She is struggling to find an adequate successor. Her current frontrunner for chancellor-candidate, Armin Laschet, is suffering in public opinion, especially after the state election defeats, while her previous successor was ousted last year. Other chancellor-candidates, like Friedrich Merz, Markus Söder, and Norbert Röttgen may find themselves to the right of the median voter, which has been shifting to the left. Merkel’s party’s handling of COVID-19 first received praise and now, in the year of the vote, is falling under pressure due to difficulties rolling out the vaccine. Even as conditions improve over the course of the year her party may struggle to recover from the damage, since the underlying reality is that Germany has suffered a recession and is beset by global challenges. While the Christian Democrats performed relatively well in the 2009 election, in the teeth of the global financial crisis, times have changed. Today the Social Democrats are no longer in free fall – ever since their Finance Minister Olaf Scholz led the charge for fiscal stimulus in 2019 – while third parties like the Free Democrats, Greens, and Die Linke all gained in 2009 and look to gain this year (Table 5). In today’s context it is even more likely that other parties will rise at the ruling party’s expense. Still, the Christian Democrats have stout support in polls and do not have to split votes with the far-right, which is in collapse. Table 5German Federal Election Results Show 2021 Could Throw Curveball For Ruling Party
Building Back … The Wall Of Worry
Building Back … The Wall Of Worry
Therein lies the real market takeaway: right-wing populism has flopped in Germany. The risk to the consensus view that Merkel will hand off the baton seamlessly to a successor and secure her party another term in leadership is that the establishment left will take power (the Greens in Germany are essentially an establishment party). Chart 11German Bunds Respond To Macro Shifts, State Elections
German Bunds Respond To Macro Shifts, State Elections
German Bunds Respond To Macro Shifts, State Elections
Near-term pandemic and economic problems have caused bund yields to fall and the yield curve to flatten so far this year (Chart 11). But that trend is unlikely to continue given the global and national outlook. Election uncertainty should work against this trend since the only possible uncertainty gives more upside to the fiscal outlook and bond yields. If the consensus view indeed comes to pass and the Christian Democrats remain in power, the election holds out policy continuity – at least on economic policy. Fiscal tightening would happen sooner under the Christian Democrats but it would not be aggressive or premature, at least not in the 2021-22 period. It is the current coalition that first loosened Germany’s belt – and it did so in 2019, prior to COVID-19. Germany’s and the EU’s proactive fiscal turn will have a major positive impact on growth prospects, at least cyclically, though it is probably too small thus far to create a structural improvement in potential growth. Fiscal thrust is negative over next two years even with the EU’s Next Generation Recovery Fund being distributed. A structural increase in growth is possible given that all of the major countries are simultaneously pursuing monetary and fiscal stimulus as well as big investments in technology and renewable energy that will help engender a new private capex cycle. But productivity has been on a long, multi-decade decline so it remains to be seen if this can be reversed. Geopolitically speaking, Germany’s and the EU’s policy shift arrived in the nick of time to deepen European integration before divisions revive. Integration is broadly driven by European states’ need to compete on a grand scale with the US, Russia, and China. But Putin, Brexit, and Mario Draghi demonstrate the more tactical pressures: Brexit discourages states from exiting, especially with ongoing trade disputes and the risk of a new Scottish independence referendum; Putin’s aggressive foreign policy drives eastern Europeans into the arms of the West; and the formation of a unity government in Italy encourages European solidarity and improves Italian growth prospects. The outlook for structural reforms is not hopeless. Prime Minister Draghi’s government has a good chance of succeeding at some structural reforms where his predecessors have failed. Meanwhile French President Emmanuel Macron is still favored to win the French election in 2022, which is good for French structural reform. The fact that the EU tied its recovery fund to reform is positive. Most importantly the green energy agenda is replacing budget cutting for the time being, which, again, is positive for capex and could create positive long-term productivity surprises. Of course, structural reform intensity slowed just prior to COVID, in Spain, France, and Italy. Once the recovery funds are spent the desire to persist with reform will wane. This is clear in Spain, which has rolled back some reforms and has a weak government that could dissolve any time, and Italy, where the Draghi coalition may not last long after funds are spent. If the global upswing persists and Chinese/EM growth improves, then Europe will benefit from a macro backdrop that enables it to persist with some structural reforms and crawl out of its liquidity trap. But if China/EM growth relapses then Europe will fall back into a slump. Thus it is a very good thing for Europe, the euro, and European equities that the US is engaged in an epic fiscal blowout and that China’s Two Sessions dampened the risk of overtightening. Incidentally, if the German government does shift, relations with Russia would improve on the margin. While US-Russia tensions will remain hot, German mediation could reduce Russia’s insecurity and lower geopolitical risks for both Russia and emerging Europe, which are very cheaply valued at present in part because they face a persistent geopolitical risk premium. Bottom Line: German politics will drive further EU integration whether the Christian Democrats stay in power or whether the left-wing parties manage a surprise victory. Europe will have to provide more fiscal stimulus but otherwise the global context is favorable for Europe. Investors should not be too pessimistic about short-term hiccups with the vaccine rollout. Investment Takeaways The US is stimulating, China is not overtightening, and German’s election risk is actually an upside risk for European and global risk assets. These points reaffirm a bullish cyclical outlook on global stocks and commodities and a bearish outlook on government bonds. It is especially positive for global beneficiaries of US stimulus excluding China, such as Canada and Mexico. It is also beneficial for industrial metals and emerging markets exposed to China over the medium term, after frenzied buying suffers a healthy correction. Any premium in European equities should be snapped up. However, the cornerstone has been laid for the wall of worry in this global economic cycle: the US is raising taxes, China is tightening policy, and Europe’s fiscal stimulus will probably fall short. Moreover a consensus outcome from the German election would be a harbinger of earlier-than-expected fiscal normalization. There is not yet a clear green light in US-China relations – on the contrary, our view that Biden would be hawkish is coming to pass. Biden faces foreign policy tests across the board and now is a good time to hedge against the inevitable return of downside risks given the remorseless increase in tensions between the Great Powers. Housekeeping A number of clients have written to ask follow-up questions about our contrarian report last week taking a positive view on cybersecurity stocks despite the tech selloff and a positive view on global defense stocks, especially in relation to cybersecurity. The main request is, Which companies offer the best value? So we teamed up with BCA’s new Equity Analyzer to highlight the companies that receive the best BCA scores utilizing a range of factors including value, safety, payout, quality, technicals, sentiment, and macro context – all relative to a universe of global stocks with a minimum market cap of $1 billion. The results are shown in the Appendix, which we hope will come in handy. Separately our tactical hedge, long US health care equipment versus the broad market, has stopped out at -5%. This makes sense in light of the pro-cyclical rotation. Health care equipment is still likely to outperform the rest of the US health care sector amid a policy onslaught of higher taxes, government-provided insurance, and pharmaceutical price caps. Matt Gertken Vice President Geopolitical Strategy mattg@bcaresearch.com Yushu Ma Research Associate yushu.ma@bcaresearch.com Appendix Appendix Table ABCA Research Equity Analyzer Casts Light On Best Defense And Cybersecurity Stocks
Building Back … The Wall Of Worry
Building Back … The Wall Of Worry
Appendix Table BBCA Research Equity Analyzer Casts Light On Best Defense And Cybersecurity Stocks
Building Back … The Wall Of Worry
Building Back … The Wall Of Worry
Appendix Table CBCA Research Equity Analyzer Casts Light On Best Defense And Cybersecurity Stocks
Building Back … The Wall Of Worry
Building Back … The Wall Of Worry
Footnotes 1 China is asking for export controls that have hamstrung Huawei and SMIC to be removed as well as for sanctions and travel bans on Communist Party members and students to be lifted. See Lingling Wei and Bob Davis, "China Plans To Ask U.S. To Roll Back Trump Policies In Alaska Meeting," Wall Street Journal, March 17, 2021, wsj.com; Helen Davidson, "Taiwanese urged to eat ‘freedom pineapples’ after China import ban," The Guardian, March 2, 2021, theguardian.com. 2 "Putin on Biden: Russian President Reacts To US Leader’s Criticism," BBC, March 18, 2021, bbc.com. 3 Pyongyang is likely to test a new, longer range intercontinental ballistic missile for the first time since its self-imposed missile test moratorium began in 2018 after President Trump’s summit with leader Kim Jong Un. See Lara Seligman and Natasha Bertrand, "U.S. ‘On Watch’ For New North Korean Missile Tests," Politico, March 16, 2021, politico.com. 4 See ABC News, "Transcript: Joe Biden delivers remarks on 1-year anniversary of pandemic", ABC News, Mar. 11, 2021, abcnews.com. 5 Please see IMF Staff, "World Economic Outlook Reports", IMF, Jan. 2021, imf.org and OECD Staff, "OECD Economic Outlook, Interim Report March 2021", OECD, March 9, 2021, oecd.org. 6 Please see IMF Asia and Pacific Dept, "People’s Republic of China : 2020 Article IV Consultation-Press Release; Staff Report; and Statement by the Executive Director for the People's Republic of China", IMF, Jan. 8, 2021, imf.org. 7 The other state elections coming up this year will coincide with the federal election on September 26, with one minor exception (Saxony-Anhalt). Opinion polls show the Christian Democrats slipping below the Greens in Berlin and the Social Democrats in Mecklenburg-Vorpommern. The Alternative for Germany is falling in all regions.
Highlights Global Duration: Markets are correctly interpreting the $1.9 trillion US fiscal stimulus package as a factor justifying higher global growth expectations and bond yields. Maintain a below-benchmark stance on overall global duration. Yield Betas & Country Allocation: Within government bond portfolios, overweighting the “lower-beta” countries that have bond yields less sensitive to changes in US yields (Germany, France, Japan) versus the higher-beta markets (Canada, Australia, UK) remains the appropriate strategy during the current bond bear market. Underweights should remain concentrated in the US, though, as it is highly unlikely that any central bank will begin to tighten policy before the Fed. UK Follow-Up: The conclusions from our UK Special Report published last week do not change after adjusting for the difference in the inflation indices used to calculate UK inflation-linked bond yields compared to those of other countries. UK real interest rates are the lowest in the developed economies, while inflation breakevens are the highest. NOTE: There will be no Global Fixed Income Strategy report published next week. Instead, BCA Chief Global Fixed Income Strategist Rob Robis will do a webcast discussing his latest thoughts on global bond markets. Yields Rising Around The World Chart of the WeekPolicy Mix Is Bond-Bearish
Policy Mix Is Bond-Bearish
Policy Mix Is Bond-Bearish
The path of least resistance for global bond yields remains biased upward. Optimism on future economic growth remains ebullient with consumer and business confidence indices surging in much of the developed world. The epicenter of the global bond bear market remains the US, where pandemic related economic restrictions are being unwound with 21.4% of the US population now having received at least one dose of a vaccine. Fiscal policy in the US is also supporting the positive vibes on future growth after the $1.9 trillion stimulus package was signed into law by President Biden last week. The 10-year US Treasury yield climbed back to the 2021 high of 1.63% on the back of that announcement. The US stimulus package changes the trajectory of the 2021 US fiscal impulse from a $0.8 trillion contraction to a $0.3 trillion expansion, according to estimates from the US Committee for a Responsible Federal Budget (Chart of the Week). This, combined with ongoing quantitative easing from global central banks eager to keep bond yields as low as possible until inflation expectations sustainably return to policymaker targets, is providing a bond-bearish lift to both inflation expectations and real yields – most notably in the US. Central bankers can try to fight back against the speed of the increase in bond yields by maintaining their commitment to current policy settings, as the European Central Bank (ECB) and Bank of Canada (BoC) did last week. The Fed, Bank of England (BoE) and Bank of Japan (BoJ) will all get the chance to do the same this at this week’s policy meetings. The likely message from all will be one of staying the course and not reflexively responding to higher bond yields, which have not triggered a broad-based selloff in global risk assets that would pre-emptively tighten financial conditions. The S&P 500 index hit an all-time high last week, while equity markets in Europe and Japan have returned to pre-pandemic levels (Chart 2). Global corporate credit spreads have remained calm, consistent with a positive growth backdrop that diminishes the potential for credit downgrades and defaults. The US dollar has gotten a lift from improving US growth expectations and relatively higher US Treasury yields, which has had some negative spillover effect into emerging market equities and currencies. The dollar rebound has been relatively modest to date, however, with the DXY index up only 3% from the early 2021 lows. A major reason why global equity and credit markets have absorbed higher bond yields so well is because the sheer scope of the new US fiscal stimulus will have a major impact on growth momentum both in the US and outside the US. This comes on top of the boost to optimism from the speed of the US and UK vaccine rollouts. In an update to its December 2020 economic outlook published last week, the OECD estimated that the $1.9 trillion US stimulus will boost US real GDP growth by 3.8 percentage points versus its original forecast over the next year (Chart 3). Other countries will also benefit from the implied surge in US demand spilling over from that stimulus package, with the OECD projecting a 1.1 percentage point increase to world real GDP growth. Chart 2Risk Assets Ignoring Rising Global Bond Yields
Risk Assets Ignoring Rising Global Bond Yields
Risk Assets Ignoring Rising Global Bond Yields
Chart 3Big Growth Spillovers From US Fiscal Stimulus
Harder, Better, Faster, Stronger
Harder, Better, Faster, Stronger
Countries that have the greater exposure to US demand, like Canada and Mexico, are expected to benefit a bit more than the rest of the world, but the expected boost to growth is consistent (around one half of a percentage point) from China to Europe to Japan to major emerging market countries like Brazil. That US-fueled pickup in global economic activity will help absorb some of the spare capacity that opened up during the COVID-19 pandemic. In Chart 4 and Chart 5, we show the estimates taken from the December 2020 OECD Economic Outlook for the output gaps in the US, euro area, UK, Japan, Canada and Australia for 2021 and 2022. We adjust those projections by the OECD’s estimate of the impact of the US fiscal stimulus in 2021, as well as by the additional upward revisions to the OECD growth projections in 2021 and 2022 that were published last week. Chart 4The $1.9 Trillion Stimulus Will Close The US Output Gap …
Harder, Better, Faster, Stronger
Harder, Better, Faster, Stronger
Chart 5… And Help Narrow Output Gaps Elsewhere
Harder, Better, Faster, Stronger
Harder, Better, Faster, Stronger
Chart 6Maintain Below-Benchmark Duration
Maintain Below-Benchmark Duration
Maintain Below-Benchmark Duration
The conclusion is that the US output gap will be eliminated in 2022, while output gaps will still be negative, but diminished, in the other countries after factoring in the impact of the latest US fiscal package. This suggests that the maximum upward pressure on global bond yields should still be centered in the US, where inflation pressures will be more evident and the Fed will likely begin signaling a shift to a less dovish stance sooner than other central banks (although not likely until much later in 2021). Our Global Duration Indicator continues to flag pressure for higher bond yields ahead for the major developed economies (Chart 6). The improving growth momentum means that rising real yields should increasingly become the more important driver of higher nominal bond yields. Persistent central bank dovishness in the face of that growth surge, however, means that it is still too soon to position for narrowing global inflation expectations or any bearish flattening of government bond yield curves - even in the US. Bottom Line: Markets are correctly interpreting the $1.9 trillion US fiscal stimulus package as a factor justifying higher global growth expectations and bond yields. Maintain a below-benchmark stance on overall global duration. Using Yield Betas For Bond Country Allocation, One More Time Over the past two months, we have published Special Reports that delved into the outlook for bond yields and currencies in Australia, Canada and the UK. We selected those three countries as they represented the most likely downgrade candidates within our recommended government bond country allocation given their status as “higher beta” bond markets that are more correlated to US Treasury yields. We estimate US Treasury yield betas from a rolling regression (over a three-year window) of changes in 10-year non-US government bond yields to changes in 10-year US Treasury yields (Chart 7). This allows us to assess which markets are more or less sensitive to the ups and downs of US bond yields. We have used this framework to help guide our country allocation strategy during the pandemic and, for the most part, it has been successful. Chart 7Government Bond Yield Sensitivities To USTs Are Shifting Fast
Government Bond Yield Sensitivities To USTs Are Shifting Fast
Government Bond Yield Sensitivities To USTs Are Shifting Fast
So far in 2021, the markets with higher US Treasury yield betas (Canada, Australia and New Zealand) have underperformed the lower beta markets (Germany, France and Japan). We show that in the top panel of Chart 8, which plots the yield betas at the start of the year versus the year-to-date relative return of each country’s government bond market to that of the overall Bloomberg Barclays Global Treasury index. The returns are adjusted to reflect any differences in the durations of each country versus that of the overall index, and are shown in USD-hedged terms to allow for a common currency comparison. The bottom panel of Chart 8 shows the same relationship for the all of 2020. This is a mirror image of what has occurred so far in 2021, with the countries with higher yield betas outperforming the lower beta markets. The obvious difference between the two years is the direction of Treasury yields, which fell in 2020 and have been rising this year. So far in 2020, the differences between the returns of the higher beta markets have been quite similar. New Zealand has had the biggest negative performance (-2.8% versus the global benchmark), but this has only been moderately worse than Australia (-2.6%) and Canada (-2.4%). These are all just slightly worse than the return of US Treasuries relative to the Global Treasury index (-2.3%). Our estimated yield betas have changed rapidly over the past few months. For example, the rolling three-year yield beta of Australia has shot up from 0.61 at the beginning of the year to 0.78, while Canada has seen a similar move (0.81 to 0.88). This reflects the rapid repricing of interest rate expectations in both countries as current growth momentum and growth expectations improve. While not a perfect relationship, yield betas do show some correlation to our Central Bank Monitors – designed to measure the pressure on central banks to tighten of ease monetary policy (Chart 9). The latest increases in the yield betas of Australia, New Zealand and Canada have occurred alongside a rising trend in our Central Bank Monitors for each nation. The implication is that the relative underperformance of government bonds in those countries is related to the cyclical pressure for the RBA, RBNZ and BoC to tighten monetary policy. Chart 8An Intuitive Link Between Yield Betas & Bond Market Performance
Harder, Better, Faster, Stronger
Harder, Better, Faster, Stronger
Chart 9Cyclical Pressures & Yield Betas Are Linked
Cyclical Pressures & Yield Betas Are Linked
Cyclical Pressures & Yield Betas Are Linked
At the same time, the yield betas of government bonds in Germany and the UK have remained low despite the cyclical upturn in our ECB and BoE Monitors. The lingering impact of COVID-19 lockdowns on economic growth and inflation in the euro area and UK is likely weighing on bond yields in both regions. This limits any challenge to the dovish forward guidance of the ECB and BoE, in contrast to the repricing of interest rate expectations seen in other countries. The market-implied path of policy interest rates extracted from OIS forward curves does show a much more aggressive expected path of policy rates in the higher beta markets versus the lower beta markets (Chart 10). Chart 10More Rate Hikes Expected In The Higher Yield Beta Countries
Harder, Better, Faster, Stronger
Harder, Better, Faster, Stronger
The “liftoff” date for each central bank shown, representing when the first full interest rate hike is priced into the OIS forwards, is shown in Table 1. We rank the countries in the table by the amount of time until the discounted liftoff date, from shortest to longest. The first rate hike is expected in New Zealand in June 2022, with the BoC expected to lift rates in Canada two months later. The market is not pricing a full rate hike by the Fed until January 2023, while liftoff in the UK and Australia are expected during the summer of 2023. Table 1The "Pecking Order" Of Global Liftoff
Harder, Better, Faster, Stronger
Harder, Better, Faster, Stronger
We treat the countries with perpetually low interest rates, the euro area and Japan, differently in Table 1, as both the ECB and BoJ would most likely move slowly if and when they ever decided to raise rates again. Thus, we define liftoff as only a 10bp increase in policy interest rates for those two regions, while for all the other central banks we assume the size of the first rate hike will be 25bps. On that reduced basis, the market is priced for “liftoff” by the ECB and BoJ in September 2023 and February 2025, respectively. In terms of that “order of liftoff” shown in Table 1, we generally agree with current market pricing except for New Zealand and Canada. We fully expect the Fed to be the first central bank to begin signaling the path towards monetary policy normalization, largely due to the impact of the fiscal stimulus, starting with a move to begin tapering the Fed’s asset purchases at the start of 2022. The Fed will also be the first to begin rate hikes after tapering. We do not anticipate the BoC or Reserve Bank of New Zealand (RBNZ) to make any hawkish moves (reduced asset purchases or rate hikes) before the Fed does the same, as this would put unwanted appreciation pressures on the New Zealand and Canadian dollars. We expect the BoC and RBNZ to move soon after the Fed begins to shift, followed by the BoE and RBA a bit later after that in line with the current liftoff ordering. The pace of rate hikes after liftoff also appears to be a bit too aggressively priced in the countries with higher yield betas. The cumulative amount of interest rate increases to the end of 2024 currently priced in OIS curves is larger in Canada (175bps) and Australia (156bps) than the US (139bps) and New Zealand (140bps). The relative differences are not huge, however, but we think the odds favor the Fed delivering the greater amount of rate hikes over the next three years. More generally, when looking at what is more important for each central bank in determining the timing of liftoff, we can boil it down to a couple of the most important measures for the higher beta countries (Chart 11): US: The Fed will continue to focus on both inflation expectations and broad measures of labor market utilization before signaling any policy shift. On that basis, there is still some way to go before TIPS breakevens return to the 2.3-2.5% level we believe to be consistent with the Fed sustainably hitting its 2% inflation goal on the PCE deflator. Also, there is still a lot of ground to cover before the US labor market fully returns to pre-pandemic health, as the employment/population ratio is four percentage points below the pre-COVID peak. New Zealand: The RBNZ is now under a lot more pressure to tighten policy after the New Zealand government changed the central bank’s remit to include stabilizing house prices, which have soured to unaffordable levels that have exacerbated income inequality. With house prices now rising at a 19% annual rate, the highest since 2004, the RBNZ will be under pressure to hike sooner, although any associated rise in the New Zealand dollar will likely be of equal concern. Canada: The BoC has been very candid that its current policy mix of aggressive asset purchases and 0% policy rates will be altered if the Canadian economy improves. We believe that the current trends of booming house price inflation, recovering business investment prospects and a rapidly recovering labor market will all make the BoC more willing to signal tighter monetary policy fairly soon after the Fed does the same. Australia: The RBA is likely to continue surprising bond markets with its dovishness in the face of a rapidly recovering economy, given underwhelming inflation. In a recent speech, RBA Governor Philip Lowe noted that Australian inflation will not return to the RBA’s 2-3% target band without wage growth rising from the current 1.4% pace up to 3%. The RBA does not expect the labor market to tighten enough to generate that kind of wage growth until at least 2024, suggesting no eagerness to begin normalizing monetary policy. Among the lower-beta markets, the most important things that will dictate future policy moves are the following (Chart 12): Chart 11What To Watch In The Higher Yield Beta Countries
What To Watch In The Higher Yield Beta Countries
What To Watch In The Higher Yield Beta Countries
Chart 12What To Watch In The Lower Yield Beta Countries
What To Watch In The Lower Yield Beta Countries
What To Watch In The Lower Yield Beta Countries
UK: The BoE’s current focus is on how fast the UK economy recovers from the pandemic shock, with inflation expectations remaining elevated (see the next section of this report). The degree of strength in business investment and consumer spending will thus dictate the timing of any BoE shift to a less accommodative policy stance. Euro Area: The latest set of ECB projections call for inflation to only reach 1.4% by 2023. As long as inflation (both realized and expected) stays well below the 2% ECB target, the central bank will focus more on supporting easy financial conditions (lower corporate bond yields, tighter Italy-Germany yield spreads and resisting euro currency strength). Japan: Inflation continues to underwhelm in Japan, and the BoJ is a long way from contemplating any tightening measures. Summing it all up, we still see value in using yield betas to dictate our recommended fixed income country allocations. Although these should be complemented with assessments of the relative likelihood of central banks moving before others to further refine country allocations. Bottom Line: Within government bond portfolios, overweighting the “lower-beta” countries that have bond yields less sensitive to changes in US yields (Germany, France, Japan) versus the higher-beta markets (Canada, Australia, UK) remains the appropriate strategy during the current bond bear market. Underweights should remain concentrated in the US, though, as it is highly unlikely that any central bank will begin to tighten policy before the Fed. A Brief Follow-Up To Our UK Special Report In our Special Report on the UK published last week, we noted that the UK had the lowest real bond yields and highest inflation expectations among the developed market countries with inflation-linked bonds.1 Some astute clients pointed out that we neglected to discuss how the UK inflation-linked bonds are priced off the UK Retail Price Index (RPI) which typically runs with a faster inflation rate than the UK Consumer Price Index (CPI). This creates a downward bias to UK real yields in comparison to other countries that use domestic CPI indices in inflation-linked bond pricing. We did not ignore the RPI-CPI differential in our report, we just did not think it to be relevant to the conclusions of our report. The UK still has the lowest real rates and highest inflation expectations even after adjusting both by the RPI-CPI gap (Chart 13). Furthermore, survey-based measures of UK inflation expectations are broadly in line with the RPI-based inflation breakevens, confirming the message from the RPI-based real yields and inflation expectations. Chart 13UK Real Yields Are Too Low, Using RPI Or CPI
UK Real Yields Are Too Low, Using RPI Or CPI
UK Real Yields Are Too Low, Using RPI Or CPI
Looking ahead, the RPI-CPI gap is likely to stay in a much narrower range compared to its longer run history. Chart 14A Less Active BoE Has Narrowed The RPI-CPI Gap
A Less Active BoE Has Narrowed The RPI-CPI Gap
A Less Active BoE Has Narrowed The RPI-CPI Gap
For example, between 2000 and 2007, the RPI-CPI gap averaged a full percentage point but with very large fluctuations (Chart 14). This is because mortgage interest costs are included in the RPI but are not part of the CPI. Thus, RPI inflation tends to be more volatile when the BoE is more active in adjusting interest rates. After the 2008 financial crisis, the BoE has kept policy rates at very low levels with very few changes. The RPI-CPI gap has narrowed as a result, averaging only one-half of a percentage point between 2009 to today. Thus, our conclusion on UK bond yields remains the same – Gilt yields are too low and are likely to rise further over the next 6-12 months. Robert Robis, CFA Chief Fixed Income Strategist rrobis@bcaresearch.com Footnotes 1 Please see BCA Research Global Fixed Income Strategy/Foreign Exchange Strategy Special Report, "Why Are UK Interest Rates Still So Low?",dated March 10, 2021, available at gfis.bcaresearch.com and fes.bcaresearch.com. Recommendations The GFIS Recommended Portfolio Vs. The Custom Benchmark Index
Harder, Better, Faster, Stronger
Harder, Better, Faster, Stronger
Duration Regional Allocation Spread Product Tactical Trades Yields & Returns Global Bond Yields Historical Returns
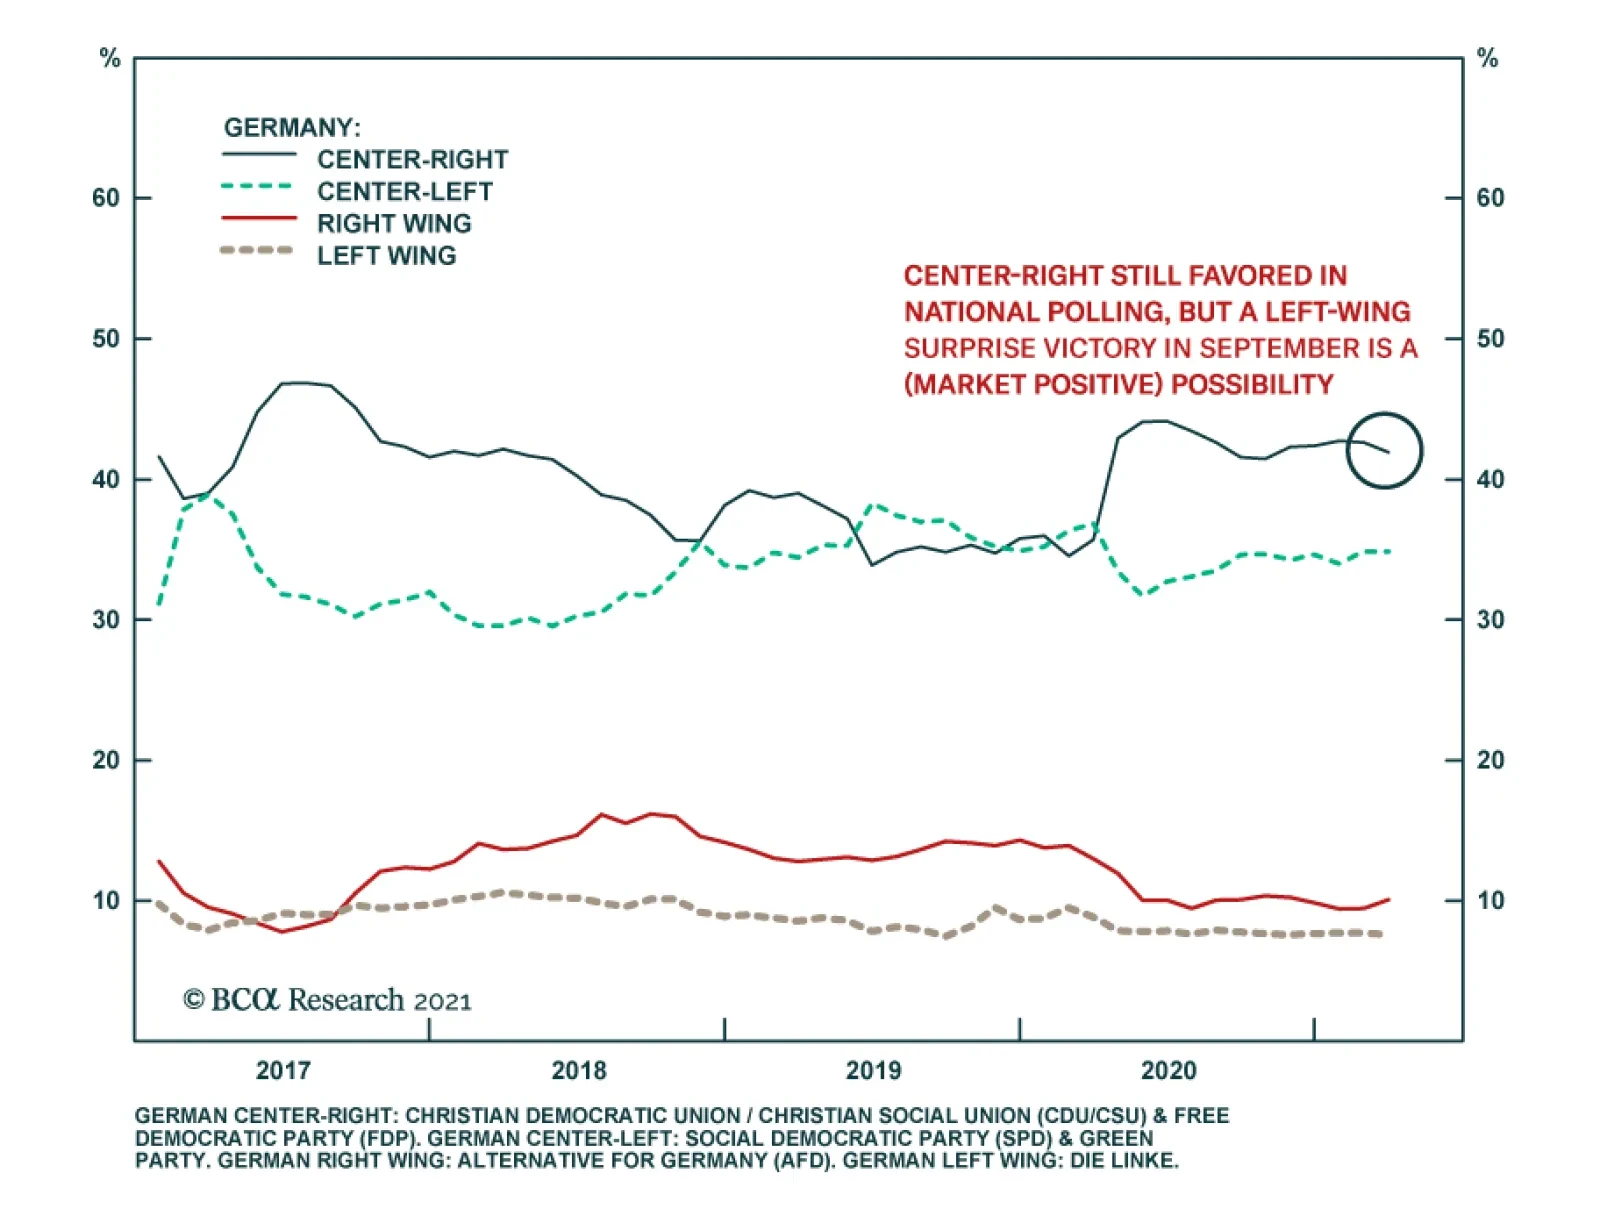
The CDU’s historic defeats in Baden-Wurttemberg and Rhineland-Palatinate regional elections over the weekend highlight the risk of a change in government in Germany later this year. Our Geopolitical Strategists previously highlighted that the market had…
Highlights UK Interest Rates: A series of rolling shocks dating back to the 2008 financial crisis has prevented the Bank of England (BoE) from normalizing crisis-era levels of interest rates, even during years when inflation was overshooting the BoE 2% target. Brexit and COVID-19 were the last of those two shocks, but the growth- and inflation-dampening effects of both are fading fast. Implications for Gilts & GBP: The BoE’s dovish rhetoric, including hints that negative policy rates are still a viable option, looks increasingly inappropriate. The surge in real UK bond yields seen over the past month is just the beginning of a medium-term process of interest rate normalization. Maintain below-benchmark duration on Gilts, while downgrading UK allocations within dedicated global fixed income portfolios to neutral. The pound has upside in this environment, especially if depressed UK productivity starts to recover. Feature Chart 1UK Real Yields: Deeply Negative
Why Are UK Interest Rates Still So Low?
Why Are UK Interest Rates Still So Low?
The UK has become one of the more peculiar corners of the global fixed income universe. The outright level of longer-term Gilt yields is in the middle of the pack among the major advanced economies. The story is much different, however, when breaking those nominal UK yields into the real and inflation expectations components. The deeply negative real yields on UK inflation-linked Gilts are the lowest among the majors, even in a world where sub-0% real yields are prevalent in most countries (Chart 1). The flipside of that deeply negative real yield is a high level of inflation expectations. The breakeven inflation rate derived from the difference between the nominal and real 10-year Gilt yields is 3.3%, the highest in the developed “linkers” universe. Inflation expectations in UK consumer surveys are at similar levels, well above the 2% inflation target of the Bank of England (BoE), suggesting little confidence in the central bank’s ability or willingness to hit its own inflation goals. In this Special Report, jointly published by BCA Research Global Fixed Income Strategy and Foreign Exchange Strategy, we investigate why UK real interest rates have remained so persistently negative and assess the possibility of a shift in the low interest rate regime in a post-Brexit, post-pandemic UK – a move that could be quite bearish for UK fixed income markets and bullish for the British pound. Can The BoE Ignore Cyclical Upward Pressure On UK Bond Yields? The UK has suffered from a series of shocks, starting with the 2008 crisis, that have limited the ability of the BoE to attempt to tighten monetary policy. The 2011/12 European debt crisis hurt the UK’s most important trading partners, while the 2016 Brexit vote began a multi-year process of uncertainty over the future of those trading relationships. The COVID-19 pandemic is the latest shock, triggering a recession of historic proportions. The UK economy contracted by -10% in 2020, the largest decline since “The Great Frost” downturn of 1709. UK bond yields collapsed in response as the BoE cut rates to near-0% and reinforced that easy stance with aggressive quantitative easing and promises to keep rates unchanged over at the next few years. Today, UK financial markets are waking up to a world beyond the current COVID-19 lockdowns. The UK is running one of the world’s most successful vaccination rollouts, with 23 million jabs, or 35 per 100 people, already having been administered. UK Prime Minister Boris Johnson recently unveiled a bold plan to fully reopen the UK economy from the current severe lockdowns by mid-year. The UK government’s latest budget called for additional spending measures over the next year, including maintaining the work furlough scheme that has supported household incomes during the pandemic. As a result, UK growth expectations have exploded higher. According to the Bloomberg consensus economics survey, UK nominal GDP growth is expected to surge to 8.4% over calendar year 2021, an annual pace not seen since 1990 (Chart 2). Nominal Gilt yields have begun to reprice higher to reflect those surging growth expectations, with the 5-year/5-year forward Gilt yield climbing 67bps so far in 2021. Real Gilt yields are also moving higher with the 10-year inflation-linked Gilt climbing 38bps year to date, providing additional interest rate support that has fueled a surge in the pound versus the dollar (bottom panel). Our own BoE Monitor - containing growth, inflation and financial variables that typically lead to pressure on the central bank to adjust monetary policy – is signaling a reduced need for additional policy easing (Chart 3). The momentum of changes in longer-maturity UK Gilts and the trade-weighted UK currency index are usually correlated to the ebbs and flows of the BoE Monitor. The latest surge higher in yields and the currency suggests that the markets are anticipating the type of recovery that will put pressure on the BoE to tighten. Chart 2A Growth-Driven Repricing Of Gilts & GBP
A Growth-Driven Repricing Of Gilts & GBP
A Growth-Driven Repricing Of Gilts & GBP
Chart 3Gilts & GBP Sniffing Out A Less Dovish BoE?
Gilts & GBP Sniffing Out A Less Dovish BoE?
Gilts & GBP Sniffing Out A Less Dovish BoE?
It may take a while to see the BoE turn more hawkish, however. The BoE has become one of least active central banks in the world over the past decade. After the BoE cut its official policy interest rate, the Bank Rate, by 500bps during the 2008 financial crisis and 2009 recession, rates were kept in a range between 0.25% and 0.75% for ten consecutive years. The BoE cut rates aggressively in response to the COVID-19 pandemic, lowering the Bank Rate in March 2020 from 0.75% to 0.1%, where it still stands. The BoE has used quantitative easing (QE) and forward guidance to try and limit movements in bond yields whenever cyclical surges in inflation could have justified tighter monetary policy. That has led to an extended period of a negative BoE Bank Rate, something not seen since the inflationary 1970s (Chart 4). Back then, the BoE was lagging the surge in UK inflation, but still hiking nominal interest rates. Today, the central bank is keeping nominal rates near 0% with much lower levels of inflation. Chart 4Over A Decade Of Negative Real UK Interest Rates
Over A Decade Of Negative Real UK Interest Rates
Over A Decade Of Negative Real UK Interest Rates
Short-term interest rate markets are still pricing in a very slow response from the BoE to the current growth optimism. Only 36bps of rate hikes over the next two years are discounted in the UK overnight index swap (OIS) curve. This go-slow response is in line with the BoE’s guidance on future rate hikes which, similar to the language used by other central banks like the Fed, calls for no pre-emptive rate hikes before inflation has sustainably returned to the BoE target. That combination would be consistent with current forward market pricing on both short-term interest rates and inflation. Chart 5BoE Keeping Real Rates Well Below R*
BoE Keeping Real Rates Well Below R*
BoE Keeping Real Rates Well Below R*
In Chart 5, we show the real BoE Bank Rate, constructed by subtracting UK core CPI inflation from the Bank Rate. We also show a forward real rate calculated using the forward UK OIS and CPI swap curves. The market-implied path of the real Bank Rate shows very little change over the next decade, with the real Bank Rate expected to average around -2.5%. This is far below the estimates of a neutral UK real rate (or “r-star”) of just under 2%, as calculated by the New York Fed or recent academic studies. The neutral UK real rate has likely dipped because of the pandemic. The UK Office For Budget Responsibility (OBR) estimates that there has been a long-term “scarring” of the UK economy from COVID-19 through supply-side factors like weaker investment spending, lower productivity growth and diminished labor force participation – equal to three percentage points of the level of potential GDP.1 The BoE estimates a smaller “scarring” of 1.75 percentage points of potential output, but coming with a 6.5% reduction in the size of the UK capital stock. While these are significant reductions in the supply-side of the UK economy, they are not enough to account for the 4.5 percentage point difference between pre-pandemic estimates of the UK r-star and the market-implied path of the real BoE Bank Rate over the next decade. The implication is that the markets are not expecting the BoE to deviate from its strategy of doing very little with interest rates, even as growth recovers from the pandemic shock. That can be seen in the recent upturn in UK inflation expectations that is evident in both market-implied and survey-based measures. Chart 6UK Inflation Expectations Reflect BoE Policy, Not Actual Inflation
UK Inflation Expectations Reflect BoE Policy, Not Actual Inflation
UK Inflation Expectations Reflect BoE Policy, Not Actual Inflation
The 5-year/5-year forward UK CPI swap rate now sits at 3.6%, not far off the 3.3% level of 5-10 year consumer inflation expectations from the latest YouGov/Citigroup survey (Chart 6). The fact that inflation expectations can remain so elevated at a time when headline CPI inflation is struggling to avoid deflation is striking. This indicates a belief that the BoE will do very little in the future to stop a booming UK economy that is expected to put sustained downward pressure on the UK unemployment rate over the next few years (bottom panel). This is from a relatively low starting point of the unemployment rate given the massive government support programs that have limited the amount of pandemic-related layoffs over the past year. The BoE should have reasons to be more concerned about a resurgence of UK inflation. In its latest Monetary Policy Report, the BoE published estimates showing that the entire collapse in UK inflation in 2020 was attributable to weaker demand for goods and services – especially the latter (Chart 7). This suggests that UK inflation could rebound by a similar amount as the UK economy reopens from pandemic lockdowns. According to the UK OBR, 21% of UK household spending is on items described as “social consumption”, like restaurants and hotels (Chart 8). This is a much larger proportion than seen in other major developed economies (excluding Spain) and explains why consumer spending plunged so much more dramatically in the UK during 2020 than in other countries. Chart 7Only A Temporary Drag On UK Inflation From COVID-19
Why Are UK Interest Rates Still So Low?
Why Are UK Interest Rates Still So Low?
Chart 8UK Households More Focused On “Social Consumption”
Why Are UK Interest Rates Still So Low?
Why Are UK Interest Rates Still So Low?
If the UK pandemic-related restrictions are eased as planned over the next few months, the potential for a sharp snapback in UK consumer spending is significant. The BoE estimates that UK households now have £125bn of “excess” savings thanks to government income support and reduced spending on discretionary items like dining out and vacations. This is the fuel to support a rapid recovery in consumption over the next 6-12 months, especially as personal income growth will get a boost as furloughed workers begin returning to work (Chart 9). Chart 9UK Economy On The Mend
UK Economy On The Mend
UK Economy On The Mend
Chart 10Big Boost To UK Growth From Housing & Government Spending
Big Boost To UK Growth From Housing & Government Spending
Big Boost To UK Growth From Housing & Government Spending
A similar argument can be made for investment spending – the BoE estimates that UK businesses have amassed £100bn pounds of excess cash, and the latest reading on the BoE’s Agents' Survey of UK firms shows a slight increase after months of decline (bottom panel). With a Brexit deal with the EU finally reached at the start of 2021, UK businesses can also look to increase investment spending that had been delayed because of the years of Brexit uncertainty. The UK economy is already getting a boost from a recovery in the housing market fueled by low interest rates, high household savings and improving consumer confidence. Mortgage approvals have soared to the highest level since 2007, while house prices are now expanding at a 6.4% annual rate (Chart 10). Add it all up, and the economic momentum in the UK is positive and likely to accelerate further in the coming months as a greater share of the population becomes vaccinated. The BoE’s dovish policy stance is likely to appear increasingly inappropriate relative to accelerating UK growth and inflation trends over the next several months. Thus, on a cyclical basis, UK bond yields, both nominal and real, have more upside potential even after the recent increase. Bottom Line: A series of rolling shocks dating back to the 2008 financial crisis has prevented the Bank of England (BoE) from normalizing crisis-era levels of interest rates, even during years when inflation was overshooting the BoE 2% target. Brexit and COVID-19 were the last of those two shocks, but the growth- and inflation-dampening effects of both are fading fast. Structural Forces Keeping UK Interest Rates Low Are Fading Looking beyond the cyclical drivers, the structural factors that have held down UK interest rates in recent years are also starting to fade. The supply side of the UK economy has suffered because of Brexit uncertainty. The OECD’s estimate of potential UK GDP growth fell from 1.75% in 2015 to 1.0% in 2020 (Chart 11). This was mostly due to declining productivity growth – a consequence of years of very weak business investment. The 5-year annualized growth rate of real UK investment spending fell to -3% in 2020, a contraction only matched during the past 30 years after the 1992 ERM crisis and 2008 financial crisis. That plunge in investment coincided with almost no growth in UK labor productivity over that same 5-year window. Chart 11The Road To Faster Potential UK Growth Starts With Investment
The Road To Faster Potential UK Growth Starts With Investment
The Road To Faster Potential UK Growth Starts With Investment
Slowing population growth also weighed on UK potential growth, slowing to the lowest level in 15 years in 2019 as immigration from EU countries to the UK fell sharply. COVID-19 also hurt immigration flows into the UK last year. The UK Office for National Statistics estimated that the non-UK born population in the UK fell by 2.7% between June 2019 and June 2020. Diminished potential GDP growth is a factor that would structurally reduce the equilibrium real UK interest rate. We are likely past the worst for that downward pressure on potential growth and real rates. Population growth should also stabilize as the UK borders open up again and pandemic travel restrictions are loosened. Measured productivity is already starting to see a cyclical recovery, while investment spending is likely to improve as cash-rich UK companies began to ramp up capital spending plans deferred by Brexit and COVID-19. While the process leading from faster investment spending into speedier productivity growth is typically slow, the key point is that the worst of downtrend is likely over. This is an important development that has implications for UK fixed income markets. When looking at an international comparison of real central bank policy rates within the developed economies, the UK has fallen into the grouping of countries with persistently negative policy rates, namely Japan, the euro area, Switzerland, Sweden and Norway (Chart 12). We have dubbed that group the “Secular Stagnation 5”, after the term made famous by former US Treasury Secretary Lawrence Summers describing a state where the “natural” real rate of interest (r-star) that equates savings with investment is structurally negative. Chart 12Does The UK Belong In The 'Secular Stagnation 5'?
Does The UK Belong In The 'Secular Stagnation 5'?
Does The UK Belong In The 'Secular Stagnation 5'?
Does the UK belong in the “Secular Stagnation 5”? As a way to assess this, we made some comparisons of selected UK data with the same data for those five countries. When looking at potential GDP growth and population growth, the UK sits right in the middle of the range of those growth rates for the five countries (Chart 13). UK productivity growth has underperformed the others recently but, prior to the 2016 Brexit shock, UK productivity was also in the middle of the Secular Stagnation 5 range. Chart 13Brexit Became A Major Hit To UK Potential Growth
Brexit Became A Major Hit To UK Potential Growth
Brexit Became A Major Hit To UK Potential Growth
Chart 14UK Economy Less Focused On Investment & Exports
UK Economy Less Focused On Investment & Exports
UK Economy Less Focused On Investment & Exports
On other measures, the UK is nothing like those other countries. The UK’s economy is far less geared towards exports and investment (Chart 14) and is more tilted towards consumer spending. That can be seen most clearly when looking at the data on savings/investment balances. The UK continuously runs a current account deficit, as opposed to the persistent surpluses seen in the Secular Stagnation 5 (Chart 15). Put another way, the UK is not a “surplus” country that saves more than it invests on a structural basis, a condition that typically depresses real interest rates. Chart 15The UK Is Not A Surplus Country
The UK Is Not A Surplus Country
The UK Is Not A Surplus Country
Chart 16Gilts Will Not Become A Low-Beta Market
Gilts Will Not Become A Low-Beta Market
Gilts Will Not Become A Low-Beta Market
Based on these cross-country comparisons, it is unusual for the UK to have such persistently low real interest rates. This has implications for UK bond yields. Over the past few years, Gilts have been transitioning from a status as a “high yield beta” market – whose yield movements are more correlated to swings in the overall level of global bond yields. The lower beta markets are in countries like Germany, France and Japan – all members of the Secular Stagnation club (Chart 16). The UK does not appear to warrant a permanent membership in that low-yielding group, based on structural factors. That is evident when looking at how Gilt yields are rising even with the BoE absorbing an increasing share of the stock of outstanding Gilts (bottom panel). We conclude that the transition of the UK to a low-beta market is related to the Brexit uncertainty post 2016 and the pandemic shock that has hit the consumer-focused UK economy exceptionally hard – both factors that are set to fade over the next year. Bottom Line: The BoE’s dovish rhetoric, including hints that negative policy rates are still a viable option, looks increasingly inappropriate. The surge in real UK bond yields seen over the past month is just the beginning of a medium-term process of interest rate normalization. Investment Conclusions Chart 17Downgrade Gilts To Underweight
Downgrade Gilts To Underweight
Downgrade Gilts To Underweight
Our assessment of the cyclical and structural drivers of UK interest rates leads us to the following conclusions on UK fixed income and currency strategy: Duration: Maintain a below-benchmark exposure to UK interest rate movements. Gilt yields will rise by more than is discounted in the forwards over the next 6-12 months (Chart 17), coming more through rising real yields as the UK economy continues its post-Brexit, post-pandemic recovery. Country Allocation: Downgrade strategic allocations to UK Gilts to neutral from overweight in dedicated fixed income portfolios. Our long-standing view that Brexit uncertainty would lead to the outperformance of Gilts versus other developed bond markets is no longer valid. It is still too soon to move to a full underweight stance on Gilts – a better opportunity will develop by mid-year once it is more evident that the current success on UK vaccinations leads to a faster reopening of the UK economy. Yield Curve: Maintain positioning for a bearish steepening of the UK Gilt yield curve. While there is limited scope for more steepening through an even larger increase in inflation breakevens from current elevated levels, the long end of the Gilt curve can move higher by more than the front end as the market re-rates Gilts to a higher-beta status with a higher future trajectory for UK interest rates. Corporate Credit: Downgrade UK investment grade corporate bond exposure to neutral from overweight in dedicated fixed income portfolios. UK corporate spreads have returned to the 2017 lows and, while an improving growth dynamic is not overly bearish for credit, there is no longer a compelling valuation-based case for staying overweight UK investment grade corporates. This move brings our recommended UK allocation in line with our neutral stance on US and euro area investment grade corporates. Chart 18GBP/USD Appears Cheap On A PPP Basis
GBP/USD Appears Cheap On A PPP Basis
GBP/USD Appears Cheap On A PPP Basis
Chart 19Low Productivity Is Weighing On The Pound
Low Productivity Is Weighing On The Pound
Low Productivity Is Weighing On The Pound
Currency: A growth-driven path towards interest rate normalization should be positive for the British pound, which remains undervalued versus the US dollar on a purchasing power parity basis (Chart 18).2 A move to 1.45 on GBP/USD is possible within the next six months. A broader move towards pound strength will require an improvement in business investment, as the trade-weighted pound looks fairly valued on our productivity-based model (Chart 19). We do maintain our view that EUR/GBP can approach 0.80 by year-end based on a relatively stronger cyclical improvement in UK growth versus the euro area. Robert Robis, CFA Chief Fixed Income Strategist rrobis@bcaresearch.com Footnotes 1 For further details on the OBR estimates of UK growth, inflation and fiscal policy, please see the March 2021 OBR Economic & Financial Outlook, which can be found here: https://obr.uk/ 2 Please see BCA Research Foreign Exchange Strategy Report, "Thoughts On The British Pound", dated December 18, 2020, available at fes.bcaresearch.com.