Euro Area
Euro area and Chinese interest rates must fall much further to prevent monetary policy from becoming ultra-restrictive. But Trump’s attempts to force unwarranted rate cuts from the Fed risks a vicious backlash from the bond vigilantes.
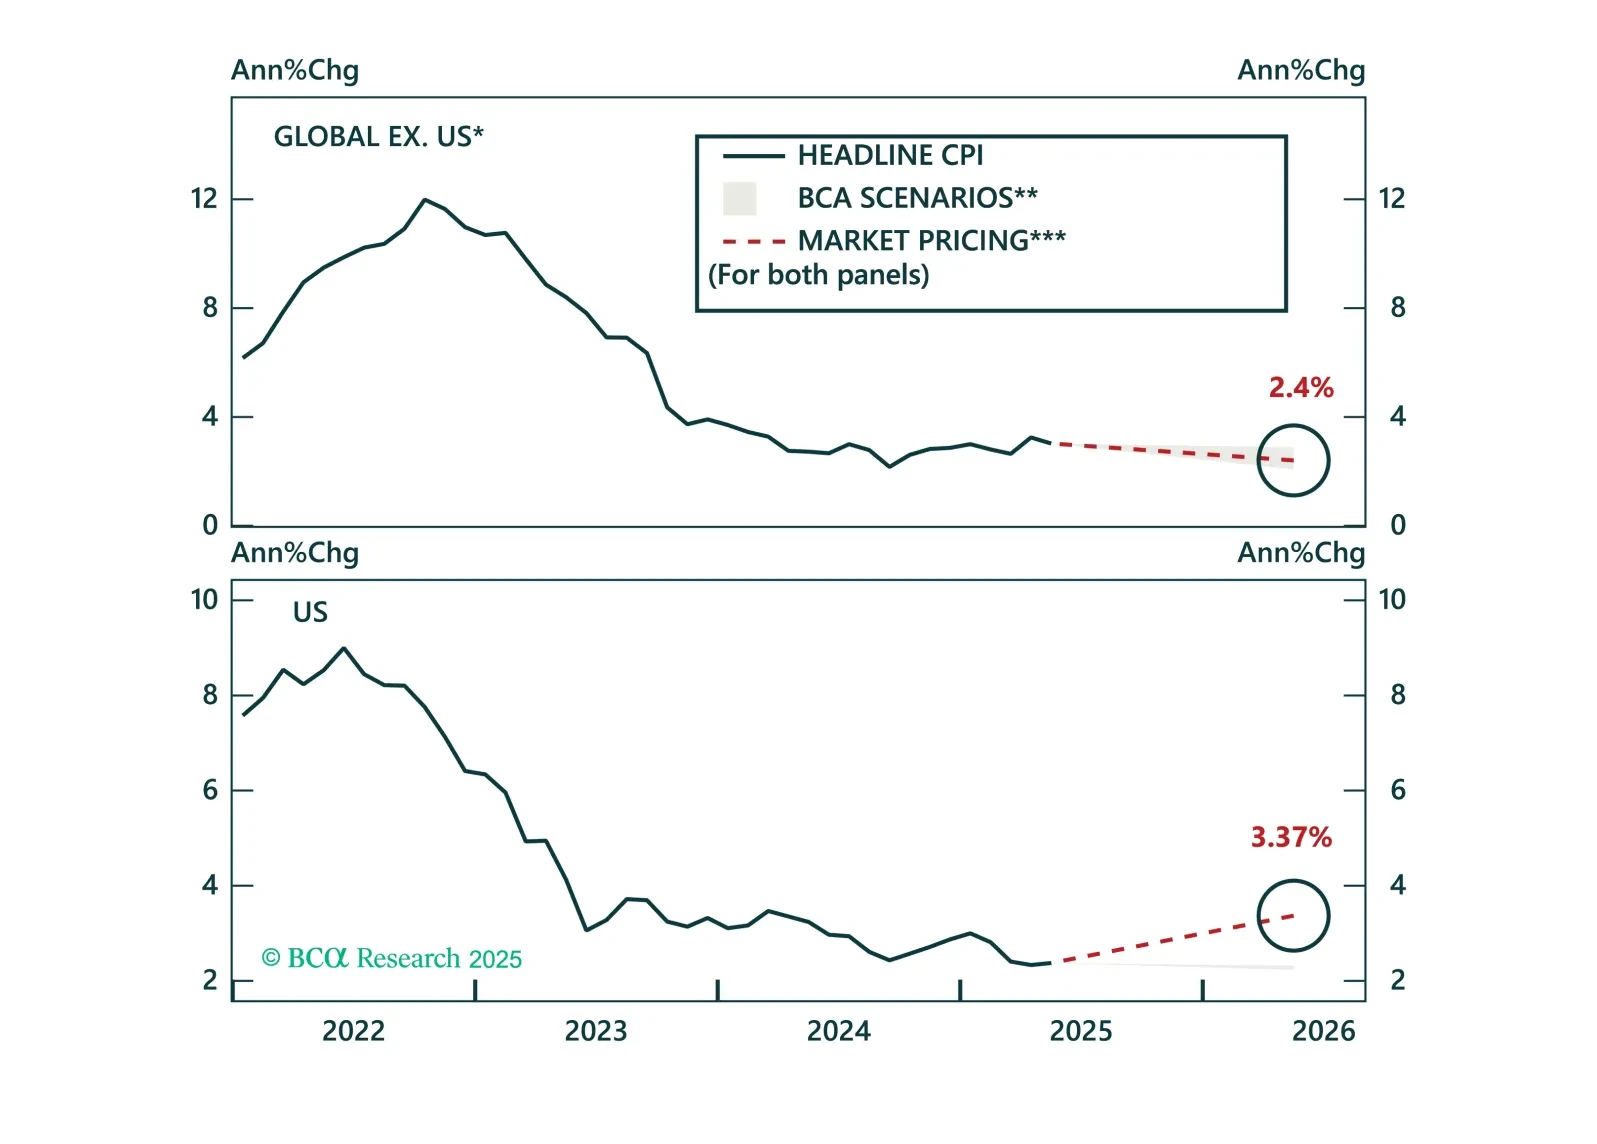
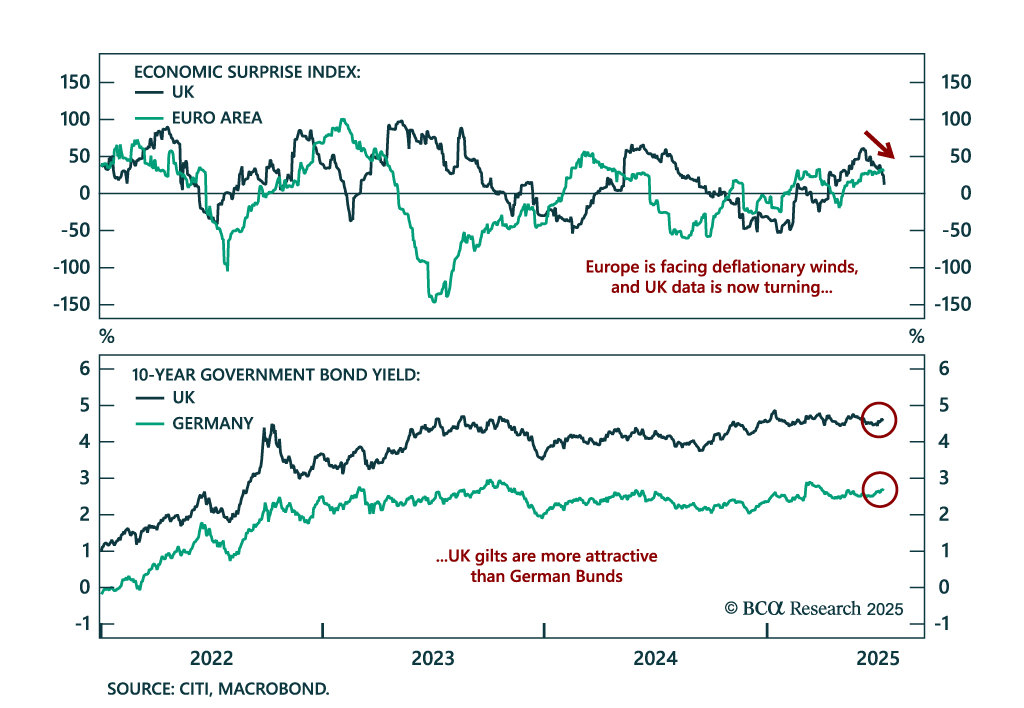
Disinflation continues to unfold globally, and markets are finally catching up. Inflation expectations have broadly realigned with fundamentals, prompting us to shift our global ILB allocation to neutral. While tariff risks are inflating US expectations, pricing in the UK, Japan, and Australia has adjusted sharply. Today’s Strategy Report reviews these developments and updates our country-level ILB positioning.

In this chartbook, we look at the balance of payments across DM and EM countries. The US does not fare well, but neither do a few other countries.