Euro Area

Highlights Uncertainty & Yields: Global bond yields, driven to all-time lows as investors seek safety amid rioting markets, now discount a multi-year period of very weak global growth and inflation. Bond Portfolio Strategy: Maintain overall neutral portfolio duration exposure with so much bad news already priced into yields. Downgrade overall global spread product exposure to underweight versus governments on a tactical (0-3 months) basis given intense uncertainties on COVID-19 and oil markets. Model Bond Portfolio Changes – Governments: Upgrade countries that are more responsive to changes in the level of overall global bond yields and with room to cut interest rates (the US & Canada) to overweight, while downgrading sovereign debt with a lower “global yield beta” and less policy flexibility (Germany, France, Japan) to underweight. Model Bond Portfolio Changes – Credit: Downgrade US high-yield, euro area corporates and emerging market USD sovereigns & corporates to underweight. Feature Chart of the WeekOn The Verge Of Global ZIRP
On The Verge Of Global ZIRP
On The Verge Of Global ZIRP
The title of this report is a quote from a worried BCA client this morning, discussing his daily commute into Manhattan from the New York suburbs. We can think of no better analogy for the mood of investors in the current market panic. After having enjoyed a decade of riding the gravy train of recession-free growth and robust returns on risk assets, all underwritten by accommodative monetary policies, worries about a deflationary bust following the boom have intensified. The global spread of COVID-19, the ebbs and flows of the US presidential election and, now, a stunning collapse in oil prices – markets have simply been unable to process the investment implications of these unpredictable events all at once. At times of such stress, the obvious thing to do is to stand aside and hedge portfolios while awaiting better visibility on the uncertainties. At times of such stress, the obvious thing to do is to stand aside and hedge portfolios while awaiting better visibility on the uncertainties. It is clear that global government bonds have been a preferred hedge, with yields collapsing to record lows worldwide. While most of the market attention has been on the breathtaking fall in US yields that has pushed the entire Treasury curve below 1% as the market has moved to discount a swift move to a 0% fed funds rate. New lows were also hit yesterday in countries that had been lagging the Treasury rally: the 10-year German bund reached -0.85% yesterday, while the 10-year UK Gilt fell to an intraday all-time low of 0.08% with some shorter-maturity Gilt yields actually dipping into negative territory (Chart of the Week). The common driver of yesterday’s yield declines was the 25% plunge in global oil prices after the weekend collapse of the OPEC 2.0 alliance between Russia and Saudi Arabia. The inflation expectations component of global bond yields fell accordingly, continuing the correlation with energy prices seen over the past decade. Yet the real component of global bond yields has also been falling, with markets increasingly pricing in an extended period of weak growth and negative real interest rates – especially in the US. Collapsing US Treasury Yields Discount A Recession, Not A Financial Crisis Chart 2Re-opening Old Wounds
Re-opening Old Wounds
Re-opening Old Wounds
While this latest plunge in US equity markets has been both rapid and powerful, the damage only takes us back to levels on the S&P 500 last seen as recently as January 2019 (Chart 2). The turmoil, however, has reopened old wounds in markets that had suffered their own crises over the past decade, with European bank stocks hitting new all-time lows and credit spreads on US high-yield Energy bonds and Italian sovereign debt (versus Germany) sharply blowing out. The backdrop remains treacherous and global equity markets will likely remain under pressure until the number of new COVID-19 cases peaks outside of China (especially in the US). If there is one silver lining amidst the market carnage, it is that there appears to be few signs of 2008-style systemic financial stress. If there is one silver lining amidst the market carnage, it is that there appears to be few signs of 2008-style systemic financial stress. Bank funding indicators like Libor-OIS spreads and bank debt spreads have widened a bit over the past week but remain at very subdued levels (Chart 3). This is in sharp contrast to classic risk aversion indicators like the price of gold and the value of the Japanese yen versus the Australian dollar, which are closing in on the highs seen during the 2008 global financial crisis and 2012 European debt crisis. Chart 3A Growth Downturn, Not A Systemic Crisis
A Growth Downturn, Not A Systemic Crisis
A Growth Downturn, Not A Systemic Crisis
We interpret this as investors being far more worried about a deep global recession than another major financial crisis. That is also confirmed in the pricing of US Treasury yields, especially when looking at the real yield. Chart 4Does The UST Market Think R* Is Negative?
Does The UST Market Think R* Is Negative?
Does The UST Market Think R* Is Negative?
Chart 5Another Convexity-Fueled Bond Rally
Another Convexity-Fueled Bond Rally
Another Convexity-Fueled Bond Rally
The entire TIPS yield curve is now negative for the first time, even with the real fed funds rate below the Fed’s estimate of the “r*” neutral real rate (Chart 4). The combination of low and falling inflation expectations, and plunging real yields, indicates that the Treasury market now believes that the neutral real funds rate is not 0.8%, as suggested by the Fed’s estimate of r*, but is somewhere well below 0%. With the fed funds rate now down to 0.75% after last week’s intermeeting 50bps cut, the Treasury market is not only pricing the Fed quickly returning to the zero lower bound on the funds rate, but staying trapped at zero for a very long time. The Treasury market is not only pricing the Fed quickly returning to the zero lower bound on the funds rate, but staying trapped at zero for a very long time. Yet that may be too literal an interpretation of the incredible collapse of US Treasury yields. The power of negative convexity is also at work, driving intense demand for long-duration bonds that puts additional downward pressure on yields. Large owners of US mortgage backed securities (MBS) like the big commercial banks have seen the duration of their MBS holdings collapse as yields have fallen. The result is that banks are forced to buy huge amounts of Treasuries (or receive US dollar interest rate swaps) to hedge their duration exposure of negative convexity MBS, hyper-charging the fall in Treasury yields – perhaps over $1 trillion worth of buying, by some estimates.1 This is a similar dynamic to what occurred last summer in Europe, when sharply falling bond yields triggered convexity-related demand for duration from large asset-liability managers like pension funds, further fueling the decline in bond yields (Chart 5). Yet even allowing that some of the Treasury yield decline has been driven by a mechanical demand for duration, a 10-year US Treasury yield of 0.56% clearly discounts expectations of a US recession, as well – which appears justified by the recent performance of some critical US economic data. In Charts 6 & 7, we show a “cycle-on-cycle” analysis of some key US financial and indicators and how they behave before and after the start of the past five US recessions. The charts are set up so the vertical line represents the start of the recession, and we line up the data for the current business cycle as if the latest data point represents the start of a recession. Done this way, we can see if the current data is evolving in a similar fashion to past US economic downturns. Chart 6The US Business Cycle Looks Toppy
The US Business Cycle Looks Toppy
The US Business Cycle Looks Toppy
Chart 7COVID-19 Will Likely Trigger A Confidence-Driven US Recession
COVID-19 Will Likely Trigger A Confidence-Driven US Recession
COVID-19 Will Likely Trigger A Confidence-Driven US Recession
The charts show that the current flat 10-year/3-month US Treasury curve and steady decline in corporate profit growth are both accurately following the path entering past US recessions. Other indicators like the NFIB Small Business confidence survey, the Conference Board’s leading economic indicator and consumer confidence series typically peak between 12-18 months prior to the start of a recession, but appear to be only be peaking now. The same argument goes for initial jobless claims, which are usually rising for several months heading into a recession but remain surprisingly steady of late – a condition that seems unlikely to continue as more companies suffer virus-related hits to their sales and profits and begin to shed labor. Net-net, these reliable cyclical US data suggest that the Treasury market is right to be pricing in elevated recession risk – especially with US cases of COVID-19 starting to increase more rapidly and US financial conditions having tightened sharply in the latest market rout. Bottom Line: Global bond yields, driven to all-time lows as investors seek safety amid rioting markets, now discount a multi-year period of very weak global growth and inflation – most notably in the US. Allocation Changes To Our Model Bond Portfolio The stunning fall in global bond yields has already gone a long way. Yet it is very difficult to forecast a bottom in yields, even with central banks easing monetary policy to try and boost confidence, before there is evidence that the global COVID-19 outbreak is being contained (i.e. a decreasing total number of confirmed cases). By the same token, corporate bonds (and equities) will continue to be under selling pressure until the worst of the viral outbreak has passed. We raised our recommended overall global duration stance to neutral last week – a move that was more tactical in nature as a near-term hedge to our strategic overweight corporate bond allocations in our Model Bond Portfolio amid growing market volatility. Yet with the new stresses coming from the collapse in oil prices and increasing spread of COVID-19 in the US and Europe, we are moving to a much more cautious near-term stance on global credit. Yet with the new stresses coming from the collapse in oil prices and increasing spread of COVID-19 in the US and Europe, we are moving to a much more cautious near-term stance on global credit. This week, we are making the following additional changes to our model bond portfolio to reflect the growing odds of a global recession: Downgrade global corporates to underweight versus global governments Maintain a neutral overall portfolio duration, but favor countries within the government bond allocation that are more highly correlated to changes in to the overall level of global bond yields. Chart 8Favor Higher-Beta Bond Markets With Room To Cut Rates
Favor Higher-Beta Bond Markets With Room To Cut Rates
Favor Higher-Beta Bond Markets With Room To Cut Rates
Given how far yields have declined already, we think raising allocations to “high yield beta” countries that can still cut interest rates, at the expense of reduced weightings toward low beta countries that have limited scope to ease policy, offers a better risk/reward profile than simply raising duration exposure across the board. Such a nuanced argument is less applicable to global corporates, where elevated market volatility, poor investor risk appetite and deteriorating global growth momentum all argue for continued near-term underperformance of corporates versus government bonds. Specifically, we are making the following changes to our recommended allocations, presented with a brief rationale for each move: Upgrade US Treasuries and Canadian government bonds to overweight: Both Treasuries and Canadian bonds are higher beta markets, as we define by a regression of monthly yield changes to changes in the yield of the overall Bloomberg Barclays Global Treasury index (Chart 8). The Fed cut 50bps last week as an emergency measure and has 75bps to go before reaching the zero bound, which the market now expects by mid-year. Additional bond bullish moves after reaching the zero bound, like aggressive forward guidance, restarting quantitative easing and even anchoring Treasury yields in a BoJ-like form of yield curve control, are all possible if the US enters a recession. Meanwhile, the Bank of Canada (BoC) followed the Fed’s cut with a 50bp easing the next day and signaled that additional rate cuts are likely to prevent a plunge in Canadian consumer confidence. The collapsing oil price likely seals the deal for additional rate cuts by the BoC in the next few months. Downgrade Japanese government bonds to maximum underweight: Japanese government bonds (JGBs) are the most defensive low-beta market in model bond portfolio universe, thanks to the Bank of Japan’s Yield Curve Control policy that anchors the 10yr JGB yield around 0%. This makes JGBs the best candidate for a maximum underweight stance when global bond yields are not expected to rise in the near term, as we expect. Downgrade Germany and France to Underweight: The ECB meets this week and will be under pressure to ease policy given recent moves by other major central banks. A -10bps rate cut is expected, which may happen to counteract the recent increase in the euro versus the US dollar, but there is also possibility that ECB will increase and/or extend the size and scope of its current Asset Purchase Program. Given the ECB’s lack of overall monetary policy flexibility, and low level of inflation expectations, we see limited scope for the lower-beta German and French government bonds to outperform their global peers. Remain overweight UK and Australia: While both Australian government bonds and UK Gilts have a “median” yield beta in our model bond portfolio universe, both deserve moderate overweights as there is still the potential for rate cuts in both countries. The Reserve Bank of Australia (RBA) cut the Cash Rate by -25bps last week and they are still open to cut further to boost a sluggish economy hurt by wildfires and weak export demand from China. The RBA will stay more dovish for longer until we will see clear signs of a rebound of the Chinese economy from the COVID-19 outbreak. The Bank of England (BoE) will likely cut its policy rate later this month, or even before the next scheduled policy meeting, as COVID-19 is starting to spread through the UK. Downgrade US High-Yield To Underweight: US junk bonds had already taken a hit during the global market selloff in recent weeks, but the collapse in oil prices pummeled the market given the high weighting of US shale producers in the index (Chart 9). With additional weakness in oil prices likely as Russia and Saudi Arabia are now in a full-fledged price war, US high-yield will come under additional spread widening pressure focused on the weaker Caa-rated segment that contains most of the energy names. We recommend a zero weight in the Caa-rated US junk bonds, within an overall underweight allocation to the entire asset class. Downgrade euro area investment grade and high-yield corporates to underweight: COVID-19 is now spreading faster in Germany and France, after leaving Italy in a full-blown national crisis. The export-oriented economies of the euro area were already vulnerable to a global growth slowdown, but now domestic growth weakness raises the odds of a full-blown recession – not a good environment to own corporate bonds, especially with the euro now appreciating. Downgrade emerging market (EM) USD-denominated sovereigns and corporates to underweight: EM debt remains a levered play on global growth, so the increased odds of a global recession are a problem for the asset class – even with sharply lower interest rates and early signs of a softening in the US dollar (Chart 10). Chart 9Downgrade US Junk Bonds To Underweight
Downgrade US Junk Bonds To Underweight
Downgrade US Junk Bonds To Underweight
Chart 10Still Not Much Broad-Based Weakness In The USD
Still Not Much Broad-Based Weakness In The USD
Still Not Much Broad-Based Weakness In The USD
We will present the new specific model bond portfolio weightings, along with a discussion of the risk management implications of these changes, in next week’s report. Bottom Line: Maintain overall neutral portfolio duration exposure with so much bad news already priced into yields. Downgrade overall global spread product exposure to underweight versus governments on a tactical (0-3 months) basis given intense uncertainties on COVID-19 and oil markets. Upgrade high-beta countries with room to cut interest rates (the US & Canada) to overweight, while downgrading lower-beta countries with less policy flexibility (Germany, France, Japan) to underweight. Downgrade US high-yield, euro area corporates and emerging market USD sovereigns & corporates to underweight. Robert Robis, CFA Chief Fixed Income Strategist rrobis@bcaresearch.com Ray Park, CFA Research Analyst ray@bcaresearch.com Footnotes 1https://www.wsj.com/articles/fear-isnt-the-only-driver-of-the-treasury-rally-banks-need-to-hedge-their-mortgages-1158347080 Recommendations Regional Allocation Spread Product Tactical Trades Yields & Returns Global Bond Yields Historical Returns
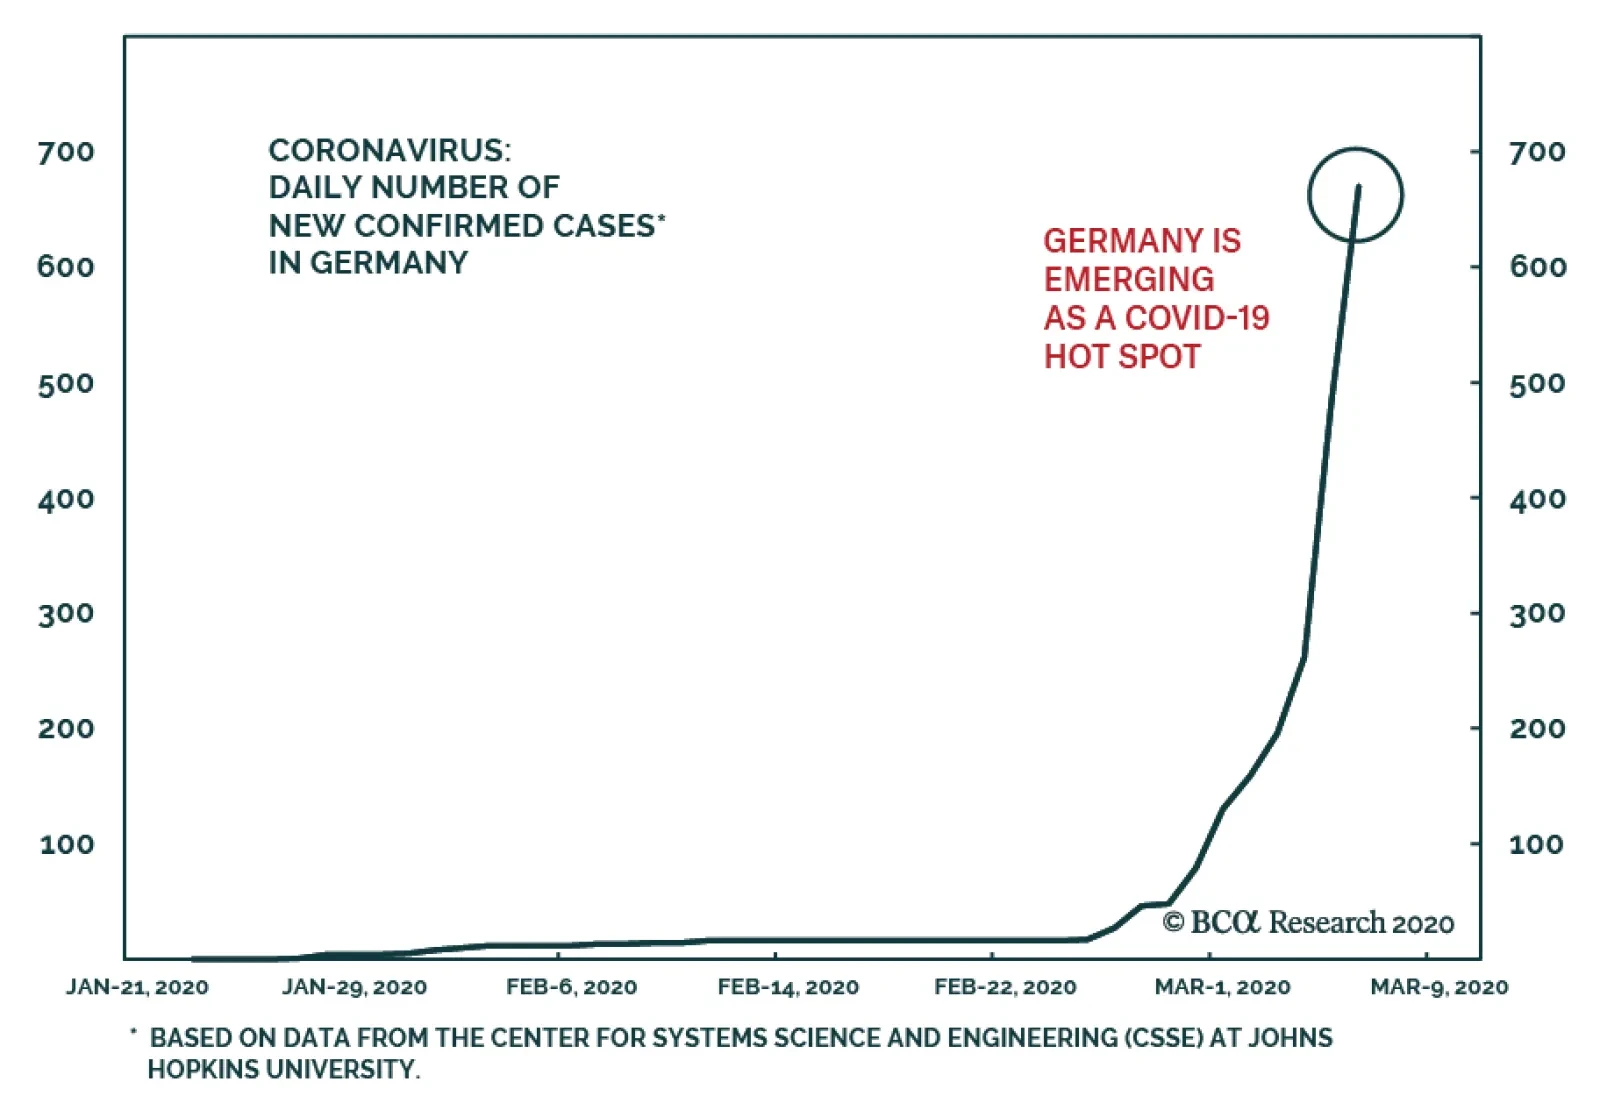
The German economy has suffered its set of woes in 2019, and 2020 is starting poorly. True, factory orders in January improved significantly, but Germany could suffer greatly from COVID-19. First, its industrial economy is very exposed to the supply-side…
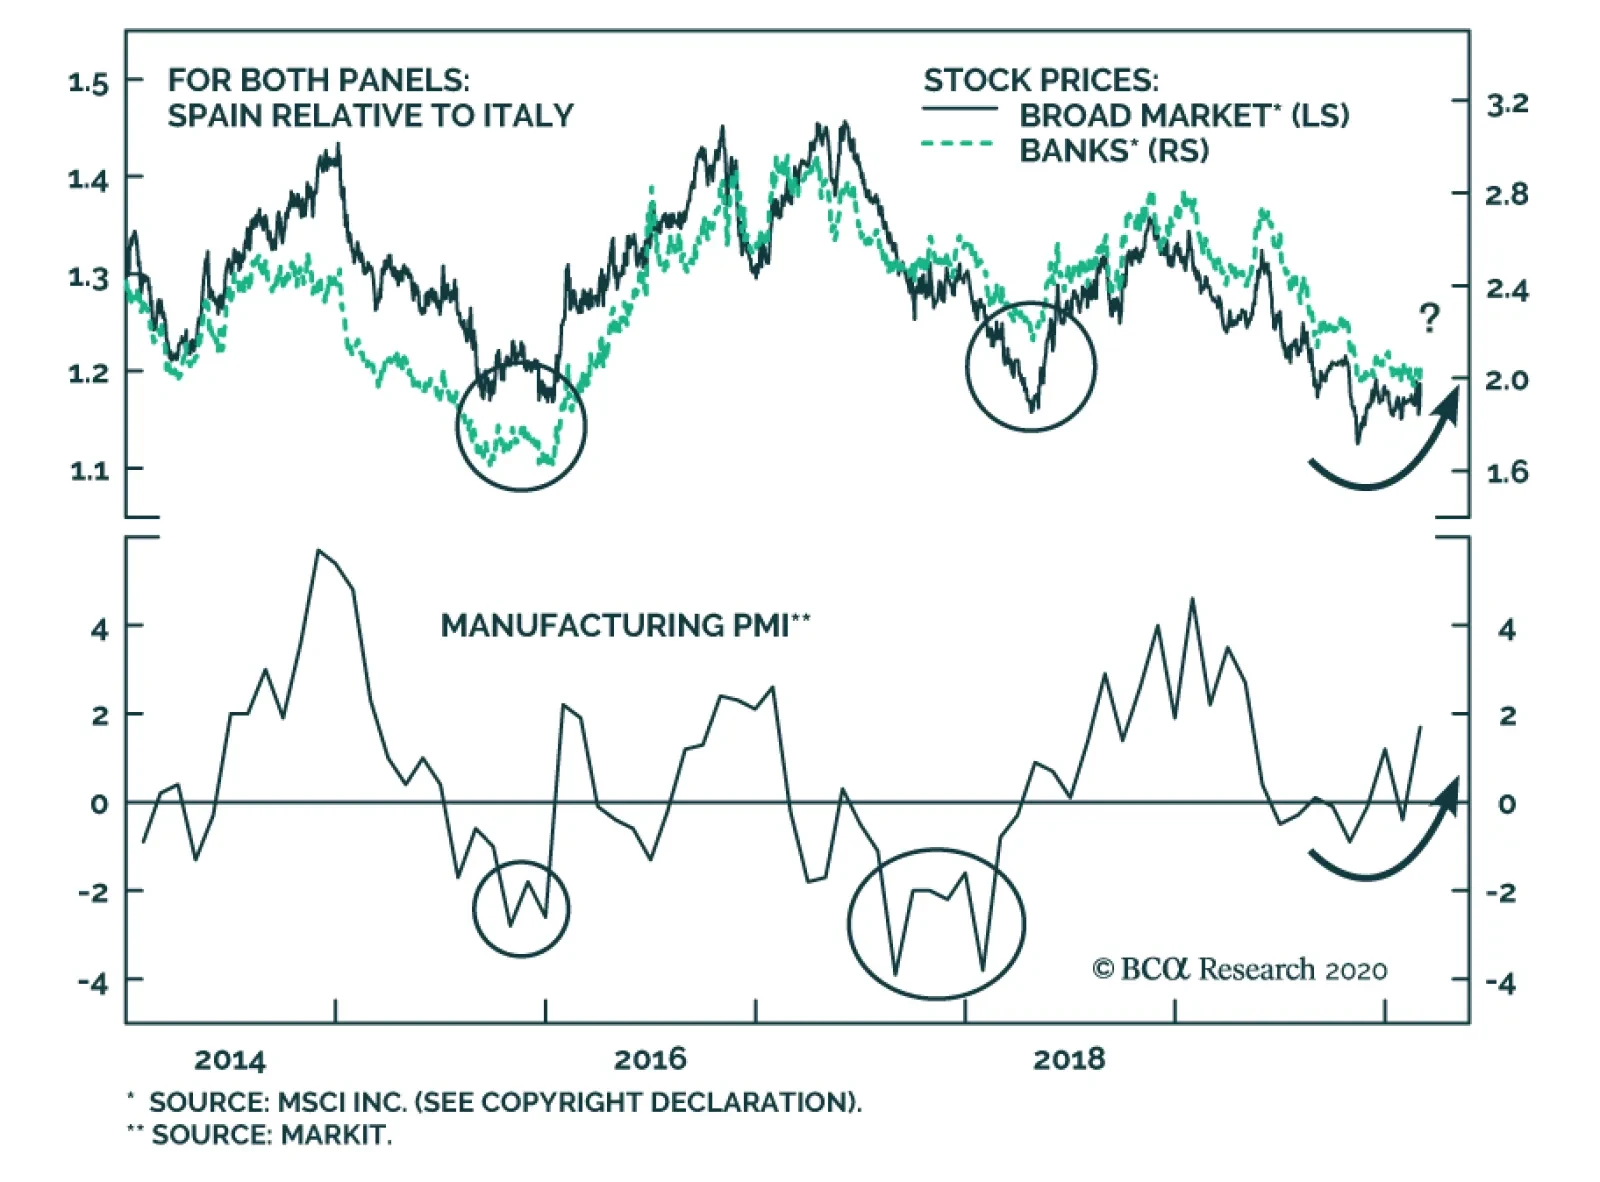
After underperforming through 2019, Spanish equities have become attractive relative to their Italian counterparts for the following reasons: Italy, with 2036 confirmed cases at the time of writing, has become the European epicenter for COVID-19, and…
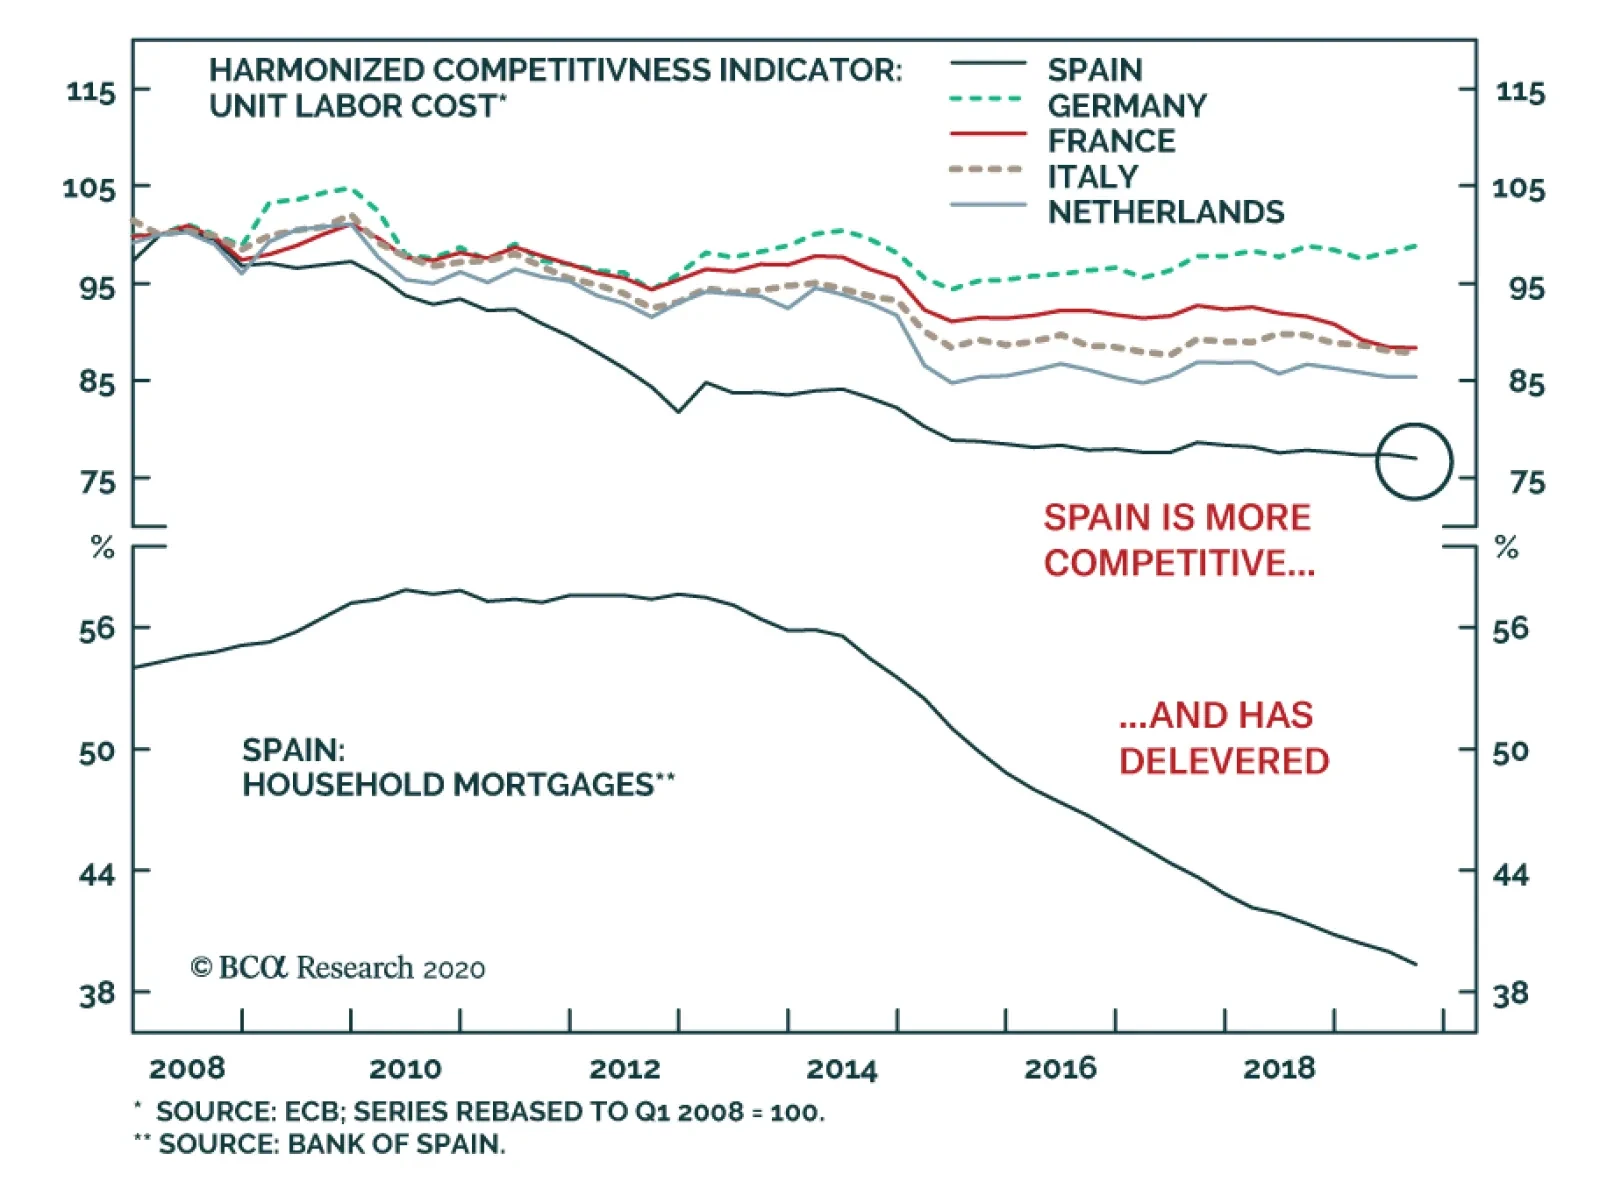
Two key structural factors support the Spanish economy. First, following the collapse in real wages and the productivity-boosting draconian labor market reforms that ensued from the debt crisis, Spanish competitiveness continues to improve. Second, the…
Highlights Policy Responses To The Virus: Markets are now pricing in significant monetary policy easing in response to the growth shock from the COVID-19 outbreak and related financial market instability. It is not yet clear, however, that central banks will NOT ease by as much as currently discounted in the low level of bond yields – especially as risk assets will riot anew if policymakers are not dovish enough. Duration: Raise overall global duration exposure to neutral on a tactical basis (0-3 months) until there is greater clarity on the full magnitude of the hit to global growth from the virus. Spread Product: The widening of global corporate bond spreads during last week’s equity market correction was relatively modest, suggesting that the COVID-19 outbreak has not become a credit event that raises downgrade/default risks. Maintain an overall overweight allocation to global corporates versus government bonds. Downgrade US MBS to neutral, however, given the risk of higher prepayments from falling mortgage rates. Feature What a wild ride it has been for investors. Equity markets worldwide corrected sharply last week as investors were forced to downgrade global growth expectations with the COVID-19 outbreak spreading more rapidly outside of China. US equities were particularly savaged with the S&P 500 shedding -11% of its value in a mere five trading sessions, with the VIX index of implied equity volatility spiking over 40, evoking comparisons to some of the darkest days of the 2008 financial crisis. Chart of the WeekCOVID-19 Concerns Causing Market Jitters
COVID-19 Concerns Causing Market Jitters
COVID-19 Concerns Causing Market Jitters
Government bond yields have collapsed alongside plunging equity values, with the benchmark 10-year US Treasury yield hitting an all-time intraday low of 1.04% yesterday. Investors are betting on aggressive rate cuts by global central bankers to offset weak growth momentum and disinflationary pressures that were already in place before the arrival of COVID-19. At the same time, corporate credit spreads widened worldwide last week, but the moves were relatively subdued and do not signal growing concern over future default losses (Chart of the Week). In this report, we discuss how to best position a global bond portfolio given these competing messages from government bond and credit markets. We conclude that maintaining selective strategic (6-12 months) overweights in global spread product versus governments, while also maintaining a neutral tactical (0-3 months) overall duration exposure - as a hedge against a more “U-shaped” recovery from the virus-driven downturn in global growth - is the best way to position for a backdrop where policymakers will need to be as easy as possible in a more uncertain world. What To Do Next On … Duration Risk assets were staging a massive rebound yesterday as we went to press, after policymakers worldwide signaled the need for stimulus measures to offset the COVID-19 growth shock. Both Fed Chairman Jerome Powell and Bank of Japan (BoJ) Governor Haruhiko Kuroda promised to ease monetary policy, if necessary, to stabilize markets. Meanwhile, looser fiscal policy may finally be on the way in Europe. The government of virus-stricken Italy announced a €3.6 billion stimulus package, while the German Finance Minister has hinted at a temporary suspension of Germany’s constitutional “debt brake” on deficit spending. A true coordinated global easing of both monetary and fiscal policy, would be very bullish for beaten-down growth-sensitive assets like equities and industrial commodities that have been focused on the shutdown of China’s economy in February to combat the spread of the virus. A true coordinated global easing of both monetary and fiscal policy, would be very bullish for beaten-down growth-sensitive assets like equities and industrial commodities that have been focused on the shutdown of China’s economy in February to combat the spread of the virus (Chart 2). It’s a different story for government bonds, however, as a rebound in yields from current depressed levels is not assured, even if monetary policy is eased further. This is because central bankers must maintain a dovish bias until the virus-driven uncertainty over global growth begins to fade, or else risk assets will riot once again. It’s all about financial conditions now, especially in the US where COVID-19 and the stock market selloff have become front-page news in a presidential election year. Chart 2How Quickly Will China Rebound?
How Quickly Will China Rebound?
How Quickly Will China Rebound?
For example, the entire US Treasury curve now trades below the mid-point of the fed funds target range, with the market now pricing in a very rapid dovish move by the Fed (Chart 3). Chart 3A Big Grab For Global Duration
A Big Grab For Global Duration
A Big Grab For Global Duration
Yield curves are now very flat in other major developed market (DM) economies, as well. This is partly due to the risk aversion bid for safe assets, which is evident in the deeply negative term premium component of bond yields. Flat curves also reflect a more long-lasting component, with markets pricing in lower equilibrium rates in the future. Investors are not only demanding immediate rate cuts to boost growth and stabilize financial markets, but also see little chance of those cuts eventually being reversed in the future. Chart 4Markets Increasingly Pricing In Global ZIRP
Markets Increasingly Pricing In Global ZIRP
Markets Increasingly Pricing In Global ZIRP
Our simple proxy for the market expectation of the nominal terminal rate- the 5-year overnight index swap (OIS) rate, 5-years forward – is between 0-1% for all major DM countries (Chart 4). The implication is that investors are not only demanding immediate rate cuts to boost growth and stabilize financial markets, but also see little chance of those cuts eventually being reversed in the future. Chart 5Our Central Bank Monitors Say More Easing Is Needed
Our Central Bank Monitors Say More Easing Is Needed
Our Central Bank Monitors Say More Easing Is Needed
Chart 6Global Yields Reflect Dovish Rate Expectations
Global Yields Reflect Dovish Rate Expectations
Global Yields Reflect Dovish Rate Expectations
At the moment, our global Central Bank Monitors – a compilation of economic and financial variables that influence monetary policy decisions – are all signaling a need for rate cuts (Chart 5). This is a function of sluggish growth & weak inflation. The plunge in global government bond yields already reflects that dovish shift in market expectations for central banks. Our 12-month discounters, which measure the expected change in short-term interest rates over the next year as extracted from OIS curves, are all priced for lower policy rates in the US (-97bps as of last Friday’s close), the euro area (-15bps) the UK (-35bps), Japan (-17bps), Canada (-72bps) and Australia (-46bps) (Chart 6). In the US, the current level of the benchmark 10-year Treasury yield is consistent with the extended slump in US industrial activity – as measured by the fall in the ISM manufacturing index – and risk-off sentiment measures like the CRB Raw Industrials/Gold price ratio (Chart 7). Yet at the same time, financial conditions remain very accommodative despite last week’s selloff, suggesting that the US economy can potentially weather a bout of COVID-19 uncertainty – as long as the Fed does not disappoint by delivering fewer rate cuts than the market is demanding and creating another down leg in the equity market. Chart 7UST Yields Need To Stay Lower For Longer
UST Yields Need To Stay Lower For Longer
UST Yields Need To Stay Lower For Longer
Outside the US, other central banks that have non-zero policy rates – like the Bank of Canada, Reserve Bank of Australia and Bank of England – can deliver on the rate cuts discounted in their OIS curves to fight a COVID-19 global growth downturn, if needed. Chart 8UST Bullishness Still Not At Historical Extremes
UST Bullishness Still Not At Historical Extremes
UST Bullishness Still Not At Historical Extremes
The negative rate club of the ECB and BoJ, however, is far less likely to actually cut rates and will rely on greater asset purchases and forward guidance to try and provide more policy stimulus. We prefer to view duration exposure – on a tactical basis – as a hedge to owning risk assets like corporate bonds, where we see some value now opening up after last week’s selloff, rather than a way to express a directional view on interest rates where we have less visibility and conviction. So what should a bond investor do with duration exposure? It is a difficult call with so many uncertainties on global growth momentum, the spread of the virus outside China, the size of any monetary or fiscal policy stimulus measures, and the degree of risk aversion still evident in financial markets. We prefer to view duration exposure – on a tactical basis – as a hedge to owning risk assets like corporate bonds, where we see some value now opening up after last week’s selloff, rather than a way to express a directional view on interest rates where we have less visibility and conviction. Therefore, we are raising our recommended overall duration exposure to neutral this week on a tactical basis. At the same time, we are maintaining an underweight stance on government bonds versus an overweight on corporate debt. We think a true bottom in yields will be reached when there are more decisive signs that bond positioning has reached a bullish extreme, according to indicators like the JP Morgan duration survey and the Market Vane US Treasury bullish sentiment index (Chart 8). In our model bond portfolio, we are expressing that extension of duration by shifting exposure from shorter maturity buckets to longer duration buckets in most countries. While also increasing exposure to “higher-beta” government bond markets like the US and Canada, at the expense of lower-beta Japanese government bonds. Bottom Line: Raise overall global duration exposure to neutral on a tactical basis (0-3 months) until there is greater clarity on the full magnitude of the hit to global growth from the COVID-19 outbreak. Increase allocations to countries with higher yield betas, like the US and Canada, at the expense of low-beta markets like Japan. What To Do Next On … Spread Product Allocations Chart 9US HY Selloff Was Focused On Energy Names
US HY Selloff Was Focused On Energy Names
US HY Selloff Was Focused On Energy Names
Last week’s equity market meltdown did spill over into corporate bond markets, with credit spreads widening for both investment grade and high-yield corporate debt in the US and Europe. In the US, however, the jump in high-yield spreads was particularly acute among Energy names, with the index option-adjusted spread (OAS) climbing over 1000bps as oil prices plunged (Chart 9). US high-yield ex-energy has been relatively more stable, with the spread climbing to 436bps, despite the surge in equity volatility. Stepping back and looking at US investment grade and high-yield corporates, more broadly, last week’s selloff has restored some value, most notably in high-yield. Stepping back and looking at US investment grade and high-yield corporates, more broadly, last week’s selloff has restored some value, most notably in high-yield. According to our framework for calculating spread targets for global credit, last week’s selloff pushed US investment grade spreads back to our spread targets from very expensive levels (Chart 10).1 Baa-rated US investment-grade moved slightly above our spread target, but we would describe investment grade spreads as now overall fairly valued. US high-yield spreads, on the other hand, have widened well in excess of our spread targets across all credit rating tiers (Chart 11). Chart 10US Investment Grade Spreads Now Fairly Valued
US Investment Grade Spreads Now Fairly Valued
US Investment Grade Spreads Now Fairly Valued
Chart 11US High-Yield Spreads Look Very Cheap
US High-Yield Spreads Look Very Cheap
US High-Yield Spreads Look Very Cheap
In our framework, the spread targets are determined by looking at 12-month breakeven spreads – the amount of spread widening necessary to eliminate the yield cushion of owning corporates over government bonds on a one-year horizon – relative to their long-run history. We group those spreads according to phases of the monetary policy cycle, as defined by the slope of the US Treasury yield curve. The spread target is then calculated based on the median breakeven spread for that phase of the cycle. Currently, we are in “Phase 2” of the policy cycle, which means that the Treasury yield curve (10-year minus 3-year) is positively sloped between 0 and 50bps. In Charts 10 & 11, we add a new wrinkle to our existing way to present the spread targets. We also calculate the targets using the 25th and 75th percentile observations for the breakeven spreads for that phase of the monetary policy cycle. This gives us a range for the spread target that encompasses more of the historical data. Given the improved valuations in US junk bonds, however, we think increasing allocations in our model bond portfolio makes sense. The spread widening in US high-yield has very clearly restored value to spreads, which are well above the upper level of our spread target range. The same cannot be said for US investment grade, where spreads are in the middle of the target range. Chart 12European Corporates Now Offer Better Value
European Corporates Now Offer Better Value
European Corporates Now Offer Better Value
Based on this analysis, we remain comfortable in maintaining our neutral recommended stance on US investment grade corporates and overweight stance on US high-yield. Given the improved valuations in US junk bonds, however, we think increasing allocations in our model bond portfolio makes sense. Thus, this week, we are adding to our recommended high-yield exposure (see Page 12). That increased allocation is “funded” by reducing our US Agency MBS exposure from overweight to neutral. Our colleagues at BCA Research US Bond Strategy are concerned that MBS spreads are likely to widen in the next few months to reflect the higher prepayment risk from the recent steep fall in US mortgage rates. One final note: our spread target framework for euro area corporates also indicates that last week’s global risk-off event also restored some value to European credit (Chart 12). Thus, we are maintaining our recommended overweights for both euro area investment grade and high-yield. Bottom Line: The widening of global corporate bond spreads during last week’s equity market correction was relatively modest, suggesting that the COVID-19 outbreak has not become a credit event that raises downgrade/default risks. Maintain an overall overweight allocation to global corporates versus government bonds. Downgrade US MBS to neutral, however, given the risk of higher prepayments from falling mortgage rates. Robert Robis, CFA Chief Fixed Income Strategist rrobis@bcaresearch.com Footnotes 1 We presented our framework for calculating global corporate spread targets, which builds on the work from our US Bond Strategy sister service, back in January. Please see BCA Research Global Fixed Income Strategy Special Report, "How To Find Value In Global Corporate Bonds", dated January 21, 2020, available at gfis.bcaresearch.com. Recommendations The GFIS Recommended Portfolio Vs. The Custom Benchmark Index
What Bond Investors Should Do After The "Great Correction"
What Bond Investors Should Do After The "Great Correction"
Duration Regional Allocation Spread Product Tactical Trades Yields & Returns Global Bond Yields Historical Returns
Highlights It is too soon to bottom feed with fears of a global pandemic and “socialist” boom in the United States. China’s government will do “whatever it takes” to stimulate the economy – but animal spirits need to revive for it to work. European political risk and policy uncertainty are clearly on the rise, albeit from low levels. Bernie Sanders could become the presumptive nominee for president on Super Tuesday – if Biden fails to make a comeback. The market is underrating the Sanders risk to US equities – particularly tech and health. Assuming pandemic fears subside, the Fed put, the China put, and the Trump reflation put will fuel risk-on sentiment in H2 2020. Feature Chart 1Risk-Off Mood Dominates Markets...
Risk-Off Mood Dominates Markets...
Risk-Off Mood Dominates Markets...
Financial markets awoke to the confluence of negative news this year on February 20. The S&P 500 has fallen 8.0% from this year’s peak while the 10-year US Treasury yield dove to 1.33%. Gold reached the highest level since 2013. The yield curve inverted again (Chart 1). It is too soon to buy into the equity selloff. Fear of the coronavirus is spreading, not abating, while Vermont Senator Bernie Sanders – a democratic socialist who would turn the regulatory pen against corporations – is running away with the Democratic Party’s nomination for US president. Chart 2...Amid Fears Over Coronavirus And Sanders
...Amid Fears Over Coronavirus And Sanders
...Amid Fears Over Coronavirus And Sanders
The market selloff is well correlated with fear of the coronavirus, but there is also some correlation with Sanders’s success (Chart 2). This should intensify if Sanders becomes the presumptive nominee following “Super Tuesday,” March 3, by which time 39% of the Democratic Party delegates will have been chosen. Sanders poses a more systemic risk to corporate profits than the virus as he emblematizes a generationally driven sea change looming over US national policy: a shift from capital to labor. A greater tightening of financial conditions would prompt the Federal Reserve to cut interest rates, possibly as soon as its meeting on March 17-18. But the Fed is not yet signaling cuts. Also, cuts may not pacify the market as easily this time as in the last major pullback in Q4 2018. Tightening monetary policy was the culprit for that selloff and therefore the Fed’s policy reversal on January 4, 2019 gave the market just what it needed to rally. Today the Fed has no control over the causes: virus fears and “socialism.” President Trump is manifestly uneasy as the virus spreads. Anything that weakens the US manufacturing sector is a direct threat to his reelection, regardless of how he spins it. The statewide coincident indicators provided by the Philadelphia Fed show that Pennsylvania’s economy is deteriorating, while a relapse in Michigan will push it into the Democratic camp according to our quantitative election model. This would leave Trump with only Wisconsin standing between him and the shame of a one-term presidency (Chart 3). Chart 3Trump’s Narrow Victory At Risk Of Virus-Induced Slowdown
GeoRisk Update: Leap Year, Or Steep Year?
GeoRisk Update: Leap Year, Or Steep Year?
What can Trump do to feed the markets and economy some good news? Not much. The Democrats control the House of Representatives and will refuse any fiscal stimulus unless a total collapse is occurring, in which case Trump is doomed anyway. Given the strong dollar, the Fed’s reluctance to cut rates, and Trump’s paternalist proclivities, we can fully envision him attempting to strong-arm the Treasury Department into intervening against the dollar. But intervention would have a fleeting impact without Fed cooperation – and again, the economic crisis required for the Fed to intervene decisively would likely seal Trump’s fate regardless. What remains for Trump is his ability to enact surprise “rate cuts” of his own via tariff rollback on China. This is fully within his power. All he has to do is hold a phone conference with Xi Jinping and then declare that China is complying with the “phase one” trade deal in good faith and therefore deserves assistance amid the coronavirus economic shock. But the impact of a positive tariff surprise would be limited. And such rate cuts are likely to be reactive rather than proactive, as with the Fed. We shifted to a cautious, neutral stance on global risk assets on January 24 and we maintain that position. China is stimulating the economy, meaning that the dominant trend in H2 should be a global “risk on.” Thus we are keeping our China and emerging market trades open. But volatility will likely remain elevated through March, at minimum, given the toxic combination of a slowing global economy and an increasingly likely Sanders nomination. China Stimulus: "Whatever It Takes" Chart 4Xi Administration Is Getting Out The Big Guns
Xi Administration Is Getting Out The Big Guns
Xi Administration Is Getting Out The Big Guns
One near certainty of the coronavirus outbreak is that it will catalyze greater economic stimulus in China. Last year we argued that the trade war had derailed Beijing’s financial deleveraging agenda and hence that the risk of a stimulus overshoot was greater than an undershoot. The Xi Jinping administration limited the degree of reflation for most of the year, but by autumn it was incontrovertible: stabilizing growth and the labor market had taken priority over deleveraging. Local government bond issuance picked up and the government relaxed its grip on informal lending and the shadow banks (Chart 4). Now, with the coronavirus outbreak, the Xi administration is getting out the big guns. The People’s Bank of China has cut key interest rates below where they stood in 2015-16, the last major bout of stimulus (Chart 5), as our China Investment Strategy has noted. Beijing officials have announced they will dial up fiscal policy to build infrastructure and boost purchases of homes and cars. President Xi Jinping has personally assured the world that China will meet its economic growth target for the year. Compared with the 6.1% real GDP growth achieved in 2019, our China Investment Strategy believes a conservative estimate is 5.6% for 2020. Assuming China’s real GDP growth slows to 3.5% in Q1 on a year-over-year basis, China would need at least 6.3% average real growth year-over-year for the next three quarters to hit its target. This growth rate would be 0.3 percentage points higher than in the second half of 2019. Credit expansion and government spending in the next six-to-12 months would need to outpace that of last year. Will the government succeed in firing up demand? If getting back to work results in further outbreaks, then China may see greater difficulty in using its old-fashioned stimulus tools. Moreover Chinese households and corporates are more indebted than ever and have suffered a series of blows in recent years that have weighed on animal spirits: a political purge, slowing trend growth, corporate deleveraging, trade war, and now the virus. It is essential for consumer confidence and the velocity of money to keep recovering (Chart 6). Our Emerging Markets Strategy rightly insists that without a revival in animal spirits, stimulus will be pushing on a string. Chart 5Key Chinese Interest Rates Now Below 2015-16 Levels
Key Chinese Interest Rates Now Below 2015-16 Levels
Key Chinese Interest Rates Now Below 2015-16 Levels
Chart 6Animal Spirits A Precondition For Chinese Recovery
Animal Spirits A Precondition For Chinese Recovery
Animal Spirits A Precondition For Chinese Recovery
Yet it is also true that most of the negative shocks were policy decisions, especially deleveraging and trade war. With these decisions reversed – and likely to stay that way for at least this year – there is no reason to assume a priori that animal spirits will remain depressed. Furthermore, we see little room for the Xi administration to revert to tightening measures until a general economic recovery is well advanced. As we highlighted in our annual strategic outlook, it is necessary to stabilize the economy ahead of the 100th anniversary of the Communist Party in 2021 and – more importantly – the leadership reshuffle to take place in 2022. Chinese consumer confidence and the velocity of money need to recover for stimulus to have an impact. On a side note, Hong Kong is also implementing stimulus measures. This is positive for the city-state in the short run but it is unlikely to revive its fortunes over the long run. What made Hong Kong special was its position as a well-governed ally of the West during the heyday of globalization and the backdoor to mainland China during its rapid, catch-up phase of industrialization. Now globalization is slowing, Beijing is tightening central control, and the West has lost the appetite to defend its influence in Hong Kong. This influence is part and parcel with Hong Kong’s freedoms and privileges. This means that while the country’s equities can see a cyclical improvement we are structurally negative. Bottom Line: We are maintaining our cyclically constructive outlook on global growth and risk assets, as our view on China’s “Socialism Put” has been reinforced. We are keeping open our China Play Index and other EM trades. However, near-term risks are extremely elevated and our cyclical view could change quickly if the virus fear factor proves insurmountable for China and the global economy. China Sneezes, Europe Catches A Cold … And Its Immune System Is Weak Chart 7Our European GeoRisk Indicators Are Springing Back
Our European GeoRisk Indicators Are Springing Back
Our European GeoRisk Indicators Are Springing Back
The European economy was on track to rebound in 2020 prior to the coronavirus, but only tentatively, as sentiment and manufacturing were fragile. The virus struck at the heart of demand for European exports, China, and now is hitting European demand directly via the outbreak in Italy and across the continent. As fear of the virus spreads country by country, households and corporations will cut back on activity. It could take weeks or even months to resume business as usual. And it will take 6-12 months for China’s stimulus to kick in fully and lift demand for European goods. European political risk is thus no longer slated to remain subdued. Our indicators already show it is springing back. The most significant player is Germany, but Italy is the weakest link in the Euro Area, and non-negligible risks are affecting France, Spain, and the United Kingdom (Chart 7). German political risk will be highly market-relevant between now and the federal election slated for October 2021. De-globalization is a structural headwind for the German economy and Chancellor Angela Merkel’s attempt to stage manage a smooth succession has collapsed. The Christian Democratic Union is now plunging into a truly competitive leadership contest that will keep uncertainty elevated, at least until the aftermath of the election. Friedrich Merz is the leading contender (Chart 8) and is attempting to rope more conservative voters back into the Christian Democratic fold so that they do not stray into the populist Alternative für Deutschland (AfD). While a similar dynamic led the British Conservative Party into Brexit, German politics are less polarized than British politics. The Christian Democrats are nowhere near being overtaken by the far right. First, the CDU is still the most popular party and its closest competitors are the Green Party and the Social Democrats, while the AfD polls at 13.3% support and is opposed by all other parties. The AfD’s popularity, while growing, is still very small. Second, a majority of the public still approves of Merkel (Chart 9), signaling a tailwind for centrists within and without her party. Chart 8Merz Is The Top Contender In Germany’s Leadership Contest
GeoRisk Update: Leap Year, Or Steep Year?
GeoRisk Update: Leap Year, Or Steep Year?
Third, the German public is still the most supportive of the euro and EU, for the obvious reason that its economic success is integrally bound up in the union (Chart 10A). Nor is Germany alone, since the only country that looks truly concerning by these measures is Italy and even Italy’s populists remain engaged in the European project (Chart 10B). Chart 9Merkel's Popularity A Sign Of German Centrism
Merkel's Popularity A Sign Of German Centrism
Merkel's Popularity A Sign Of German Centrism
Chart 10ASupport For The Euro Still Strong (But Watch Italy) (I)
Support For The Euro Still Strong (But Watch Italy) (I)
Support For The Euro Still Strong (But Watch Italy) (I)
Chart 10BSupport For The EU Still Strong (But Watch Italy) (II)
Support For The EU Still Strong (But Watch Italy) (II)
Support For The EU Still Strong (But Watch Italy) (II)
Immediate economic challenges favor Merz’s bid to lead the party. However, if they do not give way to an economic rebound by fall 2021 (i.e. if Chinese and global growth worsen in the lead-up to the general election), then these challenges will undercut the Christian Democrats’ bid to remain in power regardless of whether Merz or a more dovish chancellor-candidate emerges from Merkel’s exit. The Green Party offers a viable alternative to lead the next government. Chart 11Coronavirus Will Weigh On France's Tourism Sector And Macron's Popularity
Coronavirus Will Weigh On France's Tourism Sector And Macron's Popularity
Coronavirus Will Weigh On France's Tourism Sector And Macron's Popularity
In the short run, Germany can ease fiscal policy marginally to help offset the current slowdown. But a game changer in fiscal policy will require either for the current economy to collapse or a resolution to the succession crisis. Finance Minister Olaf Scholz, of the Social Democrats, has just proposed a significant revision to the schuldenbremse, or “debt brake,” which keeps budget deficits pinned above -0.35% of GDP. He would allow Germany’s state and local governments to suspend the debt brake temporarily so as to boost fiscal spending to mitigate the slowdown. A formal suspension requires a constitutional change that would in turn require a two-thirds vote in both houses of the legislature. There are enough votes in the Bundestag and possibly in the Bundesrat but it requires the economic shock to get bigger first so as to force the conservatives to capitulate and court the help of smaller parties. Otherwise Scholz is making an election gambit to distinguish the Democratic Socialists from the fiscally conservative Christian Democrats. In the meantime, limited moves to loosen the belt are perfectly countenanced by existing law which allows for deviations from the debt brake during recessions and emergencies. France is also seeing a spike in political risk. President Emmanuel Macron has slogged through the massive labor strikes against his pension reform, as we expected. The reform would streamline a complex web of pension programs into a single national program, providing incentives for workers to work longer without making spending cuts. It will likely pass into law through his En Marche party’s control of the National Assembly. However, Macron’s political capital is spent and his party is expected to sustain heavy losses in municipal elections from March 15-22. The service-oriented economy will also suffer a blow from reduced tourism amid the coronavirus scare (Chart 11), further eroding Macron’s already low popularity. The loss of influence at home will reinforce Macron’s pivot to foreign policy. Macron can play the leader of Europe at a time when the UK is leaving and Germany is consumed with a leadership contest. In this role he will clash with the UK over Brexit and the US over trade – but this can only go so far given the need to sustain the French economy. Negotiations with the UK will involve brinkmanship but will result in a delay of the end-of-year deadline, or a deal, given the fragile economic backdrop affecting all players. Economic constraints also imply that negotiations with the US will not spiral into a major confrontation unless and until Trump is reelected. Therefore Macron’s gaze will turn to security and immigration, challenges that have the potential to fuel anti-establishment sentiment that could hurt him in the French election of 2022 and undermine his vision of a more integrated Europe. While terrorism has abated for the time being (Chart 12), the trend cannot be guaranteed. The Middle East is extremely unstable amid the global slowdown, virus, drop in oil prices, and general destabilization emanating from the underlying US-Iran conflict. Immigration is also starting to rise again, particularly along the western North African route into Spain and France that bypasses the fighting in Libya (Chart 13). Chart 12A Pickup In Terrorism Would Fuel Populist Sentiment...
A Pickup In Terrorism Would Fuel Populist Sentiment...
A Pickup In Terrorism Would Fuel Populist Sentiment...
Turkey’s foreign policy confrontation with the West threatens an increase in immigration in the east as well as a Turkish client-state in western Libya that France fears could become a militant safe haven. Chart 13...As Would An Increase In Immigration
...As Would An Increase In Immigration
...As Would An Increase In Immigration
France is therefore taking a harder line with Turkey and providing maritime assistance to Greece (see Chart 13 above). The Mediterranean is becoming a geopolitical hot spot that could lead to negative surprises – and not only for Turkish assets. European populism is under control for now but a new wave of immigration would spark a new wave of populism that would increase policy uncertainty and the risk premium in equities. Italy has shifted from being an overstated to an understated political risk. Chart 14Italian Right-Wing Parties Are Gaining Strength
Italian Right-Wing Parties Are Gaining Strength
Italian Right-Wing Parties Are Gaining Strength
Politically, Italy remains the weakest link in Europe – and this long-term risk is now becoming more pressing. Support for the euro and EU is among the weakest (see Chart 10 above). The ruling coalition is rickety and groping toward an election, with a popular referendum on the electoral law dated March 29. The country is poorly equipped to handle the virus outbreak. The virus will also call attention to the porous borders, fueling anti-establishment sentiment – after all the anti-establishment League is still the top party in polls while the right-wing Brothers of Italy’s support is surging (Chart 14). This is the case even though immigration into Italy is under control at the moment, particularly with renewed fighting in Libya discouraging flows through the central North African route. In short a full-fledged recession will unleash the furies in Italian politics and the country has shifted from being an overstated to an understated political risk. Bottom Line: The UK-EU trade talks threaten volatility for the pound this year, on top of the key continental risks: succession crisis in Germany, the potential for Macron’s centrist political movement to falter in France, and the possible election of a right-wing anti-establishment government emerging in Italy. Populist sentiment can emerge from the economic slowdown even if terrorism and immigration remain contained, but the recent uptick in immigration and new sources of instability in the Middle East, North Africa, and the Mediterranean show clouds gathering on the horizon. The Euro Area’s fiscal thrust is expected to be a measly 0.015% of potential GDP in 2020. The trends above suggest that this number could increase substantively, albeit reactively, due to fiscal easing in Germany and several other states along with France’s lack of real cuts in its pension reform. United States: Can A Northern Progressive Win In The South? In February 1980, Democratic presidential contender Jimmy Carter won the New Hampshire primary with 51% of the vote. Carter would go on to become the first Democrat from the Deep South to win the presidency since Woodrow Wilson. His triumph in New Hampshire proved, as he said, “that a progressive southerner can win in the North.” Fast forward to February 2020 and Vermont Senator Bernie Sanders, the most left-wing candidate vying for the nomination, is attempting to perform the equally dazzling feat of winning a primary election in the conservative southern state of South Carolina. If Sanders pulls it off then it will trigger an earthquake. For a progressive who can win in the South is likely to score big on Super Tuesday, March 3, and if Sanders pulls that off then he will become the country’s first “socialist” presumptive nominee for president (Chart 15). This would be a huge upset, primarily for former Vice President Joe Biden, who has long led the opinion polls in South Carolina and recently has even rebounded. Biden expects strong support from the African American community – which is staunchly Democratic, moderate in ideology, and favorable toward Biden due to his close association with former President Barack Obama. The problem is that Biden’s latest rebound in the polls may be too little, too late. He made more gaffes in the debate performance and, most importantly, Sanders’s polling has improved among African Americans (Chart 16). Chart 15A Sanders Win In The South Will Help Him Score Big On Super Tuesday
GeoRisk Update: Leap Year, Or Steep Year?
GeoRisk Update: Leap Year, Or Steep Year?
Chart 16Sanders’s Polling Has Improved Among African-Americans
GeoRisk Update: Leap Year, Or Steep Year?
GeoRisk Update: Leap Year, Or Steep Year?
Sanders performed well with almost every demographic in Nevada – if he can do well among blacks, and in the south as well as the north and west, then his ability to unify the party will be incontrovertible and moderate Democratic primary voters looking for a winner will start to resign themselves to his nomination. What is more likely is that Biden wins in South Carolina, declares himself the “comeback kid,” and prolongs the uncertainty regarding the Democratic nomination. Chart 17A Biden Win In Texas Would Reenergize The Establishment
GeoRisk Update: Leap Year, Or Steep Year?
GeoRisk Update: Leap Year, Or Steep Year?
If South Carolina propels Biden to a strong performance on Super Tuesday, particularly a win in Texas, it could usher in a new phase of the primary election since it would suggest the possibility that the establishment has not lost the nomination and is striking back against Sanders (Chart 17). Failing that, any “Never Sanders” movement will face an uphill battle. After March 3, about 39% of the Democratic Party’s delegates will be “pledged,” or committed, to one of the candidates. Two weeks later, fully 61.5% of delegates will be chosen. Which means that the best chance for a conservative counter-revolution against Sanders comes over the next three weeks. Regardless of South Carolina, Biden’s structural limitation on Super Tuesday is the well-known phenomenon of vote-splitting. Five centrist candidates are dividing the moderate vote, leaving Sanders to engross the 40%-45% of the vote that is progressive all to himself.1 This is a compelling reason to believe that Sanders will continue to amass the most delegates. What would change the equation would be a mustering of the centrists under a single competitive candidate. The latter requires candidates to be forced out of the race through defeat or to drop out of the race willingly for the good of the party. If Mayor Pete Buttigieg or Senator Amy Klobuchar should fall short of the 15% to qualify for delegates in South Carolina, they would need to bow out of the race (they might be persuaded by promises of high appointments). Most importantly, if Biden should squander South Carolina then he would need to take one for the team and drop out, passing the baton to Bloomberg. It will be hard for any one of these politicians to quit unless it is coordinated with the others; he or she would have to forgo any hopes of emerging at the top of the ticket at a contested Democratic National Convention in July. If coordination fails, the centrist vote will become even more fragmented when Mayor Michael Bloomberg finally appears on the ballot on March 3. Last week we argued that if Sanders cannot clinch the nomination by winning a majority of the delegates by June, then he needs to win a commanding plurality of the delegates so that moderate unpledged delegates are forced to capitulate and vote for him at the Democratic National Convention. We argued that for this to happen he needs, at minimum, to improve upon his score in 2016, which was 43% of the popular vote and 40% of the delegate count. Otherwise, a sequential voting procedure among roughly equally weighted blocs will likely lead to his defeat, as the two other factions of the party (establishment Washington insiders like Biden and centrist Washington outsiders like Bloomberg) view Sanders-style socialism as their least preferred option. Is this 40%+ threshold enough? Nobody knows. Clearly it is harder to win the nomination with 40% of the delegates than with 49%, even if you are in first place. But if Sanders leads by double digits in terms of the share of delegates, has captured 43%+ of the popular vote, and has won the big swing state primaries across regions, then it will be hard for Democratic delegates to conclude that he is not the most competitive in the general election. Currently Sanders is slated to win California, Michigan, Wisconsin, Pennsylvania, Ohio, and possibly Texas. This is a strong argument for moderate unpledged delegates to swing behind him. It is even compelling for some of the Democratic Party’s “super delegates,” at least those who are wavering. Otherwise these party elders would break up an enormous amount of momentum in the name of a less popular Democratic candidate – and strengthen Trump. Bottom Line: Super delegates will vote as political actors facing constraints inherent in their situation. If the situation is that Sanders has won 43% of the vote, leads the next candidate by double digits, has won the most primary elections, and has won in the major states, including the swing states, then it will be a compelling constraint on voting against him. Investment Conclusions The daily new cases of the coronavirus outside China continues to surge, creating near-term headwinds for global risk assets. Ultimately the negative shock of the virus may be overstated, but we remain on the sidelines of any near-term equity rally due to the confluence of a global demand shock and a US socialism boom. With manufacturing already vulnerable, the coronavirus, insofar as it causes a harder hit to global and hence American manufacturing, is a threat to Trump’s reelection odds. This is true regardless of who takes the Democratic nomination. It is also true notwithstanding that pandemic risks may ultimately fuel xenophobic sentiment. Trump cannot argue his way out of rising unemployment in the Rust Belt. The market is underrating the Sanders risk to health care and technology stocks. This means that Sanders has a greater chance of winning the White House than the consensus holds. Financial markets should continue to discount his rising odds, at least until it becomes clear either that he is falling short of a strong plurality or that the global economy is shaking off its jitters. As the financial market stumbles Sanders will get more steam than other candidates, while Trump’s odds will suffer, which is a potentially self-reinforcing dynamic. Looking at the correlations between different candidates and US equity sectors, the market is underrating the Sanders risk to health care and technology stocks (Table 1). Sanders poses a threat to regulation in these spheres even if the Democrats do not take a majority in the Senate. And they are likely to take the Senate and have a one-seat majority in the event that they prove capable of ousting Trump (via the vice president). Table 1The Market Is Underrating The Sanders Risk To US Equities
GeoRisk Update: Leap Year, Or Steep Year?
GeoRisk Update: Leap Year, Or Steep Year?
Ultimately Trump’s reelection also represents a threat to the tech sector, due to a “Phase Two” trade war, but the initial market reaction is likely to be risk-on. Assuming our base case that the virus fear eventually subsides, people get back to work, the world economy regains its footing, and monetary and fiscal stimulus get pumping (especially in China), the swing state economies may well be banging by November. In that context, the three pillars of our bullish 12-month view will be restored: the Fed put, the China put, and Trump’s reelection as a “buy the rumor, sell the news” phenomenon. Matt Gertken Vice President Geopolitical Strategist mattg@bcaresearch.com Footnotes 1 This assumes Senator Elizabeth Warren of Massachusetts continues to fall short of the 15% threshold qualifying a candidate to receive pledged delegates to the Democratic National Convention. Appendix Germany
Germany: GeoRisk Indicator
Germany: GeoRisk Indicator
France
France: GeoRisk Indicator
France: GeoRisk Indicator
Italy
Italy: GeoRisk Indicator
Italy: GeoRisk Indicator
Spain
Spain: GeoRisk Indicator
Spain: GeoRisk Indicator
UK
UK: GeoRisk Indicator
UK: GeoRisk Indicator
Canada
Canada: GeoRisk Indicator
Canada: GeoRisk Indicator
China
China: GeoRisk Indicator
China: GeoRisk Indicator
Taiwan
Taiwan: GeoRisk Indicator
Taiwan: GeoRisk Indicator
Korea
Korea: GeoRisk Indicator
Korea: GeoRisk Indicator
Russia
Russia: GeoRisk Indicator
Russia: GeoRisk Indicator
Brazil
Brazil: GeoRisk Indicator
Brazil: GeoRisk Indicator
Turkey
Turkey: GeoRisk Indicator
Turkey: GeoRisk Indicator
Section III: Geopolitical Calendar
Highlights For stock markets, the best inoculation against Covid-19 is ultra-low bond yields. Our tactical underweight to equities versus bonds achieved its 5 percent profit target and is now closed. We are now awaiting the fractal signal to go tactically overweight (Chart of the Week). Price to sales is a much better predictor of 10-year returns than is price to earnings, especially when profit margins are stretched as they are now. New long-term recommendation: overweight Swedish equities versus bonds. Germany and Switzerland also offer attractive excess 10-year equity returns over bonds. Fractal trade: the 130 percent outperformance of palladium versus nickel in just six months is now technically stretched. Chart of the WeekStocks Are Approaching Oversold – Stay Tuned
Stocks Are Approaching Oversold - Stay Tuned
Stocks Are Approaching Oversold - Stay Tuned
For Stock Markets, The Best Inoculation Against Covid-19 Is Ultra-Low Bond Yields A global slowdown, exacerbated by the Covid-19 virus contagion, is dominating the news and financial headlines. There are worries that the stock market is still in denial and has a long way to fall – rather like Wile E. Coyote suspended in disbelief as he runs over the cliff-edge. In fact, some of the most economically sensitive equity sectors have already fallen a long way. For example, the oil and gas sector is down by 20 percent (Chart 2). Chart I-2Economically Sensitive Sectors And Bond Yields Have Plunged
Economically Sensitive Sectors And Bond Yields Have Plunged
Economically Sensitive Sectors And Bond Yields Have Plunged
Meanwhile, bond yields have plunged to new lows, and in some cases all-time lows. Hence, we are pleased to report that our tactical underweight to equities versus 10-year bonds, initiated on January 9, has achieved its 5 percent profit target and is now closed.1 We are now awaiting the fractal signal to go tactically overweight. Bond yields have plunged to new lows. Having said that, when the world economy is set to grind to a halt in the first quarter, and halfway to a recession, is a 5 percent underperformance of equities versus bonds enough? There is certainly scope for some further downside, but for investors with a multi-year horizon, equities still win the ugly contest versus bonds. Where bond yields are approaching the lower limit to their yields – around -1 percent – it means they are approaching the upper limit to their prices. Hence, bonds become a ‘lose-lose’ proposition. Bond prices cannot rise much further, even in an economic slump, but they can fall a lot if sentiment suddenly recovers. As the riskiness of bonds rises relative to equities, the prospective return that investors will accept from equities rapidly collapses to the ultra-low level of bond yields. And as valuation is just the inverse of prospective return, this underpins and justifies an exponentially higher valuation of equities. How can we best gauge the prospective (long-term) returns that equities now offer? To answer this question, we need to take a Japanese lesson. A Japanese Lesson: Price To Sales Is The Best Predictor Of Prospective Return A great advantage of being a European investor is that the difficult investment questions have already been asked and answered by our friends in Japan – so we just need to take some Japanese lessons. One of the most important lessons is that the Japanese stock market’s price to sales multiple has a near-perfect predictive record for Japanese 10-year returns since the 1980s.2 For world equities, market capitalisation to GDP (which broadly equates to price to sales at a world level) also has a near-perfect predictive record for 10-year returns since the late 1990s.3 The corollary lesson is that the price to earnings multiple – either based on 12-month trailing or 12-month forward earnings – is not such a good predictor of prospective return. Price to earnings wrongly pinpointed Japan’s highest valuation in 1994 rather than at the peak of the bubble in 1989. Moreover, since 2000, price to earnings has suggested that Japan’s stock market is cheaper than it truly is, and grossly overestimated prospective returns. Price to earnings made the same mistake for world equities in the mid-noughties, understating valuations and thereby overestimating prospective returns. The trouble with price to earnings is that it takes no account of the likely evolution of profit margins – treating a stock market multiple of, say, 30 on a high profit margin the same as 30 on a low profit margin. The problem is that when the market is trading at 30 on a low margin it has the capacity for higher profit growth through margin expansion – and thereby a higher prospective return – than when it is trading at 30 on a high margin (Chart 3). Chart I-3Price To Earnings Takes No Account Of Changing Profit Margins
Price To Sales Has An Excellent Predictive Record In Japan...
Price To Sales Has An Excellent Predictive Record In Japan...
It follows that a high price to earnings on a low profit margin makes the market appear more expensive than it truly is, and thereby underestimates prospective returns. In 1994, Japan appeared to be more expensive than at the peak of the bubble in 1989 because profit margins halved through 1989-94. The trouble with price to earnings is that it takes no account of the likely evolution of profit margins. Conversely, a low price to earnings on a high profit margin makes the market appear less expensive that it truly is, and thereby overestimates prospective returns (Chart 4 and Chart 5). Chart I-4Price To Sales Has An Excellent Predictive Record In Japan…
...Whereas Price To Earnings Has Made Many Mistakes
...Whereas Price To Earnings Has Made Many Mistakes
Chart I-5…Whereas Price To Earnings Has Made Many Mistakes
Price To Earnings Takes No Account Of Changing Profit Margins
Price To Earnings Takes No Account Of Changing Profit Margins
In the mid-noughties, Japan appeared to be less expensive than it truly was because profit margins surged through 2001-07. The same was true for world equities. Hence, price to earnings grossly overestimated the prospective long-term return in 2007 (Chart 6). Chart I-6Profit Margins Are At Generational Highs
Profit Margins Are At Generational Highs
Profit Margins Are At Generational Highs
Price to sales avoids the mistakes of price to earnings by removing profit margins from the equation. Put another way, it is like using price to earnings with a constant long-term profit margin. This tends to be more prudent – especially today when margins are close to generational highs and facing several threats in the coming years. One threat to profit margins comes from a growing populist backlash against record high corporate profitability, especially in the most profitable sectors. The threat manifests through populist politicians or parties which vow to rein in runaway profitability through higher taxes and/or regulation and/or nationalisation. Think Bernie Sanders. A second threat comes from environmental, social, and corporate governance (ESG). Think carbon taxes. A third threat comes the possible break-up of the pseudo-monopoly tech behemoths, killing both their pricing power and market penetration. Think antitrust suit against Google or Facebook. Admittedly, this is likely to be a US focussed threat, but the impact on stock markets would be felt worldwide. Given these threats, long-term investors should assume some pressure on profit margins from today’s generational highs. Accordingly, just as in 2007, price to sales is likely to be a much better predictor of prospective returns than is price to earnings (Chart 7 and Chart 8). Chart I-7At A World Level, Market Cap To GDP Has An Excellent Predictive Record…
At A World Level, Market Cap To GDP Has An Excellent Predictive Record...
At A World Level, Market Cap To GDP Has An Excellent Predictive Record...
Chart I-8…Whereas Price To Earnings Was Very Wrong In 2007
...Whereas Price To Earnings Was Very Wrong In 2007
...Whereas Price To Earnings Was Very Wrong In 2007
Sweden Is An Attractive Long-Term Opportunity Price to sales predicts that stock markets, on average, are set to deliver feeble single-digit total nominal returns over the coming decade. Nevertheless, with bond yields even closer to zero, and the riskiness of bonds much higher at ultra-low yields, equities still beat bonds in the ugly contest of long-term prospective returns. In fact, in those countries where bond yields are approaching their lower limit of around -1 percent – meaning bond prices are approaching their upper limit – equities win the contest more handsomely. On this basis, the stock markets in Germany and Switzerland offer attractive excess 10-year returns over their bond markets. But the most attractive long-term opportunity is Sweden. Based on its price to sales multiple, Sweden’s stock market is set to deliver around 6 percent a year over the coming decade (Chart 9). Chart I-9Sweden’s Stock Market Is Set To Deliver 6 Percent A Year
Sweden's Stock Market Is Set To Deliver 6 Percent A Year
Sweden's Stock Market Is Set To Deliver 6 Percent A Year
Given that Sweden’s 10-year bond yield is negative, Sweden’s stock market takes the honour of offering one of the world’s highest excess 10-year returns over its bond market (Chart 10). Chart I-10Sweden’s Stock Market Has The Highest Excess Return Over Bonds
Sweden's Stock Market Has The Highest Excess Return Over Bonds
Sweden's Stock Market Has The Highest Excess Return Over Bonds
Accordingly, we are adding Sweden to our existing structural overweight to equities versus long-dated bonds in Germany, in a 50:50 combination. Fractal Trading System* As discussed, we are pleased to report that underweight S&P 500 versus the 10-year T-bond achieved its 5 percent profit target and is now closed. Elsewhere, the palladium price has surged. In just six months, palladium has outperformed nickel by 130 percent, making its 130-day fractal structure extremely fragile. Accordingly, this week’s recommended trade is short palladium versus nickel, setting a profit target of 32 percent with a symmetrical stop-loss. The rolling 1-year win ratio now stands at 60 percent.
Palladium Vs. Nickel
Palladium Vs. Nickel
When the fractal dimension approaches the lower limit after an investment has been in an established trend it is a potential trigger for a liquidity-triggered trend reversal. Therefore, open a countertrend position. The profit target is a one-third reversal of the preceding 13-week move. Apply a symmetrical stop-loss. Close the position at the profit target or stop-loss. Otherwise close the position after 13 weeks. Dhaval Joshi Chief European Investment Strategist dhaval@bcaresearch.com * For more details please see the European Investment Strategy Special Report “Fractals, Liquidity & A Trading Model,” dated December 11, 2014, available at eis.bcaresearch.com Footnotes 1 Our expression of this was underweight S&P 500 versus US 10-year T-bond. 2 Prospective returns are nominal total (capital plus income) 10-year returns, shown as an annualised rate. 3 Price/sales per share = (price*number of shares)/(sales per share * number of shares) = market capitalisation/total sales. At a global level, total sales broadly equal GDP, so price/sales per share = market capitalisation/GDP. But note that this does not apply at a regional or country level because sales can originate from outside the domestic economy.. Fractal Trading System
Stocks Sold Off. Now What?
Stocks Sold Off. Now What?
Stocks Sold Off. Now What?
Stocks Sold Off. Now What?
Cyclical Recommendations Structural Recommendations
Stocks Sold Off. Now What?
Stocks Sold Off. Now What?
Stocks Sold Off. Now What?
Stocks Sold Off. Now What?
Stocks Sold Off. Now What?
Stocks Sold Off. Now What?
Stocks Sold Off. Now What?
Stocks Sold Off. Now What?
Trades Closed Trades Asset Performance Currency & Bond Equity Sector Country Equity Indicators Bond Yields Chart II-1Indicators To Watch - Bond Yields
Indicators To Watch - Bond Yields
Indicators To Watch - Bond Yields
Chart II-2Indicators To Watch - Bond Yields
Indicators To Watch - Bond Yields
Indicators To Watch - Bond Yields
Chart II-3Indicators To Watch - Bond Yields
Indicators To Watch - Bond Yields
Indicators To Watch - Bond Yields
Chart II-4Indicators To Watch - Bond Yields
Indicators To Watch - Bond Yields
Indicators To Watch - Bond Yields
Interest Rate Chart II-5Indicators To Watch - Interest Rate Expectations
Indicators To Watch - Interest Rate Expectations
Indicators To Watch - Interest Rate Expectations
Chart II-6Indicators To Watch - Interest Rate Expectations
Indicators To Watch - Interest Rate Expectations
Indicators To Watch - Interest Rate Expectations
Chart II-7Indicators To Watch - Interest Rate Expectations
Indicators To Watch - Interest Rate Expectations
Indicators To Watch - Interest Rate Expectations
Chart II-8Indicators To Watch - Interest Rate Expectations
Indicators To Watch - Interest Rate Expectations
Indicators To Watch - Interest Rate Expectations
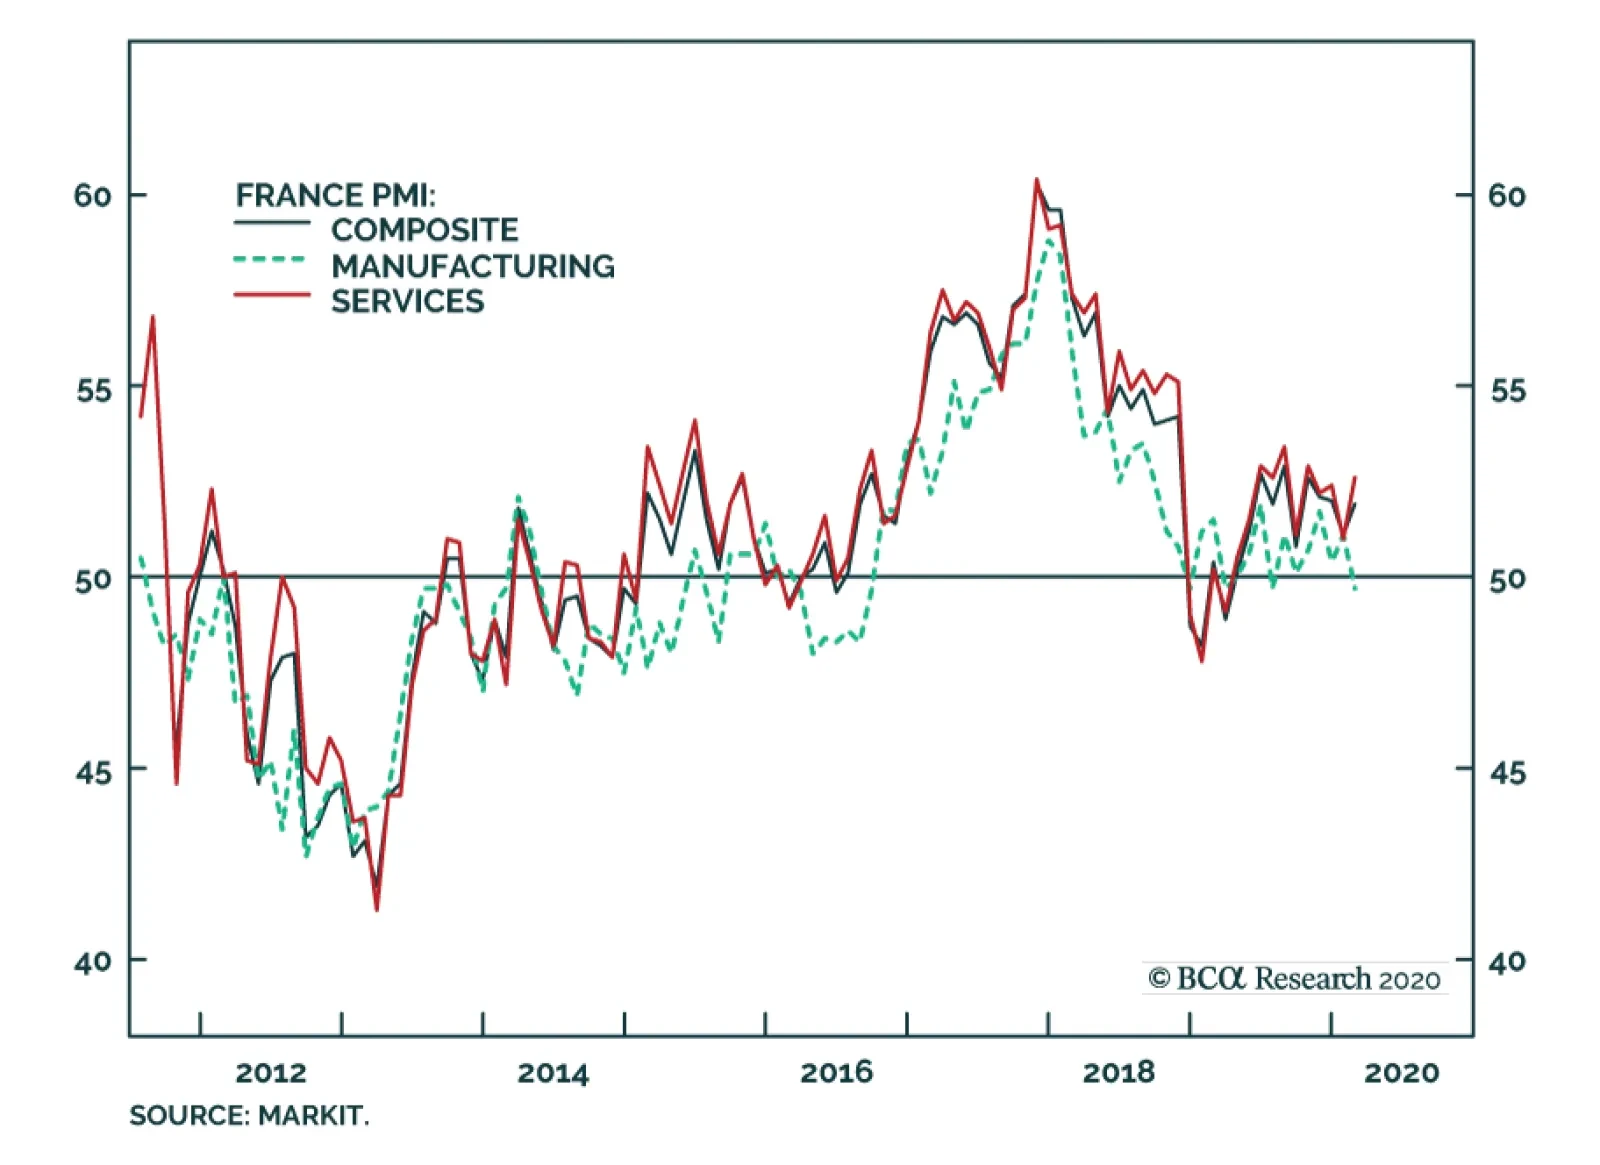
The French manufacturing sector has already suffered from the decline in global economic activity. However, the service sector continues to expand, despite the strikes that hit the country this winter. The outlook for the French service sector is…
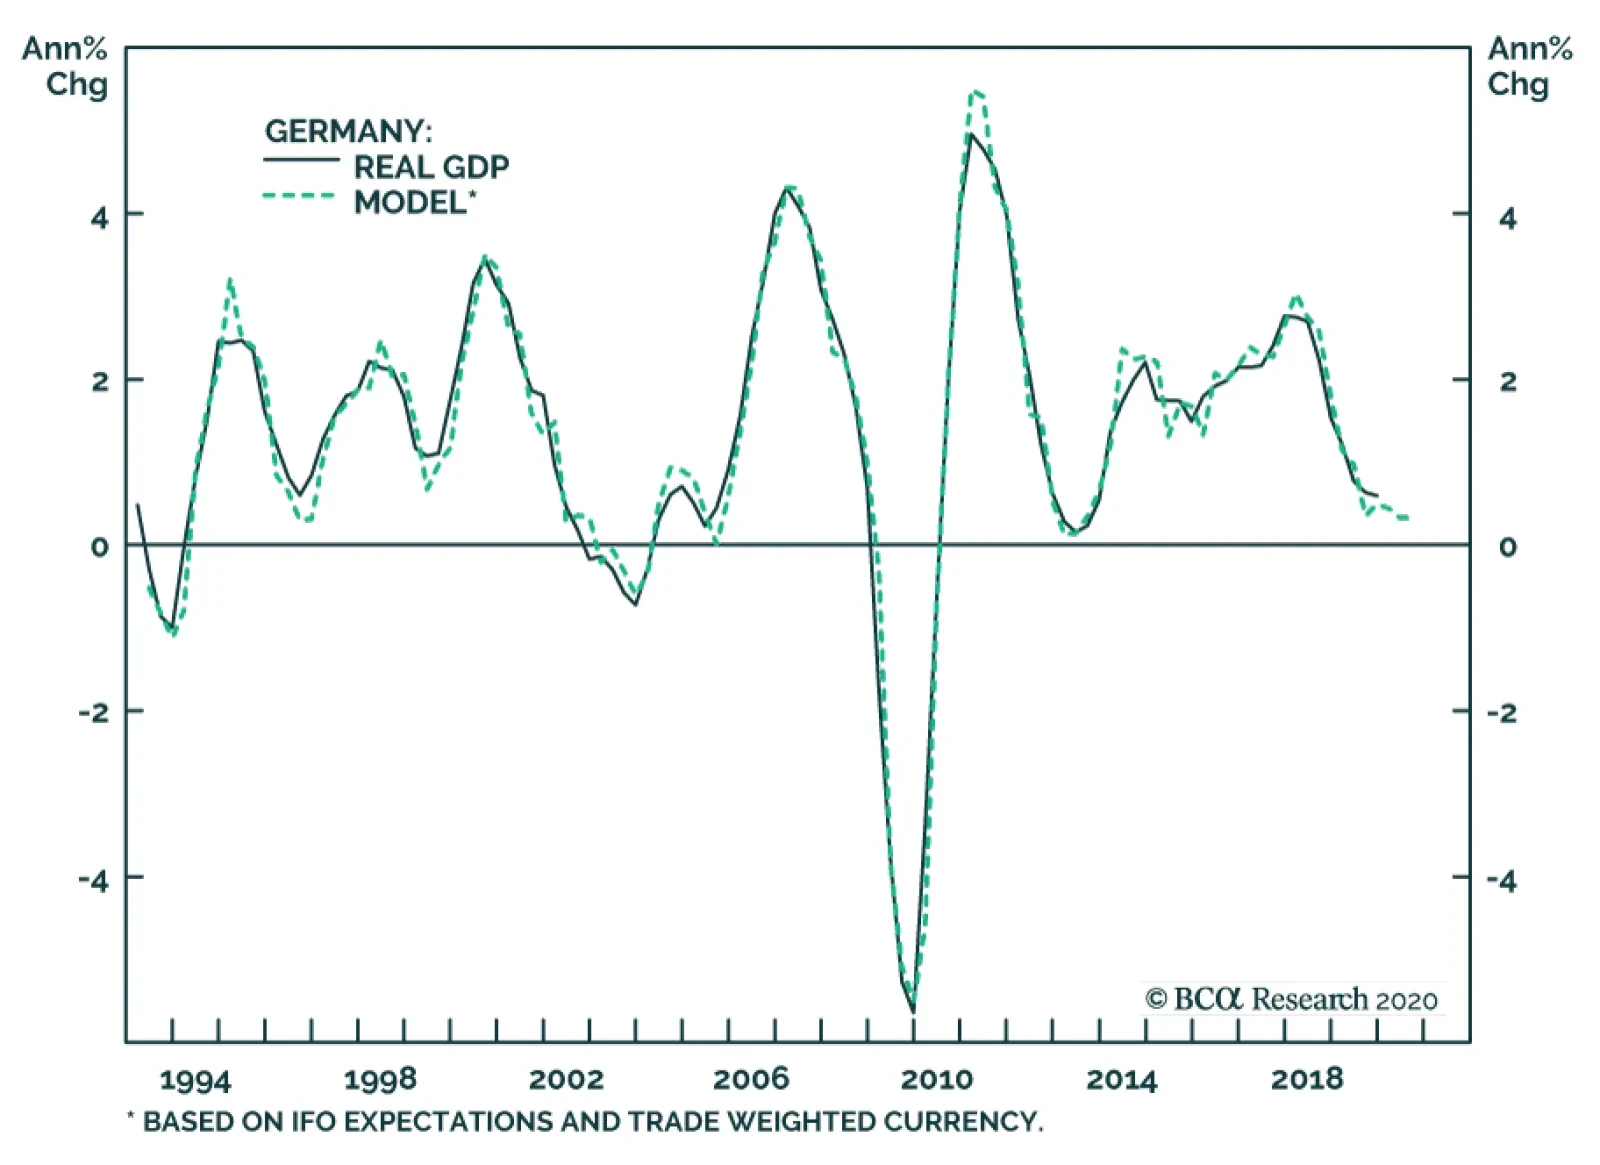
Germany’s IFO business survey for February came out slightly stronger than expected, rising from 96 to 96.1. Germany is highly sensitive to both global trade and China, which should make the German economy a prime casualty of Covid-19. However, as we…
Highlights The breakout in the DXY indicates the investment universe could become precarious. The euro could fall to 1.04 on such an outcome. The yen and Swiss franc should outperform in this environment, barring recent weakness in the Japanese currency. This will catalyze the Swiss National Bank to start weaponizing its currency. EUR/CHF could first undershoot 1.06 but will then become very attractive. We were stopped out of long AUD/CAD for a loss of 3%. Weighing In On Recent Market Developments The rally in the dollar has been broad-based, with the DXY index threatening to break above 100. What is peculiar about this rally is that it is not driven by relative fundamentals, but rather by sentiment. For example, interest rate differentials across much of the developed world have risen versus the dollar, in stark contrast with the drop in their exchange rates (Chart I-1). The risk is that as a momentum currency, the surge in the dollar triggers a negative feedback loop that tightens financial conditions in emerging markets, curtailing a key source of global demand (Chart I-2). Chart I-1Dollar Up, Rate Differentials Down
Dollar Up, Rate Differentials Down
Dollar Up, Rate Differentials Down
Chart I-2A Strong Dollar Could Lead To Debt Deflation
A Strong Dollar Will Lead To Debt Deflation
A Strong Dollar Will Lead To Debt Deflation
The most recent TIC data from the US Treasury confirmed that inflows into domestic bonds have surged, especially driven by private concerns. These inflows have been huge enough to alter the structural downtrend of outflows (Chart I-3). Given that hedged yields are currently unattractive for non-US investors, these flows are also a bet on an appreciating dollar. This fits anecdotal evidence that today’s sharp drop in the yen was driven by private investors, stampeding out of the local market, into the safety of US Treasurys and other assets. Chart I-3Positive Momentum Into US Treasurys
Positive Momentum Into US Treasurys
Positive Momentum Into US Treasurys
We have elaborated in numerous reports why the risks to the dollar are to the downside, including expensive valuation and lopsided positioning. However, these obstacles fall to the wayside in a risk-off environment. As such, for risk management purposes, we are closing our short DXY position today for a loss of 2.5%. Bottom Line: The breakout in the dollar is at risk of becoming self-reinforcing in the near term. Stand aside on the DXY for now. Thought Experiment On A Few Scenarios Different market participants have taken different views on the durability and potential impact of the COVID-19 outbreak. Equity market indices in general are looking through a potential blip in the Q1 data on the assumption that the Q2 recovery will be V-shaped and powerful. The peak in momentum of new cases outside of Hubei province as well as a less-alarming death rate compared with the SARS episode certainly supports this view (Chart I-4). Chart I-4ACases Outside The Epicenter Have Peaked For Now
Cases Outside The Epicenter Have Peaked For Now
Cases Outside The Epicenter Have Peaked For Now
Chart I-4BCases Outside The Epicenter Have Peaked For Now
Cases Outside The Epicenter Have Peaked For Now
Cases Outside The Epicenter Have Peaked For Now
The disconnect has been in the dismal performance of procyclical currencies. SEK/JPY, a key barometer of greed versus fear in financial markets, is near capitulation lows, despite secular highs for the stock-to-bond ratio (Chart I-5). Meanwhile, the EUR/USD has once again begun to inflect lower, continuing a trend in place since the beginning of 2018. Chart I-5Pro-Cyclical Crosses Are Pricing A Malignant Outcome
Pro-Cyclical Crosses Are Pricing A Malignant Outcome
Pro-Cyclical Crosses Are Pricing A Malignant Outcome
This suggests one of three outcomes: Equity markets are correct to price in a benign scenario, with an eventual synchronized growth recovery led by the US (Chart I-6A). This is dollar bullish. Currency markets are right to be pricing in a catastrophic fallout in growth, with anything linked to China/global growth getting slaughtered. This is also dollar bullish. The bond markets are spot on in pricing in a goldilocks scenario, where rates stay low and non-US markets lead an eventual recovery (Chart I-6B). This is dollar bearish. Chart I-6AEquity Markets Are Pricing A Benign Outcome
Equity Markets Are Pricing A Benign Outcome
Equity Markets Are Pricing A Benign Outcome
Chart I-6BEquity Markets Are Pricing A Benign Outcome
Equity Markets Are Pricing A Benign Outcome
Equity Markets Are Pricing A Benign Outcome
Bottom Line: Two of three scenarios lead to a higher US dollar. For most developed market participants, the adjustment towards a higher dollar would have to occur through a lower euro, given its weight in the DXY index. How Low Could The EUR/USD Fall? The possibility of either a synchronized recovery led by the US or a catastrophic fallout to growth is certainly valid for the euro area. Chart I-7 plots relative GDP growth between the two regions. The conclusion is very evident: The collapse in the euro since the financial crisis has been driven by falling growth differentials between the Eurozone and the US. Based on higher-frequency indicators, this remains the case as of January – the ZEW survey showed that the expectations component for euro area activity slowed markedly, while that of the US improved. In the absence of a synchronized pickup in global growth, a weaker exchange rate helps. One way to arrest the rising growth divergence between the euro area and the US is to lower the cost of capital in the entire Eurozone, such that it makes sense even for the less-productive peripheral countries to borrow and invest. This will boost productivity, lifting the neutral rate. This has certainly been the case. Bond yields in peripheral Europe are collapsing relative to those in Germany. And, as expected, investment spending in the periphery is also picking up, which should close the productivity gap with the core countries (Chart I-8). Unfortunately, for the small, open countries that characterize the euro area, external demand is also needed to transform those productivity gains into profits Chart I-7Weak Growth Will Pressure ##br##The Euro
Weak Growth Will Pressure The Euro
Weak Growth Will Pressure The Euro
Chart I-8Investment Spending Was Strong Going Into The Crisis
Investment Spending Was Strong Going Into The Crisis
Investment Spending Was Strong Going Into The Crisis
In the absence of a synchronized pickup in global growth, a weaker exchange rate helps. Our intermediate-term timing model, which has been back-tested as a tool for profitably hedging portfolios, suggests the euro is cheap, but not excessively so. Medium-term bottoms have usually occurred when the euro is around 5% cheaper than current levels, or around 1.03-1.04 (Chart I-9). Since the peak in global trade in 2011, one of the few ways for countries to expand their trade pie has been via a “beggar thy neighbor” policy. This is even more important for the euro area, if the Phase One trade deal between the US and China results in less purchases of European machinery, cars, and aircraft. Coupled with a hiccup in Chinese growth in Q1, the euro will have to be the mechanism of adjustment. The European Central Bank has one powerful tool to ensure this occurs: quantitative easing. By crowding out locals from the domestic fixed-income market, investors will have to flock to either equities or foreign securities. This will weigh on the euro. This is especially the case since quantitative easing from the ECB is open-ended, while that from the Federal Reserve (not-QE) is not. Eventually, investors might begin to front-run the relative expansion in the ECB’s balance sheet. Since the peak in global trade in 2011, one of the few ways for countries to expand their trade pie has been via a “beggar thy neighbor” policy. Chart I-10 shows that a rising basic balance in the euro area has been a key mechanism in preventing a further drop in the euro. This will change in the case of a catastrophic fallout to growth. Chart I-9The Euro Is Cheap, But Not A ##br##Screaming Buy
The Euro Is Cheap, But Not A Screaming Buy
The Euro Is Cheap, But Not A Screaming Buy
Chart I-10A Positive Basic Balance Has Prevented A Much Lower Adjustment
A Positive Basic Balance Has Prevented A Much Lower Adjustment
A Positive Basic Balance Has Prevented A Much Lower Adjustment
Eventually, all trends reverse, and there will be a pickup in growth, led by more growth-sensitive economies. Given both the internal and exchange rate adjustments in the euro area, the common-currency zone will be primed to benefit. The euro tends to be largely driven by pro-cyclical flows, and European equities, especially those in the periphery, are already trading at some of the cheapest cyclically adjusted price-to-earnings multiples in the developed world. Watch earnings revisions for euro zone equities versus the US. They tend to firmly lead the euro by about 9-to-12 months (Chart I-11). Chart I-11Watch Earnings Revisions For The Next EUR/USD Move
Watch Earnings Revisions For The Next EUR/USD Move
Watch Earnings Revisions For The Next EUR/USD Move
Bottom Line: There is near-term downside to the EUR/USD towards 1.03. The SNB And The Franc The franc has been in a bull market against pretty much every European currency since the onset of the global growth slowdown, with the latest developments only supercharging that trend. The worst-case scenario for Switzerland is a global growth fallout, since the valuation starting point for the franc is expensive, not only vis-à-vis the euro (Chart I-12), but even more so against the Swedish krona and Norwegian krone. So, the key question for the franc is the pain threshold for the SNB to step up intervention. Chart I-12The Franc Is Getting Incrementally Expensive
The Franc Is Getting Incrementally Expensive
The Franc Is Getting Incrementally Expensive
The first mandate of the Swiss National Bank is price stability, consistent with inflation at 2%. On this front, it has clearly underdelivered. The central bank expects inflation to gradually pick up to 1.2% by 2023, but the backdrop for prices in Switzerland has been sub-1% for much of the post-crisis period (Chart I-13). Meanwhile, as a small, open economy, tradeable goods prices are important for domestic inflation, and import prices are deflating by over 1.9% year-on-year, in part driven by a strong currency (Chart I-14). If left unchecked, this could begin to un-anchor inflation expectations, leading to a negative feedback loop that the SNB will likely find very difficult to lean against. Chart I-13SNB Forecasts May Not Be Realized Soon
SNB Forecasts May Not Be Realized Soon
SNB Forecasts May Not Be Realized Soon
Chart I-14The Risk From A Strong Franc Is Deflation
The Risk From A Strong Franc Is Deflation
The Risk From A Strong Franc Is Deflation
Domestically, the Swiss economy was holding up well, but it is now an open question as to how much longer it can continue to defy the pull of a slowing external sector. As a highly export-driven country, the manufacturing sector usually dictates trends in the overall Swiss economy (Chart I-15). Sentiment indicators such as the ZEW expectations component were perking up ahead of the onset of COVID-19. It is now a sure bet that these will relapse in the coming months. More importantly, the impact on Switzerland might be bigger relative to its trading competitors, given the expensive franc. It is now an open question as to how much longer Switzerland can continue to defy the pull of a slowing external sector. A key barometer for the SNB will be exports. Export volumes are already deflating (Chart I-16), yet the trade balance is still benefiting from the large share of precious metals exports, which are currently experiencing a terms-of-trade boost. This will not last forever, given the falling market share of precious metals in the Swiss trade balance Chart I-15How Long Can Employment Defy Gravity
How Long Can Employment Defy Gravity?
How Long Can Employment Defy Gravity?
Chart I-16A Lower Franc Will Support Export Volumes
A Lower Franc Will Support Export Volumes
A Lower Franc Will Support Export Volumes
There is a new twist for “operation weak franc.” The US Treasury department has put Switzerland on the currency-manipulator watch list. In general, the SNB is reticent on the issue of currency intervention, stating only that it intervenes to counteract negative effects on inflation and exports from an overly expensive franc. But it is encouraging that sight deposits at local banks started to accelerate at USD/CHF 0.96 (Chart I-17) and the SNB is also likely to act if EUR/CHF meaningfully breaks below 1.06. Economically, the SNB has to walk a fine line between a predominantly deflationary backdrop in Switzerland and a rising debt-to-GDP ratio that pins it among the highest in the G10. The good news is that a lot of the imbalances resulting from excess liquidity in recent years are being addressed. The housing market is a case in point. Growth in rental housing units, which usually constitute the bulk of investment homes, is deflating, which contrasts favorably with growth in owner-occupied homes (Chart I-18). Macro prudential measures such as a cap on second homes as well as stricter lending standards have helped. Meanwhile, a slowdown in the working-age population in Switzerland has neutered a meaningful source of demand. Chart I-17The SNB Is Stepping Up Intervention
The SNB Is Stepping Up Intervention
The SNB Is Stepping Up Intervention
Chart I-18A Healthy Housing Adjustment
A Healthy Housing Adjustment
A Healthy Housing Adjustment
Bottom Line: We are lowering our limit-buy on EUR/CHF to 1.05 to account for a potential undershoot. Housekeeping We were stopped out of our long AUD/CAD trade for a loss of 3.0%. As highlighted above, currency markets are beginning to price in a malignant scenario for global growth, where anything non-US gets decimated. In such an environment, the best policy is to stand aside. Chester Ntonifor Foreign Exchange Strategist chestern@bcaresearch.com Currencies U.S. Dollar Chart II-1USD Technicals 1
USD Technicals 1
USD Technicals 1
Chart II-2USD Technicals 2
USD Technicals 2
USD Technicals 2
Recent data in the US have been mostly positive: Retail Sales excluding autos grew by 0.3% month-on-month compared to 0.2% in January. Industrial production contracted further by 0.3% month-on-month in January. The Michigan consumer sentiment index increased to 100.9 from 99.8 in February. The core producer price index grew by 1.7% in January, from 1.1% in December. Housing starts decreased to 1.57 million from 1.63 million, while building permits increased to 1.55 million from 1.42 million in December. The DXY index appreciated by 0.8% this week. As a momentum currency, the rise could become self-reinforcing. Stand aside on DXY. Report Links: Building A Protector Currency Portfolio - February 7, 2020 Currency Market Signals From Gold, Equities And Flows - January 31, 2020 Portfolio Tweaks Before The Chinese New Year - January 24, 2020 The Euro Chart II-3EUR Technicals 1
EUR Technicals 1
EUR Technicals 1
Chart II-4EUR Technicals 2
EUR Technicals 2
EUR Technicals 2
Recent data in the euro area have been negative: The trade balance increased to EUR 22.2 billion, on a seasonally adjusted basis, from EUR 19.1 billion in December. GDP grew by 0.9% year-on-year in Q4 2019, slowing from 1.2% the previous quarter. ZEW economic sentiment declined to 10.4 from 25.6 in February. The current account surplus decreased to EUR 32.6 billion from 35.2 billion in December. Construction output contracted by 3.7% year-on-year in December, from growth of 1.4% the previous month. The euro depreciated by 0.5% against the US dollar this week. The disappointing ZEW numbers for the Eurozone and Germany and concerns about persistently low growth were a major headwind for the euro this week. Report Links: Updating Our Balance Of Payments Monitor - November 29, 2019 On Money Velocity, EUR/USD And Silver - October 11, 2019 A Few Trade Ideas - Sept. 27, 2019 Japanese Yen Chart II-5JPY Technicals 1
JPY Technicals 1
JPY Technicals 1
Chart II-6JPY Technicals 2
JPY Technicals 2
JPY Technicals 2
Recent data in Japan have been negative: GDP contracted by 1.6% quarter-on-quarter in Q4 2019, compared to growth of 0.4% the previous quarter. Industrial production contracted by 3.1% year-on-year in December. Capacity utilization decreased to -0.4% in December. The merchandise trade balance fell to a deficit of JPY 224.1 billion in January. Machinery orders contracted by 3.5% year-on-year in December. Imports contracted by 3.6% and exports contracted by 2.6% year-on-year in January. The Japanese yen depreciated by 1.9% against the US dollar this week. Domestic data was very disappointing, with GDP contracting more than expected. Meanwhile technical factors such as portfolio flows were also responsible. That said, short USD/JPY remains cheap insurance. Report Links: Building A Protector Currency Portfolio - February 7, 2020 Currency Market Signals From Gold, Equities And Flows - January 31, 2020 Portfolio Tweaks Before The Chinese New Year - January 24, 2020 British Pound Chart II-7GBP Technicals 1
GBP Technicals 1
GBP Technicals 1
Chart II-8GBP Technicals 2
GBP Technicals 2
GBP Technicals 2
Recent data in the UK have been mixed: The Rightmove house price index grew by 2.9% year-on-year in February. The ILO unemployment rate remained flat at 3.8% in December. The growth in average earnings including bonuses slowed to 2.9% from 3.8% in December. The CPI grew by 1.8% while the retail price index grew by 2.7% year-on-year in January. Retail sales grew by 0.8% year-on-year in January. The British pound depreciated by 1.3% against the US dollar this week. The key worry for incoming BoE governor Andrew Bailey is a stagflationary environment, with increases in inflation driven by weak business investment and productivity growth. Stand aside on GBP for now. Report Links: Updating Our Balance Of Payments Monitor - November 29, 2019 A Few Trade Ideas - Sept. 27, 2019 United Kingdom: Cyclical Slowdown Or Structural Malaise? - Sept. 20, 2019 Australian Dollar Chart II-9AUD Technicals 1
AUD Technicals 1
AUD Technicals 1
Chart II-10AUD Technicals 2
AUD Technicals 2
AUD Technicals 2
Recent data in Australia have been negative: The six month annualized growth rate in the Westpac leading index fell to -0.46% from -0.28% in January. The wage price index grew by 2.2% year-on-year in Q4, staying flat from the previous quarter. The unemployment rate increased to 5.3% from 5.1% in January. The Australian Dollar depreciated by 1.4% against the US dollar this week. Much of the decline was driven by the perceived dovish tone of the minutes from the Reserve Bank of Australia (RBA) February meeting. The RBA’s primary concerns were slow consumption growth and the effects of the bushfires on growth in the near-term. However, the housing market, led by Sydney and Melbourne, is picking up quickly. We remain positive AUD/USD but will stand aside if it breaches 60 cents. Report Links: On AUD And CNY - January 17, 2020 Updating Our Balance Of Payments Monitor - November 29, 2019 A Contrarian View On The Australian Dollar - May 24, 2019 New Zealand Dollar Chart II-11NZD Technicals 1
NZD Technicals 1
NZD Technicals 1
Chart II-12NZD Technicals 2
NZD Technicals 2
NZD Technicals 2
Recent data in New Zealand have been mixed: Visitor arrivals declined by 0.2% year-on-year in December. The ANZ monthly inflation gauge remained flat at 3.2% year-on-year in January, The REINZ house price index grew by 0.3% month-on-month in January. The Global Dairy Trade price index declined 2.9% in February. The New Zealand dollar depreciated by 1.6% against the US dollar this week. Dairy trade was hampered by weak demand from China and Prime Minister Jacinda Ardern warned of a negative impact on GDP growth in the first half of 2020 from Covid-19. Report Links: Updating Our Balance Of Payments Monitor - November 29, 2019 Place A Limit Sell On DXY At 100 - November 15, 2019 USD/CNY And Market Turbulence - August 9, 2019 Canadian Dollar Chart II-13CAD Technicals 1
CAD Technicals 1
CAD Technicals 1
Chart II-14CAD Technicals 2
CAD Technicals 2
CAD Technicals 2
Recent data in Canada have been mixed: Manufacturing sales contracted by 0.7% month-on-month in December. Headline CPI grew by 2.4%, while the BoC core measure grew 1.8% year-on-year in January. The Canadian dollar appreciated by 0.1% against the US dollar this week. The rally was driven by the surge in oil prices over the past two weeks coinciding with a decline in the number of new Covid-19 cases. While acknowledging the negative demand shock from China, our Commodity and Energy strategists currently believe that Chinese policy stimulus will help shore up oil demand going into the second half of this year. This will be bullish CAD. Report Links: The Loonie: Upside Versus The Dollar, But Downside At The Crosses Updating Our Balance Of Payments Monitor - November 29, 2019 Making Money With Petrocurrencies - November 8, 2019 Swiss Franc Chart II-15CHF Technicals 1
CHF Technicals 1
CHF Technicals 1
Chart II-16CHF Technicals 2
CHF Technicals 2
CHF Technicals 2
Recent data in Switzerland have been mixed: Import prices contracted by 1.9% year-on-year in January, compared to a contraction of 3.2% the previous month. The trade balance increased to CHF 4,788 million in January from CHF 1,975 million the previous month. Industrial production grew by 1.6% year-on-year in Q4 2019, slowing from 7.9% the previous quarter. The CHF depreciated 0.4% against the US dollar this week. The SNB has repeatedly emphasized that it stands ready to prevent rampant appreciation in the Swiss franc which could hurt exports. Report Links: Currency Market Signals From Gold, Equities And Flows - January 31, 2020 Portfolio Tweaks Before The Chinese New Year - January 24, 2020 Updating Our Balance Of Payments Monitor - November 29, 2019 Norwegian Krone Chart II-17NOK Technicals 1
NOK Technicals 1
NOK Technicals 1
Chart II-18NOK Technicals 2
NOK Technicals 2
NOK Technicals 2
There was scant data out of Norway this week: The trade balance decreased to NOK 21.2 billion in January from NOK 25.6 billion the previous month. The Norwegian krone depreciated by 0.7% against the US dollar this week. The past two weeks saw a remarkable rally in oil prices, which should help the petrocurrency, but a strong dollar has weighed on NOK/USD. However, our NOK/EUR position, a part of our long petrocurrencies basket trade, has benefitted from the oil rally and weakness in the euro. In an annual speech this week, Governor Olsen of the Norges Bank stressed the need for Norway to decrease reliance on the sovereign wealth fund and transition to a less oil-dependent economy. In the long run, this could mean krona leaving behind the “petrocurrency” moniker. Report Links: Building A Protector Currency Portfolio - February 7, 2020 On Oil, Growth And The Dollar - January 10, 2020 Updating Our Balance Of Payments Monitor - November 29, 2019 Swedish Krona Chart II-19SEK Technicals 1
SEK Technicals 1
SEK Technicals 1
Chart II-20SEK Technicals 2
SEK Technicals 2
SEK Technicals 2
Recent data in Sweden have been negative. The unemployment rate increased to 7.5% in January from 6% the previous month. The CPI grew by 1.3% year-on-year in January, compared to 1.8% the previous month. The Swedish krona depreciated by 1.9% against the US dollar this week. In the February monetary policy report released last week, the Riksbank revised down inflation forecasts due to lower energy prices in 2020. However, they expect this to be a transitory shock and see inflation moving closer to 2% once it subsides. Although the krona depreciated on the unemployment and inflation data this week, it looks unlikely to be enough for the Riksbank to change its policy stance. Report Links: Updating Our Balance Of Payments Monitor - November 29, 2019 Where To Next For The US Dollar? - June 7, 2019 Balance Of Payments Across The G10 - February 15, 2019 Trades & Forecasts Forecast Summary Core Portfolio Tactical Trades Limit Orders Closed Trades