Europe

Executive Summary Villains Still Lurking
Villains Still Lurking
Villains Still Lurking
European assets and the euro already discount a significant worsening of Europe’s economic outlook. If the global economic situation were to stabilize, then European assets would be a buy at current levels. However, there remain very large risks lurking over the outlook. First, a further deterioration in energy flows between Russia and the EU is a major threat to the European economic outlook. Second, the ECB delivering the seven rate hikes priced in the June 2023 Euribor contract would be painful for the European economy. Third, further selloff in the US equity market could translate into more pain for European equities. And fourth, the weakness in the Chinese economy and aggressive monetary tightening in the broader EM space outside China are additional risks. These risks loom large enough, so that investors should avoid bottom-fishing the market. Wait until greater clarity emerges or valuations improve further. Bottom Line: Don’t be a hero. European assets and the euro are probably in the process of bottoming. However, the probability of a very significant additional decline is large enough that investors should continue to emphasize capital preservation over return maximization. Also, continue to favor defensives over cyclical assets. After declining nearly 8% since its January 2021 peak, the euro is down another 7% so far this year. Meanwhile, the Dow Jones Euro STOXX 50, which has plunged 17% since its January 5, 2022 apex, or 22% in US dollar terms, trades at 11.2 times 2023 earnings estimates. At these valuations, European assets already discount a major growth slump in Europe. Is it time to buy European assets, to favor cyclicals versus defensives, and to buy the euro? At face value, the answer is “yes,” but uncertainty abounds, which means that capital preservation remains paramount. As a result, we recommend investors avoid bottom-fishing European assets. They should wait for a safer entry point, rather than trying to pick through the market trough. Plenty Of Risks Four main risks cast a long shadow on the performance of European assets: The evolution of the energy crisis, the potential for an ECB policy mistake, the threat of a worsening US selloff, and the instability in EM. The Energy Crisis It’s official: Sweden and Finland are applying to join NATO. Turkey’s objection will create delays in the process, but it will not stop it. Turkey needs protection against Russia, and it needs help to support the lira. Turkey’s acquiescence, therefore, will be bought. What is genuinely surprising is Russia’s silence. President Putin threatened to flex Russia’s military muscles if Sweden and Finland were to abandon their neutrality. Yet, he now has “no problem” with their bid to join the alliance. We are skeptical, especially as the EU is aiming to ban Russian oil imports by the end of the year. Based on these observations, we continue to see a further deterioration in energy flows between Russia and the EU as a major threat to the European economic outlook. It is far from a guaranteed outcome, but its probability is elevated enough (more than 30%) and so impactful that any investment strategy must account for it. Chart 1Rebuilding Nat Gas Stocks Is A Must
Don’t Be A Hero
Don’t Be A Hero
Chart 2Low-Income Households Are At Risk
Don’t Be A Hero
Don’t Be A Hero
Moreover, European nations continue to pay a premium for their energy and are trying to rebuild their natural gas inventory ahead of winter (Chart 1). Thus, the energy market continues to carry a significant recession risk for the Eurozone. Lower-income households already spend a substantial portion of their income on utilities and transportation costs, and their consumption is highly sensitive to the evolution of energy prices (Chart 2). A Policy Mistake We consider a rate hike in July a policy mistake, but it would be a true error if the ECB ratified the pricing currently embedded in the €STR curve (Chart 3). Why would a rate hike constitute a policy mistake? The EU’s inflation spike is not a reflection of strong domestic demand. It reflects foreign factors over which the ECB has no control. Energy prices drive European inflation and are passing-through to core CPI (Chart 4). Yet, wage growth remains tepid at 2.6%. Hiking rates will not bring about the additional energy supply Europe needs to tame inflation. Chart 3Too Far Too Fast
Too Far Too Fast
Too Far Too Fast
Chart 4European Inflation Is Energy inflation
European Inflation Is Energy inflation
European Inflation Is Energy inflation
Chart 5The US Is Lifting Prices Around The World
The US Is Lifting Prices Around The World
The US Is Lifting Prices Around The World
Even the analysis of the ECB is conflicted. On May 11, Executive Board Member Isabel Schnabel highlighted the need for an imminent interest rate hike, yet she also underscored the global nature of the current inflation outbreak. Goods prices in Europe not only reflect higher input costs, but they also bear the imprint of the excess demand in the US, which is lifting the price of goods prices around the world (Chart 5). However, an ECB rate hike will do little to tame US demand for manufactured goods. In the monetary policy realm, only aggressive tightening by the Fed will have the desired effect, which will trickle down to lower European inflation. Thus, European interest rate hikes will accentuate consumption weaknesses already visible across the region more than they will slow inflation. While a few rate hikes will not have a major impact, the seven rate hikes priced in the June 2023 Euribor contract would be disastrous as long as Europe is hamstrung by the current relative price shock. We remain long this contract. Worsening US Equity Selloff Investors seem to be waking up to the reality that US consumers are facing the same difficult predicament as European consumers: rising energy and food prices and contracting real incomes. The recent earnings call by Walmart was a shock that caused an 8% drubbing for consumer staples and a 7% fall in consumer discretionary equities. Until US inflation clearly peaks, investors will have to evaluate how much deeper the pain for consumers may run. Moreover, since consumers have begun to cut their discretionary spending in response to strained budgets, the ability of firms to pass on rising input costs is dwindling. Hence, investors will have to handicap the risks to margins as well. Chart 6Fed Put Not Exercised
Fed Put Not Exercised
Fed Put Not Exercised
US inflation also impacts the Fed’s outlook. Until inflation has decelerated for a few months, the Fed will remain comfortable with tighter financial conditions. This means that the strike price of the so-called Fed put is inversely proportional to inflation, especially since FCIs are far from tight (Chart 6). As a result, inflation or energy prices must soften before the Fed can begin to send comforting signals to the market. Chart 7Where Walmart Goes, So Does The Market?
Where Walmart Goes, So Does The Market?
Where Walmart Goes, So Does The Market?
The US market has cheapened significantly, and a floor should be close; but the risks remain considerable. A very smart investor with whom we regularly chat highlighted that we have not yet seen a full-fledged liquidation. Only once energy stocks have also been purged will the necessary condition for a bottom be met (since only then will all the speculative activity have been cleared). In fact, the recent poor performance of Walmart highlights the risk that the S&P 500 could suffer one last down leg to 3500, since over the past 12 years, WMT often leads the SPX (Chart 7). Another 300 points decline in the US benchmark could translate into significant selling pressure in the Euro STOXX, because it sports an elevated beta. EM Instability EM are still facing ample risks, which could easily dislodge the prospects of European firms servicing these economies. As a result, EM constitute another major threat for European equities. Chart 8Less COVID In Shanghai and Jilin
Less COVID In Shanghai and Jilin
Less COVID In Shanghai and Jilin
The outlook for China remains fraught with risks. National COVID cases are declining as a result of the collapse in cases in the Shanghai and Jilin provinces (Chart 8). However, Omicron is spreading around the nation, with broadening lockdowns in Beijing and Tianjin. The one certainty is that the Chinese Communist Party remains wedded to its zero-COVID policy. Considering the size of the country and how contagious the various Omicron variants are, rolling lockdowns and their deleterious impact on activity are here to stay. China therefore remains a source of downside risk for global goods demand. Unemployment is surging, and the PMIs are extremely weak, suggesting a contraction in GDP is coming. Moreover, households continue to deleverage (Chart 9). The CNY’s weakness confirms the risks to earnings growth in Europe, and the yield spread between China and the US points to further downside in the RMB (Chart 10, top panel). Interestingly, the weakness of the yen could also drag the CNY lower because of competitive pressures. Chester Ntonifor, BCA’s Chief Foreign Exchange strategist recommends investors sell CNY/JPY. Historically, a depreciating CNY/JPY portends weakness in European stock prices (Chart 10, bottom panel). Chart 9Chinese Growth Problems
Chinese Growth Problems
Chinese Growth Problems
Chart 10A Weaker CNY Augurs Poorly For European Stocks
A Weaker CNY Augurs Poorly For European Stocks
A Weaker CNY Augurs Poorly For European Stocks
The broader EM space outside of China is also a source of risk. EM countries are tightening monetary policy, which is slowing economic activity in nations already exposed to declining Chinese imports. Additionally, as Arthur Budaghyan shows, the strength in the dollar is tightening EM financial conditions and invites further increases in EM policy rates because of the inflationary impact of depreciating currencies. An additional tightening in EM financial conditions in response to this toxic mix will invite greater downside for European equities (Chart 11). Bottom Line: European equities already reflect enough of a valuation cushion to compensate for a significant slowdown in European growth. However, ample risks to global growth still lurk in the background. If these risks materialize, European stocks could selloff another 15% or so. Moreover, the overvaluation of cyclical stocks relative to defensive ones has now been purged, but China’s economic weakness remains a major handicap (Chart 12). Consequently, don’t be hero: avoid bottom-fishing European assets, especially cyclical ones. Chart 11Brewing EM Troubles
Brewing EM Troubles
Brewing EM Troubles
Chart 12Cyclicals At Risk From China
Cyclicals At Risk From China
Cyclicals At Risk From China
Is it Time to Buy the Euro? After falling below 1.04, EUR/USD has rebounded to 1.055. Is it time to buy the euro? The euro now embeds a large discount that reflects fears of a recession and stagflation in the Eurozone. A purchasing power parity model developed by BCA’s Foreign Exchange Strategy team that accounts for the differences in consumption baskets in Europe and the US shows that EUR/USD is trading at its deepest discount to fair value since 2001. Moreover, BCA’s Intermediate-term timing model, which is based on an augmented interest rate parity framework, confirms that EUR/USD is cheap. Additionally, BCA’s Intermediate-Term Technical Indicator is massively oversold (Chart 13). For the euro to bottom durably, the dollar needs to reverse its rally. The combination of net speculative positions on the DXY and BCA’s Dollar Capitulation Index point to elevated chances of an imminent peak (Chart 14). Chart 13The Euro's Large Risk Premium
The Euro's Large Risk Premium
The Euro's Large Risk Premium
Chart 14The Over Extended Dollar
The Over Extended Dollar
The Over Extended Dollar
Despite this backdrop, three of the aforementioned risks to European stocks translate into threats to the euro: A Russian energy embargo would cause a much more severe European recession. Two weeks ago, we highlighted a Bundesbank study which showed that such a cutoff would curtail German growth by 5% point for 2022. We also highlighted that this shock would cause a temporary but significant increase in inflation. This combination would be poisonous for the euro, and it carries a roughly 30% probability. A policy mistake in the Euro Area would cause a period of significant spread widening in the periphery. Such shocks often prompt a widening in the breakup risk-premium for the euro. This risk premium pushes EUR/USD lower. Chart 15Chinese Assets Matter To The Euro
Chinese Assets Matter To The Euro
Chinese Assets Matter To The Euro
Chinese growth problems often hurt the euro as well as European stocks. A fall in the Chinese stock-to-bond ratio often leads to a weaker EUR/USD, since both variables are correlated to Chinese economic activity. Additionally, a depreciating CNY is also synonymous with a softer euro because a declining renminbi hurts European exporters (Chart 15). Further weaknesses in the S&P 500 no longer guarantee a fall in EUR/USD. Investors are worried about the US equity outlook because they are extrapolating the impact on consumers of rising energy and food prices. They are applying the template of what is going on in Europe to US households, which means that they are pricing in a convergence of US growth toward European growth (barring the three additional shocks highlighted in the bullet points above). Related Report European Investment StrategyIs UK Stagflation Priced In? Bottom Line: From a technical and valuation perspective, the rebound in the euro that began this week could last longer. However, several exceptional risks could prevent this bounce from morphing into a durable rally. The significant odds of a Russian energy embargo stand at the top of the list of concerns, but so does the possibility of a policy mistake in Europe as well China’s problems. Thus, even if the euro is bottoming, don’t be a hero and wait on a safer entry point to focus on capital preservation. In fact, BCA’s Foreign Strategy team is now selling EUR/JPY. Within a European context, a short GBP/CHF position is attractive as a portfolio hedge. The Swiss National Bank seems more tolerant of a higher CHF as a vehicle to tame growing inflationary pressures, while the UK faces significant risks. Mathieu Savary, Chief European Strategist Mathieu@bcaresearch.com Tactical Recommendations Cyclical Recommendations Structural Recommendations
Listen to a short summary of this report. Executive Summary The US Inflation Surprise Index Has Rolled Over
Goldilocks: A Skeptical Q&A
Goldilocks: A Skeptical Q&A
Global equities are nearing a bottom and will rally over the coming months as inflation declines and growth reaccelerates. While equity valuations are not at bombed-out levels, they have cheapened significantly. Global stocks trade at 15.3-times forward earnings. We are upgrading tech stocks from underweight to neutral. The NASDAQ Composite now trades at a forward P/E of 22.6, down from 32.9 at its peak last year. The 10-year Treasury yield should decline to 2.5% by the end of the year, which will help tech stocks at the margin. The US dollar has peaked. A weakening dollar will provide a tailwind to stocks, especially overseas bourses. US high-yield spreads are pricing in a default rate of 6.2% over the next 12 months, well above the trailing default rate of 1.2%. Favor high-yield credit over government bonds within a fixed-income portfolio. Bottom Line: The recent sell-off in stocks provides a good opportunity to increase equity allocations. We expect global stocks to rise 15%-to-20% over the next 12 months. Back to Bullish We wrote a report on April 22nd arguing that global equities were heading towards a “last hurrah” in the second half of the year as a Goldilocks environment of falling inflation and supply-side led growth emerges. Last week, we operationalized this view by tactically upgrading stocks to overweight after having downgraded them in late February. This highly out-of-consensus view change, coming at a time when surveys by the American Association of Individual Investors and other outfits show extreme levels of bearishness, has garnered a lot of attention. In this week’s report, we answer some of the most common questions from the perspective of a skeptical reader. Q: Inflation is at multi-decade highs, global growth is faltering, and central banks are about to hike rates faster than we have seen in years. Isn’t it too early to turn bullish? A: We need to focus on how the world will look like in six months, not how it looks like now. Inflation has likely peaked and many of the forces that have slowed growth, such as China’s Covid lockdown and the war in Ukraine, could abate. Q: What is the evidence that inflation has peaked? And may I remind you, even if inflation does decline later this year, this is something that most investors and central banks are already banking on. Inflation would need to fall by more than expected for your bullish scenario to play out. A: That’s true, but there is good reason to think that this is precisely what will happen. Overall spending in the US is close to its pre-pandemic trend. However, spending on goods remains above trend while spending on services is below trend (Chart 1). Services prices tend to be stickier than goods prices. Thus, the shift in spending patterns caused goods inflation to rise markedly with little offsetting decline in services inflation. To cite one of many examples, fitness equipment prices rose dramatically, but gym membership fees barely fell (Chart 2). Chart 1Total US Consumer Spending Is Almost Exactly At Its Pre-Pandemic Trend, But The Composition Of Spending Remains Skewed
Total US Consumer Spending Is Almost Exactly At Its Pre-Pandemic Trend, But The Composition Of Spending Remains Skewed
Total US Consumer Spending Is Almost Exactly At Its Pre-Pandemic Trend, But The Composition Of Spending Remains Skewed
Chart 2Asymmetries Matter: Firms Manufacturing Sports Equipment Jacked Up Prices, But Gyms Barely Cut Prices
Asymmetries Matter: Firms Manufacturing Sports Equipment Jacked Up Prices, But Gyms Barely Cut Prices
Asymmetries Matter: Firms Manufacturing Sports Equipment Jacked Up Prices, But Gyms Barely Cut Prices
As goods demand normalizes, goods inflation will come down. Meanwhile, the supply of goods should increase as the pandemic winds down, and hopefully, a detente is reached in Ukraine. There are already indications that some supply-chain bottlenecks have eased (Chart 3). Q: Even if supply shocks abate, which seems like a BIG IF to me, wouldn’t the shift in spending towards services supercharge what has been only a modest acceleration in services inflation so far? A: Wages are the most important driver of services inflation. Although the evidence is still tentative, it does appear as though wage inflation is peaking. The 3-month annualized growth rate in average hourly earnings for production and nonsupervisory workers slowed from 7.2% in the second half of 2021 to 3.8% in April (Chart 4). Assuming productivity growth of 1.5%, this is consistent with unit labor cost inflation of only slightly more than 2%, which is broadly consistent with the Fed’s CPI inflation target.1
Image
Chart 4Wage Pressures May Be Starting To Ease
Wage Pressures May Be Starting To Ease
Wage Pressures May Be Starting To Ease
Image
Moreover, a smaller proportion of firms expect to raise wages over the next six months than was the case late last year according to a variety of regional Fed surveys (Chart 5). The same message is echoed by the NFIB small business survey (Chart 6). Consistent with all this, the US Citi Inflation Surprise Index has rolled over (Chart 7). Chart 6... Small Business Owners Included
... Small Business Owners Included
... Small Business Owners Included
Chart 7The US Inflation Surprise Index Has Rolled Over
The US Inflation Surprise Index Has Rolled Over
The US Inflation Surprise Index Has Rolled Over
Q: What about the “too cold” risk to your Goldilocks scenario? The risks of recession seem to be rising. A: The market is certainly worried about this outcome, and that has been the main reason stocks have fallen of late. However, we do not think this fear is justified, certainly not in the US (Chart 8). US households are sitting on $2.3 trillion excess savings, equal to about 14% of annual consumption. The ratio of household debt-to-disposable income is down 36 percentage points from its highs in early 2008, giving households the wherewithal to spend more. Core capital goods orders, a good leading indicator for capex, have surged. The homeowner vacancy rate is at a record low, suggesting that homebuilding will be fairly resilient in the face of higher mortgage rates. Q: It seems like the Fed has a nearly impossible task on its hands: Increase labor market slack by enough to cool the economy but not so much as to trigger a recession. You yourself have pointed out that the Fed has never achieved this in its history. A: It is correct that the unemployment rate has never risen by more than one-third of a percentage point in the US without a recession occurring (Chart 9). That said, there are three reasons to think that a soft landing can be achieved this time.
Image
Chart 9When Unemployment Starts Rising, It Usually Keeps Rising
When Unemployment Starts Rising, It Usually Keeps Rising
When Unemployment Starts Rising, It Usually Keeps Rising
First, increasing labor market slack is easier if one can raise labor supply rather than reducing labor demand. Right now, the participation rate is nearly a percentage point below where it was in 2019, even if one adjusts for increased early retirement during the pandemic (Chart 10). Wages have risen relatively more at the bottom end of the income distribution. This should draw more low-wage workers into the labor force. Furthermore, according to the Federal Reserve, accumulated bank savings for the lowest-paid 20% of workers have been shrinking since last summer, which should incentivize job seeking (Chart 11). Chart 10Labor Participation Has Further Scope To Recover
Labor Participation Has Further Scope To Recover
Labor Participation Has Further Scope To Recover
Chart 11Depleted Savings Will Force More Lower-Wage Workers Into The Labor Market
Depleted Savings Will Force More Lower-Wage Workers Into The Labor Market
Depleted Savings Will Force More Lower-Wage Workers Into The Labor Market
Second, long-term inflation expectations remain well contained, which makes a soft landing more likely. Median expected inflation 5-to-10 years out in the University of Michigan survey stood at 3% in May, roughly where it was between 2005 and 2013 (Chart 12). Median expected earnings growth in the New York Fed Survey of Consumer Expectations was only slightly higher in April than it was prior to the pandemic (Chart 13). Chart 12Consumer Long-Term Inflation Expectations Have Risen But Remain Relatively Low
Consumer Long-Term Inflation Expectations Have Risen But Remain Relatively Low
Consumer Long-Term Inflation Expectations Have Risen But Remain Relatively Low
Chart 13US Consumers Do Not Expect Wages To Grow At A Much Higher Rate Than In The Pre-Pandemic Period
US Consumers Do Not Expect Wages To Grow At A Much Higher Rate Than In The Pre-Pandemic Period
US Consumers Do Not Expect Wages To Grow At A Much Higher Rate Than In The Pre-Pandemic Period
A third reason for thinking that a soft landing may be easier to achieve this time around is that the US private-sector financial balance – the difference between what the private sector earns and spends – is still in surplus (Chart 14). This stands in contrast to the lead-up to both the 2001 and 2008-09 recessions, when the private sector was living beyond its means. Q: You have spoken a lot about the US, but the situation seems dire elsewhere. Europe may already be in recession as we speak! A: The near-term outlook for Europe is indeed challenging. The euro area economy grew by only 0.8% annualized in the first quarter. Mathieu Savary, BCA’s Chief European Strategist, expects an outright decline in output in Q2. To no one’s surprise, the war in Ukraine is weighing on European growth. The Bundesbank estimates that a full embargo of Russian oil and gas would reduce German real GDP by an additional 5% on top of the damage already inflicted by the war (Chart 15). Chart 14The US Private-Sector Financial Balance Remains In Surplus
The US Private-Sector Financial Balance Remains In Surplus
The US Private-Sector Financial Balance Remains In Surplus
Chart 15Germany’s Economy Will Sink Without Russian Energy
Goldilocks: A Skeptical Q&A
Goldilocks: A Skeptical Q&A
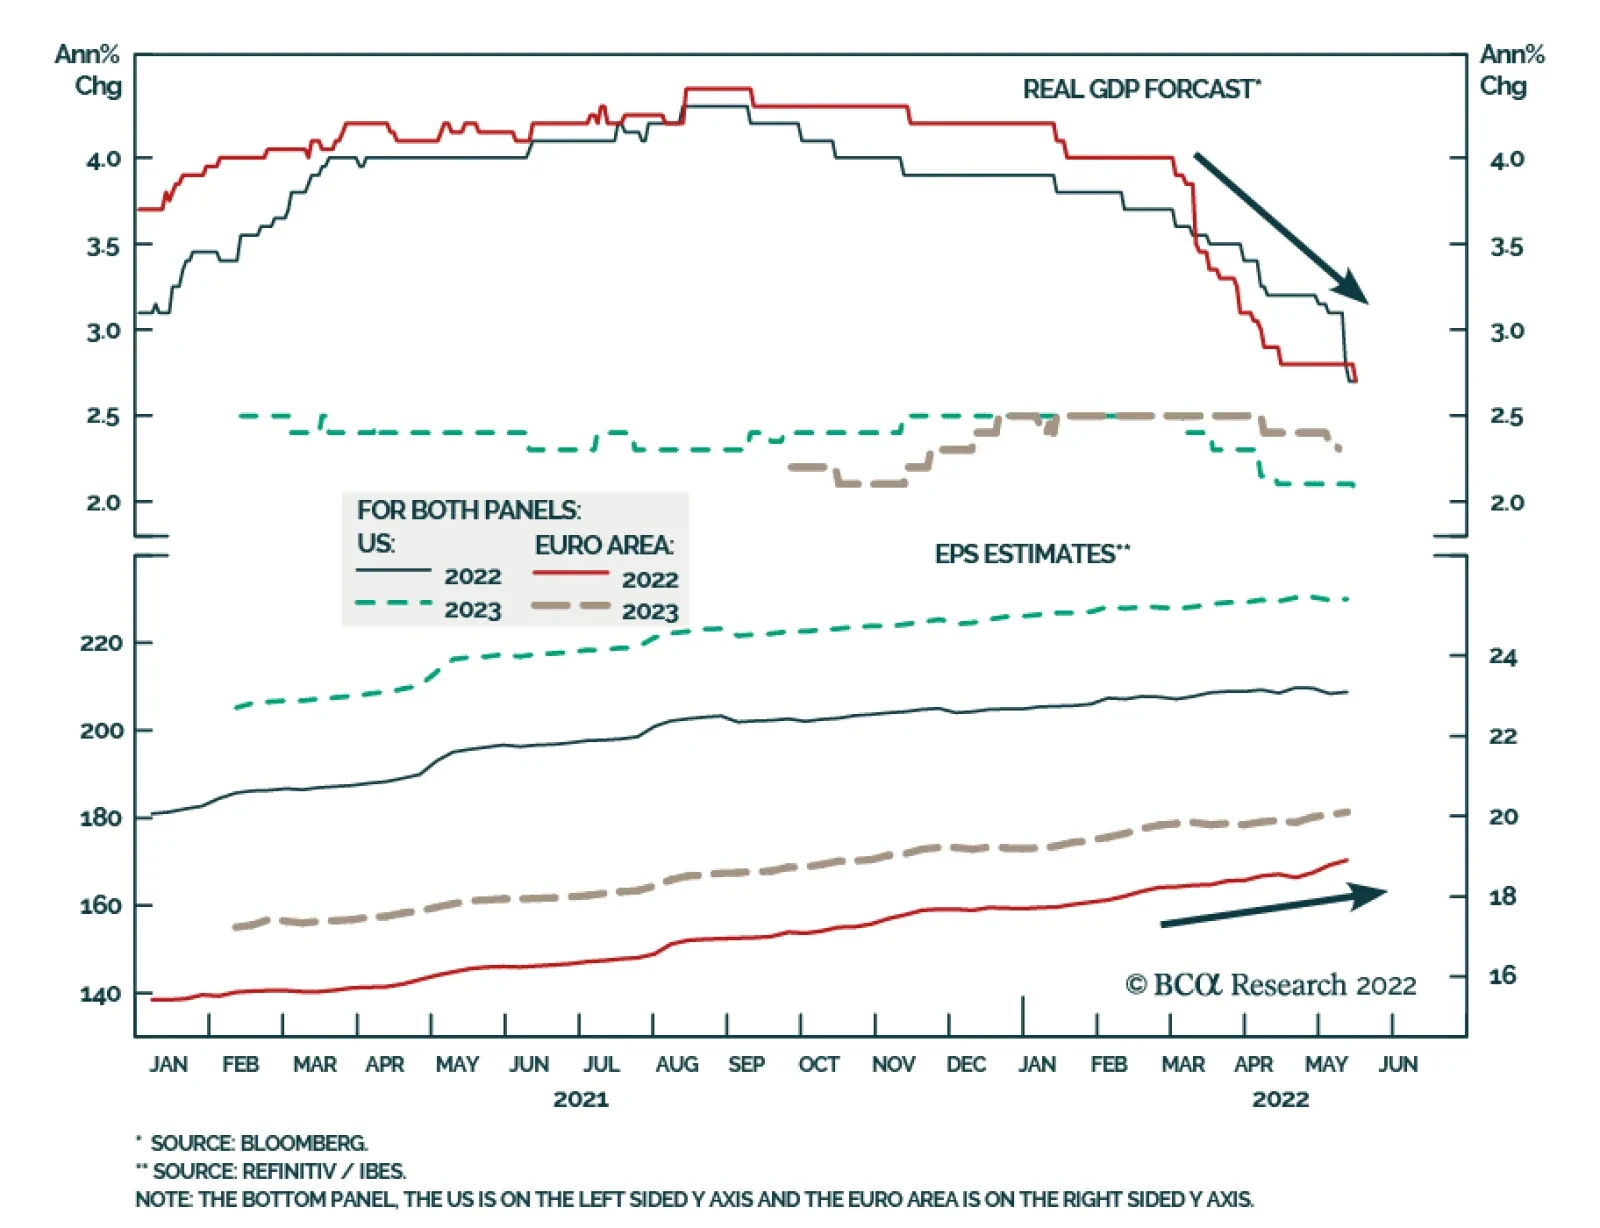
While such a full embargo is possible, it is not our base case. In a remarkable about-face, Putin now says he has “no problems” with Finland and Sweden joining NATO, provided that they do not place military infrastructure in their countries. He had previous threatened a military response at the mere suggestion of NATO membership. In any case, there are few signs that Putin’s increasingly insular and dictatorial regime would respond to an oil embargo or other economic incentives. The wealthy oligarchs who were supposed to rein him in are cowering in fear. It is also not clear if Europe would gain any political leverage over Russia by adopting policies that push its own economy into a recession. It is worth noting that the price of the December 2022 European natural gas futures contract is down 39% from its peak at the start of the war (Chart 16). It is also noteworthy that European EPS estimates have been trending higher this year even as GDP growth estimates have been cut (Chart 17). This suggests that the analyst earnings projections were too conservative going into the year. Chart 16European Natural Gas Futures Are High But Below Their Peak
European Natural Gas Futures Are High But Below Their Peak
European Natural Gas Futures Are High But Below Their Peak
Chart 17European And US EPS Estimates Have Been Trending Higher This Year
European And US EPS Estimates Have Been Trending Higher This Year
European And US EPS Estimates Have Been Trending Higher This Year
Chart 18Chinese Property Sector: Signs Of Contraction
Chinese Property Sector: Signs Of Contraction
Chinese Property Sector: Signs Of Contraction
Q: What about China? The lockdowns are crippling growth and the property market is in shambles. A: There is truth to both those claims. The government has all but said that it will not abandon its zero-Covid policy anytime soon, even going as far as to withdraw from hosting the 2023 AFC Asian Cup. While the number of new cases has declined sharply in Shanghai, future outbreaks are probable. On the bright side, China is likely to ramp up domestic production of Pfizer’s Paxlovid drug. Increased availability of the drug will reduce the burden of the disease once social distancing restrictions are relaxed. As far as the property market is concerned, sales, starts, completions, as well as home prices are all contracting (Chart 18). BCA’s China Investment Strategy expects accelerated policy easing to put the housing sector on a recovery path in the second half of this year. Nevertheless, they expect the “three red lines” policy to remain in place, suggesting that the rebound in housing activity will be more muted than in past recoveries.2 Ironically, the slowdown in the Chinese housing market may not be such a bad thing for the rest of the world. Remember, the main problem these days is inflation. To the extent that a sluggish Chinese housing market curbs the demand for commodities, this could provide some relief on the inflation front. Q: So bad news is good news. Interesting take. Let’s turn to markets. You mentioned earlier that equity sentiment was very bearish. Fair enough, but I would note the very same American Association of Individual Investors survey that you cited also shows that investors’ allocation to stocks is near record highs (Chart 19). Shouldn’t we look at what investors are doing rather than what they’re saying? A: The discrepancy may not be as large as it seems. As Chart 20 illustrates, investors may not like stocks, but they like bonds even less. Chart 19Individual Investors Still Hold A Lot Of Stock
Individual Investors Still Hold A Lot Of Stock
Individual Investors Still Hold A Lot Of Stock
Image
Chart 20B... But They Like Bonds Even Less
... But They Like Bonds Even Less
... But They Like Bonds Even Less
Chart 21Global Equities Are More Attractively Valued After The Recent Sell-Off
Global Equities Are More Attractively Valued After The Recent Sell-Off
Global Equities Are More Attractively Valued After The Recent Sell-Off
Global equities currently trade at 15.3-times forward earnings; a mere 12.5-times outside the US. The global forward earnings yield is 6.7 percentage points higher than the global real bond yield. In 2000, the spread between the earnings yield and the real bond yield was close to zero (Chart 21). It should also be mentioned that institutional data already show a sharp shift out of equities. The latest Bank of America survey revealed that fund managers cut equity allocations to a net 13% underweight in May from a 6% overweight in April and a net 55% overweight in January. Strikingly, fund managers were even more underweight bonds than stocks. Cash registered the biggest overweight in two decades. Q: Your bullish equity bias notwithstanding, you were negative on tech stocks last year, arguing that the NASDAQ would turn into the NASDOG. Given that the NASDAQ Composite is down 29% from its highs, is it time to increase exposure to some beaten down tech names? A: Both the cyclical and structural headwinds facing tech stocks that we discussed in These Three High-Flying Equity Sectors Could Come Crashing Back Down To Earth and The Disruptor Delusion remain in place. Nevertheless, with the NASDAQ Composite now trading at 22.6-times forward earnings, down from 32.9 at its peak last year, an underweight in tech is no longer appropriate (Chart 22). A neutral stance is now preferable. Chart 22Tech Stock Valuations Have Returned To Earth
Tech Stock Valuations Have Returned To Earth
Tech Stock Valuations Have Returned To Earth
Q: I guess if bond yields come down a bit more, that would help tech stocks? A: Yes. Tech stocks tend to be growth-oriented. Falling bond yields raise the present value of expected cash flows more for growth companies than for other firms. While we do expect global bond yields to eventually rise above current levels, yields are likely to decline modestly over the next 12 months as inflation temporarily falls. We expect the US 10-year yield to end the year at around 2.5%. Q: A decline in US bond yields would undermine the high-flying dollar, would it not? A: It depends on how bond yields abroad evolve. US Treasuries tend to be relatively high beta, implying that US yields usually fall more when global yields are declining (Chart 23). Thus, it would not surprise us if interest rate differentials moved against the dollar later this year. Chart 23US Treasuries Have A Higher Beta Than Most Other Government Bond Markets
US Treasuries Have A Higher Beta Than Most Other Government Bond Markets
US Treasuries Have A Higher Beta Than Most Other Government Bond Markets
It is also important to remember that the US dollar is a countercyclical currency (Chart 24). If global growth picks up as pandemic dislocations fade and the Ukraine war winds down, the dollar is likely to weaken. Chart 24The Dollar Is A Countercyclical Currency
The Dollar Is A Countercyclical Currency
The Dollar Is A Countercyclical Currency
Image
A wider trade deficit could also imperil the greenback. The US trade deficit has increased from US$45 billion in December 2019 to US$110 billion. Equity inflows have helped finance the trade deficit, but net flows have turned negative of late (Chart 25). Finally, the dollar is quite expensive – 27% overvalued based on Purchasing Power Parity exchange rates. Q: Let’s sum up. Please review your asset allocation recommendations both for the next 12 months and beyond. A: To summarize, global inflation has peaked. Growth should pick up later this year as supply-chain bottlenecks abate. The combination of falling inflation and supply-side led growth will provide a springboard for equities. We expect global stocks to rise 15%-to-20% over the next 12 months. Historically, non-US stocks have outperformed their US peers when the dollar has been weakening (Chart 26). EM stocks, in particular, have done well in a weak dollar environment Chart 26Non-US Stocks Will Benefit From A Weaker US Dollar
Non-US Stocks Will Benefit From A Weaker US Dollar
Non-US Stocks Will Benefit From A Weaker US Dollar
Chart 27The Market Is Too Pessimistic On Default Risk
The Market Is Too Pessimistic On Default Risk
The Market Is Too Pessimistic On Default Risk
Within fixed-income portfolios, we recommend a modest long duration stance over the next 12 months. We favor high-yield credit over safer government bonds. US high-yield spreads imply a default rate of 6.2% over the next 12 months compared to a trailing 12-month default rate of only 1.2% (Chart 27). Chart 28Falling Inflation Will Buoy Consumer Sentiment
Falling Inflation Will Buoy Consumer Sentiment
Falling Inflation Will Buoy Consumer Sentiment
Our guess is that this Goldilocks environment will end towards the end of next year. As inflation comes down, real wage growth will turn positive. Consumer confidence, which is now quite depressed, will improve (Chart 28). Stronger demand will cause inflation to reaccelerate in 2024, setting the stage for another round of central bank rate hikes. Peter Berezin Chief Global Strategist peterb@bcaresearch.com Follow me on LinkedIn Twitter Footnotes 1 The Federal Reserve targets an average inflation rate of 2% for the Personal Consumption Expenditures (PCE) index. Due to compositional differences between the two indices, CPI inflation has historically averaged 30-to-50 basis points higher than PCE inflation. This is why the Fed effectively targets a CPI inflation rate of 2.3%-to-2.5%. 2 The People’s Bank of China and the housing ministry issued a deleveraging framework for property developers in August 2020, consisting of a 70% ceiling on liabilities-to-assets, a net debt-to-equity ratio capped at 100%, and a limit on short-term borrowing that cannot exceed cash reserves. Developers breaching these “red lines” run the risk of being cut off from access to new loans from banks, while those who respect them can only increase their interest-bearing borrowing by 15% at most. Global Investment Strategy View Matrix
Goldilocks: A Skeptical Q&A
Goldilocks: A Skeptical Q&A
Special Trade Recommendations Current MacroQuant Model Scores
Goldilocks: A Skeptical Q&A
Goldilocks: A Skeptical Q&A
Listen to a short summary of this report. Executive Summary EUR/JPY And The DXY: Unsustainable Gap
EUR/JPY And The DXY: Unsustainable Gap
EUR/JPY And The DXY: Unsustainable Gap
Three interrelated themes are likely to play out by the end of 2022 – peak Fed hawkishness, continued central bank convergence, and nascent green shoots in global economic growth. We are playing the first theme via an outright short DXY position. We are also hedging this bet through a short EUR/JPY trade, a corresponding play on the second theme. Betting on nascent green shoots in economic growth can be expressed via a long Aussie position, or more prudently, a short CHF/SEK bet. We are long a CAD and NOK basket against the RUB, a play on an eventual recovery in oil demand, and the premium that these blends will continue to command relative to Russian oil. Finally, most of our trades remain at the crosses due to elevated FX volatility which has boosted safe-haven demand for the dollar. The admission of Sweden and Finland into NATO could increases the risk of miscalculation on the part of Russia, which will continue to prop near-term safe-haven demand for the dollar. RECOMMENDATIONS INCEPTION LEVEL inception date RETURN Short EUR/JPY 133.28 2022-05-12 -0.73 Bottom Line: Continue to focus on relative value trades at the crosses, until signs emerge that FX volatility is peaking, which will be more conducive for direct USD bets. Feature Chart 1Dollar Capitulation Occurs At Record Valuation And A Record Deficit
Dollar Capitulation Occurs At Record Valuation And A Record Deficit
Dollar Capitulation Occurs At Record Valuation And A Record Deficit
Last week’s report focused on the key reasons why longer-term investors should begin to fade dollar strength. For one, the dollar already imbeds a hefty safe-haven premium. This premium manifests itself in an overvalued exchange rate (Chart 1). A simple PPP model shows that the dollar is overvalued by 27%. This is higher than the peak in the US dollar which preceded the bear market that began in the early 2000s. While valuations tend to matter little until they trigger a tipping point, such an inflection point could be around the corner. One catalyst has been the widening trade deficit which needs to be financed via foreign capital inflows. The US trade deficit continues to deteriorate, hitting a record low of $109.8bn in March. Over the last few years, it has become increasingly difficult to fund this widening trade deficit through foreign purchases of US Treasuries. That said, FX markets are likely to focus on three interrelated themes in the near term – peak Fed hawkishness, continued central bank convergence, and the potential for nascent green shoots in global economic growth. We are playing the first theme via an outright short DXY position. We are also hedging this bet with a short EUR/JPY trade, a corresponding play on the second theme. In the next few sections, we go through a few trades that would benefit from these themes. Short EUR/JPY: A Defensive Play Most of our trades in the portfolio are pro-risk. As such, a short EUR/JPY position acts as an attractive hedge in the near term. The DXY index has historically traded in perfect inverse correlation to the euro-yen exchange rate, but an unusually wide gap has opened up (Chart 2). In our view, this suggests that the collapse in the yen, relative to the euro, is very much overdone. In a risk-off environment, as we witnessed on Wednesday, EUR/JPY will sell off. Meanwhile, there are also fundamental reasons to suggest that this cross is stretched on a longer-term time horizon. First, the cross is expensive on a PPP basis. Chart 3 shows that EUR/JPY usually peaks when the real effective exchange rate is 1.5 standard deviations above its long-term mean. Today’s valuation pins it close to that, among the highest levels since the 1980s. Standard economic theory suggests that a reversal in the cross will be warranted to realign euro area competitiveness relative to Japan. Chart 2EUR/JPY And The DXY: Unsustainable Gap
EUR/JPY And The DXY: Unsustainable Gap
EUR/JPY And The DXY: Unsustainable Gap
Chart 3EUR/JPY Is Not Cheap
EUR/JPY Is Not Cheap
EUR/JPY Is Not Cheap
Meanwhile, there is a case to be made that an expensive EUR/JPY exchange rate is already affecting relative competitiveness. European exports are relapsing relative to those in Japan, which usually ensues after a period of euro-yen strength. Case in point: German factory orders are already contracting, while machinery orders in Japan remain relatively robust (Chart 4). Second, the European Central Bank has been relatively hawkish, vis-à-vis the Bank of Japan. The yield on December 2022 Euribor contracts is 78bps above the TIBOR equivalent, suggesting the ECB will hike rates 4-5 times this year versus the BoJ. Granted, inflation is overshooting in Europe relative to Japan (Chart 5). But as we have been witnessing around the world from the UK to Canada, and all the way to Australia, rising inflation is a global problem. If it persists, it will also begin to meaningfully show up in the Japanese numbers. This will nudge the BoJ away from the ultra-dovish camp. More likely, inflation will moderate, which will allow the ECB to dial back its hawkish rhetoric. Chart 4Europe Is Losing Competitiveness To Japan
Europe Is Losing Competitiveness To Japan
Europe Is Losing Competitiveness To Japan
Chart 5Eurozone Inflation Could Subside In The Coming Months
Eurozone Inflation Could Subside In The Coming Months
Eurozone Inflation Could Subside In The Coming Months
Even if inflation moderates in the eurozone, short-term real rates will remain deeply negative compared to Japan. This will be a significant drag for relative fixed income flows and the currency (Chart 6). At the same time, higher inflation in Europe also suggests the fair value for EUR/JPY should continue its structural downtrend. Chart 6Real Rates Are Very Low In The Eurozone
Real Rates Are Very Low In The Eurozone
Real Rates Are Very Low In The Eurozone
Third, oil price volatility will remain high in the near term but will subside longer term. We are cognizant of the fact that, our Chief Commodity Strategist, Robert Ryan, expects the geopolitical risk premium in oil to increase in the near term. When rising oil coincides with rebounding economic activity, the yen tends to lag as a defensive currency (Chart 7). This time around, the premium in energy markets has come from a cutoff in Russian supplies. Japan imports almost all its energy and has structurally been more dependent on fossil fuels than Europe (Chart 8). This has boosted EUR/JPY and is a risk to a short position. Chart 7EUR/JPY Tracks Oil
EUR/JPY Tracks Oil
EUR/JPY Tracks Oil
Chart 8Japan Will Accelerate A Shift From Fossil Fuels
Japan Will Accelerate A Shift From Fossil Fuels
Japan Will Accelerate A Shift From Fossil Fuels
That said, adjustments are already underway. Japanese and European LNG imports from the US are rising. As a result, the price arbitrage between US Henry Hub prices and the Dutch TTF equivalent are collapsing (Chart 9). The Japanese have already ramped up nuclear power production, reducing their dependence on fossil fuels (Chart 10). That will be a welcome fillip for the Japanese trade balance. In a nutshell, a lot of bad news is already priced in the yen. As such, it has become an attractive hedge. Asian clients not willing to short the euro can short CNY/JPY as a close proxy. Interestingly, CNY/JPY has made a classic double-top and could meaningfully depreciate from current levels (Chart 11), along with EUR/JPY. Chart 9The European And Asian Natgas Premium Is Deflating
The European And Asian Natgas Premium Is Deflating
The European And Asian Natgas Premium Is Deflating
Chart 10A Nuclear Renaissance In Japan?
A Nuclear Renaissance In Japan?
A Nuclear Renaissance In Japan?
Chart 11CNY/JPY: A Double Top?
CNY/JPY: A Double Top?
CNY/JPY: A Double Top?
Short CHF/JPY: Still Attractive, But Taking Profits We also played a long yen leg via a short CHF position but our trailing stop was triggered this week at 130 for a profit of 3.74%. While we believe the cross still faces meaningful downside, we will opportunistically look to sell CHF/JPY again at 135. First, historically, CHF/JPY has inversely tracked the inflation profiles between Switzerland and Japan. Given the collapse in the yen, and much higher Swiss inflation, CHF/JPY has become incrementally more expensive, especially relative to history (Chart 12). To realign competitiveness, the cross should depreciate. Second, from a technical perspective, CHF/JPY is in a classic double-top formation (Chart 13), akin to CNY/JPY. This suggests the safe-haven premium is much higher in the franc than it is in the yen. Chart 12Swiss Inflation Is Lowering CHF"s Puchasing Power
Swiss Inflation Is Lowering CHF"s Puchasing Power
Swiss Inflation Is Lowering CHF"s Puchasing Power
Chart 13CHF/JPY: Look To Go Short Again
CHF/JPY: Look To Go Short Again
CHF/JPY: Look To Go Short Again
The key risk to this trade is that the Swiss equity market is more defensive relative to Japanese bourses. As such, the hefty safe-haven premium in the franc could persist (Chart 14), pushing the cross to our initial entry short point at 135. Chart 14Swiss Equities Could See Inflows Near Term
Swiss Equities Could See Inflows Near Term
Swiss Equities Could See Inflows Near Term
Short CHF/SEK: A Play On The Riksbank’s U-Turn Chart 15Short CHF/SEK Is The Great Value/Growth Play Value/Growth Turns Before The Dollar
Short CHF/SEK Is The Great Value/Growth Play Value/Growth Turns Before The Dollar
Short CHF/SEK Is The Great Value/Growth Play Value/Growth Turns Before The Dollar
Last month, we argued that the dip in the Swedish krona had already priced a recession in the domestic economy. Meanwhile, with a mandate of price stability, we argued the Riksbank will have no choice but to turn more hawkish or lose credibility. As a play on this trend, we recommended going long the SEK relative to the CHF. In a major policy U-turn, the Riksbank raised rates and announced a faster pace of balance-sheet reduction. Most of the arguments made in the original report remain valid, so we will not revisit them here. The one point we will stress is that Sweden’s small open economy makes the SEK very sensitive to global economic conditions. One benefit of a short CHF/SEK position is that while value has been outperforming growth during this selloff, CHF/SEK remains strong which is a departure from the traditional relationship (Chart 15). Ergo, a major safety discount is imbedded in the SEK. Related Report Foreign Exchange StrategyMonth In-Review: A Hefty Safe-Haven Premium In The Dollar Sweden’s bourse is heavy in cyclicals, with large overweight positions in financials and industrials, that will benefit from a renewed capital spending cycle, and higher global rates. Meanwhile, the outperformance of value during a market riot point suggests a change in market leadership could be underway, even if bond yields temporarily crater. The krona remains vulnerable to geopolitical risk, especially if Russia retaliates against Sweden and Finland joining NATO. So far, Russia’s response has been muted. As such, while this pro-cyclical trade faces near-term risk, it remains a safer way, in our view, to play SEK strength. Long AUD: Bet On An Eventual China Rebound Chart 16The AUD And China
The AUD And China
The AUD And China
We will be discussing Australia in an in-depth report next week, so we will keep our comments brief this week. What we will say is that the Aussie is one of the best candidates to play a rebound in global growth, given that it sits near the epicenter of where that growth will likely emanate from – China (Chart 16). Right now, the picture is not pretty, but it is always dark before dawn. Stay tuned. Long (CAD+NOK)/RUB: A Relative Value Play As many countries reroute their oil supplies from Russia to other countries, Canada and Norway could stand to benefit from a relative perspective. Understandably, many clients might not be able to trade the RUB, so we are filing this trade under speculative. First, both Brent and Western Canadian Select oil are trading at a significant premium to the Urals blend, which is likely to be sustained in the next 6 months. This will benefit NOK and CAD, relative to the ruble (Chart 17). Chart 17CAD And NOK Will Benefit From Premium Oil
CAD And NOK Will Benefit From Premium Oil
CAD And NOK Will Benefit From Premium Oil
Second, from an FX point of view, Russia faces the trilemma of the impossible trinity – having decided to limit the free flow of capital, it has chosen independent monetary policy and managing the exchange rate. This will come at a cost, however: As the economy comes grinding to a halt and inflation surges, interest rates will have to stay high to maintain currency stability. This will crush the domestic economy for years to come. Luckily, Russia has a healthy current account surplus, but as production in Canada and Norway improve to offset embargoes on Russian crude, this will also boost their external balance. Long EUR/GBP: The Euro Is More Priced For A Recession We have discussed at length the rationale behind our long EUR/GBP position, so we will not reiterate the arguments here. Our Global Fixed Income colleagues upgraded Gilts to overweight last week, in line with expectations that markets will continue pricing a dovish tilt from the BoE. In our view, the EUR/GBP cross still heavily underprices the risks to the UK economy in the near term. As such, if interest rates in the UK continue to fall relative to those in the eurozone, EUR/GBP will benefit (Chart 18). Chart 18EUR/GBP Has Upside
EUR/GBP Has Upside
EUR/GBP Has Upside
Chester Ntonifor Foreign Exchange Strategist chestern@bcaresearch.com Trades & Forecasts Strategic View Cyclical Holdings (6-18 months) Tactical Holdings (0-6 months) Limit Orders Forecast Summary
Global growth headwinds have increased since the start of the year. Commodity prices have soared on the back of the war in Ukraine. The Eurozone’s near-term economic outlook has dimmed and is at risk of a more severe deterioration if Russia deprives it of its…
Executive Summary Loss Of Russian Production Will Lift Brent
Loss Of Russian Production Will Lift Brent
Loss Of Russian Production Will Lift Brent
With German imports of Russian oil close to 10% of its total requirements – following an impressive decline from 35% pre-invasion – we expect the EU to declare an embargo on Russian oil imports this week or next. Smaller states – e.g., Hungary and Slovokia – will be granted embargo waivers; their import volumes will not affect the EU effort. Russia will be forced to shut in ~ 1.6mm b/d of production, rising to 2mm b/d next year (vs. pre-invasion levels). Demand will fall as Brent prices surpass $120/bbl by 2H22, in our revised base case. Prices above $140/bbl are likely if Russia immediately halts EU oil exports. Our revised forecast calls for Brent to average $113/bbl this year, and $122/bbl next year. WTI will trade $3/bbl lower. Per earlier threats, Russia will cut EU natgas exports following the EU embargo. Benchmark euro natgas prices will go back above €225/MWh, and trigger an EU recession. Bottom Line: An EU embargo on Russian oil imports is close. Brent crude will rally above $120/bbl by 2H22, with $140/bbl or higher likely, depending on how quickly Russia reacts to the EU oil embargo. Eurozone natgas will trade above €225/MWh again. We remain long the S&P GSCI index, the COMT ETF, and the XOP and CRAK ETFs to retain exposure to higher prices. We are getting long 1Q23 ICE Brent futures and 4Q22 TTF futures at tonight's close. Feature Related Report Commodity & Energy StrategyDie Cast By EU: Inflation, Recession Risks Rise The stage is set for the EU to announce an embargo on Russian oil imports this week or next. Odds of an EU embargo being declared sooner rather than later increased, in our view, in the wake of Germany's success in cutting Russian oil imports by more than half in a very short period – from ~ 35% prior to Russia's invasion of Ukraine on 24 February to ~ 12% earlier this month (Chart 1). Further reductions in Russian oil imports we expect from Germany will make it easier for the EU's largest economy to walk away from Russian crude and product imports sooner rather than later.1 Other EU member states already stand with Germany on the issue of an embargo on Russian imports. Those that do not – Hungary and Slovakia, e.g. – do not import Russian oil on a scale that can meaningfully derail EU solidarity on the embargo, which means waivers for these states can be expected to keep the embargo on track. In addition, four of the Five-Eyes states – the US, UK, Australia and Canada – already have imposed embargoes on Russian oil imports. Chart 1EU Energy Import Dependency (2021)
EU Energy Import Dependency (2021)
EU Energy Import Dependency (2021)
Russian Shut-ins Will Tighten Supply The immediate fallout of the EU embargo will be to accelerate the rate at which Russia is forced to shut in production, as increasing volumes of its oil remain stranded on the water looking for a home. We reckon 1mm b/d or so of Russian crude oil output already has been cut. This will continue to increase. Russia will be forced to shut in ~ 1.6mm b/d of crude output this year, rising to 2mm b/d next year (averages vs. pre-invasion levels), in our modelling. This takes Russian oil production down to 8.4mm b/d this year, on average, and 8.0mm b/d next year.2 As more and more Russian crude is shut in, the pipelines carrying Urals and Eastern Siberia-Pacific Ocean (ESPO) crude from the Siberian oil fields to ports will fill, along with inventory in the ports where ships are loaded for export. When storage and pipelines fill, the only alternative Russian producers will have will be to shut in crude and condensate production. While some states obviously will benefit from the increasing availability of Russian crude on offer at 30% discounts or more – e.g., India and China – there is a limit as to how much surplus Russian output they can take in. China, in particular, will not want to jeopardize long-term contracts with key suppliers – e.g., the Kingdom of Saudi Arabia (KSA) – nor will India, which will limit the total volumes both are willing to take from Russia longer term. Security of supply becomes an increasingly important consideration as Russia's oil output continues a long-term decline going forward: Costs were rising prior to Russia's invasion of Ukraine from 2008 to 2019. Falling drilling efficiency and production, were accompanied by rising water cuts – i.e., the amount of water being produced drilling for oil – in Russia's largest fields, which rose to as high as 86%. Shutting production from these older fields will force hard choices as to whether these fields are ever revived.3 Demand Will Be Stressed Shortly after Russia invaded Ukraine, the country's Energy Ministry Alexander Novak warned the EU it would cut off natural gas pipeline supplies being sent to the continent, in retaliation for embargoing oil imports.4 Oil exports of close to 5mm b/d accounted for just under half of Russia's revenue from energy exports last year, with OECD Europe representing half of that amount.5 For Russia, oil exports are far more important than gas exports, which will incline it to immediately cut pipeline flows to Europe as soon as an oil embargo is announced. For the EU, natgas exports from Russia are critical to the economies of its member states (Chart 2). The EU imported ~ 155 bcm of natgas from Russia in 2021, or just over 40% of its total natgas consumption. Germany's share amounted to 45 bcm, or 45% of domestic gas use . If, as we expect, the EU is close to announcing its oil embargo on Russia, an immediate retaliation from Moscow in the form of a cutoff of pipeline exports to the EU most likely will follow. This will throw the EU into a recession, as natgas prices surge. Chart 2Losing Russia's Natgas Will Be Painful For EU
Oil, Natgas Prices Set To Surge
Oil, Natgas Prices Set To Surge
Revised Forecast Reflects Falling Russian Output We are revising our Brent forecast and crude oil balances in line with our expectation Russian oil output will decline meaningfully. As noted above, we now expect Russian crude oil output to fall to 8.4mm b/d this year and 8.0mm b/d in 2023. This pushes non-core OPEC 2.0 production – which now includes Russia – lower, as a result (Chart 3). We moved Russia out of the core OPEC 2.0 producer group, given the production declines we expect this year and next, and into the "Other Guys" group. Our base case demand reflects a shift in OECD vs. non-OECD consumption estimates, with the OECD gaining incrementally, while EM demand (via non-OECD consumption) falls incrementally (Chart 4). Chart 3Falling Russia Output Pushes Non-Core OPEC 2.0 Output Lower
Oil, Natgas Prices Set To Surge
Oil, Natgas Prices Set To Surge
Chart 4DM Demand Shifts Higher, EM Shifts Lower
DM Demand Shifts Higher, EM Shifts Lower
DM Demand Shifts Higher, EM Shifts Lower
The lower EM demand growth reflects weaker China oil consumption resulting from the country's zero-COVID policy. In addition, because we expect Russia to act quickly on cutting off EU natgas exports, benchmark TTF natgas prices will move back above €225/MWh. Higher oil and natgas prices in the EU will lead to recession later this year. How quickly this shows up depends on how quickly Russia reacts to an EU oil embargo. In addition, a strong USD – bid higher by global economic uncertainty and safe-haven demand – will pushing the local-currency costs of refined products like gasoline, diesel and jet fuel higher, also will contribute to lower EM demand (Chart 5). Chart 5USD Remains Well Bid
Oil, Natgas Prices Set To Surge
Oil, Natgas Prices Set To Surge
In our base case, we expect a tighter market on balance (Chart 6). Oil inventories remain under pressure, owing to falling as Russian output and declines in production outside core OPEC 2.0 and the US (Chart 7). We cannot rule out additional SPR releases from the US or IEA to offset tightening global inventories. Chart 6Global Balances Tighten
Global Balances Tighten
Global Balances Tighten
Chart 7Inventories Draw As Supply Tightens
Inventories Draw As Supply Tightens
Inventories Draw As Supply Tightens
Our forecast for Brent this year has been lifted on the back of a much stronger expectation of an EU oil embargo against Russia. This will result in 2mm b/d of Russian production being shut in by next year, which will not be fully replaced (Table 1). We are lifting our Brent forecast to $110/bbl for 2022, and $115/bbl for next year as a result (Chart 8). Chart 8Loss Of Russian Production Will Lift Brent
Loss Of Russian Production Will Lift Brent
Loss Of Russian Production Will Lift Brent
Table 1BCA Global Oil Supply - Demand Balances (MMb/d, Base Case Balances) To Dec23
Oil, Natgas Prices Set To Surge
Oil, Natgas Prices Set To Surge
Investment Implications An EU embargo on Russian oil imports is close at hand, in our view. Brent crude will rally above $120/bbl by 2H22, with $140/bbl or higher possible, depending on Russia's reaction to the EU oil embargo. We expect Brent prices to average $113/bbl this year, and $122/bbl in 2023. WTI will trade $3/bbl lower on average. Eurozone natgas will trade above €225/MWh again and stay at elevated levels, likely moving higher following a Russian cutoff of natgas supplies to the continent. This will throw the EU into recession. We remain long the S&P GSCI index, the COMT ETF, and the XOP and CRAK ETFs to retain exposure to higher prices. We are getting long 1Q23 ICE Brent futures and TTF natgas futures at tonight's close. A word of caution is in order: We are assuming Russia will follow through on its threat to shut off natgas exports to the EU in the event of an embargo against importing its oil is declared. This, we believe, is Russia's red line. If the EU fails to declare an embargo, or if Russia fails to follow through on its threat to cut off gas supplies in the wake of an EU oil embargo of its exports we will have to re-assess our outlook. Robert P. Ryan Chief Commodity & Energy Strategist rryan@bcaresearch.com Ashwin Shyam Research Analyst Commodity & Energy Strategy ashwin.shyam@bcaresearch.com Paula Struk Research Associate Commodity & Energy Strategy paula.struk@bcaresearch.com Commodities Round-Up Energy: Bullish European natural gas inventories are building at a rapid rate, as competition from Asia – typically led by Chinese demand – remains weaker than in previous seasons. EU natgas storage stood at ~446 MWh as of May 16, 2022, the latest available reports indicate (Chart 9). The EU has weathered two extremely difficult winters in 2020-21 and 2021-22. Natgas storage levels were drawn hard to meet space heating demand, which, owing to a winter energy crisis in China at the time, forced European buyers into a competition for liquified natural gas (LNG) during the former period. Following unexpected spring-summer demand in 2021 when cold weather lingered in Europe and wind power generation fell sharply, storage owners again were hard pressed to secure LNG to rebuild storage levels going into this past winter, which caused European TTF natgas prices to soar, as demand surged (Chart 10). With the threat of a cutoff of Russian natgas hanging over the EU, there is a singular focus right now on getting storage as full as possible ahead of next winter. The EU aims to replace two-thirds of Russian gas imports before yearend. Precious Metals: Bullish The Fed has adopted a more hawkish rhetoric, as it acts more aggressively to reduce US inflation. Interest rates have increased from near-zero levels in March to 0.75%, and BCA’s US Bond strategy service expects two more 50 bps rate hikes in June and July. Post July, rate hikes will depend on the Fed’s assessment of inflation, inflation expectations and financial conditions. The Fed faces the risk of either remaining behind the inflation curve or sparking a recession in case it’s either not hawkish enough, or too hawkish. Base Metals: Bullish High power prices in Europe will continue to plague refined base metals production in the continent and keep refined metal prices buoyed. LME Europe aluminum stocks are close to 17-year lows. In China – whose metal smelters were also hit by high power prices in 2021 – aluminum smelting has revived, with the country reportedly producing a record amount of primary aluminum in April. Lockdowns, however, have reduced economic activity, demand for the metal and its domestic price. China has taken advantage of this arbitrage opportunity, sending most of its primary aluminum exports to Europe. This aluminum price spread between the two states has contributed to China’s steady rise in primary aluminum exports this year, after having exported nearly none in 2020 and 2021. Chart 9
Oil, Natgas Prices Set To Surge
Oil, Natgas Prices Set To Surge
Chart 10Dutch Title Transfer Facility Going Down
Dutch Title Transfer Facility Going Down
Dutch Title Transfer Facility Going Down
Footnotes 1 German officials have stated the country will wind down all oil imports from Russia by year end, even if the rest of the EU does not join it in an embargo. We highly doubt Germany will act alone, given the support an embargo already has received from EU member states. Please see Germany to Stop Russian Oil Imports Regardless of EU Sanctions, published by bloomberg.com on May 15, 2022. 2 Our expectation for shut-in volumes is lower than the IEA's, which sees Russia being forced to shut in 3mm b/d of production by 2H22. We continue to monitor this closely via satellite and reporting services and will adjust our estimates as needed. Obviously, if the IEA is correct oil markets will tighten even more than we expect. 3 Please see "The Future of Russian Oil Production in the Short, Medium, and Long Term," published by the Oxford Institute for Energy Studies in September 2019. The OIES study notes production in Russia's highest-producing area – the Khanty-Mansi Autonomous (KMA) district – actually fell 15% between 2008-19, even as drilling activity surged 66%. While output in 2018 rose due to intensified oil recovery (IOR), the OIES noted that the water cut rose sharply in 2018 as well in the KMA district. 4 Please see Russia warns of $300 oil, threatens to cut off European gas if West bans energy imports, published by cnbc.com on March 8, 2022. The article notes Novak threatened to close the Nord Stream 1 pipeline delivering gas to Germany in retaliation for an EU oil embargo. Almost three-quarters of Russia's natgas exports were sent to Europe prior to its invasion of Ukraine. Natgas export revenues accounted for $62 billion of the $242 billion funding Russia's budget last year, while crude oil revenues made up $180 billion (just under 75%). 5 Please see Die Cast By EU: Inflation, Recession Risks Rise, which we published on May 5, 2022. It is available at ces.bcaresearch.com. Investment Views and Themes Recommendations Strategic Recommendations Trades Closed in 2022
After breaking below 1.05 last week, EUR/USD has recently been strengthening. Interestingly, this recovery is occurring amid heightened geopolitical tensions and growth concerns. The odds of an EU embargo on Russian oil have increased and Sweden and Finland…
Executive Summary Global inflation will peak sometime in the next few months, a process that has likely already begun in the US. This will give policymakers some breathing room to turn less hawkish, a more credible stance given softening global growth momentum and increased financial market volatility. Our Global Golden Rule of Bond Investing suggests that overall government bond returns should turn positive over the next year, but with widening divergences across countries for our base case scenarios. Projected government bond return expectations over the next 12 months look most attractive in Australia, Germany and the UK – where far too many rate hikes are priced in – compared to the US, where the Fed is more likely to follow through on most, but not all, discounted rate increases. Japan has the lowest expected returns, and the defensive properties of “low-beta” JGBs will be less necessary with global yield momentum set to peak in the latter half of 2022. Our Global Golden Rule Base Case Scenarios For The Next 12 Months
Updating Our Global Golden Rule Of Bond Investing As Inflation Momentum Peaks
Updating Our Global Golden Rule Of Bond Investing As Inflation Momentum Peaks
Bottom Line: The return expectations over the next year stemming from our Global Golden Rule suggest the following country allocation recommendations in global government bond portfolios: maintain overweights in Australia, Germany and the UK, stay underweight the US and neutral Canada, but downgrade Japan to underweight. Feature Chart 1A Pause In The Global Bond Bear Market
A Pause In The Global Bond Bear Market
A Pause In The Global Bond Bear Market
Global bond markets may finally be showing signs of settling down after a painful period of rising yields and high volatility. Government bond yields across the developed economies have fallen substantially over the past week as equity and credit markets have sold off, in a typical risk-off response to increased concerns over global growth momentum. For example, benchmark 10-year government yields have fallen by -32bps both the US and UK, -25bps in Germany and -22bps in Canada since the cyclical intraday high was reached on May 9. These moves are modest in the context of the cyclical bond bear market, with the Bloomberg Global Treasury index still down -12.1% year-to-date and -14.4% on a year-over-year basis (Chart 1). That painful selloff has been driven by expectations of intense monetary tightening in response to surging global inflation. However, last week’s release of US Consumer Price Index data for April confirmed that US goods inflation has peaked, a trend that we expect to follow suit in other countries (Chart 2). That will leave inflation momentum, and eventual interest rate hikes, to be driven more by domestic services inflation that will prove to be less correlated across countries over the next 6-12 months (Chart 3). Chart 2Inflation & Rate Hike Expectations Have Become Correlated. . .
Inflation & Rate Hike Expectations Have Become Correlated. . .
Inflation & Rate Hike Expectations Have Become Correlated. . .
Chart 3. . .Making Our Global Golden Rule All About Inflation
. . .Making Our Global Golden Rule All About Inflation
. . .Making Our Global Golden Rule All About Inflation
With that in mind, we revisit our framework for linking government bond returns to monetary policy outcomes versus expectations, the Global Golden Rule of Bond Investing. A Brief Overview Of The Global Golden Rule In September 2018, we published a Special Report introducing a government bond return forecasting methodology called the “Global Golden Rule.” This was an extension of a framework introduced by our sister service, US Bond Strategy, that links US Treasury returns (versus cash) to changes in the fed funds rate that were not already discounted in the US Overnight Index Swap (OIS) curve.1 The historical results convincingly showed that investors who "get the Fed right" by making correct bets on changes in the funds rate versus expectations were very likely to make the right call on the direction of Treasury yields and Treasury returns. Related Report Global Fixed Income StrategyRevisiting Our Global Golden Rule Of Bond Investing We discovered that relationship also held in other developed market countries. This gave us a framework to help project expected global bond returns simply based on a view for future central bank interest rate moves versus market expectations.2 Specific details on the calculation of the Global Golden Rule can be found in those original 2018 papers. In the following pages, we present the latest results of the Global Golden Rule for the US, Canada, Australia, the UK, the euro area and Japan. The set-up for the chart shown for each country is the same. We show the 12-month policy rate “surprise”, defined as the actual change in the central bank policy rate over the preceding 12-months versus the expected 12-month change in the policy rate from a year earlier extracted from OIS curves (a.k.a. our 12-month discounters). We then compare the 12-month policy rate surprise to the annual excess return over cash (treasury bills) of the Bloomberg government bond index for each country. We also show the 12-month policy rate surprise versus the 12-month change in the government bond index yield. The very strong historical correlation between those latter two series is the backbone of the Global Golden Rule framework. After that, we present tables showing expected yield changes and excess returns for various maturity points, as well as the overall government bond index, derived from the Global Golden Rule regressions. The expected change in yield is derived from regressions on the policy rate surprises, with different estimations done for each maturity point. In the tables, we show the results for different scenarios for changes in policy rates. For example, the row in the return tables labeled “+25bps” would show the expected yield changes and excess returns if the central bank for that particular country lifts the policy interest rate by +25bps over the next 12 months. Showing these scenarios allows us to pick the one that most closely correlates to our own expectation for central bank actions, translating that into government bond return expectations. Global Golden Rule: US Chart 4Risk/Reward Favors Less UST-Bearish Fed'Surprises'
Risk/Reward Favors Less UST-Bearish Fed'Surprises'
Risk/Reward Favors Less UST-Bearish Fed'Surprises'
US Treasuries have delivered a painful loss of -7.8% versus cash over 12 months. Bearish outcomes of such magnitude were last seen during 1994 and 1999 when the Fed was aggressively lifting the funds rate. The Fed delivered a smaller hawkish surprise over the past year than those 1990s episodes, with a trailing 12-month policy rate surprise of -72bps. Thus, the Golden Rule underestimated losses realized by US Treasuries, as US bond yields moved to price in far more Fed tightening than what was expected one year ago. The US OIS curve now discounts +229bps of rate hikes over the next 12 months, taking the fed funds rate to 3.3% (Chart 4). That is a more aggressive profile than was laid out in the March 2022 Fed “dots”, where the median FOMC member projection called for the funds rate to climb to 2.8% in 2023. That means there is less scope for Fed rate hikes to surprise versus market expectations that are already very hawkish, at a time when US growth and inflation momentum is rolling over. Our base case calls for the Fed to deliver +200bps of rate increases over the next year, +50bps at the next two policy meetings followed by +25bps at the subsequent four meetings. That outcome produces a Golden Rule forecast of the overall US Treasury index yield falling -13bps, generating a total return of +3.73% (Tables 1 & 2). Table 1US: Government Bond Index Total Return Forecasts Over The Next 12 Months
Updating Our Global Golden Rule Of Bond Investing As Inflation Momentum Peaks
Updating Our Global Golden Rule Of Bond Investing As Inflation Momentum Peaks
Table 2US: Expected Changes In Treasury Yields Over The Next 12 Months
Updating Our Global Golden Rule Of Bond Investing As Inflation Momentum Peaks
Updating Our Global Golden Rule Of Bond Investing As Inflation Momentum Peaks
Global Golden Rule: Canada Chart 5Canadian Bonds Selloff After A Hawkish BoC
Canadian Bonds Selloff After A Hawkish BoC
Canadian Bonds Selloff After A Hawkish BoC
Canadian government bonds have sold off hard over the past 12 months, delivering an excess return over cash of -7.5% (Chart 5). That loss reflects the Bank of Canada’s (BoC) hawkish turn, but is a less severe outcome compared to other developed economy government bond markets that saw a major repricing of rate hike expectations like the US and Australia. Losses in the Canadian government bond market were consistent with the +34bps of hawkish surprises delivered by the BoC, which tightened by +75bps on a 12-month basis versus the +41bps expected by markets in May 2021. Rate expectations are highly aggressive on a forward basis. The Canadian OIS curve now discounts 210bps of interest rate increases over the next 12 months. However, high household debt in Canada, fueled by a relentlessly expanding housing bubble, will limit the ability of the BoC to match the Fed’s rate hikes over the next 6-12 months. Higher debt levels also imply a lower nominal neutral rate of interest, as the BoC has less room to hike before debt servicing costs become overly burdensome for overleveraged Canadian consumers. Our base case is that the BoC will deliver +150bps of tightening over the next 12 months. This produces a Golden Rule forecast of a decline in the overall Canadian government bond index yield of -17bps, delivering a projected total return of 4.52% (Tables 3 & 4). Table 3Canada: Government Bond Index Total Return Forecasts Over The Next 12 Months
Updating Our Global Golden Rule Of Bond Investing As Inflation Momentum Peaks
Updating Our Global Golden Rule Of Bond Investing As Inflation Momentum Peaks
Table 4Canada: Expected Changes In Government Bond Yields Over The Next 12 Months
Updating Our Global Golden Rule Of Bond Investing As Inflation Momentum Peaks
Updating Our Global Golden Rule Of Bond Investing As Inflation Momentum Peaks
Global Golden Rule: Australia Chart 6Aggressive Rate Hike Expectations On A Forward Basis For Australia
Aggressive Rate Hike Expectations On A Forward Basis For Australia
Aggressive Rate Hike Expectations On A Forward Basis For Australia
Australian government bonds have delivered a negative excess return over cash of -9.6% over the past year (Chart 6). This is the biggest sell-off among all the countries covered in our Global Golden Rule framework. The magnitude of those realized losses far exceeded what would have been predicted by the Golden Rule a year ago, with the Reserve Bank of Australia (RBA) delivering only a modest hawkish surprise. An unexpectedly high Australian headline inflation print of 5.1% in Q1 of this year led the RBA to deliver a surprise +25bps rate hike in April. This created a mild hawkish policy rate surprise of -17bps over the past 12 months, as only +8bps of tightening had been discounted in the Australian OIS curve in May 2021. The Australian OIS curve is now discounting 292bps of rate hikes over the next year, taking the cash rate to just over 3% - a level last seen in 2013 when the neutral rate in Australia was much higher by the RBA’s own reckoning. The RBA appears confident in the Australian economy, forecasting the unemployment rate to reach a 50-year low around 3.5% in 2023. However, we believe the RBA will be more measured in its pace of rate increases over the next year than markets expect, as global traded goods inflation cools and Australian wages are still not overheating. According to the Golden Rule projections, our base case of +150bps of tightening will produce a decline in Australian government bond index yield of -92bps, delivering a projected total return of 9.29% (Tables 5 & 6). Table 5Australia: Government Bond Index Total Return Forecasts Over The Next 12 Months
Updating Our Global Golden Rule Of Bond Investing As Inflation Momentum Peaks
Updating Our Global Golden Rule Of Bond Investing As Inflation Momentum Peaks
Table 6Australia: Expected Changes In Government Bond Yields Over The Next 12 Months
Updating Our Global Golden Rule Of Bond Investing As Inflation Momentum Peaks
Updating Our Global Golden Rule Of Bond Investing As Inflation Momentum Peaks
Global Golden Rule: UK Chart 7The BoE Will Hike Less Than Markets Expect
The BoE Will Hike Less Than Markets Expect
The BoE Will Hike Less Than Markets Expect
UK government bonds have gotten hit hard over the past year, delivering a negative excess return over cash of -7.9% - one of the worst performances seen over the past quarter century (Chart 7). The size of that loss was in line with the Global Golden Rule forecasts, given the magnitude of the rate shock seen in the UK. The Bank of England (BoE) hiked rates by 90bps over the past 12 months, which was a hawkish surprise of -79bps compared to what was discounted one year earlier. The UK OIS curve is now priced for another +139bps of rate hikes over the next year. This would take the BoE’s Bank Rate to 2.4%, a level that would push the UK unemployment rate up by two percentage points and lower UK inflation to below 2% within the next 2-3 years, according to the BoE’s own forecasting models. As we discussed in our report last week, where we upgraded our stance on UK Gilts to overweight, the neutral level of UK policy rates is between 1.5-2%, at best, with UK potential growth barely above 1%. Thus, markets are already pricing in a very restrictive monetary policy stance from the BoE that is unlikely to be fully delivered before UK growth and inflation decline sharply. Our base case calls for the BoE to deliver only another +75bps of hikes over the next year, which will produce a fall in the UK government bond index yield of -21bps and a total return of 4.12% (Tables 7 & 8). Table 7UK: Government Bond Index Total Return Forecasts Over The Next 12 Months
Updating Our Global Golden Rule Of Bond Investing As Inflation Momentum Peaks
Updating Our Global Golden Rule Of Bond Investing As Inflation Momentum Peaks
Table 8UK: Expected Changes In Gilt Yields Over The Next 12 Months
Updating Our Global Golden Rule Of Bond Investing As Inflation Momentum Peaks
Updating Our Global Golden Rule Of Bond Investing As Inflation Momentum Peaks
Global Golden Rule: Germany Chart 8German Bunds Stand To Gain From An ECB Dovish Surprise
German Bunds Stand To Gain From An ECB Dovish Surprise
German Bunds Stand To Gain From An ECB Dovish Surprise
German government bonds suffered major losses over the past year, underperforming cash by -8.5% over the past year. We saw no policy surprise from the European Central Bank (ECB) over that time relative to market expectations (Chart 8). The dramatic sell-off instead reflected surging expectations of future tightening as the euro area faces an energy-driven inflation spike. The trailing 12-month policy rate surprise for Germany (and the overall euro area) remains stuck near zero. However, markets now expect a very aggressive move by the ECB, discounting a full +156bps of tightening over the next 12 months. This would push the ECB’s main refinancing rate to levels last seen in the disastrous tightening cycle during the 2011 European debt crisis. As argued by our colleagues at BCA Research European Investment Strategy, the euro area is heading into a growth slowdown and energy inflation looks set to peak. Even if the hawks are able to sway the ECB Governing Council to begin hiking rates this summer, the slowing trajectory of growth and inflation make it highly unlikely that the ECB will deliver the full amount of tightening currently discounted. Our base case is that the ECB will deliver only +50bps of tightening over the next 12 months, enough to push the deposit rate out of negative territory to 0%. As shown in Tables 9 & 10, this is consistent with the Germany government bond index yield falling -55bps, delivering an index return of 5.07% over a 12-month horizon. Table 9Germany: Government Bond Index Total Return Forecasts Over The Next 12 Months
Updating Our Global Golden Rule Of Bond Investing As Inflation Momentum Peaks
Updating Our Global Golden Rule Of Bond Investing As Inflation Momentum Peaks
Table 10Germany: Expected Changes In Bund Yields Over The Next 12 Months
Updating Our Global Golden Rule Of Bond Investing As Inflation Momentum Peaks
Updating Our Global Golden Rule Of Bond Investing As Inflation Momentum Peaks
Global Golden Rule: Japan Chart 9The Upside On A BoJ Dovish Surprise Is Limited
The Upside On A BoJ Dovish Surprise Is Limited
The Upside On A BoJ Dovish Surprise Is Limited
Japanese government bonds (JGBs) have delivered an excess return versus cash of -1.8% over the past twelve months (Chart 9). The policy rate surprise was flat as the Bank of Japan (BoJ) kept the policy rate unchanged at -0.1%. Admittedly, the Golden Rule framework is poorly suited to project Japanese bond returns. The BoJ has been unable to lift policy rates for many years, while instituting yield curve control on 10-year JGBs since 2016 to anchor yields near zero. With no variability on policy rates or bond yields, a methodology that links bond returns to unexpected policy interest rate changes will have poor predictive power. However, rates traders are making some attempt to challenge the BoJ’s ultra-dovish posture. The Japan OIS curve now discounts +9bps of tightening, approximately enough to push the policy rate to zero, over the next 12 months. With the yen weakening rapidly and the cost of imported energy elevated, consumer price inflation in Tokyo (excluding fresh food) hit the BoJ’s 2% target in April. However, as evidenced in the minutes of the March BoJ meeting, policymakers see a sustainable inflation overshoot as unlikely. Our base case is the “Flat” scenarios shown in Tables 11 & 12, with the BoJ keeping policy rates unchanged for the next twelve months and delivering a slight dovish surprise. That generates a Golden Rule forecast of a -6bps fall in the Japanese government bond index yield, with a total return projection of 0.87%. Table 11Japan: Government Bond Index Total Return Forecasts Over The Next 12 Months
Updating Our Global Golden Rule Of Bond Investing As Inflation Momentum Peaks
Updating Our Global Golden Rule Of Bond Investing As Inflation Momentum Peaks
Table 12Japan: Expected Changes In JGB Yields Over The Next 12 Months
Updating Our Global Golden Rule Of Bond Investing As Inflation Momentum Peaks
Updating Our Global Golden Rule Of Bond Investing As Inflation Momentum Peaks
Investment Implications Of The Global Golden Rule Projections For all the countries discussed above, our base case calls for the respective central banks to deliver less tightening than markets are discounting over the next year. This suggests that government bonds should be expected to deliver positive returns versus cash, even as we expect multiple rate increases from all central banks except the BoJ. While this could argue for an above-benchmark duration stance at the overall global level, we prefer to translate the Global Golden Rule results via country allocations – as we have greater conviction on relative central bank moves in the current high inflation environment – while keeping overall global duration exposure at neutral. The return outcomes for our base case scenarios for the six countries in our Global Golden Rule framework are presented in Table 13. We show the expected returns both in local currency and hedged into US dollars, the latter allowing a comparison in common currency terms. In our base case scenarios, we expect Australian and German government bonds to deliver the strongest performance over the next year, followed by the UK, Canada, the US and Japan. Table 13Our Global Golden Rule Base Case Scenarios For The Next 12 Months
Updating Our Global Golden Rule Of Bond Investing As Inflation Momentum Peaks
Updating Our Global Golden Rule Of Bond Investing As Inflation Momentum Peaks
Chart 10Downgrade 'Defensive' Low-Yield-Beta JGBs To Underweight
Downgrade 'Defensive' Low-Yield-Beta JGBs To Underweight
Downgrade 'Defensive' Low-Yield-Beta JGBs To Underweight
Our UK upgrade to overweight last week was a change to our strategic call on Gilts. Based on the results from our Global Golden Rule update, increased exposure to UK Gilts should be “funded” in a global bond portfolio by reducing exposure to Japan, with JGBs expected to deliver the weakest returns. Cutting JGB exposure also fits with the signal from our Global Duration Indicator, which is heralding a peak in global bond yield momentum in the latter half of 2022 (Chart 10). JGBs are typically a good “defensive” overweight country allocation in an environment of rising global bond yields. Persistently low Japanese inflation prevents the BoJ from credibly signaling rate hikes when other central banks like the Fed are lifting rates in response to stronger growth or overshooting inflation as is currently the case. The relative performance of Japan versus the Bloomberg Global Treasury benchmark index (in USD-hedged terms) is highly correlated to the year-over-year momentum of the overall level of global bond yields. With our Duration Indicator signaling a peak in yield momentum, we expect JGBs, which continue to exhibit a very low “beta” to changes in global bond yields, to underperform. Thus, this week we are downgrading our strategic allocation to Japan from overweight (4 out of 5) to underweight (2 out of 5). We view this as an offsetting recommendation to our UK upgrade from last week, while leaving our other country allocations unchanged. The result is that our country recommendations now line up with the expected returns from our Global Golden Rule, as can be seen in Table 13. That includes leaving the recommended US Treasury exposure at underweight, as we expect the Fed to deliver the smallest dovish surprise out of the central banks discussed in this report. We are adding both of the view changes made over the past two weeks, upgrading the UK and downgrading Japan, to our model bond portfolio as seen on pages 20-21. Bottom Line: Our Global Golden Rule suggests that developed market government bonds are expected to deliver positive returns over the next year as softening inflation momentum leads central banks to not fully deliver discounted rate hikes. Return expectations look most attractive in Australia, Germany and the UK, especially compared to the US and Japan. Robert Robis, CFA Chief Fixed Income Strategist rrobis@bcaresearch.com Shakti Sharma Senior Analyst ShaktiS@bcaresearch.com Deborah Acri Research Associate deborah.acri@bcaresearch.com Footnotes 1 Please see BCA Research US Bond Strategy Special Report, "The Golden Rule Of Bond Investing", dated July 24, 2018, available at usbs.bcarearch.com. 2 Please see BCA Research Global Fixed Income Strategy Special Report, "The Global Golden Rule Of Bond Investing", dated September 25, 2018, available at gfis.bcaresearch.com. GFIS Model Bond Portfolio Recommended Positioning Active Duration Contribution: GFIS Recommended Portfolio Vs. Custom Performance Benchmark
Updating Our Global Golden Rule Of Bond Investing As Inflation Momentum Peaks
Updating Our Global Golden Rule Of Bond Investing As Inflation Momentum Peaks
The GFIS Recommended Portfolio Vs. The Custom Benchmark Index Global Fixed Income - Strategic Recommendations* Cyclical Recommendations (6-18 Months)
Updating Our Global Golden Rule Of Bond Investing As Inflation Momentum Peaks
Updating Our Global Golden Rule Of Bond Investing As Inflation Momentum Peaks
Tactical Overlay Trades
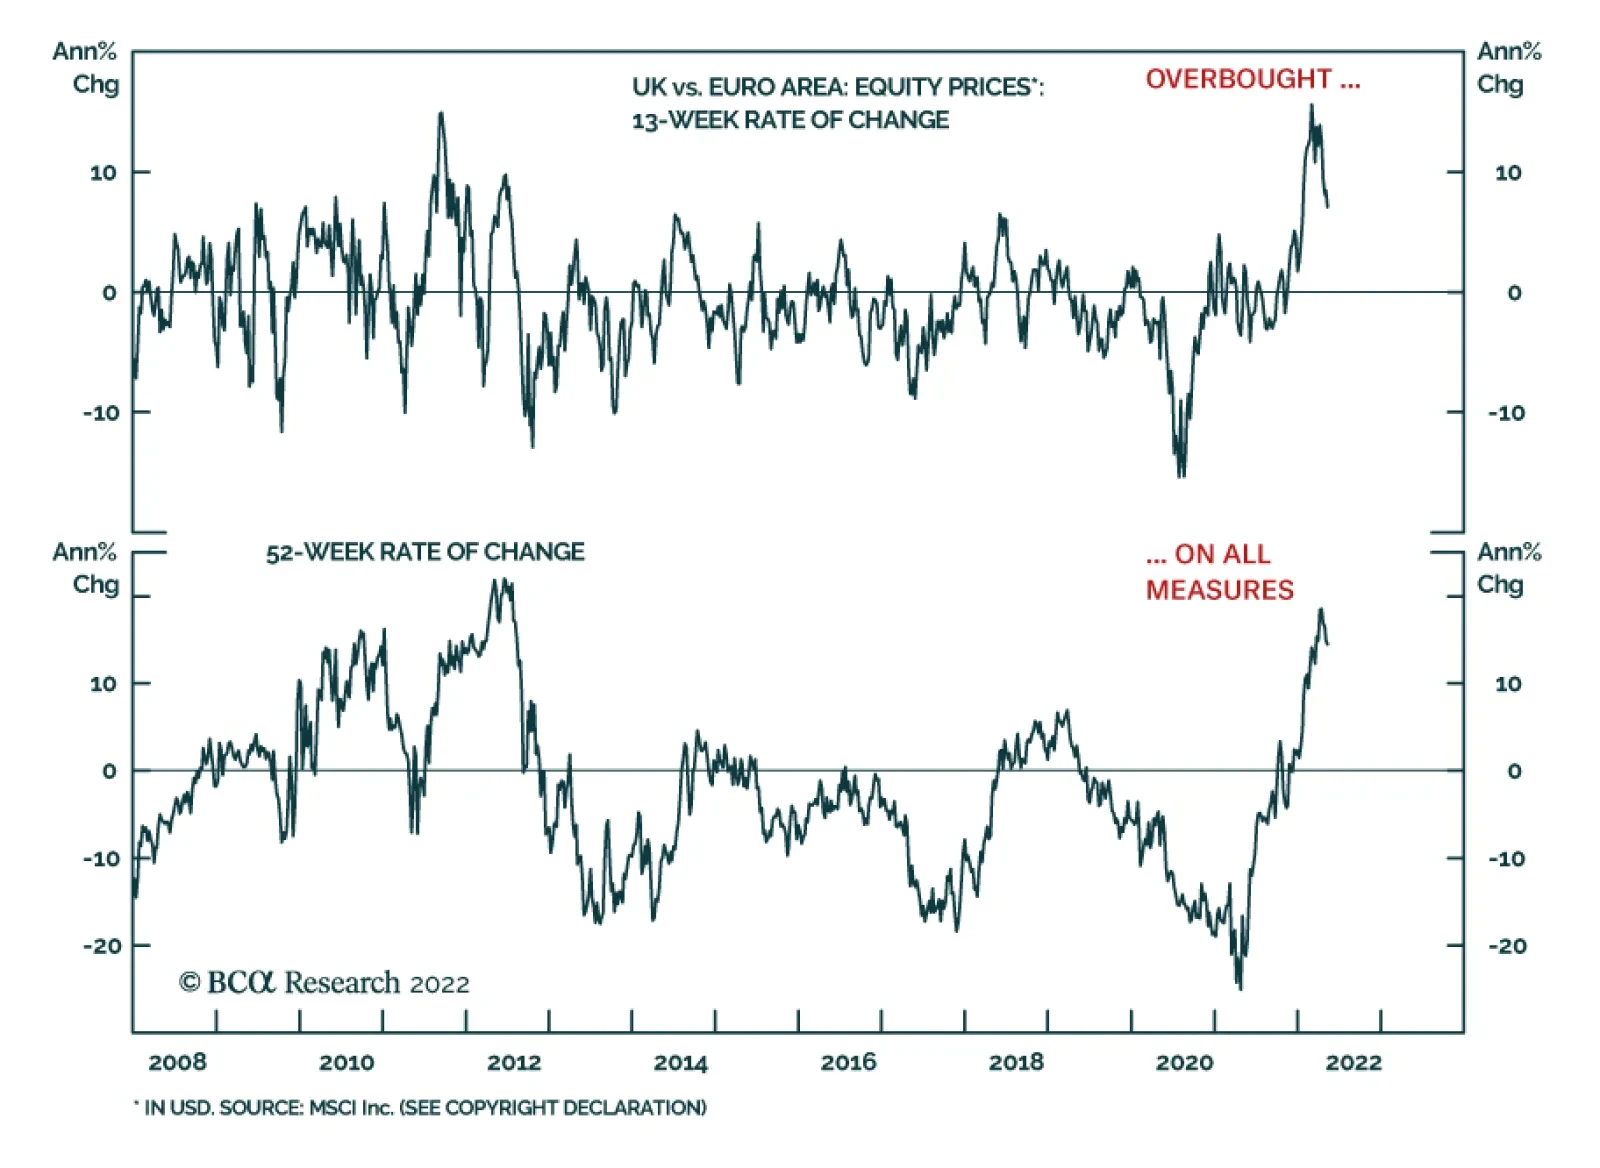
BCA Research’s European Investment Strategy service concludes that a temporary pullback in the performance of UK equities relative to Euro Area stocks is likely in the second half of 2022. UK stocks enjoy a structural tailwind relative to Euro Area shares.…
Executive Summary UK Stocks Are Close To A Bottom
UK Stocks Are Close To A Bottom
UK Stocks Are Close To A Bottom
The UK economic outlook has greatly deteriorated. Weak global growth and punishing energy inflation will cause activity to contract over the next 12 months. Cost-push pressures will drag inflation above 10% in 2022. Moreover, demand-pull inflation highlights problems with the supply-side of the economy. UK yields have downside relative to those in the Euro Area. GBP/USD will bottom once global stock prices find a floor. EUR/GBP possesses more upside. UK stocks will enjoy a structural tailwind relative to their Eurozone counterparts as a result of a secular bull market in commodity prices. Nonetheless, UK equities are likely to underperform in the second half of 2022. UK small-cap stocks are massively oversold compared to large-cap shares; however, a peak in energy inflation must take place for small-cap equities to stage a rebound. TACTICAL INCEPTION DATE RETURN SINCE INCEPTION (%) COMMENT Overweight UK Gilts Within European Fixed-Income Portfolios 05/16/2022 Cyclical Buy European Healthcare Equities / Sell UK Healthcare Equities 05/16/2022 Tactical Buy European Financials Equities / Sell UK Financials Equities 05/16/2022 Tactical Bottom Line: British Gilts will outperform because of the weakness in UK economic activity, but the trade-weighted pound will remain under pressure. The performance of UK large-cap names is mostly independent from the state of the British economy. The commodity secular bull market will create a potent tailwind for this market. However, a better entry point lies ahead. The Bank of England’s (BoE) latest policy meeting was a cold shower for market participants and their aggressive interest rate pricing in the SONIA curve. Money markets expected a peak in the Bank Rate of 2.7% in 2023, but the BoE’s new Market Participants Survey is calling for it to peak at 1.75% before easing off to 1.5% in 2024. The UK economy is in trouble. Inflation is high and broad-based, which explains why investors are pricing in such an aggressive path for the Bank Rate. Yet, economic activity is weakening and could even contract in early 2023. The BoE clearly puts more weight on growth than investors do. What are the implications of the inflation, growth, and policy outlook for British assets? BCA has upgraded its view on UK bonds to overweight within global fixed income portfolios. We expect more softness in the pound versus the euro. UK large-cap stocks will continue to trade in line with energy dynamics, which means it is still too early to buy British small-cap equities. In the meantime, UK financial and healthcare names will underperform their Euro Area counterparts. Growth To Weaken Further The -0.1% month-over-month GDP contraction in March underscores that UK economic activity has already decelerated sharply. However, the deterioration is only starting. Most sectors of the economy show ominous signs for the quarters ahead. Consumer Sector The biggest hurdle facing UK consumers, like most of their European neighbors, is the surge in inflation, particularly energy and food prices. Safety nets are looser than on the continent, and UK households’ real disposable income are contracting sharply. The impact of this weakening of activity is already visible. UK consumer confidence is falling in line with the knock to real disposable income (Chart 1, top panel). Moreover, real retail sales have already slowed sharply, and the BRC Like-For-Like Retail Sales measure is contracting on an annual basis (Chart 1, bottom panel). As a result, the outlook for consumption is worsening. Ofgem, the UK gas and electricity market regulator, lifted its energy price cap by 54% on April 1st and plans to increase it again by an expected 40% in October. Consequently, the BoE anticipates the share of households’ disposable income spent on energy to hit 7.7% by the end of the year — its highest level since the early 1980s (Chart 2). Chart 1Falling Real Incomes Hurt
Falling Real Incomes Hurt
Falling Real Incomes Hurt
Chart 2Intensifying Energy Drag
Intensifying Energy Drag
Intensifying Energy Drag
The savings cushion developed during the pandemic will not be enough to prevent weaker retail sales. More than 40% of households plan to dip into their existing savings and curtail their savings rate; however, UK excess savings skew heavily toward the richer households. Poorer households with low savings are the ones who spend the largest share of their income on energy (Chart 3), and they are also the ones with a higher marginal propensity to consume. Thus, the knock to these households portends further weakness in consumption volumes. Chart 3The Poor Are Hit Harder
Is UK Stagflation Priced In?
Is UK Stagflation Priced In?
Chart 4No Salvation From Housing
No Salvation From Housing
No Salvation From Housing
Housing is unlikely to save the day. While house prices and housing transactions are robust (Chart 4, top panel), mortgage approvals are declining rapidly and average sales per chartered surveyors are also softening (Chart 4, bottom panels), which suggests housing activity will slow. Rising mortgage rates are a problem. Since January, the quoted rates on mortgages with 90% LTV and 75% LTV are up 65bps and 70bps, respectively, which is hurting housing marginal demand. Moreover, 20% of the UK’s mortgage stock carries variable rates, which further hurts aggregate demand. Business Sector The business sector is also feeling the crunch from rapidly rising energy and input costs. It also dreads the deterioration in consumer sentiment and its implication for future final demand. Chart 5Dwindling Capex Outlook
Dwindling Capex Outlook
Dwindling Capex Outlook
Business confidence is falling abruptly. The CBI Inquiry Business Optimism measure has fallen to its lowest level since the beginning of the pandemic in 2020, when the UK GDP was contracting at a 21% annualized rate (Chart 5). Unsurprisingly, the collapse in business confidence prompted a rapid slowdown in CAPEX. The BoE’s Agents Survey reports that 40% of UK firms have unsustainably low profit margins because of rising input prices and partial pass-through. As a result of financial stress, further capex weakness is likely in the coming quarters. The impact on overall activity of these expanding worries is evident. UK industrial production has slowed very sharply and is now a meager 0.7% on an annual basis. The situation will degrade. Export growth remains strong, which is helping the business sector; however, the rapid slowdown in global industrial production indicates that UK exports will follow suit (Chart 5, second panel). This will have a knock-on effect on corporate profits (Chart 5, bottom panel), which will depress capex further. Other Considerations Chart 6No Offset From The Government
No Offset From The Government
No Offset From The Government
The problems of the private sector may be encapsulated in one indicator. After a surge that boosted GDP, the UK’s nonfinancial private sector’s credit impulse is rapidly contracting (Chart 6), which confirms that risks to activity are building. The public sector will not provide an offset. According to the IMF Fiscal Monitor’s projections, the UK’s fiscal thrust will equal -3.3% of GDP in 2022 and -1.4% in 2023, even after the small giveaways from Chancellor Rishi Sunak’s Spring Statement (Chart 6, bottom panel). Together, these developments confirm our view that UK GDP may also flirt with a recession in the coming 12 months. Bottom Line: The UK economy is facing potent headwinds and activity is set to contract over the coming quarters. Surging energy costs are hurting household consumption and businesses are cutting investment. This time around, government spending is unlikely to come to the rescue, at least not until further pain is inflicted on the UK’s private sector. The BoE expects output to contract in early 2023, with which we agree. Inflation: The Worst Of Both Worlds UK headline inflation is likely to move into double digits territory before year-end. Worrisomely, it will also be more stubborn than that of the Eurozone, because it goes beyond higher food and energy input costs. Essentially, the UK suffers from both the cost-push inflation plaguing the rest of Europe and the demand-pull inflation witnessed in the US. Chart 7Continued Pass-Through
Is UK Stagflation Priced In?
Is UK Stagflation Priced In?
The UK’s cost-push inflation will worsen in the second half of the year and could lift headline CPI above 10% by Q4 2022. Its main driver will be the Ofgem’s second energy cap increase scheduled for October, which is expected to increase household energy costs by 40%. Companies will also try to pass through a greater proportion of their rising costs to their consumers to protect their depleted margins. So far, the BoE’s Agents Survey reveals that on average, UK firms have passed through 80% of their non-labor input cost increases (Chart 7, top panel). In all the sectors surveyed, expected price increases are set to accelerate compared to the past 12 month and may even reach 14% in the manufacturing sector and 8% in the consumer goods sector (Chart 7, bottom panel). Demand-pull inflation is also present in the UK, unlike the rest of Europe, with core CPI at 5.7%, high service inflation, and rapidly rising wage growth. The key problem is an overheating labor market exacerbated by labor supply problems. By the end of 2021, the UK recorded 600 thousand inactive people more than before the pandemic, or individuals who are of working age but outside of the labor force and not seeking a job. This has compressed the labor participation rate to 63%, or the lowest level since the 2011-2012 period (Chart 8). So far, not even rapid wage gains have incentivized these persons to seek employment. The impact of Brexit further curtails the supply of labor. Since the pandemic began, the size of the working age population has decreased by 100 thousand as EU citizens have moved back home (Chart 8, second panel). Labor demand, however, is not weak. Job vacancies have surged to an all-time high of 1.3 million, or a ratio of one job vacancy per unemployed worker. Moreover, according to the BoE’s Agents Survey, the proportion of firms reporting recruitment difficulties is extremely elevated (Chart 8, third panel). As a result of weak labor supply but strong labor demand, wages are rising rapidly (Chart 8, bottom panel), with the KPMG/REC Indicator of pay higher than 6%. Chart 8Labor Market Tightness
Labor Market Tightness
Labor Market Tightness
Chart 9Poor Productivity Weighs On Trend GDP
Poor Productivity Weighs On Trend GDP
Poor Productivity Weighs On Trend GDP
Rapidly increasing wages and underlying inflation are indicative of a greater malaise. UK GDP is still 3.6% below its pre-COVID trend, while US GDP has already moved past its previous peak. Yet, wages and underlying inflation are just as strong in both economies. This suggests that the UK trend GDP has slowed more than in the US and that aggregate demand is colliding more rapidly with the constraint created by a weaker potential GDP. Labor supply is not the only culprit behind the slowdown in UK’s trend GDP. Since Brexit, UK capex has been particularly weak, which has depressed productivity growth and suppressed trend GDP further (Chart 9). Bottom Line: The BoE expects UK headline CPI inflation to move above 10% before the end of the year. We agree with this assessment. Cost-push inflation will remain strong in response to additional increases in regulated energy prices this fall and greater pass-through from businesses. Meanwhile, the labor market is overheated because of weak labor supply and surging job vacancies. The UK core inflation is likely to be sticky as Brexit weighs on the country’s trend GDP, which causes aggregate demand to surpass aggregate supply easily. Investment Implications The investment implications of the UK’s weak growth and strong inflation outlook are far reaching. Fixed Income Implications BCA’s Global Fixed Income Strategy service upgraded UK government bonds to overweight from underweight in their global fixed income portfolios. We heed this message and move to overweight UK Gilts relative to German Bunds within European fixed income portfolios. Chart 10The BoE's Dovish Justification
The BoE's Dovish Justification
The BoE's Dovish Justification
The BoE’s forecast calls for a deeply negative output gap as well as a rising rate of unemployment in 2023 and 2024. According to the BoE’s model, these dynamics will weigh on headline CPI next year (Chart 10). We take the BoE at its word when it communicated a gentler pace of rate hikes than was anticipated by the SONIA curve. The BoE believes that the weakness in the UK’s trend GDP growth weighs on the country’s neutral rate of interest. Thus, there is a limited scope before higher interest rates hurt economic activity. Since the BoE already foresees a poor growth outcome and weaker inflation next year, this view of the neutral rate logically results in a shallow path of interest rate increases. In other words, the BoE is not the Fed. This view prompts our fixed income colleagues to expect the SONIA curve to move toward the gentler rhythm of interest rate hikes proposed by the BoE. As a corollary, it implies that Gilt yields have more downside. More specifically, BCA sees room for UK-German yields spreads to narrow. Investors have expected the BoE to be significantly more hawkish than the European Central Bank (ECB), and a partial convergence in expected interest rate paths is likely. Moreover, UK yields have a higher beta than German ones. As a result, the current wave of risk aversion driven by global growth fears should cause an outperformance of UK government bonds compared to German ones. Currency Market Implications The outlook for GBP/USD depends on the evolution of overall market conditions. If risk assets remain under pressure, so will Cable. Chart 11Cable And EM Stocks
Cable And EM Stocks
Cable And EM Stocks
A durable bottom in GBP/USD will coincide with a rebound in EM equities (Chart 11). The correlation between these two assets most likely reflects the UK’s current account deficit of 2.8% of GDP in 2021. Large external financing needs render the currency very sensitive to global liquidity conditions and thus, to the dollar’s trend and global risk aversion, as is the case with EM assets. Peter Berezin, BCA Chief Global Strategist, expects global stocks to rebound in the near future, which will lift EM equities in the process. Interestingly, GBP/USD does not correlate with the relative performance of EM shares. Thus, a rebound in Cable does not contradict BCA’s Emerging Market Strategy service’s view that EM stocks are likely to underperform further in the coming months. Chart 12A Big Handicap For the GBP vs the EUR
A Big Handicap For the GBP vs the EUR
A Big Handicap For the GBP vs the EUR
BCA’s Foreign Exchange strategy team sees further upside in EUR/GBP, toward the 0.9 level. 2-year yield differentials between the UK and Germany are likely to narrow in response to the downgrade of the SONIA curve. Importantly, the wide UK current account deficit necessitates higher real interest rates to prop the pound against the euro because the Eurozone current account surplus stands at 2.3% of GDP. However, neither the 2-year nor 10-year real rates are higher in the UK than they are in the Euro Area (Chart 12). Additionally, even the nominal yield premium of UK bonds vanishes once they are hedged into euros. UK hedged 2-year bonds yield 50bps less than their German counterparts, and 10-year Gilts offer 80bps less than Bunds, which limits continental inflows into the UK. Equity Market Implications UK stocks are pro-cyclical, and their absolute performance will bottom in tandem with global equities. The near-term outlook for global equities remains clouded by the confluence of global growth fears, a weaker CNY, and tighter monetary policy around the world. Meanwhile, UK stocks are very cheap, trading at a forward P/E ratio of 11. They are tactically oversold and are lagging forward earnings (Chart 13). Relative to global equities, the performance of UK stocks will continue to track that of global energy firms compared to the broad market. The heavy exposure of UK large-cap indices to oil and gas stocks has been a major asset since energy shares have become market darlings (Chart 14). Chart 13UK Stocks Are Close To A Bottom
UK Stocks Are Close To A Bottom
UK Stocks Are Close To A Bottom
Chart 14UK Large-Caps Are About Oil
UK Large-Caps Are About Oil
UK Large-Caps Are About Oil
At the time of writing, Sweden and Finland have yet to officialize their membership application to NATO, but BCA’s Geopolitical Strategy team assigns a high probability to this outcome. Russia will not stand idly by, especially as the EU threatens to cut their oil imports. Consequently, a deeper energy embargo is increasingly likely, which should prompt a temporary but violent rally in oil and natural gas prices. This process should sustain a few more weeks of outperformance from UK large-cap shares relative to the rest of the world. Chart 15The UK vs The Eurozone: Cheap But Overbought
The UK vs The Eurozone: Cheap But Overbought
The UK vs The Eurozone: Cheap But Overbought
Structurally, UK equities are likely to remain well supported. A pullback in relative performance later this year is possible once oil prices ease off as BCA’s Commodity and Energy team expects. However, the oil market will stay tight for years to come because of the investment dearth observed since 2014-2015, when OPEC 2.0 started its market-share war. According to Bob Ryan, BCA’s Chief Commodity Strategist, it will take years of high returns in the sector to attract the capital needed to lift energy capex enough to line up supply with demand. Thus, energy remains a structurally favored sector, which will boost the cheap UK market’s appeal. UK stocks enjoy a structural tailwind relative to Euro Area shares. They remain cheap, because they still trade at a significant historical discount (Chart 15). Moreover, relative earnings are moving decisively in favor of UK stocks, something that is unlikely to change, even if the UK economy contracts. Ultimately, UK large-cap names derive the bulk of their profits from overseas and the structural tailwind of a secular commodity bull market will continue to assert itself on relative profits. Nevertheless, UK shares have also become extremely overbought, which raises the risk of a pullback in the second half of the 2022 (Chart 15, third and fourth panel). The recent outperformance of UK stocks relative to those of the Eurozone has been larger than what sectoral biases explain. An equal-sector weights version of the UK MSCI has outperformed a similarly constructed Euro Area index by 9.6% year-to-date. Chart 16Waiting For Catalysts To A Eurozone Rebound
Waiting For Catalysts To A Eurozone Rebound
Waiting For Catalysts To A Eurozone Rebound
A tactical rectification of the overbought conditions in the performance of UK equities relative to those of the Euro Area will require an ebbing of stagflation fears in the Euro Area (Chart 16, top panel). This implies that investors looking to buy Eurozone equities are waiting for a stabilization in the energy market (that is, waiting for clarity about Sweden’s and Finland’s NATO decision as well as Russia’s response). It also means that the Chinese economy must stabilize, since Eurozone equities are more sensitive to the evolution of the Chinese credit impulse than UK ones (Chart 16, second panel). Nonetheless, BCA’s Global Fixed Income Strategy team’s view on UK-German spreads is consistent with an eventual tactical pull back in the relative performance of UK stocks vis-à-vis Euro Area ones (Chart 16, bottom panel). Two pair trades make attractive vehicles to bet on an underperformance of UK stocks relative to those of the Euro Area in the second half of 2022. The first one is to sell UK financials at the expense of Euro Area financials. Historically, a decline in UK Gilt yields relative to their German equivalent strongly correlates with an underperformance of UK financials (Chart 17). The second one is to sell UK healthcare names relative to those in the Eurozone. The relative performance of healthcare shares has greatly outpaced relative earnings and is now hitting a critical resistance level (Chart 18). Moreover, UK healthcare firms are exceptionally overbought relative to their Euro Area competitors. Importantly, those two trades display little correlation to the broad market trend. Chart 17Challenges To UK Financials
Challenges To UK Financials
Challenges To UK Financials
Chart 18UK Healthcare: Running Ahead Of Itself
UK Healthcare: Running Ahead Of Itself
UK Healthcare: Running Ahead Of Itself
Finally, UK small-cap stocks are becoming attractive relative to their large-cap counterparts, although the timing remains risky. Unlike the internationally focused large-cap indices, small-cap shares are a direct bet on the health of the UK domestic economy. Hence, small- and mid-cap names have massively underperformed the FTSE-100 as market participants sniffed out the poor outlook for UK economic activity (Chart 19). They are now extremely oversold relative to large-cap names and their overvaluation has been corrected. The main problem with small-cap shares is the lack of a catalyst to rectify their oversold conditions. The most likely candidate for such a reversal would be a peak in energy inflation, considering it stands at the crux of the headwinds that UK consumption and growth face. However, energy CPI will not peak until later this fall and thus, the pain on UK households will build until then. As a result, wait for a clear sign that energy inflation recedes before entering a long UK small-cap / short UK large-cap contrarian trade (Chart 20). Chart 19Bombed Out Small-Caps...
Bombed Out Small-Caps...
Bombed Out Small-Caps...
Chart 20…Need A Peak In Energy Inflation
...Need A Peak In Energy Inflation
...Need A Peak In Energy Inflation
Bottom Line: In line with our expectations that UK growth will worsen significantly in the quarters ahead, we follow the BCA Global Fixed Income team and move to overweight UK government bonds within European fixed income portfolios. While we expect GBP/USD will bottom once global risk assets find a floor, BCA’s Foreign Exchange Strategy team also anticipates Sterling to depreciate further relative to the euro. Because of their large energy and materials exposure, UK large-cap equities will enjoy a structural outperformance relative to Euro Area large-cap indices on the back of a secular bull market in commodities. However, a temporary pullback in the UK’s relative performance is likely in the second half of 2022. Selling UK financials and UK healthcare stocks relative to their Eurozone counterparts offers a compelling approach to implement this view. Finally, UK small-caps are oversold relative to large-caps, but we recommend investors wait until energy CPI peaks when a relative rebound may emerge. Mathieu Savary, Chief European Strategist Mathieu@bcaresearch.com Tactical Recommendations Cyclical Recommendations Structural Recommendations
Listen to a short summary of this report. Executive Summary The Dollar Likes Volatility
The Dollar Likes Volatility
The Dollar Likes Volatility
Uncertainty about Fed policy has supercharged volatility in bond markets, and correspondingly, USD demand (Feature chart). A well-telegraphed path of interest rates will deflate the volatility “bubble” in Treasury markets and erode the USD safety premium. The dollar has also already priced in a very aggressive path for US interest rates. The onus is on the Fed to deliver on these expectations. Our theme of playing central bank convergence – by fading excessive hawkishness or dovishness by any one central bank – continues to play out. Our latest candidate: short EUR/JPY. The Russia-Ukraine conflict, and ensuing volatility in oil markets, is providing some trading opportunities. One of those is that “good” oil will continue to trade at a premium to “bad” oil. Go long a basket of CAD and NOK versus the RUB. TRADES* INITIATION DATE INCEPTION LEVEL TARGET RATE STOP LOSS PERCENT RETURNS SPOT CARRY** TOTAL Short DXY 2022-05-12 104.8 95 107 Short EUR/JPY 2022-05-12 133.278 120 137 Bottom Line: We recommended shorting the DXY index on April 8th at 102, with a tight stop at 104. That stop-loss was triggered this week. We are reinitiating this trade this week at 104.8, in line with our cyclical view that the dollar faces downside on a 12–18 month horizon. Multiple factors tend to drive the dollar: Real interest rate differentials, growth divergences, portfolio flows into both public and private capital markets, or even safe-haven demand. Across both developed and emerging market currency pairs, the dollar has been strong (Chart 1), but what has been the key driver of these inflows? For most of this year, interest rate differentials have played a key role in pushing the dollar higher. That said, they have not been the complete story. Chart 2 shows that the dollar has very much overshot market expectations of Fed interest rate policy, relative to other central banks. That premium has been around 8%-10% in the DXY index. In real terms, the overshoot has been even higher. Chart 1The Dollar Has Been King
Month In-Review: A Hefty Safe-Haven Premium In The Dollar
Month In-Review: A Hefty Safe-Haven Premium In The Dollar
Chart 2The Fed And The Dollar
The Fed And The Dollar
The Fed And The Dollar
Chart 3The Dollar Likes Volatility
The Dollar Likes Volatility
The Dollar Likes Volatility
A key source of this safe-haven premium has been rising volatility, specifically in the bond market. For most of the last two years, the dollar has tracked the MOVE index, a volatility measure of US Treasurys (Chart 3). Uncertainty about the path of US interest rates, and the corresponding rise in dollar hedging costs, have ushered in a wave of “naked” foreign buyers – owning USTs without a corresponding dollar hedge. Foreign purchases of US Treasurys are surging. Speculators have also expressed bearish bets on the euro, yen, and even sterling via the dollar. There is a case to be made that some of these bullish dollar bets will be unwound in the next few months, even if marginally. For example, the market expects rates to be 248 bps and 313 bps higher in the US by year end, respectively, compared to the euro area and Japan (Chart 4). This might be exaggerated. The real GDP growth and inflation differential between the eurozone and the US is 0.1% and 0.8%, respectively, for 2022. The difference in the neutral rate could be as low as 1.25%. This suggests that a simplified Taylor-rule framework will prescribe a policy rate differential of only 1.7% (1.25 + 0.5(0.8+0.1)). In a global growth slowdown, US inflation will come in much lower, which will allow the Fed to ratchet back interest rate expectations. Should growth accelerate, however, then growth differentials between open economies and the US will widen, narrowing the policy divergence we have been experiencing. The safe-haven premium in the dollar has also been visible in the equity market. One striking feature of the correction has been the inability for US equities to outperform, as they usually do, during a market riot point. The carnage in technology stocks has been absolute, and the tech-heavy US equity market continues to struggle against its global peers. As such, there has been a break in the historically strong relationship between the dollar and the outperformance of the US equity market (Chart 5). Chart 4Pricing In The Euro And Yen In Line With Rates
Pricing In The Euro And Yen In Line With Rates
Pricing In The Euro And Yen In Line With Rates
Chart 5The Dollar Has Overshot The Relative Performance Of US Equities
The Dollar Has Overshot The Relative Performance Of US Equities
The Dollar Has Overshot The Relative Performance Of US Equities
As US equity markets were surging throughout 2021, investors started accumulating dollars as a hedge against equity market capitulation, which explained the tight correlation between the put/call ratio and the USD (Chart 6). As the carry on the dollar has risen, and puts have become more expensive, our suspicion is that the greenback has become a preferred hedge. Chart 6Dollar Hedges Against A Drawdown In The S&P
Dollar Hedges Against A Drawdown In The S&P
Dollar Hedges Against A Drawdown In The S&P
As we have highlighted in past reports, the dollar continues to face a tug of war. Higher interest rates undermine the US equity market leadership, while lower rates will reverse the record high speculative positioning in the dollar. Given recent market action, the path of US bond yields will be critical for the dollar outlook. Cresting inflation could pressure bond yields lower. As a strategy, we recommended shorting the DXY index on April 8th at 102, with a tight stop 104. That stop-loss was triggered this week. We are reinitiating this trade at 104.8, in line with our cyclical view that the dollar faces downside on a 12–18-month horizon. As usual, this week’s Month In Review report goes over our take on the latest G10 data releases and the implications for currency strategy both in the near term and longer term. Chester Ntonifor Foreign Exchange Strategist chestern@bcaresearch.com US Dollar: Inflation Will Be Key Chart 7How Sustainable Is The Breakout?
How Sustainable Is The Breakout
How Sustainable Is The Breakout
The dollar DXY index is up 9% year-to-date, hitting multi-year highs (panel 1). The Fed increased interest rates by 50bps this month. In our view, the Fed will continue to calibrate monetary policy based on data, and the key releases continue to surprise to the upside. Headline CPI came in at 8.3% in April, while the core measure was at 6.2%. Both were higher than expected. Importantly, the month-on-month rate for core was 0.6%, much higher than a run rate of 0.2% that will be consistent with the Fed’s target of inflation (panel 2). It is important to note that used car prices have had an important contribution to US CPI. Airfares had an abnormally large contribution to US CPI for the month of April. As these prices crest, along with other supply-driven costs, inflation could meaningfully roll over in the coming months (panel 3). The job’s report was robust, but there was disappointment in the participation rate that fell from 62.4% to 62.2%. This suggests there might be more labor slack in the US than a 3.6% unemployment rate suggests. Wages continue to inflect higher. The Atlanta Fed Wage Growth Tracker currently sits at 6% (panel 4). These developments continue to underpin market expectations for aggressive interest rate increases. The market now expects the Fed to raise rates to 2.5% by December 2022. Speculators are also very long the dollar. Three factors could unhinge market expectations. First, inflation could come crashing back down to earth which will unwind some of the rate hikes priced in the very near term. That would hurt the dollar. Second, growth could pick up outside the US, especially in economies with lots of pent-up demand like Japan. Third, financial conditions could ease, which will help revive animal spirits. In conclusion, our 3-month view on the dollar remains neutral, but our 12-18-month assessment is to sell the dollar. We are reinitiating our short DXY position today with a stop-loss at 106. Euro: A Recession Is Priced Chart 8Go Short EUR/JPY
Go Short EUR/JPY
Go Short EUR/JPY
The euro has broken below 1.05 and the whisper circulating in markets is that parity is within striking distance. EUR/USD is down 8.7% year-to-date. We have avoided trading the euro against the dollar and have mostly focused on the crosses – long EUR/GBP, and this week, we are selling EUR/JPY. The euro is in a perfect tug of war: Rising inflation is threatening the credibility of the ECB while there is the risk of slowing growth tipping the euro area into a recession. In our view, the euro has already priced in the latter, much more than potentially higher rates in the eurozone. The ZEW sentiment index, a gauge of European growth prospects, is at COVID-19 lows, along with EUR/USD (panel 1). My colleague, Mathieu Savary, constructed a stagflation index for Europe which perfectly encapsulates the ECB’s quandary. A growing cohort of ECB members are supporting a July rate hike. On the surface, the ECB has the lowest rate in the G10 (outside of Switzerland). With HICP inflation at 7.5% (panel 2), emergency monetary settings are no longer required. A “least regrets” approach suggests gently nudging rates higher to address inflationary pressures. House prices in Germany and Italy are rising at their fastest pace in over a decade, much more than wage inflation (panel 3). The key for the ECB will be to telegraph that policy remains extremely accommodative. It is hard to envision that hiking rates from -0.5% to -0.25% will trigger a European recession, but the ECB will need to balance that outcome with the possibility that inflation crests and real rates rise in Europe. In our trading books, we are long EUR/GBP as a play on policy convergence between the ECB and the BoE. This week, we are playing the same theme via shorting EUR/JPY. In a risk-off environment, EUR/JPY should fall. In an economic boom, the cross has already priced in a stronger euro, relative to the yen (panel 4). We are neutral on the euro over a 3-month horizon but are buyers over 12-18 months. Japanese Yen: A Mean-Reversion Play Chart 9A Capitulation In The Yen?
A Capitulation In The Yen?
A Capitulation In The Yen?
The Japanese yen is down 10.5% year-to-date, one of the worst performing G10 currency this year. In retrospect, a chart formation since 1990 suggests that we witnessed a classic liquidation phase that could only be arrested by an exhaustion in selling pressure, or a shift in fundamentals (panel 1). The two key drivers of yen weakness are the rise in US yields (panel 2) and the higher cost of energy imports. As today’s price move suggests, any reversal in these key variables will lead to a selloff in USD/JPY – falling bond yields and/or lower energy prices. We have been timidly long the yen, via a short CHF position. Today we are introducing a short EUR/JPY trade as well. What has been remarkable in the last month is the improvement in Japanese economic fundamentals, as the country slowly emergences from the latest COVID-19 wave: Both the outlook and current situation components of the Eco Watchers Survey improved in April. This is a survey of small and medium-sized businesses, very sensitive to domestic conditions. PMIs in Japan are improving on both the manufacturing and service fronts. The Tokyo CPI surprised to the upside, with the headline figure at 2.5%. Historically, the earlier release of the Tokyo CPI has been a reliable gauge for nationwide inflation. Importantly, the release was much below BoJ forecasts. Inflation in Japan could surprise to the upside (panel 3). Employment numbers remain robust. The unemployment rate fell to 2.6% in March, and the jobs-to-applicants ratio rose to 1.22. The Bank of Japan has stayed dovish, reinforcing yield curve control in its April 27 meeting, with strong forward guidance. That said, the BoJ will have no choice but to pivot if inflationary pressures prove stronger than they anticipate, and/or the output gap in Japan closes much faster as demand recovers. Related Report Foreign Exchange StrategyWhat To Do About The Yen? We were stopped out of our short USD/JPY position at 128. In retrospect, USD/JPY rallied above 131 and is finally falling back down to earth. We are already in the money on our short CHF/JPY position, from our last in-depth report on the yen. This week, we recommend shorting EUR/JPY. British Pound: A Volte-Face By The BoE Chart 10The Pound Is Being Traded As High Beta
The Pound Is Being Traded As High Beta
The Pound Is Being Traded As High Beta
The pound is down 9.8% year-to-date. While the Bank of England raised rates to 1% this month, they also expect the economy to temporarily dip into recession this year. This week’s disappointing GDP release confirmed the BoE’s fears. In short, pricing in the SONIA curve for BoE rate hikes remains aggressive. The Bank of England has been one of the more proactive central banks, yet the currency has been performing akin to an inflation crisis in emerging markets (panel 1). Inflation continues to soar in the UK with headline CPI now at 6.2% (panel 2). According to the BoE’s projections, inflation will rise to around 10% this year before peaking, well above previous forecasts of 8%. Together with tighter fiscal policy, the combination will be a hit to consumer sentiment. While the BOE must contain inflationary pressures (in accordance with their mandate), the risks of a policy mistake have risen, akin to the eurozone. Labor market conditions appear tight on the surface (panel 3), but our prognosis is that the UK needs less labor regulation, especially towards areas in the economy where labor shortages are acute and are pressuring wages higher. That is unlikely to change in the near term. As such, the current stance of tight monetary and fiscal policy will stomp out any budding economic green shoots. We are currently short sterling, via a long EUR position. In our view, the EUR/GBP cross still heavily underprices the risks to the UK economy in the near term. Given that the pound is very sensitive to global financial conditions (panel 1), it could rebound if recession fears ease, but our suspicion is that it will still underperform the euro. Canadian Dollar: The BoC Will Stay Hawkish Chart 11The CAD Will Stay Resilient
The CAD Will Stay Resilient
The CAD Will Stay Resilient
The CAD is down 3% year-to-date. The key driver of the CAD remains the outlook for monetary policy and the path of energy prices (panel 1). In the near term, oil prices will stay volatile, but the CAD has not priced in the fact that the BoC is matching the Fed during this interest rate cycle, and/or the rise in energy prices. Together with the NOK, we are going long the CAD versus the RUB today. As we expected, the Bank of Canada raised interest rates by 50bps to 1% at the April 13 meeting. Since then, all the measures the BoC looks at to calibrate monetary policy are continuing to suggest more tightening in monetary policy. Both headline and core inflation came in strong, with headline inflation at 6.7% in March. The common, trim, and median inflation prints were at 2.8%, 4.7%, and 3.8%, respectively, well above the BoC’s target. This continues to suggest inflationary pressures in Canada are broad- based (panel 2). The employment report in April disappointed market consensus, but employment in Canada is back above pre-pandemic levels, and the unemployment rate fell to 5.2%, close to estimates of NAIRU. This suggests the BoC’s path for monetary policy will not be altered (panel 3). House price inflation seems to be moderating across many cities, which argues that monetary policy is having the intended effect, but price increases remain well above nominal income growth (panel 4). Speculators are slightly long the CAD, a risky stance over the next three months. That said, we are buyers of CAD over a 12-to-18-month horizon. New Zealand Dollar: Positive Catalysts, But Fairly Valued Chart 12Real NZ Rates Need To Stabilize
Real NZ Rates Need To Stabilize
Real NZ Rates Need To Stabilize
The NZD is down 8.7% year-to-date. The RBNZ remains the most hawkish central bank in the G10. They further raised interest rates to 1.5% on April 13. Given a strict mandate on inflation, together with house price considerations, long bond yields have accepted that the RBNZ will be steadfast in tightening policy and hit 3.8% this month. This will help stabilize real yields are rising (panel 1). Underlying data suggests that the “least regrets” approach by the RBNZ makes sense – in a nutshell, tighten policy as fast as economically possible, to get ahead of the inflation curve. CPI continues to accelerate, hitting 6.9% year-on-year in Q1, from 5.9% the previous quarter (panel 2). House price inflation is rolling over from very elevated levels (panel 3). This suggests that monetary policy is having the intended effect of dampening demand. A weak NZD could sustain imported inflation, but a hawkish central bank cushions this risk. The RBNZ is forecasting a 2.8% overnight rate for June 2023. The OIS curve suggests that market expectations are much higher. This fits with our view that the market had been overpricing higher interest rates in New Zealand, especially relative to other countries. We already took profits on our long AUD/NZD trade and continue to expect the NZD to underperform at the crosses, even if it rises versus the dollar. Australian Dollar: Our Top Pick Against The Dollar Chart 13The AUD Has A Terms Of Trade Tailwind
The AUD Has A Terms Of Trade Tailwind
The AUD Has A Terms Of Trade Tailwind
The Australian dollar is down 5.5% year-to-date. The Reserve Bank of Australia raised interest rates by 15bps on its May 3rd meeting, in line with the hawkish tone telegraphed at the prior meeting. The two critical measures that the RBA is focusing on, inflation and wages, have been improving. That said, we had expected the RBA to wait for fresh wage data, out next week, before calibrating monetary policy. The key point is that emergency monetary settings are no longer required in Australia. Home prices remain robust, the unemployment rate has fallen to a cycle low of 4% in and inflationary pressures remain persistent. Headline CPI was at 5.1% year-on-year in Q1. The trimmed-mean and weighted- median CPI print came in at 3.7% and 3.2%, respectively, above the upper bound of the RBA’s 2%-3% target range. The external environment is one area of concern for the AUD. The trade balance continues to soar, but China’s zero COVID-19 policy is a risk to Australian exports. On the flip side, many speculators are now short the Aussie, which is bullish from a contrarian perspective. We are long the AUD as of 72 cents, expecting this trade to be volatile in the near term, but to pay off over a longer horizon. Swiss Franc: The Yen Is A Better Hedge Chart 14Swiss Inflation Will Fall
Swiss Inflation Will Fall
Swiss Inflation Will Fall
Year-to-date, CHF is down 9% against USD and flat against the EUR. The Swiss economy continues to perform well and remains relatively insulated from the inflation dynamics taking place in the rest of the G10. In April, headline CPI inched higher to 2.5% and core CPI to 1.5% year-over-year (panel 2), while the unemployment rate was down to 2.3%. The KOF indicator was also above expectations at 101.7. At 62.5, the manufacturing PMI is still well in the expansionary zone. In other data, retail sales were up 0.8% month-on-month in March and the trade surplus was down to CHF 1.8bn, likely due to the elevated exchange rate versus the euro. Since then, the franc has given up all its gains against the euro. Several SNB board members have recently spoken about the beneficial role of a strong franc in helping to control inflation (panel 4). That said, it is unclear whether the SNB, known for rampant currency interventions, will be as welcoming to a highly valued franc should inflation roll over. Switzerland’s trade surplus as a share of GDP has been persistently increasing since the early 2000s. An expensive currency would not be positive for economic growth. In fact, SNB sight deposits, have been on the rise recently. Last week, these deposits posted the largest one-week increase in two years. In a world where inflation starts to roll over, the SNB will be more dovish. In this environment, EUR/CHF can see more upside. Norwegian Krone: Bullish On A 12-to-18 Month Horizon Chart 15NOK Has Upside
Month In-Review: A Hefty Safe-Haven Premium In The Dollar
Month In-Review: A Hefty Safe-Haven Premium In The Dollar
The NOK is down 10.7% against the USD this year. This is a remarkable development amidst higher real rates in Norway (panel 1). The Norges Bank is one of the most predictable central banks. It is set to deliver quarterly 25bps hikes through the end of 2023 to a total of 2.5%. In April, headline CPI rose 5.4% and the measure excluding energy was up 2.6% (panel 2). Although slightly above the latest projections, these figures are unlikely to make the bank deviate from its projected rate path. Economic activity is recovering steadily since the removal of pandemic-related restrictions in February. Household consumption and retail sales grew 4.3% and 3.3% month-over-month, respectively, in March. The manufacturing PMI broke above the 60 level in April, while industrial production was up 2.2% on the month in March. Registered unemployment fell under 2% in April, below pre-pandemic levels. This is helping boost wages (panel 3). Norway’s trade balance continued to break all-time highs with a NOK 138bn surplus in March. Elevated energy prices and the transition away from Russian energy should be a significant tailwind for the Norwegian economy. Oil companies planned to increase investment even before the invasion, and recent developments will likely induce more capex. NOK has significantly underperformed in the last month largely due to broad risk-off sentiment. Once markets stabilize, the krone should strengthen over the next 12–18 months. Given the relatively “safer” nature of Norwegian oil, we are initiating a long NOK/RUB trade today, along with a long CAD leg. Swedish Krona: Into A Capitulation Phase Chart 16SEK Has Upside
SEK Has Upside
SEK Has Upside
The SEK is down 10.8% versus the dollar this year. In a major policy U-turn, the Riksbank raised rates by 25bps during its last meeting, after inflation came in above expectations at 6.1% on the year in March. The Bank also announced a faster pace of balance-sheet reduction, as well as expecting two-to-three more hikes before the end of the year. Just like the euro area, Sweden is within firing range of tensions between Russia and Ukraine (panel 1). Swedish GDP contracted 0.4% from the previous quarter. Global uncertainty and rising prices are weighing on consumer confidence, reflected in subdued retail sales and household consumption in March. The manufacturing PMI remains robust at 55 but is falling quite rapidly, as are real rates (panel 2). As a small open economy, Sweden needs external demand to recover. On a positive note, orders remain very strong and an easing of lockdowns in China should contribute to growth in manufacturing and goods exports later this year. It is also encouraging that Sweden’s trade surplus rose to 4.7bn SEK in March. The krona remains vulnerable to both a growth contraction in Europe as well as geopolitical risk, especially as Finland might join NATO, sparring retaliation from Russia. That said, the negative news is likely already priced in. SEK should benefit from growth normalization and a pick-up in the Chinese credit impulse in the second half of the year. As a way to benefit from this dynamic, we are short CHF/SEK, but short USD/SEK positions will be warranted later this year. Chester Ntonifor Foreign Exchange Strategist chestern@bcaresearch.com Artem Sakhbiev Research Associate artem.sakhbiev@bcaresearch.com Footnotes Strategic View Cyclical Holdings (6-18 months) Tactical Holdings (0-6 months) Limit Orders Forecast Summary