Europe

Executive Summary The Fed, Bank of England (BoE) and Reserve Bank of Australia all hiked rates last week. The BoE, however, signaled a note of caution on future UK growth, given soaring energy prices and plunging consumer and business confidence. Interest rate markets are pricing in a peak in UK policy rates over the next year near 2.5%, above realistic estimates of neutral that are more in the 1.5-2% range. UK productivity and potential growth remain too weak to support a higher neutral rate than that. With the BoE forecasting near recessionary conditions over the next couple of years if those market-implied rate hikes come to fruition, the time is right to increase exposure to UK government bonds in global fixed income portfolios. UK Rate Expectations Are Too High
UK Rate Expectations Are Too High
UK Rate Expectations Are Too High
Bottom Line: Markets are overestimating how much additional tightening the Bank of England can deliver. We are upgrading our recommended strategic stance on UK Gilts from underweight (2 out of 5) to overweight (4 out of 5). Not All Central Bankers Can Credibly Restore Credibility Chart 1Developed Market Bond Yields Back To 2018 Highs
Developed Market Bond Yields Back To 2018 Highs
Developed Market Bond Yields Back To 2018 Highs
Three more central bank meetings, three more rate hikes. Last week brought a 50bp hike from the Fed, a 25bp hike – the first of this tightening cycle – by the Reserve Bank of Australia (RBA) and a 25bp rate increase from the Bank of England (BoE). The Fed and RBA moves did little to stabilize the government bond bear markets in the US and Australia, but the BoE was able to provide a temporary reprieve for the Gilt selloff by playing up potential UK recession (stagflation?) risks. Bond yields worldwide remains laser focused on high global inflation and the associated monetary policy response that will be needed to stabilize inflation expectations (Chart 1). That includes both interest rate hikes and reducing the size of bloated central bank balance sheets. The threat of such “double tightening” is weighing on global growth expectations and risk asset valuations. The MSCI World equity index is down -6.4% (in USD terms) so far in the Q2/2022 and down -14.5% since the mid-November/2021 peak. Although in a more mitigated way, credit markets are also being impacted, with the Bloomberg Global High-Yield index down -2.6% so far in Q2 on an excess return basis versus government bonds. Rate hike expectations have started to catch up to elevated inflation expectations, at least according to inflation linked bonds. The yield on 10-year US TIPS now sits at +0.29%, a huge swing from the -1% level seen just one month ago (Chart 2). The 10-year real yield is even higher in Canada (+0.81%) where the Bank of Canada just delivered its own 50bp rate hike in April. On the other hand, 10-year real yields remain deeply below 0% in Europe and the UK, where central bankers have been providing less explicit guidance on future rate hikes and asset purchase reductions compared to the Fed or Bank of Canada. Interest rate markets remain reluctant to price in significantly positive real policy interest rates at the peak of the current tightening cycle. Our proxy for the real terminal rate expectation, the 5-year/5-year overnight index swap rate (OIS) minus the 5-year/5-year CPI swap rate, is only +0.18% in the US. It is still deeply negative in Europe (-1.53%) and the UK (-0.97%). Our estimates of the term premium component of 10-year government bond yields in those three markets is rising alongside interest rate expectations yet remains deeply negative in Europe and the UK (Chart 3). Chart 2Real Rate Divergences In The Face Of A Global Inflation Shock
Real Rate Divergences In The Face Of A Global Inflation Shock
Real Rate Divergences In The Face Of A Global Inflation Shock
Chart 3Markets Still Pricing In Structurally Low Rates
Markets Still Pricing In Structurally Low Rates
Markets Still Pricing In Structurally Low Rates
Of those three major bond markets, we see the UK term premium as being the least likely to see additional upward repricing, with the BoE less likely than the Fed or ECB to push for an aggressively smaller balance sheet given domestic economic risks. UK Rate Expectations Are Too Hawkish Chart 4Our BoE Monitor Justifies Recent Tightening Moves
Our BoE Monitor Justifies Recent Tightening Moves
Our BoE Monitor Justifies Recent Tightening Moves
The Bank of England raised rates by 25bps last week, pushing Bank Rate to a 13-year high of 1.0%. The decision was a 6-3 majority, with three Monetary Policy Committee (MPC) members calling for a 50bp hike – matching recent moves by other G-10 central banks like the Fed and Bank of Canada – given tight UK capacity constraints (i.e. low unemployment) and high realized inflation. The MPC noted that additional rate increases would likely be necessary to tame very high UK inflation, a message confirmed by the elevated level of our UK Central Bank Monitor (Chart 4). However, the new economic forecasts presented by the BoE painted a gloomy picture on UK growth, raising the risks of a recession even as UK inflation is expected to continue climbing to a 10% peak in late 2022 on the back of high energy prices.1 Strictly looking at current inflation, the case for the BoE to continue hiking rates is obvious. Yet the BoE may now be placing more weight on the downside risks to growth from the energy shock, at a time when fiscal tightening is no longer providing stimulus. In the press conference following last week’s MPC meeting, BoE Governor Andrew Bailey noted the difficult situation policymakers are facing given the huge surge in energy prices that is fueling inflation while also weighing on household and business real incomes. So what is “neutral” anyway? Related Report Global Fixed Income StrategyThe UK Leads The Way The BoE is one of the least transparent major central banks when it comes to providing guidance on what it thinks the neutral policy rate is. Market participants are left to arrive at their own conclusions and those can vary substantially, as is currently the case. The UK OIS curve is discounting a peak in rates of 2.72% in 2023 and discounting rate cuts after that starting in 2024. Yet the respondents to the BoE’s new Market Participants Survey are calling for a much lower trajectory with rates peaking at 1.75% before falling to 1.5% in 2024 (Chart 5). Those rate levels are in the lower half of the range of longer-run neutral rate estimates from the same Market Participants Survey, between 1.5% and 2.0% (the shaded box in the chart). Chart 5UK Rate Expectations Are Too High
UK Rate Expectations Are Too High
UK Rate Expectations Are Too High
Chart 6Recessionary BoE Forecasts, Except For GDP
Recessionary BoE Forecasts, Except For GDP
Recessionary BoE Forecasts, Except For GDP
Combining the messages from the OIS curve and the Survey, markets are pricing in a path for the BoE Bank Rate that will become restrictive by mid-2023, with another 172bps of rate hikes. The BoE uses market pricing for future interest rates in its economic forecasts. The Bank’s models suggest that a move to raise rates to 2.5% in response to high UK inflation, as markets are discounting, would result in a severe UK downturn that would both push up unemployment from the current 3.7% to 5.4% by Q2/2025 (Chart 6). Headline inflation would plunge to 1.3% over the same period as the UK output gap widens to -2.25% of GDP from the current “excess demand” level of +0.5%. Oddly enough, the BoE is only forecasting a flat profile for real GDP growth over that entire three-year forecasting period, although there will clearly be some negative GDP prints during that period to generate such a massively disinflationary outcome. A mixed picture on UK growth Currently, the UK economy is flashing some warning signs on growth momentum. The UK manufacturing PMI was 55.8 in April, still well above the 50 level indicating growth but 9.8 pts below the cyclical peak in 2021 (Chart 7). The services PMI is in better shape at 58.9, but it did dip lower in the latest reading. The GfK consumer confidence index has fallen sharply in response to contacting real household income growth, reaching the second-lowest reading in the history of the series dating back to 1974 in April. This is a warning sign for consumer spending – retail sales fell in April for the first time in fifteen months (middle panel). Business confidence is also impacted by the high costs of both energy and labor that is squeezing profit margins. UK real investment spending is nearly contracting on a year-over-year basis, despite the robust readings on investment intentions from the BoEs’ Agents Survey of UK businesses (bottom panel).UK firms are facing higher wage costs at a time of very tight labor market and robust labor demand. The BoE estimates that UK private sector wage growth, after adjusting for compositional effects related to the pandemic, will accelerate to 5.1% by the end of Q2/2022 (Chart 8). Chart 7UK Growth Facing Inflationary Headwinds
UK Growth Facing Inflationary Headwinds
UK Growth Facing Inflationary Headwinds
Chart 8UK Labor Market Remains Healthy
UK Labor Market Remains Healthy
UK Labor Market Remains Healthy
Chart 9Will House Prices Signal The Peak In UK Inflation?
Will House Prices Signal The Peak In UK Inflation?
Will House Prices Signal The Peak In UK Inflation?
A robust labor market and quickening wage growth is forcing the BoE to maintain a relatively hawkish bias at a time of high energy inflation, even with the growth outlook darkening in the central bank’s own forecasts. Booming house prices are also making the central bank’s job more challenging. The annual growth rate of the Nationwide UK house price index reached 12.4%, a 17-year high, in March. However, rising mortgage rates and declining household real incomes will likely begin to eat into housing demand and, eventually, help slow the rapid pace of house price growth (Chart 9, bottom panel). Summing it all up, the overall UK inflation picture, including wages and housing costs in addition to energy prices and durable goods prices, will force the BoE to deliver a few more rate hikes before year-end before reaching a peak level that is lower than current market pricing. The neutral UK interest rate is likely very low Chart 10Structurally Weak UK Growth = A Low Neutral Rate
Structurally Weak UK Growth = A Low Neutral Rate
Structurally Weak UK Growth = A Low Neutral Rate
The UK economy has suffered from structurally low potential economic growth dating back to the Brexit referendum in 2016. UK businesses stopped investing in the face of the uncertainty over the UK’s relationship with Europe. There has basically been no growth in UK fixed investment over the past five years. In response, UK productivity has only grown an annualized 0.9% over that same period (Chart 10) and the OECD’s estimate of UK potential GDP growth has been cut from 2% to 1.1%. With such low potential growth, the neutral BoE policy interest rate is likely even lower than the 1.5-2% range of estimates from the BoE’s Market Participant Survey. Tighter fiscal policy also lowers the neutral UK interest rate, with the UK Office of Budget Responsibility forecasting a narrowing of the UK budget deficit of -13.6 percentage points between the 2021 peak and 2027 (bottom panel). A flat UK Gilt curve is also a sign that the neutral interest rate is quite low. The 2-year/10-year Gilt curve now sits at a mere -49bps with Bank Rate only at 1% (Chart 11). While this is modestly steeper from the near-inversion of the curve seen at the start of 2022, a very flat curve at a nominal policy rate of only 1% suggests that the neutral rate is not far from the current level. Sluggish UK equity market performance and widening UK corporate credit spreads also argue that Bank Rate may already be turning restrictive, although a lower trade-weighted pound is helping to mitigate the overall tightening of UK financial conditions. Chart 11UK Financial Conditions Are Not Restrictive (Yet)
UK Financial Conditions Are Not Restrictive (Yet)
UK Financial Conditions Are Not Restrictive (Yet)
Chart 12Pressure On The BoE Will Not Peak Until Inflation Does
Pressure On The BoE Will Not Peak Until Inflation Does
Pressure On The BoE Will Not Peak Until Inflation Does
In the end, the pressure on the BoE to tighten will not ease until UK inflation peaks. The BoE is suffering a severe credibility crisis, with its own public opinion survey showing the deepest level of public dissatisfaction with the bank since the Global Financial Crisis (Chart 12). Inflation expectations are at similar levels that prevailed during that period, although the unique nature of the current inflation upturn, fueled by global supply-chain squeezes and war-related boosts to commodity prices, will likely prevent a repeat of the relatively fast reversal of inflation expectations seen after the Global Financial Crisis. Investment Implications – Get Ready For Gilt Outperformance Chart 13Upgrade UK Gilts To Overweight
Upgrade UK Gilts To Overweight
Upgrade UK Gilts To Overweight
With the BoE already pushing Bank Rate towards a plausible neutral range, we do not expect many more rate hikes in the UK. Our base case is that the BoE hikes 2-3 more times by year-end, pushing Bank Rate to 1.5-1.75%, before pausing. This would represent a lower peak in policy rates than currently priced in the UK OIS curve. That is a relatively dovish outcome that typically leads to positive performance for a government bond market according to our “Global Golden Rule” framework, which we will revisit in next week’s Strategy Report. For now, however, we see a strong case to turn more positive on UK Gilts, with the BoE likely to deliver fewer rate hikes than discounted (Chart 13). The BoE is also far less likely to begin reducing its balance sheet by selling its Gilt holdings back to the market. BoE Governor Bailey strongly hinted last week that such aggressive quantitative tightening (QT) was not a given, even after the Bank research staff presents its proposals to the MPC in August. A delay in QT would also be a factor boosting UK Gilt performance versus other developed economy bond markets where more aggressive reductions in central bank balance sheets are more likely, like the US and potentially even the euro area. This week, we are upgrading our recommended strategic UK weighting from underweight to overweight. In next week’s report, we will consider the proper allocation for the UK within our model bond portfolio, after reviewing potential bond return forecasts stemming from our Global Golden Rule. Bottom Line: Markets are overestimating how much additional tightening the Bank of England can deliver. We are upgrading our recommended strategic stance on UK Gilts from underweight (2 out of 5) to overweight (4 out of 5). Robert Robis, CFA Chief Fixed Income Strategist rrobis@bcaresearch.com Footnotes 1 The mechanical way that the UK government’s energy price regulator, Ofgem, sets price caps on retail gas and electricity costs - based on changes in wholesale energy costs implied by futures curves – means that UK household energy prices will rise by 40% in October, according to BoE estimates. GFIS Model Bond Portfolio Recommended Positioning Active Duration Contribution: GFIS Recommended Portfolio Vs. Custom Performance Benchmark
It’s Time To Flip The Script - Upgrade UK Gilts
It’s Time To Flip The Script - Upgrade UK Gilts
The GFIS Recommended Portfolio Vs. The Custom Benchmark Index
It’s Time To Flip The Script - Upgrade UK Gilts
It’s Time To Flip The Script - Upgrade UK Gilts
Tactical Overlay Trades
Listen to a short summary of this report. Executive Summary Global Equities Are More Attractively Valued After The Recent Sell-Off
Global Equities Are More Attractively Valued After The Recent Sell-Off
Global Equities Are More Attractively Valued After The Recent Sell-Off
We tactically downgraded global equities in late February but see the current level of stock prices as offering enough upside to warrant an overweight. Global equities are now trading at 15.6-times forward earnings, and only 12.6-times outside the US. More importantly, the forces that pushed down stock prices are starting to abate: The war in Ukraine no longer seems likely to devolve into a broader conflict; the number of new Covid cases in China has fallen by half; and global inflation has peaked. The next 18 months of falling inflation and receding recession fears could see stocks recover much of their losses. The “Last Hurrah” for equities is coming. We continue to think that over a 5-year horizon, bond yields will rise from current levels, value stocks will outperform growth stocks, and crypto prices will fall. However, countertrend rallies are likely. To express this view, we recommend taking partial profits on our short 10-year Treasury trade recommendation (up 9.3% from an initial entry yield of 1.45% on June 30, 2021). We are also halving our long global value/growth position (up 20.1% since inception on December 10, 2020) and our short Bitcoin position (up 98% based on our exponential shorting technique). Bottom Line: Global equities are heading towards a “last Hurrah” starting in the second half of this year. Tactically upgrade stocks to overweight. Feature Dear Client, We published a Special Alert early this afternoon tactically upgrading global equities to overweight. As promised, the enclosed report elaborates on our view change. Best regards, Peter Berezin Restore Tactical Overweight On Global Equities Chart 1Global Equities Are More Attractively Valued After The Recent Sell-Off
Global Equities Are More Attractively Valued After The Recent Sell-Off
Global Equities Are More Attractively Valued After The Recent Sell-Off
We tactically downgraded global equities from overweight to neutral on February 28th. The war in Ukraine, the Covid outbreak in China, and most importantly, the rise in bond yields have kept us on the sidelines ever since. At this point, however, the outlook for stocks has brightened, and thus we are restoring our tactical (3-month) overweight to stocks so that it is consistent with our bullish 12-month cyclical view. First, valuations have discounted much of the bad news. After the recent sell-off, global equities are trading at 15.6-times forward earnings (Chart 1). Outside the US, they trade at only 12.6-times forward earnings. Second, the forces that pushed down stock prices are starting to abate. The war in Ukraine is approaching a stalemate, with Russian troops unable to take much of the country, let alone seriously threaten regional neighbours. A European embargo on Russian oil is likely but will be watered down significantly before it is implemented. European officials have shied away from banning Russian natural gas, an action that would have much more severe economic implications. While still very high in absolute terms, December-2022 European natural gas futures are down 36% from their peak on March 7 (Chart 2). The 7-day average of new Covid cases in China has fallen by more than half since late April (Chart 3). Considering that a significant fraction of China’s elderly population is unvaccinated, the authorities will continue to play whack-a-mole with the virus for the next few months (Chart 4). Fortunately, Chinese domestic production of Pfizer’s Paxlovid anti-Covid drug is starting to ramp up, which should allow for some easing in lockdown measures later this year. Chart 2European Natural Gas Futures Have Come Off The Boil
European Natural Gas Futures Have Come Off The Boil
European Natural Gas Futures Have Come Off The Boil
Chart 3Covid Cases Are Falling In China…
It’s Time To Buy: Tactically Upgrading Global Equities To Overweight
It’s Time To Buy: Tactically Upgrading Global Equities To Overweight
The 20th Chinese National Party Congress is slated for this fall. In the lead-up to the Congress, it is likely that the government will move to diffuse social tensions over its handling of the pandemic by showering the economy with stimulus funds. Of note, the credit impulse has already turned higher, which bodes well for both Chinese growth and growth abroad (Chart 5). Chart 4… But Low Vaccination Rates Among The Elderly Remain A Risk
It’s Time To Buy: Tactically Upgrading Global Equities To Overweight
It’s Time To Buy: Tactically Upgrading Global Equities To Overweight
Chart 5A Rebound In China's Credit Impulse Bodes Well For China And The Rest Of The World
A Rebound In China's Credit Impulse Bodes Well For China And The Rest Of The World
A Rebound In China's Credit Impulse Bodes Well For China And The Rest Of The World
Inflation Is Peaking On the inflation front, the data flow has gone from unambiguously bad to neutral (and perhaps even slightly positive). In the US, core goods inflation fell by 0.4% month-over-month in April, the first outright decline in core goods prices since February 2021. The Manheim Used Vehicle Value Index has crested and is now 6.4% below its January peak (Chart 6). Global shipping rates have moved up a bit recently on the back of Chinese port shutdowns but remain well below their highs earlier this year (Chart 7). Chart 6Used Car Prices Appear To Have Peaked
Used Car Prices Appear To Have Peaked
Used Car Prices Appear To Have Peaked
Chart 7Global Shipping Rates Are Well Off Their Highs
Global Shipping Rates Are Well Off Their Highs
Global Shipping Rates Are Well Off Their Highs
It Is The Composition Of Spending That Is Distorted Despite the often-heard claim that US consumer spending is well above trend, the reality is that spending is more or less in line with its pre-pandemic trend (Chart 8). It is the composition of spending that is out of line: Goods spending is well above trend while services spending is well below. One might think that only the overall level of spending should matter for inflation, and that the composition of spending is irrelevant. However, this ignores the reality that services prices are generally stickier than goods prices. Companies that sold fitness equipment during the pandemic had no qualms about raising prices. In contrast, gyms barely cut prices, figuring that lower membership fees would do little to drive new business through the door (Chart 9). Chart 8Total US Consumer Spending Is Almost Exactly At Its Pre-Pandemic Trend, But The Composition Of Spending Remains Skewed
Total US Consumer Spending Is Almost Exactly At Its Pre-Pandemic Trend, But The Composition Of Spending Remains Skewed
Total US Consumer Spending Is Almost Exactly At Its Pre-Pandemic Trend, But The Composition Of Spending Remains Skewed
Chart 9Asymmetries Matter: Firms Manufacturing Sports Equipment Jacked Up Prices, But Gyms Barely Cut Prices
Asymmetries Matter: Firms Manufacturing Sports Equipment Jacked Up Prices, But Gyms Barely Cut Prices
Asymmetries Matter: Firms Manufacturing Sports Equipment Jacked Up Prices, But Gyms Barely Cut Prices
This asymmetry matters, and it suggests that goods inflation should continue to fall over the coming months as the composition of spending shifts back to services. A Lull In Wage Growth Wages are the most important determinant of services inflation. While it is too early to be certain, the latest data suggest that wage growth has peaked. The 3-month annualized growth rate in average hourly earnings for production and nonsupervisory workers slowed from 7.2% in the second half of 2021 to 3.8% in April (Chart 10). Assuming productivity growth of around 1.5%, this is consistent with inflation of only slightly more than 2%. Nominal wage growth is a function of both labor market slack and expected inflation. Slack should increase modestly during the rest of the year as labor participation recovers. Chart 11 shows that the labor force participation rate is still about 0.9 percentage points below where one would expect it to be, even adjusting for an aging population and increased early retirements. Chart 10Wage Growth Seems To Be Topping Out
Wage Growth Seems To Be Topping Out
Wage Growth Seems To Be Topping Out
Chart 11Labor Participation Has Further Scope To Recover
Labor Participation Has Further Scope To Recover
Labor Participation Has Further Scope To Recover
Employment has been particularly depressed among lower-wage workers (Chart 12). This should change as more low-wage workers exhaust their savings and are forced to seek employment. According to the Fed, the lowest-paid 20% of workers are the only group to have seen their bank deposits dwindle since mid-2021 (Chart 13). Chart 12More Low-Wage Employees Will Return To Work
More Low-Wage Employees Will Return To Work
More Low-Wage Employees Will Return To Work
Chart 13The Savings Of Low-Wage Workers Are Dwindling
The Savings Of Low-Wage Workers Are Dwindling
The Savings Of Low-Wage Workers Are Dwindling
Inflation expectations should come down as goods inflation recedes and oil prices come off their highs (Chart 14). Bob Ryan, BCA’s Chief Commodity Strategist, sees the price of Brent averaging $86/bbl in the second half of this year, down 16% from current levels. Central Banks Will Dial Back The Hawkishness With inflation set to fall over the remainder of the year, and financial markets showing increasing signs of stress, the Fed and other central banks will adopt a softer tone. It is worth noting that the median terminal dot for the Fed funds rate actually declined from 2.5% to 2.4% in the March Summary of Economic Projections (Chart 15). Given that markets expect US interest rates to rise to 3.25% in 2023, the Fed may not want investors to further rachet up rate expectations. Chart 14US Inflation Expectations Should Recede If Oil Prices Drop
US Inflation Expectations Should Recede If Oil Prices Drop
US Inflation Expectations Should Recede If Oil Prices Drop
Chart 15Rate Expectations Have Moved Well Above The Fed's Estimate of Neutral
Rate Expectations Have Moved Well Above The Fed's Estimate of Neutral
Rate Expectations Have Moved Well Above The Fed's Estimate of Neutral
The Bank of England has already veered in a more dovish direction. Its latest forecast, released on May 5, showed real GDP contracting slightly in 2023. Based on market interest rate expectations, the BoE sees headline inflation falling to 1.5% by end-2024, below its target of 2%. Even assuming that interest rates remain at 1%, the BoE believes that inflation will only be slightly above 2% at the end of 2024, implying little need for incremental policy tightening. Not surprisingly, the pound has sold off. We have been tactically short GBP/USD but are using this opportunity to turn tactically neutral. Given favorable valuations, we like the pound over the long run. Chart 16Spending In The Euro Area Is Well Below Its Pre-Pandemic Trend
Spending In The Euro Area Is Well Below Its Pre-Pandemic Trend
Spending In The Euro Area Is Well Below Its Pre-Pandemic Trend
The euro area provides a good example of the dangers of focusing too much on short-term inflation dynamics. Supply-side disruptions stemming from the pandemic and the war in Ukraine have weighed on European growth this year. Yet, those very same factors have also pushed up inflation. Harmonized inflation across the euro area reached 7.5% in April, the highest since the launch of the common currency. The ECB is eager to put some distance between policy rates and the zero bound. However, there is little need for significant tightening. Unlike in the US, spending in the euro area is well below its pre-pandemic trend (Chart 16). If anything, more inflation would be welcome since that would give the ECB scope to bring real rates further into negative territory if economic conditions warrant it. To its credit, the Bank of Japan has stuck with its yield curve control system, even as bond yields have risen elsewhere in the world. Japan’s currency has weakened but given that inflation expectations are too low, and virtually all of its debt is denominated in yen, that is hardly a bad thing. Too Late? Has the surge in bond yields already done enough damage to the global economy to make a recession inevitable? We do not think so. As noted above, much of the recent harm has been caused by various dislocations, namely the war in Ukraine and the ongoing effects of the pandemic. As these dislocations dissipate, inflation will fall and global growth will recover. Despite the hoopla over how the US economy contracted in the first quarter, real private final sales to domestic purchasers (a measure of GDP growth that strips out the effects of changes in government spending, inventories, and net exports) rose by 3.7% at an annualized rate. As Table 1 shows, this measure of economic activity has the highest predictive power for GDP growth one-quarter ahead. Table 1A Good Sign: Real Final Sales To Private Domestic Purchasers Rose By 3.7% In Q1
It’s Time To Buy: Tactically Upgrading Global Equities To Overweight
It’s Time To Buy: Tactically Upgrading Global Equities To Overweight
Meanwhile, and completely overlooked at this point, S&P 500 earnings have come in 7.3% above expectations so far in Q1, with nearly 80% of S&P 500 companies surprising on the upside. Earnings are up 10.4% year-over-year in Q1. Sales are up 13.6%. Looking out to Q4 of 2022, S&P companies are expected to earn $60.93 in EPS, up 4.3% from what analysts expected at the start of the year. It is also worth noting that homebuilder stocks have basically been flat over the past 30 days, even as the S&P 500 has dropped by nearly 10% over this period. Housing is the most interest rate-sensitive sector of the economy. With the homeowner vacancy rate at record low levels, even today’s mortgage rates may not be enough to push the economy into recession (Chart 17). Economic vulnerabilities are greater outside the US. Nevertheless, there is enough pent-up demand on both the consumer and capital spending side to sustain growth. The Last Hurrah How long will the “Goldilocks” period of falling inflation and supply-side driven growth last? Our guess is about 18 months, starting this summer and lasting until the end of 2023. Unfortunately, as is often the case, the benign environment that will emerge in the second half of this year will sow the seeds of its own demise. Real wages are currently falling across the major economies (Chart 18). That has dampened consumer confidence and spending. However, as inflation comes down, real wage growth will turn positive. This will stoke demand, leading to a reacceleration in inflation, most likely in late 2023 or early 2024. Chart 17Tight Supply Makes Housing More Resilient
Tight Supply Makes Housing More Resilient
Tight Supply Makes Housing More Resilient
Chart 18Real Wages Are Falling In Most Countries
Real Wages Are Falling In Most Countries
Real Wages Are Falling In Most Countries
In the end, central banks will discover that the neutral rate of interest is higher than they thought. That is good news for stocks in the short-to-medium run because it means that forthcoming rate hikes will not induce a recession. Down the road, however, a higher neutral rate means that investors will eventually need to value stocks using a higher discount rate. It also means that the disinflation we envision over the next 18 months will not last. All this puts us in the rather lonely “transitory transitory” camp: We think much of today’s high inflation will prove to be transitory, but the transitory nature of that inflation will itself be transitory. Be that as it may, the next 18 months of falling inflation and receding recession fears could see stocks recover much of their losses. For most investors, that is too long a period to sit on the sidelines. The “Last Hurrah” for equities is coming. Taking Partial Profits On Our Short Treasury, Long Value/Growth, And Short Bitcoin Trades We continue to think that over a 5-year horizon, bond yields will rise from current levels, value stocks will outperform growth stocks, and crypto prices will fall. However, with the “Last Hurrah” approaching, countertrend rallies are likely. To express this view, we recommend taking half profits on our short 10-year Treasury trade recommendation (up 9.3% from an initial entry yield of 1.45% on June 30, 2021). We are also halving our long global value/growth position (up 20.1% since inception on December 10, 2020), and our short Bitcoin position (up 98% based on our exponential shorting technique). Peter Berezin Chief Global Strategist peterb@bcaresearch.com Global Investment Strategy View Matrix
It’s Time To Buy: Tactically Upgrading Global Equities To Overweight
It’s Time To Buy: Tactically Upgrading Global Equities To Overweight
Special Trade Recommendations Current MacroQuant Model Scores
It’s Time To Buy: Tactically Upgrading Global Equities To Overweight
It’s Time To Buy: Tactically Upgrading Global Equities To Overweight
Executive Summary Ingredients For A Policy Mistake
Ingredients For A Policy Mistake
Ingredients For A Policy Mistake
The hawks on the European Central Bank Governing Council have become vocal about a July rate hike. Such a move would be a policy mistake because European growth is weak, while inflation is supply-driven and will soften meaningfully. July 2022 hike is not yet certain. A policy mistake suggests that the current interest rate pricing for June 23 is too aggressive. Buy June 2023 Euribor contract. The serious risk of a policy mistake and the uncertainty surrounding Europe’s energy security confirm that investors should maintain a defensive stance in European assets. The pronounced threats to UK growth warrant a negative view on the pound. Recommendation INCEPTION DATE RETURN SINCE INCEPTION (%) COMMENT Buy June 2023 Euribor contract 05/09/2022 Bottom Line: Stay defensive in Europe. The risk of a policy mistake is high. Only when inflation peaks should investors move into cyclical stocks. In recent weeks, a chorus of ECB hawks expressed the need to increase rates as early as July 2022. Inflation data is on their side; HICP stands at 7.5% and core CPI has reached 3.5%, levels never seen since the introduction of the euro. Markets are responding. The ESTR curve is pricing in a positive ECB deposit rate for the October 2022 Governing Council meeting. We need to examine the underlying European economic picture to address two key questions: Will the ECB lift rates as early as July? And will doing so constitute a policy mistake that would hurt European assets? Weaker Growth Let’s start with the growth outlook. European economic activity is rapidly deteriorating. Real GDP growth in the Eurozone has slowed markedly. In Q1, real GDP growth fell to 0.2% quarter-on-quarter or an annualized rate of 0.8%. Worrisomely, Italy’s GDP contracted by -0.2% over that time frame and the very economically sensitive Swedish activity contracted by -0.4%, which suggests that Europe’s deceleration is only starting. Soft data confirm the flagging economic outlook on the continent. Consumer confidence is plunging to levels that are consistent with a recession, led by the collapse in the willingness to make large purchases (Chart 1, top panel). The ZEW as well as the Ifo survey confirm that growth expectations point to a very large decline in output (Chart 1, bottom panel). The weakness is also evident in hard data. High inflation erodes real household income, which squeezes consumer spending. Retail sales across Europe are slowing sharply, only growing at an annual rate of 0.8% while contracting -0.4% on a monthly basis; on a level basis, they are lower today than they were in June 2021. Meanwhile, German retail sales volumes are falling at a -5.4% annual rate. The situation is even worse for new car registrations, which are collapsing at an annual rate of 20.2% (Chart 2). Chart 1Soft Data Point To Soft Growth...
Soft Data Point To Soft Growth...
Soft Data Point To Soft Growth...
Chart 2...So Do Hard Data
...So Do Hard Data
...So Do Hard Data
Industrial production has not been spared. Euro Area IP softened to 2% annually in February and contractions are now visible in Germany and France. Some of this weakness reflects supply difficulties, but the -3.1% annual fall in German factory orders indicates that demand is frail too and that industrial production will shrink further in the months ahead (Chart 2, bottom panel). The deterioration in the global outlook further hurts Europe economic prospects. Our global growth tax indicator, based on energy prices, the dollar, and global bond yields, points toward a further deceleration in the global and US manufacturing PMI, it suggests Euro Area PMIs could fall below 50 (Chart 3). China woes continue to reverberate throughout the global economy. Potential supply constraints will hurt industrial production, but, more importantly, the weakness in China’s marginal propensity to consume (as measured by the gap between the growth rate of M1 relative to M2) predicts a much greater deterioration in European industrial orders, which means that the demand for European capital goods will slow (Chart 3, bottom panel). Chart 3Risks To The Downside
Risks To The Downside
Risks To The Downside
Chart 4Tightening Financial Conditions
Tightening Financial Conditions
Tightening Financial Conditions
European financial conditions are also tightening significantly. The iTraxx Crossover Index is rising swiftly. European high-yield corporate spreads are now above 450bps, levels that coincide with past recessions in the Euro Area (Chart 4). Government bond markets are increasingly under duress too. Italian BTPs now yield close to 200bps above German Bunds (Chart 4, bottom panel), which accentuates the periphery’s pain. Bottom Line: The Eurozone economy is slowing sharply. While Q1 GDP avoided a contraction, soft and hard data indicators suggest that Q2 is likely to record an actual output contraction for the whole Euro bloc. High Inflation, But For How Long? At first glance, European inflation numbers scream for an ECB rate hike, preferably one yesterday. However, the picture is not that clear-cut. Supply factors predominantly drive the Eurozone’s inflation surge. Chart 5 highlights the role of energy, utilities, food, and transportation costs in the HICP and shows that these factors account for more than 80% of the 7.5% HICP rate. Moreover, the fluctuations in energy CPI continue to explain most of the gyration in headline CPI. The close relationship between energy CPI and core CPI highlights an elevated degree of pass-though, the result of higher electricity and transportation costs (Chart 6). Chart 5Energy, Food And Transport Dominate European CPI
An ECB Policy Mistake And Your Portfolio
An ECB Policy Mistake And Your Portfolio
Chart 6All About Energy
All About Energy
All About Energy
Chart 7No Demand Pull-Inflation In Europe
No Demand Pull-Inflation In Europe
No Demand Pull-Inflation In Europe
Unlike those in the US, Euro Area underlying inflation drivers are weak and inconsistent with demand-pull inflation. Wage growth in Europe stands at a paltry 1.6% annual rate, while in the US, the Atlanta Fed Wage Tracker has jumped to 4.5% (Chart 7, top panel). Moreover, Eurozone rent inflation remains stable at 1.2%, while it is a very elevated 4.5% in the US (Chart 7, bottom panel). The bifurcation in demand-driven inflation reflects vastly different output gaps between the two regions. US nominal GDP stands 2.5% above its 2014-2019 trend, while that of the Eurozone is still 5.3% below it. In the consumer durable goods sector, where the US experienced the greatest demand-supply mismatch – and therefore, the greatest inflation pressures – purchases are 25% above their 2014-2019 trend, while in Europe, they are still 9.5% below that trend (Chart 8) Year-on-year inflation prints should roll over this summer, as highlighted by weakening sequential inflation. Even if it remains elevated, the monthly Trimmed Mean CPI peaked last year. Energy inflation, moreover, is already contracting on a month-to-month basis (Chart 9). Chart 8Mind The Output Gap
Mind The Output Gap
Mind The Output Gap
Chart 9Weakening Sequential Inflation
Weakening Sequential Inflation
Weakening Sequential Inflation
Chart 10A Naive Inflation Forecast
A Naive Inflation Forecast
A Naive Inflation Forecast
Simple simulation exercises also confirm that annual inflation will peak this summer (Chart 10). Monthly headline inflation averaged 0.11% from 2010 to 2019, 0.31% in the first half of 2021, and 0.55% from mid-2021 to January 2022. If we assume that monthly inflation prints remain in line with its most recent average, annual inflation will peak by year-end at 9.1%, before falling to 6.8% by April 2023. However, if monthly inflation falls back to an historically elevated monthly average of 0.31%, annual headline inflation will peak in September and fall back to 3.8% by April 2023. Similarly, if monthly core CPI averages 0.28%, annual core CPI will peak in October before declining to 3.4% by April 2023, but it will fall to 2.1% by April 2023, if monthly core CPI averages an historically elevated 0.17%, or the average observed in the first half of 2021 (Chart 10, bottom two panels). Chart 11A Conditional Inflation Forecast
A Conditional Inflation Forecast
A Conditional Inflation Forecast
A more sophisticated exercise based on energy prices and the EUR/USD exchange rate also underlines the downside for Euro Area headline inflation. Energy inflation, which drives headline CPI, closely tracks the evolution of brent prices in euro terms and Deutsch natural gas prices. Assuming that natural gas prices average the historically very high level of €100/MWh over the next twelve months, that Brent averages US$95/bbl over that time frame (consistent with BCA’s commodity and energy team forecasts), and that the euro progressively moves back to EUR/USD1.10 by April 2023 (a weaker expectation than BCA’s Foreign Exchange Strategy team anticipates), then the Eurozone’s energy inflation will collapse to -10% by April 2023 (Chart 11). We can also assume that Russia enacts a full energy embargo on Western Europe if Sweden and Finland apply for NATO membership. In this case, Brent would spike quickly to $140/bbl and natural gas to €250/MWh. In our scenario, prices stay elevated for two months, before they ultimately normalize by early 2023. Under this scenario, energy inflation would experience a spike to 80% (!) in June 2022 before falling back sharply. In all cases, the collapse in energy inflation is consistent with a rapid decline in headline inflation toward 2% in 2023. Bottom Line: European inflation is elevated but remains mainly driven by supply factors, particularly the evolution of energy inflation. Demand-pull inflation is minimal, unlike that in the US. Additionally, both core and headline inflations are set to peak in the coming months based on the evolution of sequential monthly inflation as well as the behavior of the energy market. A July ECB rate hike would constitute a policy mistake for three reasons: (i) the ECB has no control over supply-driven inflation; (ii) Eurozone inflation is set to weaken; and (iii) economic growth will remain poor. Investment Implications Despite the noise made by the hawks, a large amount of uncertainty around the July 2022 meeting’s outcome remains. It is easy to forget that the ECB’s decisions are consensual. Influential members such as Vice-President Luis de Guindos continues to see a July 2022 hike as possible but unlikely. Others, such as Executive Board member Fabio Panetta, are very worried about the Eurozone’s economic slowdown. Moreover, ECB President Christine Lagarde has not endorsed the hawks. In the context of weak growth and a potential top in inflation, achieving consensus about an early summer hike could be difficult. Chart 12Patience Would Be Rewarded
Patience Would Be Rewarded
Patience Would Be Rewarded
The great paradox is that, if the ECB waits before pushing interest rates up, it will have an opportunity to increase rates durably next year. Wage growth is anemic today, but the decline in the Eurozone unemployment rate is consistent with a pickup in salaries in 2023 (Chart 12). Moreover, if energy inflation slows, the relative price-shock that is hurting households and domestic demand will ebb, which will allow consumption to recover. Patience would give Europe strength and the ECB a very strong basis to lift rates sustainably. The hawks will sway the council to their views. Inflation has latency, which means that its inertia may cause HICP to remain elevated beyond this summer. Moreover, the EU’s proposed ban on Russian oil imports along with Sweden’s and Finland’s likely accession-demand to NATO in the upcoming weeks could provoke Russia to strike first by cutting all its energy export to the EU to zero immediately. This would lift inflation for somewhat longer, as we showed in Chart 9. Related Report European Investment StrategyThe Three Forces Hurting European Earnings In response to the significant risk of a rate hike, we continue to recommend investors stay short cyclical stocks relative to defensive ones. Moreover, if the risk of a Russian energy cutoff increases, so does the threat of a severe recession in Europe, as a recent Bundesbank study posits (Chart 13). Capital preservation is paramount in today’s context; thus, we continue to lean on the side of prudence, especially considering Europe’s soft profit outlook. Once risks recede, we will abandon this strategy. This decision, however, would require clarification of Sweden and Finland’s decision about their membership in NATO as well as Russia’s response, a confirmation that the ECB is not hiking rates in July, and a pullback in inflation surprises, which would prove a powerful help for European equities and the cyclicals/defensive split (Chart 14). Chart 13The Russian Embargo Risk
An ECB Policy Mistake And Your Portfolio
An ECB Policy Mistake And Your Portfolio
Chart 14Wait For Inflation To Turn
Wait For Inflation To Turn
Wait For Inflation To Turn
In fact, our view that inflation will peak leads to direct implications for European markets. The periods that followed the previous four peaks in European core inflation were associated with an outperformance of small-cap stocks and cyclical stocks over the subsequent six and twelve months as well as declines in German yields and narrower credit spreads (Table 1A). The sectoral implications were not as clear, but industrials enjoyed an edge, while healthcare stocks suffered marked declines. Our conviction is strongest that energy CPI will fall. Again, this environment is associated with an outperformance of small-caps stocks and cyclicals over the following six months (Table 1B). Sector-wise, energy names suffer in this climate along with defensives, especially communication services equities. Table 1APeaks In Core CPI & Subsequent European Asset Performance
An ECB Policy Mistake And Your Portfolio
An ECB Policy Mistake And Your Portfolio
Table 1BPeaks In Energy CPI & Subsequent European Asset Performance
An ECB Policy Mistake And Your Portfolio
An ECB Policy Mistake And Your Portfolio
Looking at this period of disinflation more broadly rather than just following peaks in inflation, we find similar results. Declining core CPI is associated with an outperformance of cyclicals relative to defensives as well as strength in small-cap equities (Table 2A). This larger sample allows for a clearer view of sectors. Specifically, the performance of industrials and tech relative to the broad market improves markedly, while utilities suffer greatly. We reach roughly similar conclusions when energy CPI is contracting, except that, in this instance, energy stocks also underperform (Table 2B). Interestingly, so do financial companies. This is a surprising result, but previous instances of weaker energy CPI in the sample reflected weaker demand, not an evolving supply shock. Weaker aggregate demand always hurts financials. Table 2ADisinflation & Subsequent European Asset Performance
An ECB Policy Mistake And Your Portfolio
An ECB Policy Mistake And Your Portfolio
Table 2BEnergy Deflation & Subsequent European Asset Performance
An ECB Policy Mistake And Your Portfolio
An ECB Policy Mistake And Your Portfolio
Bottom Line: The risk of a policy mistake at the July ECB meeting is elevated. A policy mistake suggests that the current interest rate pricing for June 23 is too aggressive. Buy June 2023 Euribor contract. Moreover, Russian energy exports are still under threat. Accordingly, we continue to emphasize capital preservation and favor defensives over cyclicals. However, a buying opportunity will emerge rapidly once inflation peaks, especially if the ECB follows our base case. At this point, investors should buy small-cap and cyclical stocks. Industrials will beat energy, while all the defensive sectors will suffer. The BoE’s Tough Choice The Bank of England is stuck between a rock and a hard place. UK inflation shares characteristics of that of both the Eurozone and the US. On the one hand, energy inflation is increasing and could push headline CPI into double-digit territory around October 2022, once fuel subsidies fully expire. On the other hand, wage growth is strong as labor supply elasticity declined after Brexit. Demand-pull inflation is also rampant, which has pushed core CPI to a 5.7% annual rate. The UK’s cost push inflation, along with the growth slowdown in Europe and increasing tax rates are likely to cause a recession in the UK over the coming twelve months. The demand-pull inflation, however, will force the BoE to hike interest rates. This accentuates the downside risk to UK economic activity. Chart 15BoE's First Victim: The Pound
BoE's First Victim: The Pound
BoE's First Victim: The Pound
The obvious victim of this configuration is the pound. Weak growth will prevent the BoE from matching the pace of rate hikes of the Fed and poor economic growth will detract from investments in the UK. As a result, we see further downside in GBP/USD (Chart 15). BCA’s FX strategy team is also selling the pound versus the euro. This position is likely to generate further gains as investors will revise down their views for UK economic activity relative to the Euro Area, since they already hold much more dire expectations for the latter than the former. Bottom Line: EUR/GBP possesses more upside. The growth outlook for the Eurozone is poor, but investors currently overestimate the growth path of the UK relative to that of its southern neighbor. Mathieu Savary, Chief European Strategist Mathieu@bcaresearch.com Tactical Recommendations Cyclical Recommendations Structural Recommendations
Executive Summary Europe's Largest Import Bill: Oil
Die Cast By EU: Inflation, Recession Risks Rise
Die Cast By EU: Inflation, Recession Risks Rise
The EU crossed the Rubicon this week, proposing to eliminate Russian oil imports within six months. The speed of putting the sanctions into effect, and Russia’s retaliation, will be critical to whether the world endures continued inflationary pressures or whether a global recession ensues. Russia indicated it will launch its own round of sanctions in the near future, which could profoundly affect not only global oil and gas markets, but once again induce input price shocks to electricity markets – which will hit firms and households again with higher prices – and agricultural markets. Turmoil in commodity markets has opened a policy debate over whether the world will be forced to migrate to a new monetary order based on access to commodities and control of commodity flows, which would replace the fiat-money architecture that succeeded the post-WWII Bretton Woods system. This debate draws together numerous trends – the centrality of commodities to price levels and inflation; central-bank policy; failed regulation at commodity exchanges; and commodity scarcity due to weak capex. Bottom Line: Commodity markets are changing rapidly as fundamentals adapt to supply tightness and an extremely erratic demand recovery. However, this does not mark the beginning of a new Bretton Woods era. Markets adapt quickly to changing fundamentals and that will continue. Feature With its proposal this week to ban the import of Russian oil, the EU crossed the Rubicon and now will prepare for an escalation of its economic war with Russia. Oil imports are, by far, the EU's largest energy import expense, and Russia is its largest supplier (Chart 1). Russian natural gas exports to Europe account for 74% of its total natgas exports, although natgas comprises a much smaller share of Russia’s revenue than oil (Chart 2). In a pecuniary sense, oil is far more important, but in an economic sense gas is more meaningful for Europe. Chart 1Europe's Largest Import Bill: Oil
Die Cast By EU: Inflation, Recession Risks Rise
Die Cast By EU: Inflation, Recession Risks Rise
Chart 2Russia's Largest Market: Europe
Die Cast By EU: Inflation, Recession Risks Rise
Die Cast By EU: Inflation, Recession Risks Rise
Russia produced 10.1mm b/d of crude and condensates in 2021. Of the 4.7mm b/d of this that Russia exported, OECD Europe was its largest customer, at 50% of total, according to the US EIA. If Russia's production is curtailed by roughly 1mm b/d this year and next year due to sanctions, we estimate Brent prices could reach $120/bbl. Losing 1.8mm this year and another 700k b/d next year could push Brent prices above $140/bbl (Chart 3). On the natgas side, one-third of the ~ 25 Tcf of Russian production last year was exported via pipeline or as LNG, based on 2021 data from the EIA. This amounted to almost 9 Tcf. Most of this – 74% – was exported via pipeline to the OECD Europe. These are dedicated volumes flowing through Russia's network into Europe. Until the Power of Siberia pipeline is expanded – likely over the next 2-3 years — this gas will not be available for export. Chart 3Losing Russian Oil Exports Will Push Prices Sharply Higher
Losing Russian Oil Exports Will Push Prices Sharply Higher
Losing Russian Oil Exports Will Push Prices Sharply Higher
Oil and gas exports last year accounted for close to 40% of the Russian government's budget. Crude and product revenue last year came in at just under $180 billion, while pipeline and LNG shipments of natgas accounted for close to $62 billion of the Russian government's revenues. Clearly, the stakes are extremely high for Russia if Europe embargoes oil imports. Escalation Of Economic War Russian Energy Minister Alexander Novak last month threatened to shut off Russian exports of natural gas if the EU cut off oil imports. Whether – or how quickly – that threat is acted upon will be critical for Europe. Speculation around the EU's proposal to embargo oil imports of all kinds from Russia centers on the ban becoming effective by the end of this week, with a six-month phase-down of imports.1 It is still possible that the sanctions will be vetoed and revised. But with Germany changing its position and now willing to embargo oil, it is only a matter of time before the majority of the EU cuts off Russian oil imports. In response, Russia will launch its own round of embargoes, which could profoundly affect not only global oil and gas markets, but once again induce input-price shocks to electricity markets – which will hit household budgets and base-metals smelters and refiners – and agricultural markets, given the large share of natgas in fertilizers (Chart 4). It is not difficult to imagine base-metals refining operations closing again in Europe, along with crop-planting delays rising.2 On the back of this collateral damage from the cut-off of Russian oil and gas exports, we would expect inflation and inflation expectations to take another leg up. This comes against a backdrop in which central banks led by the US Fed already have initiated a rate-hiking program to address inflation that is running far hotter than previously forecast. Chart 4Tight Natgas Markets Drive Fertilizer/Grain Prices Higher Power, Fertilizer, Base Metals Could Be Shocked By Russian Cut-Offs
Tight Natgas Markets Drive Fertilizer/Grain Prices Higher Power, Fertilizer, Base Metals Could Be Shocked By Russian Cut-Offs
Tight Natgas Markets Drive Fertilizer/Grain Prices Higher Power, Fertilizer, Base Metals Could Be Shocked By Russian Cut-Offs
Policymakers Reassess Commodities This turmoil in commodity markets has ignited a policy debate over whether the world will be forced to migrate to a new monetary order. The new order, so the argument goes, would be based on access to commodities and control of commodity flows and would replace the fiat-money architecture that succeeded the post-WWII Bretton Woods system. This debate draws together numerous trends – the centrality of commodities to price levels and inflation; central-bank policy; failed regulation at commodity exchanges; non-USD invoicing and funding; and commodity scarcity – particularly in industrial commodities like oil, natgas and metals due to weak capex over almost a decade. The debates around these different crises are being framed around the heightened geopolitical awareness of the critical role of commodities in the language of financial markets. This is a novel innovation; however, it essentially is an argument by analogy and can obfuscate underlying causes and effects. Bretton Woods III In The Offing? Following WW II, the US and other advanced economies launched the Bretton Woods system, under which the US would operate and maintain a commodity-money regime – i.e., the gold standard – that maintained convertability of USD to gold upon demand. This post-World War II Bretton Woods (BW) system – call it BWI – remained in place until the early 1970s and made the USD the preeminent currency in the world during that period. Literally, the system, operated by the Fed, made the USD "as good as gold." That didn't last, as US domestic exigencies – the Vietnam War and the War on Poverty – forced the US to abandon gold-convertibility and adopt a fiat-money system to finance these multiple wars. Nevertheless the dollar retained its centrality to global markets. Call this fiat system BWII. As of 2022, the dollar remains the world’s dominant reserve currency, accounting for ~ 60% of the $12.25 trillion of foreign exchange reserves, according to IMF data (Chart 5).3 As a vehicle currency, it accounts for close to 90% of daily FX trading – amounting to ~ $6 trillion/day of turnover. The dollar also is the preeminent funding and invoice currency. Trade invoicing denominated in USD accounts for 93% of imports and 97% of exports worldwide. Chart 5USD Remains Dominant Reserve Currency
Die Cast By EU: Inflation, Recession Risks Rise
Die Cast By EU: Inflation, Recession Risks Rise
According to the WTO, global trade in 2019 (just before the COVID-19 pandemic) was just shy of $19 trillion (Chart 6). This global dominance of the USD means the dollar’s funding-currency role “mediates the transmission of U.S. monetary policy to global financing conditions.”4 This has been the case for the 23 years since the creation of the euro, including the periods before and after the 2008 global financial crisis. Chart 6USD Dominates World Trade
Die Cast By EU: Inflation, Recession Risks Rise
Die Cast By EU: Inflation, Recession Risks Rise
The dollar’s importance to the global economy has only grown since the BWI era.5 Obstfeld notes US gross external assets and liabilities relative to GDP “grow sharply (but roughly commensurately) up until the global financial crisis, reaching ratios to GDP in the neighborhood of 150 percent. Since then, assets have levelled off but liabilities have continued to grow.” The dollar faces a range of challenges, as we discuss below, but any discussion must begin with its resilience as the top currency – a resilience that spans the creation of the euro, the rise of China, vast US budget and trade deficits, multiple rounds of quantitative easing, and political instability in Washington. A Return To Commodity-Based Money? The full power of the Fed's role at the center of the global monetary system – as a reserve currency and as the preeminent medium for funding and invoicing trade – was revealed following the invasion of Ukraine by Russia. The US froze Russian foreign reserves, denied it access to the international SWIFT payments system, and imposed sanctions on Russian firms and individuals, and anyone trading with them. Following the US actions, Russia's economy was partially frozen out of global trade, banking and finance. Western partners abandoned their Russian investments, taking their capital and technology out of the country. Outside of the sanctions, individual firms such as refiners, shippers and trading companies “self-sanctioned” their dealings with Russia, and refused to handle inbound or outbound Russian commodities. Given the US capability revealed, and the threat posed to other countries should the US sanction them in a likely manner, new risks to the dollar system will emerge. The primacy of the USD, and the Fed's role in maintaining its central banking position to the world, are by no means assured. Indeed, other states – namely China – will try to insulate themselves from similar sanctions. India is apparently willing to trade with Russia in rubles. Saudi Arabia is exploring being paid in RMB for oil exports to China and a wide range of states could increase their acceptance of RMB at least to cover their growing trade with China. China has been pushing hard to have its RMB recognized and used as a global reserve currency, and a trade-invoicing and trade-funding currency. For this to happen, China also would have to allow its currency to become a vehicle currency – i.e., the anchor leg in FX trading. Zoltan Pozsar, a Credit Suisse analyst, recently penned an article exploring the new terrain exposed by the Russian invasion of Ukraine and the US and EU responses.6 For Pozsar, "Commodity reserves will be an essential part of Bretton Woods III, and historically wars are won by those who have more food and energy supplies – food to fuel horses and soldiers back in the day, and food to fuel soldiers and fuel to fuel tanks and planes today." Pozsar avers that his formulation of Bretton Woods III will reverse the disinflation created by globalization, and "serve up an inflationary impulse (de-globalization, autarky, just-in-case hoarding of commodities and duplication of supply chains, and more military spending to be able to protect whatever seaborne trade is left)." These conclusions are similar to conclusions we have reached over the course of the past few years, as it became increasingly apparent that the US was losing geopolitical clout relative to rising powers, mainly China, and that the international system was becoming multipolar and unstable. The Ukraine war confirmed the new environment of Great Power Rivalry. Nation-states will indeed amass and hoard commodities as they will need to gird for battle as this rivalry heats up. Preparation for war and war itself are historically inflationary (Chart 7). Chart 7War And Preparation For War Are Inflationary
War And Preparation For War Are Inflationary
War And Preparation For War Are Inflationary
However, countries still have to pay for commodities in a currency that exporters are willing to receive. Yet the biggest global oil and food exporters depend on the US for their security, except Russia. Even in base metals the US wields extraordinary influence over the non-aligned exporters. These states could reduce their dollar invoicing to cover their share of trade with countries outside the West, but their national security alliances and partnerships imply a hard-to-change view on which economies and currencies will be most stable over the long run. The dollar is again preeminent. China unquestionably wants to diversify away from the dollar. But China’s trade partners will have a limit on how much yuan cash they are willing to hold. If they want to recycle this cash into China’s economy, China must open its capital account. But this would reduce the Communist Party’s control of the domestic economy due to the Impossible Trinity (the yuan would have to float freely). So until China makes this change, the world is stuck in today’s monetary system. By contrast, if China totally closes its system due to domestic or foreign political threats, then the world faces a recession and investors will not be rushing to sell the dollar. For now China is trying to have it both ways: maintaining large foreign exchange reserves while gradually diversifying away from the dollar (Chart 8). China selling off its Treasury holdings and dollar reserves, which began in the aftermath of the Great Recession, is the biggest monetary shift since 1999, when the euro emerged and China’s purchases of Treasuries began to surge due to trade surpluses on the back of its joining the WTO. But there is little basis for China or anyone else to abandon fiat currencies and return to the gold standard. Fiat currencies enable states to control the money supply and hence to try to control their economies and societies. The Chinese are the least likely to abandon fiat currency given their laser focus on employment, manufacturing, and social stability. China is a commodity importer, so that if it seeks to amass commodities as strategic reserves in the midst of a commodity boom, it will pay top price. This means the yuan would need to be kept strong. But in fact China is allowing the yuan to depreciate, as it would face higher unemployment and instability if domestic demand were further suppressed by a rising yuan. China is already undergoing a painful transition away from export orientation – and Beijing has already acknowledged that de-industrialization should slow down because it poses a sociopolitical threat (Chart 9). A monetary revolution that strengthens the yuan at the expense of the dollar would force an immediate conclusion to China’s transition away from export-manufacturing. That would be politically destabilizing. Chart 8China Diversifies from USD - But Closed Capital Account Prevents Global RMB
China Diversifies from USD - But Closed Capital Account Prevents Global RMB
China Diversifies from USD - But Closed Capital Account Prevents Global RMB
Chart 9Stronger RMB Would De-Industrialize China At Great Political Risk
Stronger RMB Would De-Industrialize China At Great Political Risk
Stronger RMB Would De-Industrialize China At Great Political Risk
If China or other countries attempt to create a commodity base for their currencies, but simultaneously try to prevent a fixed exchange rate that constrains their money supply, then there will be little difference from a fiat currency regime. Today’s major reserve currency issuers already possess reserves of physical wealth (e.g. commodities) beneath their flexible monetary policy regimes – this dynamic would not inherently change. Of course, Europe, Japan, and the United Kingdom are the leading providers of reserve currencies outside the US and yet they are relatively lacking in commodity reserves. If global investors begin chasing currencies primarily on the basis of commodity reserves, the USD will not suffer the most, as the United States is a resource-rich country. China’s policy and strategy may become clearer after the twentieth party congress this fall, but most likely the current contradictions will persist. China will want to prolong the period of economic engagmeent with the West for as long as possible even as it prepares for a time when engagement is utterly broken. While China knows that the US will pursue strategic containment, and US-China engagement is over, it also knows that European leaders have a different set of interests. They have enough difficulty dealing with Russia and are not eager to expand their sanctions to China. Yet switching from dollar to euro reserves offers China little protection against sanctions in any major confrontation in the coming years. A radical decision by China to buy high and sell low (realize big losses on Treasuries and buy high-priced commodities) would show that Beijing is expecting Russian-style confrontation with the West immediately, which would scare foreign investors away from China. Net foreign direct investment in China has surged since the downfall of the Trump presidency (Chart 10). But that process would reverse as companies saw China going down Russia’s path and disengaging from the global monetary system. In that context, western governments would also penalize their own companies for investing in a geopolitical rival that was apparently preparing for conflict (while buttressing Russia). In short, private capital will flee countries that abandon the global financial system because that would be an economically inefficient decision taken for reasons of state security, and hence it would imply higher odds of conflict. Wealthy nations see China’s and other emerging markets’ foreign exchange reserves as “collateral” against asset seizures and geopolitical risks: if China reduces the collateral, private capital will feel less secure flowing into China.7 Chart 10If China Abandonds USD To Prepare For Sanctions, FDI Will Reverse
If China Abandonds USD To Prepare For Sanctions, FDI Will Reverse
If China Abandonds USD To Prepare For Sanctions, FDI Will Reverse
Ultimately China will try to wean itself off the dollar – but it will keep doing so gradually to avoid a catastrophic social and economic change at home and abroad. This is continuation of post-2008 status quo. An accelerated shift away from USD will be interpreted by global actors as preparation for war (just like Russia’s shift). This will drive investors to swap Chinese assets for American or other assets. History suggests that USD devaluations followed US wars and budget expansions. Investors should wait until the next US military adventure, in Iran or elsewhere, before expecting massive dollar depreciation. If the US pursues an offshore balancing strategy, as it appears to be doing today, then other countries will become less stable and the dollar will remain appealing as a safe haven. Bottom Line: Russia’s and China’s diversification away from the dollar over the past decade has not caused global flight from the dollar. International trust in the economy and government of Russia and China is not very high. The euro, the viable alternative to the dollar, is less attractive in the face of the Ukraine war and broader geopolitical instability. The path toward monetary revolution is for China to open up its capital account, make its currency convertible, and sell USD assets while appreciating the yuan. Yet China’s leaders have not embarked on this course for fear of domestic instability. In lieu of that, the current monetary regime continues. Robert P. Ryan Chief Commodity & Energy Strategist rryan@bcaresearch.com Matt Gertken Chief Geopolitical Strategist mattg@bcaresearch.com Footnotes 1 Please see Brussels proposes EU import ban on all Russian oil published by ft.com on May 4, 2022 for summary of the EU's export-ban proposals. 2 Please see our report from March 31, 2022 entitled Germany Closer To Rationing Natgas for further discussion. It is available at ces.bcaresearch.com. 3 See Obstfeld, Maurice (2020), Global Dimensions of U.S. Monetary Policy, International Journal of Central Banking, 16:1, pp. 73-132. 4 Obstfeld (2020, p. 113). 5 Obstfeld (2020, p. 77-78). 6 Please see Pozsar, Zoltan (2022), "Money, Commodities, and Bretton Woods III," published by Credit Suisse Economics. 7 For the “collateral” interpretation of US dollar-denominated foreign exchange reserves, see Michael P. Dooley, David Folkerts-Landau, and Peter M. Garber, “US Sanctions Reinforce The Dollar’s Dominance,” NBER Working Paper Series 29943, April 2022, nber.org.
In lieu of next week’s report, I will be presenting a webcast titled ‘The 5 Big Mispricings In The Markets Right Now, And How To Profit From Them’. I do hope you can join. Executive Summary Just as the railway timetables set in train the First World War, central bank timetables for aggressive rate hikes are setting in train a global recession. Demand is already cool, so aggressive rate hikes will take it to outright cold. The risk is elevated because central banks are desperate to repair their damaged credibility on fighting inflation, and it may be their last chance. Inflationary fears and hawkishness from central banks are weighing on bonds and stocks, and it may take some weeks, or months, for inflation fears to recede. But we could be approaching a turning point. By the summer, core inflation should be receding. Furthermore, the fractal structures of the sell-offs in both the 30-year T-bond and the tech-heavy NASDAQ index are approaching points of extreme fragility that have signalled inflection points. Fractal trading watchlist: 30-year T-bond, NASDAQ, FTSE 100 versus Euro Stoxx 50, Netherlands versus Switzerland, and Petcare (PAWZ). US Inflation Is Hot, But Demand Is Not
US Inflation Is Hot, But Demand Is Not
US Inflation Is Hot, But Demand Is Not
Bottom Line: Tactically cautious, but long-term investors who do not need to time the market bottom should overweight bonds and overweight long-duration defensive equities versus short-duration cyclical equities – for example, overweight US versus non-US equities. Feature The First World War, the historian AJP Taylor famously argued, was “imposed on the statesmen of Europe by railway timetables.” Taylor proposed that the railways and their timetables were so central to troop mobilisation – and specifically, the German Schlieffen Plan – that a plan once set in motion could not be stopped. “Once started the wagons and carriages must roll remorselessly and inevitably to their predestined goal.” Otherwise, the whole process would unravel, and an opportunity to demonstrate military credibility would be lost that might never come again. Today, could a global recession be imposed upon us by central bank timetables for aggressive rate hikes? Just as it was difficult to unwind the troop mobilisation that led to the Great War, it will be difficult to back down from the aggressive rate hikes that the central banks have timetabled, at least in the near term. Otherwise, an opportunity to demonstrate inflation fighting credibility would be lost that might never come again. Just as the railway timetables set in train the First World War, central bank timetables for aggressive rate hikes may set in train another global recession. Unfortunately, central banks do not have precision weapons. Quite the contrary, monetary tightening is a blunt instrument which works by cooling overall demand. But demand is already cool, as evidenced by the contraction of the US economy in the first quarter. In their zeal to repair their damaged credibility on fighting inflation, the danger is that central banks take the economy from cool to outright cold. Granted, the US economy was dragged down by a drop in inventories and net exports. But even US domestic demand – which strips out inventories and net exports – is barely on its pre-pandemic trend (Chart I-1). Meanwhile, the euro area economy is still 5 percent below its pre-pandemic trend (Chart I-2). To reiterate, by hiking rates aggressively into economies that are at best lukewarm, central banks are risking an outright recession. Chart I-1US Inflation Is Hot, But Demand Is Not
US Inflation Is Hot, But Demand Is Not
US Inflation Is Hot, But Demand Is Not
Chart I-2Euro Area Inflation Is Hot, But Demand Is Not
Euro Area Inflation Is Hot, But Demand Is Not
Euro Area Inflation Is Hot, But Demand Is Not
Our Three-Point Checklist For A Recession Has Three Ticks My colleague Peter Berezin has created a three-point checklist for a recession: The build-up of an imbalance makes the economy vulnerable to downturn. A catalyst exposes this imbalance. Amplifiers exacerbate the downturn. Is there a major imbalance? You bet there is. The post-pandemic 26 percent overspend on durable goods in the US constitutes one of the greatest imbalances in economic history. Other advanced economies also experienced unprecedented binges on durable goods. The catalyst that is exposing this major imbalance is the realisation that durable goods are, well, durable. So, if you overspent on durables in 2020/21, then the risk is that you symmetrically underspend in 2022/23 (Chart I-3). The post-pandemic 26 percent overspend on durable goods in the US constitutes one of the greatest imbalances in economic history. Meanwhile, a future underspend on goods cannot be countered by an overspend on services because the consumption of services is constrained by time, opportunity, and biology. There is a limit to how often you can eat out, go to the movies, or go to the doctor (Chart I-4). Indeed, for certain services, an underspend will persist, because we have made some permanent post-pandemic changes to our lifestyles: for example, hybrid office/home working and more online shopping and online medical care. Chart I-3An Overspend On Goods Can Be Corrected By A Subsequent Underspend...
An Overspend On Goods Can Be Corrected By A Subsequent Underspend...
An Overspend On Goods Can Be Corrected By A Subsequent Underspend...
Chart I-4...But An Underspend On Services Cannot Be Corrected By A Subsequent Overspend
...But An Underspend On Services Cannot Be Corrected By A Subsequent Overspend
...But An Underspend On Services Cannot Be Corrected By A Subsequent Overspend
Finally, the amplifier that will exacerbate the downturn is monetary tightening. If central banks follow their railway timetables for aggressive rate hikes, a goods downturn will magnify into an outright recession. So, in Peter’s three-point checklist, we now have tick, tick, and tick. Inflation Is Hot, But Demand Is Not If economic demand is at best lukewarm, then what caused the post-pandemic inflation that central banks are now fighting? The simple answer is massive fiscal stimulus combined with the equally massive shift in spending to durable goods. Locked at home and flush with government supplied cash, we couldn’t spend it on services, so we spent it on goods. This created a massive shock in the distribution of demand, out of services whose supply could easily adjust downwards, and into goods whose supply could not easily adjust upwards. For example, airlines could cut back their flights, but auto manufacturers couldn’t make more cars. So, airfares didn’t collapse but used car prices went vertical! The causality from stimulus payments to durable goods spending to core inflation is irrefutable. The causality from stimulus payments to durable goods spending to core inflation is irrefutable. The biggest surges in US durable goods spending all coincided with the government’s stimulus checks (Chart I-5). And the three separate surges in month-on-month core inflation all occurred after surges in durable goods demand (Chart I-6). As further proof, core inflation is highest in those economies where the stimulus checks and furlough schemes were the most generous – like the US and the UK. Chart I-5Stimulus Checks Caused The Surges in Durable Goods Spending
Stimulus Checks Caused The Surges in Durable Goods Spending
Stimulus Checks Caused The Surges in Durable Goods Spending
Chart I-6The Surges In Durable Goods Spending Caused The Surges In Core Inflation
The Surges In Durable Goods Spending Caused The Surges In Core Inflation
The Surges In Durable Goods Spending Caused The Surges In Core Inflation
What Does All This Mean For Investment Strategy? Our high conviction view is that the pandemic’s inflationary impulse combined with the Ukraine war will turn out to be demand-destructive, and thereby ultimately morph into a deflationary impulse. Yet central banks are all pumped up to demonstrate their inflation fighting credibility. Given that this credibility is badly damaged, it may be their last opportunity to repair it before it is shattered forever. To repeat, just as the railway timetables set in train the First World War, central bank timetables for aggressive rate hikes may set in train another global recession. That said, a recession is not inevitable. The interest rate that matters most for the economy and the markets is not the policy rate that central banks want to hike aggressively, it is the long-duration bond yield. A lower bond yield can underpin both the economy and the financial markets, just as it did during the pandemic in 2020. But to the extent that the bond market is following the real economic data, we are in a dangerous phase. Because, as is typical at an inflection point, the real data will be noisy and ambiguous. Meaning it may take some weeks, or months, for inflation fears to be trumped by growth fears. On March 10th, in Are We In A Slow-Motion Crash? we predicted: “On a tactical (3-month) horizon, the inflationary impulse from soaring energy and food prices combined with the choke on growth from sanctions will weigh on both the global economy and the global stock market. As such, bond yields could nudge higher, the global stock market has yet to reach its crisis bottom, and the US dollar will rally” That prediction proved to be spot on! Recession, or no recession, we are still in a difficult period for markets because inflationary fears and hawkishness from central banks are weighing on bonds and stocks, while buoying the US dollar. As such, tactical caution is still warranted. Fractal structures of the sell-offs in both the 30-year T-bond and the tech-heavy NASDAQ index are approaching points of extreme fragility. But we could be approaching a turning point. By the summer, core inflation should be receding. Furthermore, the fractal structures of the sell-offs in both the 30-year T-bond and the tech-heavy NASDAQ index are approaching points of extreme fragility that have reliably signalled previous inflection points (Chart I-7 and Chart I-8). Chart I-7The Sell-Off In The 30-Year T-Bond Is Approaching Fractal Fragility
The Sell-Off In The 30-Year T-Bond Is Approaching Fractal Fragility
The Sell-Off In The 30-Year T-Bond Is Approaching Fractal Fragility
Chart I-8The Sell-Off In The NASDAQ Is Approaching Fractal Fragility
The Sell-Off In The NASDAQ Is Approaching Fractal Fragility
The Sell-Off In The NASDAQ Is Approaching Fractal Fragility
The advice for long-term investors who do not need to time the market bottom is: Bonds will ultimately rally. Overweight the 30-year T-bond and the 30-year Chinese bond. Equities will be conflicted between slowing growth which will weigh on cyclical profits, and falling bond yields which will buoy long-duration valuations. Therefore, overweight long-duration defensive sectors and markets versus short-duration cyclical sectors and markets. For example, overweight US versus non-US equities. Fractal Trading Watchlist As just discussed, the sell-offs in the 30-year T-bond and the NASDAQ are approaching points of fractal fragility that have signalled previous turning points. Hence, we are adding both investments to our watchlist. Also added to our watchlist is the outperformance of the FTSE100 versus Euro Stoxx 50, and the underperformance of Netherlands versus Switzerland, both of which are approaching potential reversals. Our final addition is Petcare (PAWZ). After a stellar 2020, Petcare gave back most of its gains in 2021. But this underperformance is now approaching a point of fragility which might provide a new entry point. There are no new trades this week, but the full watchlist of investments at, or approaching, turning points is available on our website: cpt.bcaresearch.com Fractal Trading Watchlist: New Additions A Potential New Entry Point Into Petcare
A Potential New Entry Point Into Petcare
A Potential New Entry Point Into Petcare
FTSE100 Outperformance Vs. Euro Stoxx 50 Vulnerable To Reversal
FTSE100 Outperformance Vs. Euro Stoxx 50 Vulnerable To Reversal
FTSE100 Outperformance Vs. Euro Stoxx 50 Vulnerable To Reversal
Netherlands Underperformance Vs. Switzerland Close To Exhaustion
Netherlands Underperformance Vs. Switzerland Close To Exhaustion
Netherlands Underperformance Vs. Switzerland Close To Exhaustion
Chart 1The Strong Trend In The 18-Month-Out US Interest Rate Future Is Fragile
The Strong Trend In The 18-Month-Out US Interest Rate Future Is Fragile
The Strong Trend In The 18-Month-Out US Interest Rate Future Is Fragile
Chart 2The Strong Trend In The 3 Year T-Bond Is Fragile
The Strong Trend In The 3 Year T-Bond Is Fragile
The Strong Trend In The 3 Year T-Bond Is Fragile
Chart 3AUD/KRW Is Vulnerable To Reversal
AUD/KRW Is Vulnerable To Reversal
AUD/KRW Is Vulnerable To Reversal
Chart 4Canada Versus Japan Is Reversing
Canada Versus Japan Is Reversing
Canada Versus Japan Is Reversing
Chart 5Canada's TSX-60's Outperformance Might Be Over
Canada's TSX-60's Outperformance Might Be Over
Canada's TSX-60's Outperformance Might Be Over
Chart 6US Healthcare Providers Vs. Software At Risk of Reversal
US Healthcare Providers Vs. Software At Risk of Reversal
US Healthcare Providers Vs. Software At Risk of Reversal
Chart 7A Potential Switching Point From Tobacco Into Cannabis
A Potential Switching Point From Tobacco Into Cannabis
A Potential Switching Point From Tobacco Into Cannabis
Chart 8Biotech Is A Major Buy
Biotech Is A Major Buy
Biotech Is A Major Buy
Chart 9CAD/SEK Reversal Has Started
CAD/SEK Reversal Has Started
CAD/SEK Reversal Has Started
Chart 10Financials Versus Industrials To Reverse
Financials Versus Industrials To Reverse
Financials Versus Industrials To Reverse
Chart 11Norway's Outperformance Could End
Norway's Outperformance Could End
Norway's Outperformance Could End
Chart 12Greece's Brief Outperformance To End
Greece's Brief Outperformance To End
Greece's Brief Outperformance To End
Chart 13BRL/NZD At A Resistance Point
BRL/NZD At A Resistance Point
BRL/NZD At A Resistance Point
Chart 14The Outperformance Of Resources Versus Healthcare Is Vulnerable To Reversal
The Outperformance Of Resources Versus Healthcare Is Vulnerable To Reversal
The Outperformance Of Resources Versus Healthcare Is Vulnerable To Reversal
Chart 15The Outperformance Of Resources Versus Biotech Has Started To Reverse
The Outperformance Of Resources Versus Biotech Has Started To Reverse
The Outperformance Of Resources Versus Biotech Has Started To Reverse
Chart 16Cotton's Outperformance Is Vulnerable To Reversal
Cotton's Outperformance Is Vulnerable To Reversal
Cotton's Outperformance Is Vulnerable To Reversal
Chart 17US Homebuilders' Underperformance Has Reached A Potential Turning Point
US Homebuilders' Underperformance Has Reached A Potential Turning Point
US Homebuilders' Underperformance Has Reached A Potential Turning Point
Chart 18Switzerland's Outperformance Vs. Germany Has Started To End
Switzerland's Outperformance Vs. Germany Has Started To End
Switzerland's Outperformance Vs. Germany Has Started To End
Chart 19The Rally In USD/EUR Could End
The Rally In USD/EUR Could End
The Rally In USD/EUR Could End
Chart 20The Outperformance Of MSCI Hong Kong Versus China Is Vulnerable To Reversal
The Outperformance Of MSCI Hong Kong Versus China Is Vulnerable To Reversal
The Outperformance Of MSCI Hong Kong Versus China Is Vulnerable To Reversal
Chart 21A Potential New Entry Point Into Petcare
A Potential New Entry Point Into Petcare
A Potential New Entry Point Into Petcare
Chart 22FTSE100 Outperformance Vs. Euro Stoxx 50 Vulnerable To Reversal
FTSE100 Outperformance Vs. Euro Stoxx 50 Vulnerable To Reversal
FTSE100 Outperformance Vs. Euro Stoxx 50 Vulnerable To Reversal
Chart 23Netherlands Underperformance Vs. Switzerland Close To Exhaustion
Netherlands Underperformance Vs. Switzerland Close To Exhaustion
Netherlands Underperformance Vs. Switzerland Close To Exhaustion
Dhaval Joshi Chief Strategist dhaval@bcaresearch.com Fractal Trading System Fractal Trades
Central Bank ‘Railway Timetables’ Are Dragging Us Into Recession
Central Bank ‘Railway Timetables’ Are Dragging Us Into Recession
Central Bank ‘Railway Timetables’ Are Dragging Us Into Recession
Central Bank ‘Railway Timetables’ Are Dragging Us Into Recession
6-Month Recommendations Structural Recommendations Closed Fractal Trades Indicators To Watch - Bond Yields Chart II-1Indicators To Watch - Bond Yields - Euro Area
Indicators To Watch - Bond Yields - Euro Area
Indicators To Watch - Bond Yields - Euro Area
Chart II-2Indicators To Watch - Bond Yields - Europe Ex Euro Area
Indicators To Watch - Bond Yields - Europe Ex Euro Area
Indicators To Watch - Bond Yields - Europe Ex Euro Area
Chart II-3Indicators To Watch - Bond Yields - Asia
Indicators To Watch - Bond Yields - Asia
Indicators To Watch - Bond Yields - Asia
Chart II-4Indicators To Watch - Bond Yields - Other Developed
Indicators To Watch - Bond Yields - Other Developed
Indicators To Watch - Bond Yields - Other Developed
Indicators To Watch - Interest Rate Expectations Chart II-5Indicators To Watch - Interest Rate Expectations
Indicators To Watch - Interest Rate Expectations
Indicators To Watch - Interest Rate Expectations
Chart II-6Indicators To Watch - Interest Rate Expectations
Indicators To Watch - Interest Rate Expectations
Indicators To Watch - Interest Rate Expectations
Chart II-7Indicators To Watch - Interest Rate Expectations
Indicators To Watch - Interest Rate Expectations
Indicators To Watch - Interest Rate Expectations
Chart II-8Indicators To Watch - Interest Rate Expectations
Indicators To Watch - Interest Rate Expectations
Indicators To Watch - Interest Rate Expectations
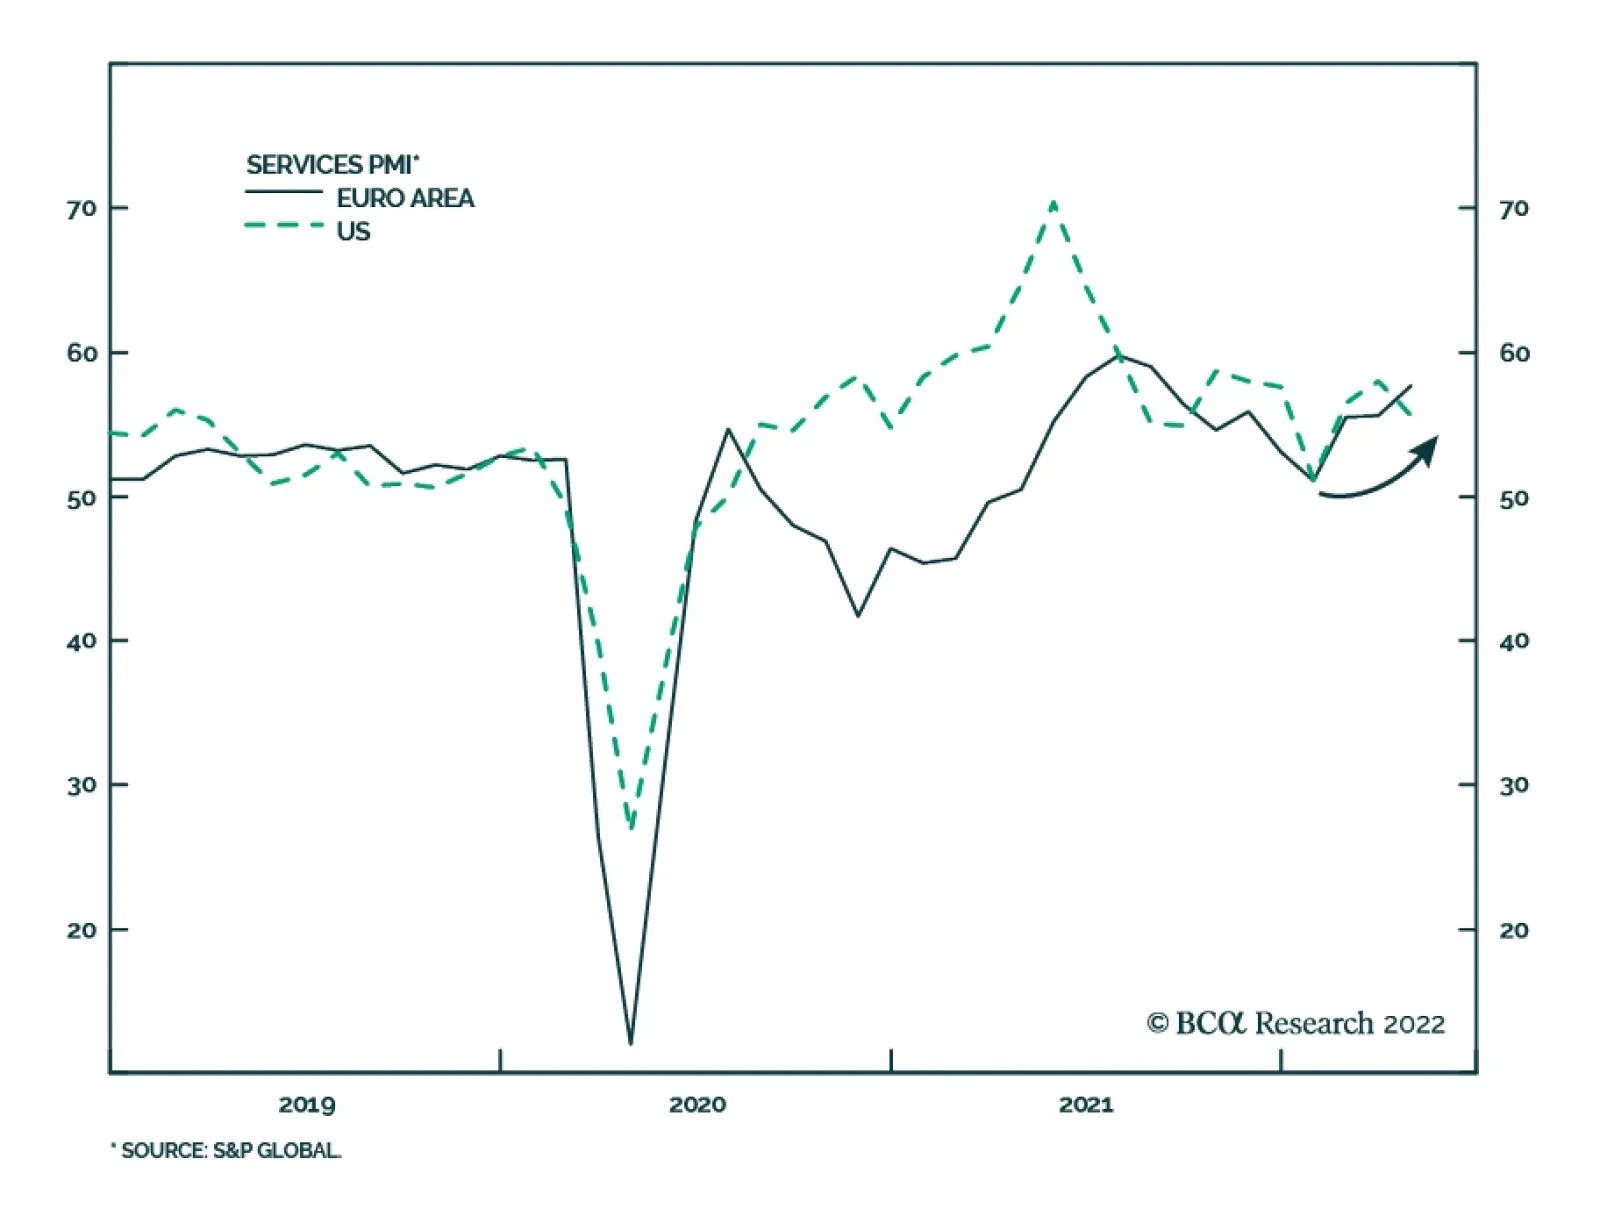
April services PMIs generally testify to the ongoing consumption pivot from goods to services. The S&P Global Eurozone Services PMI rose to 57.7 in April from 55.6 in the prior month, marking the strongest growth in Eurozone services activity since…
Executive Summary A True Bond Bear Market, USD-Hedged Or Unhedged
A True Bond Bear Market, USD-Hedged Or Unhedged
A True Bond Bear Market, USD-Hedged Or Unhedged
The US dollar has appreciated in 2022, most notably against the euro and Japanese yen. The rally has been more muted against the currencies of major US trading partners like the Canadian dollar and Chinese yuan. The dollar strength to date has had minimal impact on US inflation and will not force any adjustment in the Fed’s hawkish path on interest rates. The weakness of the euro and yen versus the USD will not turn the ECB or Bank of Japan more hawkish, given the lack of visible pass-through from currency depreciation to domestic inflation in Europe and Japan. The two largest owners of US Treasuries, China and Japan, have not increased Treasury purchases in response to higher US yields and a firmer US dollar. Geopolitical tensions and a desire to diversify out of US assets will continue to limit China buying of US Treasuries. Even higher US yields will be needed to compensate Japanese investors for higher bond and currency volatility at a time when the cost to hedge USD exposure is high and rising. Bottom Line: An appreciating US dollar is not yet a reason to expect a peak in US inflation or Treasury yields, or a change in ECB/BoJ policy. Maintain a neutral global duration stance and continue to underweight US Treasuries versus German Bunds and JGBs. Feature The strengthening US dollar (USD) has gotten the attention of investors, with the DXY index up +8.1% since the start of 2022 and threatening a major breakout from the range that has prevailed since 2016 (Chart 1). There have been notable moves in the major currencies that are in the DXY index, especially the euro (EUR) and Japanese yen (JPY). EUR/USD now sits at 1.05 and is threatening a move towards the parity level last seen in 2002. USD/JPY has seen a stunningly rapid increase to the current 130 level, rising 15 big figures in just two months. On a broader basis, the USD rally has been less impressive. The Federal Reserve’s nominal broad trade-weighted dollar index is up a more modest +3.7% year-to-date (Chart 2). Currencies of the major US trading partners have seen less impressive moves versus the dollar compared to the euro and yen. The Canadian dollar is down -1.9%, while the Mexican peso is flat, versus the dollar so far in 2022. Even the tightly managed Chinese currency (CNY) has belatedly joined the depreciation party, with USD/CNY up +4% since mid-April. Chart 1USD Breaking Out Against The Majors
USD Breaking Out Against The Majors
USD Breaking Out Against The Majors
Chart 2Smaller FX Moves From The Larger US Trade Partners
Smaller FX Moves From The Larger US Trade Partners
Smaller FX Moves From The Larger US Trade Partners
For bond markets, the move towards a stronger US dollar is relevant if a) it is sustainable; b) it helps cool off the overheating US economy; and c) it induces capital flows into US Treasuries. On all three counts, the current bout of dollar strength has not been enough to reverse the upward trajectory of US Treasury yields, in absolute terms and relative to government bonds in Europe and Japan. Multiple Drivers Of The USD Rally First and foremost, the latest appreciation of the USD has been about rising US interest rate expectations. The Fed’s increasingly hawkish rhetoric in response to surging inflation has forced a sharp upward adjustment of both the near-term and medium-term path for US bond yields. This has been most evident in the real yield component of yields, with the yield on the 10-year inflation-protected TIPS now in positive territory at +0.15% - a big increase from the -0.5 to -1% range that has prevailed during the past two years of the COVID pandemic. Related Report Global Fixed Income StrategyWe’re All Yield Chasers Now The momentum of the USD rally, with a +13.6% year-over-year gain in the DXY index, has been robust compared to the outright level of US bond yield spreads versus the major developed markets, especially after adjusting for realized inflation differentials (Chart 3). This reflects other USD-bullish factors beyond US interest rate expectations. The US dollar typically behaves as a defensive currency, appreciating during periods of slowing global growth and/or rising investor risk aversion. Both are happening at the same time right now, boosting the safe haven appeal of the US dollar. Global growth expectations are depressed, with the ZEW survey of investment professionals back down to the pandemic lows of 2020 (Chart 4, top panel).1 Worries about slowing growth and high inflation, and the rapid tightening of global monetary policies needed to combat that inflation, are also weighing on investor confidence. US equity market volatility has picked up and investors are paying up to protect their portfolios via options - the VIX index is back above 30 and the CBOE put/call ratio is at a two-year high (middle panel). Chart 3A Big USD Rally Fueled By Wider Real Yield Differentials
A Big USD Rally Fueled By Wider Real Yield Differentials
A Big USD Rally Fueled By Wider Real Yield Differentials
Chart 4Slowing Global Growth & Rising Risk Aversion Weighing On USD
Slowing Global Growth & Rising Risk Aversion Weighing On USD
Slowing Global Growth & Rising Risk Aversion Weighing On USD
This “perfect storm” of USD-bullish factors – rising US interest rate expectations, slowing global growth expectations and increased investor nervousness – has pushed to USD to a level that now appears stretched. BCA Research’s US Dollar Composite Technical Indicator, which combines measures of breadth, momentum, sentiment and trader positioning, is now at an overbought extreme that has heralded past US dollar reversals (bottom panel). Bottom Line: The rising US dollar now discounts a lot of Fed tightening, growth pessimism and investor fear. Conditions for a reversal are in place if any of those USD-bullish factors lose influence, most notably Fed expectations. USD Strength Does Not Impact The Outlook For The Fed, ECB Or BoJ Chart 5A True Bond Bear Market, USD-Hedged Or Unhedged
A True Bond Bear Market, USD-Hedged Or Unhedged
A True Bond Bear Market, USD-Hedged Or Unhedged
USD strength has made life even more difficult of bond investors, at a time when returns across the fixed income universe have suffered because of the duration-related losses from rising bond yields. The Bloomberg Global Treasury index is down -12.2% so far in 2022, and down -18% from the 2020 peak, on a currency-unhedged basis (Chart 5). The returns are not much better this year on a USD-hedged basis, down -6.8% since the start of the year. The latter is suffering from both duration losses and the rising cost to hedge the US dollar. An investor hedging USD exposure into JPY must pay an annualized 165bps (using 3-month currency forwards), while hedging USD exposure into EUR costs 200bps. Those hedging costs primarily reflect higher US interest rate expectations versus Europe and Japan. They will only come down when markets believe that the Fed will stop raising interest rates and begin to easy policy. It is not clear that the current bout of USD strength, on its own, is enough to change the Fed’s plans. Typically, a substantially stronger US dollar would lead the Fed along a less hawkish path, as it would act to slow imported inflation pressures. However, this is not a typical Fed cycle with US headline CPI inflation at a 41-year high of 8.5%. A huge part of that US inflation overshoot is due to global supply squeezes that have impacted the prices of traded goods and commodities. On a rate-of-change basis, the appreciating US dollar is coinciding with some slowing of commodity price momentum, but less so for goods prices. The index of world export prices compiled by the CPB Research Bureau in the Netherlands is up +12.2% on a year-over-year basis, a rapid pace that typically exists during periods of US dollar depreciation (Chart 6, top panel). The annual growth of the CRB commodity index is +17.2%, down from the peak of +54.4% in June 2021, and has roughly tracked the acceleration of the US dollar (middle panel). Yet even with the moderation of commodity inflation, the US dollar strength seen to date has not been enough to slow overshooting global goods price inflation – a necessary condition for central banks like the Fed to turn less hawkish (bottom panel). We do expect global goods price inflation to moderate over the rest of 2022, especially in the US, as post-pandemic consumer spending patterns shift away from goods back towards services. This will be a demand-related story, however, not a USD-strength-related story. Until there is more decisive evidence that goods inflation is slowing meaningfully, the Fed will be forced to deliver on its latest hawkish rhetoric. This includes shifting to a path of hiking rates by 50bps per meeting and moving towards a faster reduction of the Fed’s balance sheet. Right now, there is not much evidence suggesting that the stronger dollar should derail that trajectory (Chart 7): Chart 6USD Strength Not Helping To Slow Global Inflation
USD Strength Not Helping To Slow Global Inflation
USD Strength Not Helping To Slow Global Inflation
Chart 7The Fed Will Remain Hawkish, Despite A Firmer USD
The Fed Will Remain Hawkish, Despite A Firmer USD
The Fed Will Remain Hawkish, Despite A Firmer USD
Non-oil import prices are expanding at a +7.5% pace and accelerating in the face of a firmer US dollar that would normally coincide with slowing import price growth (top panel) The overall level of US financial conditions – which includes not only the currency but other variables like equity prices and corporate bond yields - remains stimulative, both in absolute terms and relative to the level of the trade-weighted US dollar (middle panel). One area of concern is the widening US trade deficit, now nearly -5% of GDP in nominal terms (bottom panel). That wider deficit is primarily related to the combination of strong import demand (and soaring import prices) and soft export demand given slowing global growth. A stronger US dollar does not help reverse either of those trends. However, it is difficult for the Fed to isolate the impact of the currency on the trade deficit given the other non-currency-related factors weighing on US export and import demand (i.e. weaker exports because of the Ukraine war and China COVID lockdowns). In sum, the US dollar strength seen so far does not change our expectations on the path of US inflation, and the pace of Fed tightening, over the next 6-12 months. We still see the Fed delivering multiple rate hikes, but less than the 298bps discounted in the US overnight index swap (OIS) curve over the next year. Conversely, the weakness of the euro and yen versus the US dollar does not change our outlook for the ECB and Bank of Japan. We see both central banks not delivering anything close to the rate hikes discounted in OIS curves. Chart 8Not Much Inflation From A Weaker Euro & Yen
Not Much Inflation From A Weaker Euro & Yen
Not Much Inflation From A Weaker Euro & Yen
On a trade-weighted basis, the euro is only down -5% over the past year - a modest move in comparison to soaring euro area inflation, which hit +7.5% on a headline basis and +3.5% on a core basis in April (Chart 8, middle panel). The ECB is under pressure to end its asset purchases very quickly and begin raising rates, but the euro does not appear to be a reason to accelerate the ECB’s timetable. In Japan, the very rapid weakening of the yen has generated shockingly little inflation, especially in the current environment of strong global goods/commodities inflation. The trade-weighted yen is down -12.7% on a year-over-year basis, yet Japan’s “core-core” CPI index that excludes food and energy prices remains in deflation hitting -0.7% in March – a move exaggerated by plunging mobile phone prices, but still very weak compared to the path of the yen and global goods prices. OIS curves are currently discounting 183bps of ECB rate hikes and 9bps of Bank of Japan rate hikes over the next year. We recommend fading that pricing by staying overweight core Europe and Japan in global bond portfolios, especially versus the US where the Fed is far more likely to follow through on discounted rate hikes. Bottom Line: The dollar strength to date has had minimal impact on US inflation and will not force any adjustment in the Fed’s hawkish path on interest rates. At the same time, the weakness of the euro and yen versus the USD will not turn the ECB or Bank of Japan more hawkish, given the lack of visible pass-through from currency depreciation to domestic inflation in Europe and Japan. Can Foreign Investors Replace Fed Treasury Buying? Chart 9UST Demand Shifting To More Price-Sensitive Buyers
UST Demand Shifting To More Price-Sensitive Buyers
UST Demand Shifting To More Price-Sensitive Buyers
For bond investors, the role of non-US demand for US Treasuries has always been a source of mystery that is often used to explain yield movements. Rumors of flows from major emerging market currency reserve managers or large Asian pension funds has often been used to justify a bullish or bearish view on Treasuries – even when hard data that could prove the existence of such flows is published with long lags that make it useless for timely analysis. The impact of potential foreign bond buying on US Treasury yields has been less influential over the past couple of years. Fed buying via quantitative easing (QE) has swamped all other sources of demand for Treasuries. With the Fed now in a rate hiking cycle that will also lead to a rapid start of quantitative tightening (QT) this summer, the question of who will replace the Fed’s demand for US Treasuries becomes once again relevant for the future path of US bond yields beyond the expected path of the fed funds rate. Already, there has been an adjustment in the term premium for longer-term US Treasury yields – the component of bond yield valuation that would be most impacted by large flows - as the Fed has slowed its pace of bond buying (Chart 9). The New York Fed’s estimates of the term premium on the 10-year Treasury yield reached deeply depressed levels – around -100bps - at the peak of the Fed’s pandemic QE program in 2020. As the US economy has recovered from the 2020 COVID recession, US interest rate expectations have increased but so have estimates of the term premium, which are now back to zero or even slightly positive. The Fed’s QE bond buying has been purely volume driven, with the size and timing of the purchases announced well in advance. The Fed is often called a “price insensitive” buyer since its buying is done without any consideration of yield levels. Other Treasury investors, including foreign buyers, are more price sensitive, with demand influenced by the level of yields. According to the TIC database on US capital flows produced by the US Treasury Department, net foreign buying of Treasuries has picked up, totaling +$346 billion over the 12 months to the most recently available data from February 2022 (Chart 10). That increase has entirely come from private investors, as so-called “official” flows have been flat. Chart 10China Remains On A UST Buyer's Strike
China Remains On A UST Buyer's Strike
China Remains On A UST Buyer's Strike
Chart 11European Buying Of USTs Set To Peak?
European Buying Of USTs Set To Peak?
European Buying Of USTs Set To Peak?
The latter is a continuation of the trend seen over the past few years where China, the nation with the second largest holdings of US Treasuries, has stopped buying them. This is a decision rooted in both geopolitics and economics. Smaller trade surpluses mean China has fewer new currency reserves to invest, while worsening Sino-US tensions have led Chinese authorities to diversify existing reserve holdings away from US Treasuries into gold and other assets. Looking ahead, China is unlikely to significantly ramp up its Treasury purchases despite more attractive US yields and Chinese policymakers tolerating some mild currency weakness versus the US dollar. Beyond China, demand for Treasuries from Europe and Japan has picked up but remains moderate by historical standards. For European investors, there has been a major swing in the TIC data, moving from a net outflow (on a 12-month running total basis) of -$194 billion in December 2020 to a net inflow of +$24 billion in February 2022 (Chart 11, top panel). Typically, net inflows into Treasuries are linked to the FX-hedged spread between US and German government debt. Specifically, when the hedged 10-year Treasury-Bund spread widens to a level between 100-150bps, the flows from Europe into Treasuries begin to improve (middle panel) When that hedged spread narrows to zero or lower, the flows turn the other way and European demand for Treasuries begins to wane. That is typically followed by a widening of the unhedged Treasury-Bund spread (bottom panel). With the current FX-hedged Treasury-Bund spread now at zero, a result of the high cost of hedging US dollars into euros given elevated US rate expectations, we expect European demand for Treasuries to diminish over the rest of 2022. This will help support a wider Treasury-Bund spread as the Fed delivers far more rate hikes than the ECB. For Japan, the largest holder of Treasuries, there has only been a stabilization of outflows over the 12 months to February 2022 (Chart 12, top panel). Past periods of large net inflows from Japan into US Treasuries have occurred when the hedged 10-year US Treasury-JGB spread has approached 200bps (middle panel). With the current spread at only 112bps, Japanese investor demand for Treasuries is unlikely to return without a significant increase in US yields. Chart 12UST Yields Not Attractive Enough To Induce More Japanese Demand
UST Yields Not Attractive Enough To Induce More Japanese Demand
UST Yields Not Attractive Enough To Induce More Japanese Demand
Chart 13Foreign Bond Investing Is Too Volatile For Japanese Investors Right Now
Foreign Bond Investing Is Too Volatile For Japanese Investors Right Now
Foreign Bond Investing Is Too Volatile For Japanese Investors Right Now
More timely weekly capital flow data from Japan shows that Japanese investors have been reluctant to move money into foreign bonds (Chart 13). Elevated levels of bond/rate volatility, and currency volatility given the huge rally in USD/JPY, have made large Japanese bond investors more cautious on increasing foreign bond allocations, even on a currency-hedged basis. If bond/FX volatility subsides, Japanese investors will become “better buyers” of foreign bonds once again. However, Japanese investors may opt to increase allocations to European bonds rather than US Treasuries, with European yields at comparable levels to US Treasuries in JPY-hedged terms (Tables 1-4). For example, a 30-year German Bund hedged into yen now yields 1.46%, compared to a JPY-hedged 30-year US Treasury yield of 1.33%. Table 12-Year Developed Market Government Bond Yields, Hedged Into USD, EUR & JPY
Recent USD Strength Is Not Bond Bullish
Recent USD Strength Is Not Bond Bullish
Table 25-Year Developed Market Government Bond Yields, Hedged Into USD, EUR & JPY
Recent USD Strength Is Not Bond Bullish
Recent USD Strength Is Not Bond Bullish
Table 310-Year Developed Market Government Bond Yields, Hedged Into USD, EUR & JPY
Recent USD Strength Is Not Bond Bullish
Recent USD Strength Is Not Bond Bullish
Table 430-Year Developed Market Government Bond Yields, Hedged Into USD, EUR & JPY
Recent USD Strength Is Not Bond Bullish
Recent USD Strength Is Not Bond Bullish
Bottom Line: Foreign demand for US Treasuries is unlikely to accelerate enough to replace diminished Fed QE purchases over the next 6-12 months, given high USD-hedging costs and elevated Treasury yield volatility. Non-US investors will not help bring an end to the US bond bear market. Robert Robis, CFA Chief Fixed Income Strategist rrobis@bcaresearch.com Footnotes 1 The Global ZEW expectations series shown in Chart 4 is an equal-weighted average of the individual expectations series for the US and euro area. GFIS Model Bond Portfolio Recommended Positioning Active Duration Contribution: GFIS Recommended Portfolio Vs. Custom Performance Benchmark
Recent USD Strength Is Not Bond Bullish
Recent USD Strength Is Not Bond Bullish
The GFIS Recommended Portfolio Vs. The Custom Benchmark Index Global Fixed Income - Strategic Recommendations* Cyclical Recommendations (6-18 Months)
Recent USD Strength Is Not Bond Bullish
Recent USD Strength Is Not Bond Bullish
Tactical Overlay Trades
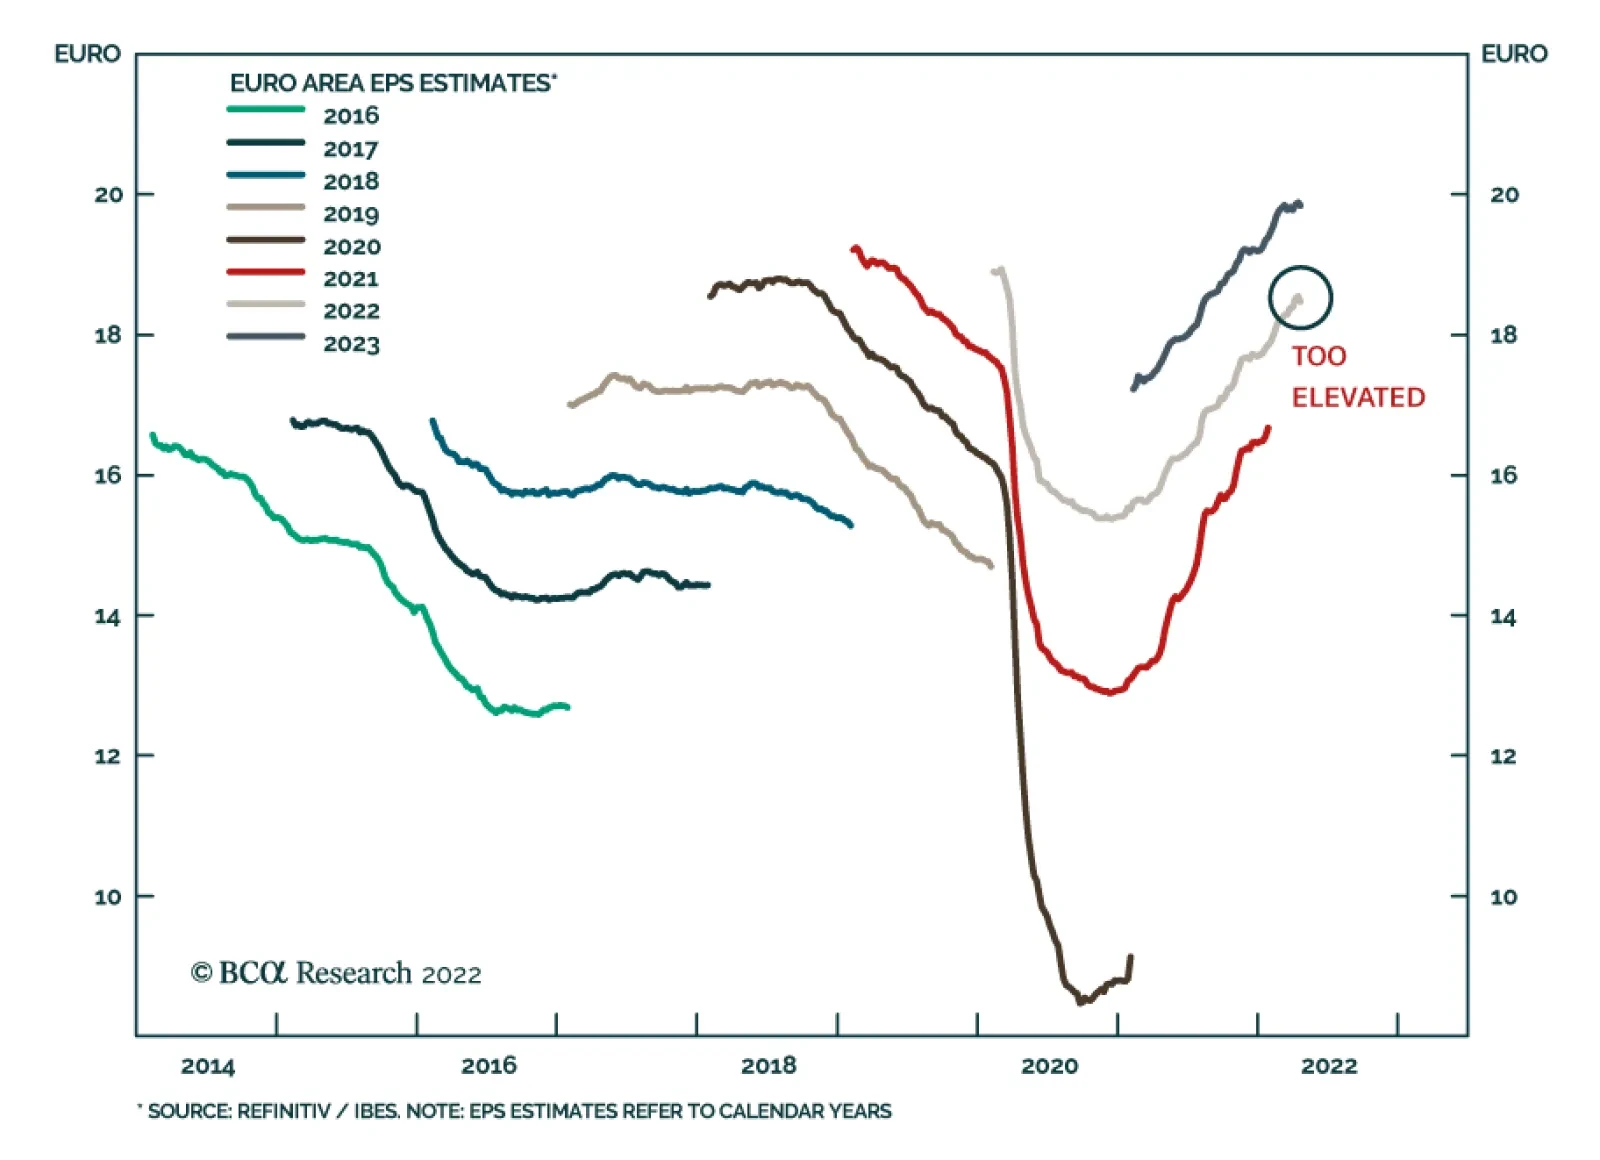
According to BCA Research’s European Investment Strategy service, three major problems indicate that the current European earnings estimates for 2022 are too optimistic: namely, China’s economic slowdown, a global economic deterioration, and the supply-driven…
Executive Summary Three Problems For European EPS
Three Problems For European EPS
Three Problems For European EPS
The Chinese economic slowdown in response to COVID lockdowns represents a major headwind for European profits in 2022. Weaker global growth creates another hurdle. The energy crisis is the third major problem for European profit growth this year. European profits must be revised downward for 2022, but the impact on 2023 EPS will be small. Cyclical sectors are particularly exposed to these three headwinds, which will hurt profitability this year. The recent relative strength in industrials and materials earnings is likely to buckle in response to weaker global growth, while the defensive characteristics of healthcare and communication services will shine. Within defensive sectors, favor healthcare and communication services versus utilities and consumer staples. Bottom Line: A downward revision of European profits will constrain the ability of European equities to rally in the coming quarters; however, it does not portend another major down leg in European stocks. Nonetheless, the downward revision still points to further underperformance of cyclical equities. Within the defensive sectors, healthcare and communication services are more appealing than utilities and consumer staples shares. The earnings season has begun. According to the MSCI index, Eurozone profit margins are at a 14-year high following a sharp rebound in profits after the pandemic-induced collapse of 2020. Faced with a war in Ukraine and surging inflation, investors worry that this robust profit picture will not last. We share these worries. The near-term outlook for European profits has deteriorated significantly. While the inflation surge amplified by the Ukrainian crisis is an important problem for European firms, it is not the only one. European businesses must also cope with the effect of a growth slowdown in the US goods sector. Moreover, Chinese growth is likely to plunge in response to the tightening lockdowns across the country. As a result, we fear that current earnings estimates for 2022 are too optimistic. Nonetheless, European stocks are unlikely to collapse further. The valuation cushion amassed during the first quarter market shake-out already embeds some downside for 2022 earnings. Additionally, 2023 earnings have much more limited downside than this year’s EPS. Three Problems For European EPS Chart 1European Earnings Profile
European Earnings Profile
European Earnings Profile
Three major problems indicate that the current European earnings estimates for 2022 are too optimistic: namely, China’s economic slowdown, a global economic deterioration, and the consequences of the Ukrainian war on the European economy (Chart 1). China’s Slowdown This publication has regularly highlighted that, even if the Chinese credit impulse is already trying to bottom, the lagged effect of the previous slowdown in credit flows would continue to hurt European growth in the first half of 2022. China’s COVID outbreak and Beijing’s severe policy response only accentuate this headwind. European profits are even more sensitive to Chinese economic fluctuation than European economic activity, which points to a meaningful drag on profitability. Many relationships highlight our concerns: So far, the weakness in the Chinese credit impulse is still consistent with a rapid deterioration of forward earnings growth and could lead to a contraction in forward EPS (Chart 2, top panel). The Chinese new orders index is falling rapidly. The elevated likelihood that China endures even more lockdowns in the coming months implies a sharper drop in orders and further weakness in European EPS (Chart 2, second panel). The CNY is depreciating again, which often coincides with a deflationary shock in global industrial goods that Europe produces. Unsurprisingly, a weaker RMB correlates well with narrowing operating profit margins in the Eurozone (Chart 2, bottom panel). Korean business conditions are deteriorating in response to the softening of the Chinese economy. A weaker RMB will further hurt business sentiment in the peninsula, especially if Chinese lockdowns broaden. The Korean economy is a key barometer of global business conditions because of its high cyclicality. BCA’s EM strategy team anticipates an additional softening in Korea, which portends weaker European profits and margins (Chart 3). Chart 2China's Troubles Trouble Europe Profits
China's Troubles Trouble Europe Profits
China's Troubles Trouble Europe Profits
Chart 3Listen to Korea
Listen to Korea
Listen to Korea
Global Economic Weakness The global growth weakness goes beyond China’s troubles. US economic activity is slowing down in response to higher yields, higher inflation, and the disappearance of pent-up demand following a splurge on goods by consumers during the pandemic. As a result, Q1 GDP growth fell to -1.4% from a quarterly annualized rate of 5.5% in Q4 2021. The weakness in the ISM New Orders-to-Inventory ratio points to continued softness through Q2. EM are not immune to these vulnerabilities either. EM consumers are suffering greatly from surging food and fuel costs. Moreover, EM interest rates continue to rise briskly and the ensuing liquidity removal points to fainter growth ahead. Chart 4The Weaker ISM NOI Is Worrisome
The Weaker ISM NOI Is Worrisome
The Weaker ISM NOI Is Worrisome
The impact of weaker global economic activity on European earnings is straightforward: A falling US ISM New Orders-To-Inventories ratio is a prelude both to slower earnings growth and to narrower profit margins in the Eurozone (Chart 4). Global exports growth has collapsed to 5.5% from more than 20% prior year and is likely to deteriorate further. Historically, weaker global shipments are associated with a slowdown in European forward earnings growth (Chart 4, third panel). Global economic surprises have rebounded this year, but, as we showed two weeks ago, they are likely to move back below zero in the near future. This is a noisy series, but negative surprises often prompt downward revisions to earnings estimates. The Energy Shock Europe is facing an exceptional energy shock that is hurting the region’s growth prospects. Now that Russia is curtailing gas shipments to Poland and Bulgaria, more energy disruptions are likely, which will further hamper domestic growth prospects across the region, while simultaneously elevating the cost of goods sold for firms. However, not all countries will be hit equally by a Russian energy embargo among the major economies. Germany and Italy have the most to lose, while France and the UK are the least at risk (Chart 5). The impact of an oil supply shock on European earnings is negative. When oil prices rise because of strong global aggregate demand, European earnings handle rising energy prices well because the increasing sales volume creates a powerful offset. However, our simple model that accounts for the evolution of oil demand and global policy uncertainty highlights that we do not face a demand shock, but rather a supply shock (Chart 6), which implies that most sectors will suffer from higher energy prices. Chart 5Varying Vulnerabilities To Russia’s Energy Showdown
The Three Forces Hurting European Earnings
The Three Forces Hurting European Earnings
Chart 6Oil's Rally Is Supply-Driven
Oil's Rally Is Supply-Driven
Oil's Rally Is Supply-Driven
Chart 7European Margins Under Pressure
European Margins Under Pressure
European Margins Under Pressure
The inflation passthrough from energy to everything else is not strong enough to protect profit margins. Yes, HICP is elevated, but European PPIs are rising much more rapidly. Historically, such an inability to pass on higher production costs results in slower European profits growth and contracting operating profit margins (Chart 7). The current weakness in consumer confidence and the expected drag on business confidence underscore that pricing power will likely deteriorate from here, which will accentuate the negative impact on profits from the current energy shock. Wage Costs: Not A Problem For Now Wage costs are the one bright spot for European profit margins. European negotiated wages are expanding at a very low rate of 1.6%. Unit labor costs are only expanding at 2.4%, a rate similar to last decade when European core inflation averaged 1%. Chart 8Wages Do Not Hurt Margins
Wages Do Not Hurt Margins
Wages Do Not Hurt Margins
Historically, rising wage rates correlate with rising profitability, not declining margins (Chart 8). This relationship seems paradoxical, but European wages only increase when global aggregate demand is very strong. Due to the degree of operating leverage of European equities, the impact of robust aggregate demand on revenues swamps the impact of accelerating wage growth on production costs. Hence, it will probably take a wage growth rate much higher than the experience of the past 20 years for salaries to start hurting margins. While this is possible, we are many quarters away from this risk becoming reality. Bottom Line: European forward earnings estimates for 2022 are far too elevated in view of the headwinds European businesses are currently facing. The combination of weaker Chinese economic activity, slowing global growth, and a supply-driven energy shock will force significant downward revisions to this year’s EPS. Related Report European Investment StrategyPlenty Of Risks For Cyclical Stocks 2023 EPS should fare better. Chinese authorities are increasingly supporting their economy and this stimulus will impact activity when the lockdowns end. This process will prompt a boom later this year. Global growth will recover once the energy shock recedes. Decelerating European PPI will also help profit margins recover. Following their severe decline in the first quarter, European equities have already embedded a significant valuation cushion to compensate for the transitory shock to earnings. European stocks will not be able to advance meaningfully while 2022 earnings estimates weaken, but they are unlikely to make new lows either. Three Problems For Cyclicals vs Defensives The same three factors that hurt the outlook for European profits for 2022 also confirm that cyclical equities should underperform defensives in the near term. China’s Slowdown Cyclicals are extremely sensitive to a Chinese economic slowdown: The past weakness in the Chinese credit impulse is consistent with a further downgrade of the profit expectations for European cyclicals stocks compared to that of their defensive peers (Chart 9). A deterioration in China’s PMI New Orders heralds a period of weakness in the earnings of cyclical equities. A weak Chinese yuan leads to poor relative earnings (Chart 9). The deterioration in Korean business confidence and the poor performance of Korean equities also leads to weakness in both the earnings and profit margins of cyclical equities relative to those of defensive stocks (Chart 9). Global Growth Weakness The earnings outlook for cyclical sectors relative to defensives is negatively affected by slowing global economic activity: A deterioration in global economic surprises often results in a period of anemic cyclicals’ earnings (Chart 10). The rapidly declining ISM New Orders-to-Inventories ratio is synonymous with underperforming cyclicals’ earnings as well as a contraction in their relative profit margins because of their heightened degree of operating leverage (Chart 10). Weaker global exports confirm the continued risks to cyclicals’ earnings. Chart 9China Is A Threat To Cyclical Equities
China Is A Threat To Cyclical Equities
China Is A Threat To Cyclical Equities
Chart 10Global Growth Threatens Cyclical Stocks
Global Growth Threatens Cyclical Stocks
Global Growth Threatens Cyclical Stocks
The Energy Shock There is no clear relationship between energy prices and the outlook for the profits of cyclical equities relative to those of defensive stocks. Nonetheless, we may deduce that, if elevated energy prices hurt aggregate profits, they will also hurt cyclical profits, since the latter exacerbate the fluctuation of the former. Moreover, Europe’s elevated stagflation risk is consistent with sagging profits for cyclicals relative to those of defensives, because cyclicals experience greater pain from deteriorating economic activity than the benefit they enjoy from higher inflation. Bottom Line: The problems faced by the Chinese economy as well as the risks to global growth are consistent with an underperformance of the profits of cyclical stocks compared to those of defensive equities. Moreover, while higher energy prices are not necessarily a problem for cyclical equities, the elevated perceived stagflation risk is consistent with downward revisions for the relative earnings of cyclicals. This picture indicates that cyclical equities are still vulnerable to some downside relative to the broad market in the near term. A Look at Individual Sectors Chart 11Sectoral Degrees Of Operating Leverage
The Three Forces Hurting European Earnings
The Three Forces Hurting European Earnings
We may distill the impact of China’s problems, the global economic slowdown, and the energy shock on sectoral earnings. A simple starting point is to look at their degree of operating leverage. Based on this observation, financials and consumer discretionary stocks are the sectors most at risk from weaker revenue growth, while utilities are the least exposed (Chart 11). A more complete picture may be gleaned from each sector’s pricing power. Energy Chart 12Improving Energy Margins
Improving Energy Margins
Improving Energy Margins
The energy sector enjoys a significant margin tailwind from the oil supply shock (Chart 12). Nonetheless, this boost is long in the tooth and a pullback is likely if Brent falls toward the $94/bbl level expected by BCA’s Commodity & Energy team in the second half of 2022, and $88/bbl level in 2023. Hence, it is likely that the near-term benefits for the energy sector’s profits are already fully discounted and that the sector could suffer a significant setback in the coming quarters. Industrials The pricing power of industrials (as approximated by the gap between CPI and PPI) is still strong, which creates a tailwind for relative earnings (Chart 13). However, this robustness is under threat in the current environment in which global industrial production, global trade, and global capital goods orders are decelerating (Chart 14). Hence, a period of downgrade for the earnings of industrials relative to the broad market is likely in the coming months. Chart 13Robust Pricing Power For Industrials...
Robust Pricing Power For Industrials...
Robust Pricing Power For Industrials...
Chart 14...But For How Long?
...But For How Long?
...But For How Long?
Financials Chart 15Financials Are Under Siege
Financials Are Under Siege
Financials Are Under Siege
The relative pricing power1 of financials is rapidly deteriorating, despite the recent increase in German yields (Chart 15). Moreover, it is likely to remain weak in a context in which core CPI has yet to decrease. Finally, the potential for a European recession in 2022, or at least, a severe growth slowdown, should lift non-performing loans. As a result, this sector’s earnings could experience a significant downgrade in the near term. Tech The sector’s pricing power was in an uptrend, but it has started to deteriorate in recent quarters (Chart 16). This evolution indicates that that tech earnings and profit margins are likely to suffer relative to the broad market, especially in light of the sector’s high degree of operating leverage. Consumer Discretionary Stocks This sector is suffering from a complete collapse of its pricing power (Chart 17). Additionally, tumbling consumer confidence in Europe and around the world is a significant drag on near-term sales. Consequently, earnings growth as well as profit margins are likely to lag the overall market. Chart 16Crucial Tech Tailwind Dwindling
Crucial Tech Tailwind Dwindling
Crucial Tech Tailwind Dwindling
Chart 17A Problem For Consumer Discretionary Stocks
A Problem For Consumer Discretionary Stocks
A Problem For Consumer Discretionary Stocks
Materials European materials sector’s profit margins stand at a 19-year high compared to that of the broad market. However, relative profit growth has collapsed. The bad news for the sector is that its pricing power is rapidly deteriorating because of surging input costs. It suggests that relative profit growth will become negative as relative profit margins contract (Chart 18). Utilities The pricing power of utilities is plunging because retail electricity prices are not rising as fast as input costs. The negative impact of this adverse pricing on profit margins is consequential (Chart 19). Governments around Europe are likely to continue to pressure this sector to limit the increase in electricity prices to households, which means that utilities are likely to lag other defensive sectors. Chart 18Materials' Outlook Deteriorating Materially
Materials' Outlook Deteriorating Materially
Materials' Outlook Deteriorating Materially
Chart 19Crunch Time For Utilities
Crunch Time For Utilities
Crunch Time For Utilities
Consumer Staples Chart 20Staples Under Duress
Staples Under Duress
Staples Under Duress
The consumer staples sector is facing a similar pricing power problem to that of consumer discretionary stocks: input costs are rising rapidly relative to selling prices (Chart 20). Nonetheless, the earnings of staples will prove more resilient than that of their discretionary counterparts because the staples’ sales volumes are less sensitive to both deteriorating global consumer confidence and falling household real incomes. However, consumer staples equities have already greatly outperformed consumer discretionary stocks. Thus, much of the good news in terms of relative earnings is well discounted and the additional outperformance will be limited. Healthcare Chart 21Healthcare Stocks Still Have Pricing Power
Healthcare Stocks Still Have Pricing Power
Healthcare Stocks Still Have Pricing Power
The pricing power of the healthcare sector remains positive, but it is not as strong as it was ten years ago. Hence, profits growth has scope to improve further compared to the rest of the market (Chart 21). Beyond favorable pricing power dynamics, the industry is insulated from weaker global growth relative to the rest of the broad market. Importantly, the healthcare sector sports one of the lowest degrees of operating leverage in Europe, which will also boost its relative profitability in the current environment. Healthcare is our top defensive sector right now, despite its valuation premium. Communication Services Chart 22Telecom Will Prove Resilient
Telecom Will Prove Resilient
Telecom Will Prove Resilient
The profit growth and profit margins of the European communication services sectors are already under duress because pricing power remains negative. Nonetheless, the contraction in relative growth rates of earnings is extended (Chart 22). Telecom revenues did not benefit from a boost when the economy rebounded after the economic contraction in 2020. This stability is now an asset because the sector will not struggle from slowing global economic activity. In this context, the cheap communication services sector remains an attractive defensive play in Europe. Bottom Line: Looking at sectors individually confirms that the outlook for profit growth is worse for cyclicals than it is for defensive stocks. The recent relative strength in industrials and materials earnings is likely to buckle in response to weaker global growth, while the defensive characteristics of healthcare and communication services will shine. Utilities are under stress, as they stand at the confluence of higher energy prices and the explicit desire of politicians to limit the impact of these higher energy costs on households. Favor healthcare and communication services versus utilities and consumer staples. Mathieu Savary, Chief European Strategist Mathieu@bcaresearch.com Footnotes 1 In the case of financials, we use core CPI as a proxy for the sector’s costs. Eurostat does not publish a PPI for the sector and the main costs are related to labor costs. Tactical Recommendations Cyclical Recommendations Structural Recommendations
Listen to a short summary of this report. Executive Summary Second Fastest Hiking Cycle Ever?
Monthly Portfolio Update: Can The Fed Achieve A Soft Landing? Hint: It Doesn’t Have A Good Track Record
Monthly Portfolio Update: Can The Fed Achieve A Soft Landing? Hint: It Doesn’t Have A Good Track Record
Can the Fed achieve a soft landing, bringing inflation back to its 2% target without causing growth to slow significantly below trend? It has managed this only once in the past (in 2004). Every other cycle triggered a recession or, at best, a fall in the PMI to below 50. Recession is not a certainty. A higher neutral rate than in the past – partly due to the build-up of household savings – means the economy may be unusually robust this time. But the risk is high. We recommend a neutral weighting in equities, with a tilt to more defensive positioning: Overweight the US, and a focus on quality and defensive growth sectors. China’s slowdown is particularly worrying. We expect the RMB to fall, which will put downward pressure on other Emerging Markets.
Monthly Portfolio Update: Can The Fed Achieve A Soft Landing? Hint: It Doesn’t Have A Good Track Record
Monthly Portfolio Update: Can The Fed Achieve A Soft Landing? Hint: It Doesn’t Have A Good Track Record
Bottom Line: Investors should maintain low-risk portfolio positioning until the outcome of the sharp tightening of financial conditions is clearer. Recommended Allocation
Monthly Portfolio Update: Can The Fed Achieve A Soft Landing? Hint: It Doesn’t Have A Good Track Record
Monthly Portfolio Update: Can The Fed Achieve A Soft Landing? Hint: It Doesn’t Have A Good Track Record
The key to the performance of financial markets over the next year is whether the Fed and other central banks can kill inflation without killing economic growth. This is not impossible. But the risk that aggressive tightening of monetary policy triggers a recession – or at best a sharp slowdown – is high. Investors should maintain relatively low-risk portfolio positioning. If the Fed raises rates in line with what the futures market is projecting – by 286 basis points over the next 12 months – it will be the second fastest tightening on record, after only the “full Volcker” of 1980-1981 (Chart 1). Other central banks, even in countries and regions with much weaker growth than the US, are predicted to tighten almost as aggressively (Table 1). At the same time, the Fed will start to run down its balance-sheet rapidly; we estimate its holdings of US Treasurys will fall by more than $1 trillion by end-2023 (Chart 2). What was the impact on the economy of previous Fed hiking cycles? It varied, but on only one occasion in the past 50 years (2004) was there neither a recession nor a fall of the Manufacturing ISM to below 50 in the two years or so following the first hike (Table 2).1 The ISM (and other global PMIs) falling to below 50 is important because that is typically the dividing line between equities outperforming bonds and vice versa (Chart 3). Chart 1Second Fastest Hiking Cycle Ever?
Monthly Portfolio Update: Can The Fed Achieve A Soft Landing? Hint: It Doesn’t Have A Good Track Record
Monthly Portfolio Update: Can The Fed Achieve A Soft Landing? Hint: It Doesn’t Have A Good Track Record
Table 1Futures Projected Interest Rate Hikes
Monthly Portfolio Update: Can The Fed Achieve A Soft Landing? Hint: It Doesn’t Have A Good Track Record
Monthly Portfolio Update: Can The Fed Achieve A Soft Landing? Hint: It Doesn’t Have A Good Track Record
Chart 2Fed Balance-Sheet Will Shrink Rapidly Too
Fed Balance-Sheet Will Shrink Rapidly Too
Fed Balance-Sheet Will Shrink Rapidly Too
Table 2What Happened To The Economy In Fed Hiking Cycles
Monthly Portfolio Update: Can The Fed Achieve A Soft Landing? Hint: It Doesn’t Have A Good Track Record
Monthly Portfolio Update: Can The Fed Achieve A Soft Landing? Hint: It Doesn’t Have A Good Track Record
Chart 3Will PMIs Fall Below 50?
Will PMIs Fall Below 50?
Will PMIs Fall Below 50?
A recent paper by Alex Domash and Larry Summers showed that, since 1955, when US inflation was above 4% and unemployment below 5%, there was a 73% probability of recession over the next four quarters, and 100% over the next eight quarters (Table 3). On each of the three occasions when inflation was above 5% and unemployment below 4% (as is the case now), recession followed within a year. How could the Fed avoid a hard landing? Inflation could come down quickly, which would allow the Fed to ease back on tightening. As consumption switches back to services from durables, and the supply side succeeds in increasing production, the price of manufactured goods could fall (Chart 4). There were signs of this happening already in March, when US durables prices fell by 0.9% month-on-month. The problem, however, is that because of rising energy costs and lockdowns in China, the supply-side response has been delayed. The fall in semiconductor and shipping costs, which we previously argued would happen this year, is not yet clearly coming through (Chart 5). There are also signs of a price-wage spiral, with US wages rising (with a lag) in line with prices (Chart 6). Table 3This Level of Inflation And Unemployment Usually Leads To Recession
Monthly Portfolio Update: Can The Fed Achieve A Soft Landing? Hint: It Doesn’t Have A Good Track Record
Monthly Portfolio Update: Can The Fed Achieve A Soft Landing? Hint: It Doesn’t Have A Good Track Record
Chart 4Can The Price Of Durables Now Fall?
Can The Price Of Durables Now Fall?
Can The Price Of Durables Now Fall?
Chart 5Supply-Side Recovery Delayed?
Supply-Side Recovery Delayed?
Supply-Side Recovery Delayed?
The economy could be more robust than in the past, leaving it unscathed by higher rates. Our model of the equilibrium level of short-term rates is 3.2%, well above the Fed’s estimate of 2.4% (Chart 7). Our colleague Peter Berezin has argued that the neutral rate could be as high as 4%.2 In particular, the $2 trillion-plus of excess US household savings (equal to 10% of GDP) could support consumption for some years even if real wage growth is negative (Chart 8). However, there are already signs that higher rates are hurting the housing market, the most interest-rate sensitive part of the economy. The average US 30-year fixed-rate mortgage rate has risen to 5.1% from 3.2% since the start of the year. This is negatively impacting home sales and mortgage applications (Chart 9). Moreover, even if the Fed can succeed in raising rates without killing the expansion, the markets – for a while – will worry that it cannot. Chart 6A Price-Wage Spiral?
A Price-Wage Spiral?
A Price-Wage Spiral?
Chart 7Rates Are Still A Long Way Below Neutral
Rates Are Still A Long Way Below Neutral
Rates Are Still A Long Way Below Neutral
Chart 8Excess Savings Could Support The Economy
Excess Savings Could Support The Economy
Excess Savings Could Support The Economy
Chart 9Higher Rates Already Impacting Home Sales
Higher Rates Already Impacting Home Sales
Higher Rates Already Impacting Home Sales
There are clear signs of a slowdown in the global economy. Europe may already be in recession, with sentiment indicators collapsing to recessionary levels (Chart 10). More esoteric indicators, which have historically signaled slowing growth ahead, such as the Swedish new orders/inventories ratio, are also flashing a warning signal (Chart 11). Global financial conditions have tightened at the fastest pace since 2008 (Chart 12). Corporate earnings forecasts have started to be revised down for the first time in this cycle (Chart 13). Chart 10Is Europe Already In Recession?
Is Europe Already In Recession?
Is Europe Already In Recession?
Chart 1111. Signs Of Trouble Ahead
11. Signs Of Trouble Ahead
11. Signs Of Trouble Ahead
Chart 12Financial Conditions Have Tightened Significantly
Financial Conditions Have Tightened Significantly
Financial Conditions Have Tightened Significantly
Chart 13Corporate Earnings Forecasts Being Revised Down
Corporate Earnings Forecasts Being Revised Down
Corporate Earnings Forecasts Being Revised Down
But what of the argument that investors have already turned ultra-pessimistic and that all the bad news is in the price? Global equities are down only 14% from their historic peak, barely in correction territory. It is true that sentiment (historically a contrarian indicator) is very poor, with twice as many respondents to the American Association of Individual Investors’ weekly survey expecting the stock market to fall over the next six months as expect it to rise (Chart 14). But, despite investor pessimism, there are few signs that investors have made their portfolios more defensive. The same AAII survey shows little decline in equity weightings, and no big shift into cash (Chart 15). Chart 14Investors Are Very Pessimistic...
Investors Are Very Pessimistic...
Investors Are Very Pessimistic...
Chart 15...But Haven't Moved More Defensive
...But Haven't Moved More Defensive
...But Haven't Moved More Defensive
Equities: The US is the best house on a tough street. Growth is likely to remain more robust than in the euro area or Japan. The US stock market has a lower beta (Chart 16). And, while the US is more expensive, valuations do not drive the 12-month relative performance of stocks and, anyway, the US premium valuation can be justified by higher ROE and the lower volatility of profits (Chart 17). Emerging markets continue to look vulnerable to the slowdown in China and tighter US financial conditions (Chart 18). We remain underweight. Chart 16US Stocks Are Lower Risk
US Stocks Are Lower Risk
US Stocks Are Lower Risk
Chart 17US Premium Valuation Is Justified
Monthly Portfolio Update: Can The Fed Achieve A Soft Landing? Hint: It Doesn’t Have A Good Track Record
Monthly Portfolio Update: Can The Fed Achieve A Soft Landing? Hint: It Doesn’t Have A Good Track Record
Chart 18Tightening Financial Conditions Are Bad For EM
Tightening Financial Conditions Are Bad For EM
Tightening Financial Conditions Are Bad For EM
Chart 19Consumer Staples Are Defensive
Consumer Staples Are Defensive
Consumer Staples Are Defensive
Chart 20IT Earnings Will Continue To Grow Strongly
IT Earnings Will Continue To Grow Strongly
IT Earnings Will Continue To Grow Strongly
Within sectors, our preference remains for quality and defensive growth. Consumer staples tend to outperform when PMIs are falling (Chart 19) and are supported by attractive dividend yields. Information Technology is a more controversial overweight, given that it is expensive and sensitive to rising rates. Nevertheless, investment in tech hardware and software is likely to continue, giving the sector strong structural earnings growth in coming years (Chart 20). Currencies: The dollar has risen by 7.3% year-to-date driven by interest-rate differentials and the Fed being expected to be more aggressive than other central banks. But we are only neutral, since the Fed will probably not raise rates by as much as the market is pricing in, and because the dollar looks very overvalued (Chart 21). We lower our recommendation on the Chinese yuan to underweight. Interest-rate differentials with the US clearly point to it falling further – also the outcome desired by the authorities to help bolster growth (Chart 22). The likely CNY weakness will put further downward pressure on other EM currencies, particularly in Asia, given their high correlation to the Chinese currency (Chart 23). Chart 21The Dollar Is Very Overvalued
The Dollar Is Very Overvalued
The Dollar Is Very Overvalued
Chart 22Rate Differentials Point To A Weaker RMB...
Rate Differentials Point To A Weaker RMB...
Rate Differentials Point To A Weaker RMB...
Chart 23...Which Is Bad News For Other EM Currencies
...Which Is Bad News For Other EM Currencies
...Which Is Bad News For Other EM Currencies
Fixed Income: With the 10-year US Treasury yield at 2.9% and that in Germany at 0.9%, there is a stronger argument for marginally raising weightings in government bonds. We are neutral on government bonds within the (underweight) fixed-income category. Remember, though, that real yields are still negative: -0.1% in the US and -2.1% in Germany. We do not expect long-term rates to rise much over the next 6-9 months, and so remain neutral on duration. The “golden rule of bond investing” says that government bond returns are driven by whether the central bank is more or less hawkish than expected over the next 12 months (Chart 24). We would expect the Fed to be slightly less hawkish than currently forecast. US high-yield bonds offer an attractive yield pick-up – as long as US growth does not collapse. In a way, HY bonds are like defensive equities, given their high correlation with equities but beta only one-third that of equities (Chart 25). Chart 24Will The Fed Be More Or Less Hawkish Than Expected?
Will The Fed Be More Or Less Hawkish Than Expected?
Will The Fed Be More Or Less Hawkish Than Expected?
Chart 25High Yield Bonds Are Like MinVol Equities
High Yield Bonds Are Like MinVol Equities
High Yield Bonds Are Like MinVol Equities
Chart 26Russian Oil Is Going Cheap
Russian Oil Is Going Cheap
Russian Oil Is Going Cheap
Commodities: Oil prices are likely to fall back to around $90 a barrel by year-end, as demand softens and increased supply (from Saudi Arabia, UAE, and North American shale, and maybe from Venezuela and Iran) enters the market. But the risk is to the upside if this extra supply does not emerge. In particular, possible bans on Russian oil and gas into the European Union (or Russia blocking sales) could disturb the market. It will take time for Russia’s 11 million b/d of oil production, which used to go mainly to Europe, to be rerouted to Asia. This is why the Urals benchmark is at a 30% discount to Brent (Chart 26). The long-term story for industrial commodities remains good, but there is downside risk – especially for iron ore and steel – from China’s slowdown (Chart 27). Gold is an obvious hedge against geopolitical risks and high inflation. But over the past 20 years, it has been negatively correlated to real interest rates and the US dollar, suggesting upside is capped. There is a chance, however, that the relationship between rates and gold breaks down, as it did in the 1970s and 1980s (Chart 28). We, therefore, remain neutral on gold, believing that a moderate holding is a good diversifier for portfolios. Chart 27Chinese Slowdown Is Negative For Commodities
Chinese Slowdown Is Negative For Commodities
Chinese Slowdown Is Negative For Commodities
Chart 28Will Gold Start To Behave As It Did Before 1990?
Will Gold Start To Behave As It Did Before 1990?
Will Gold Start To Behave As It Did Before 1990?
Garry Evans, Senior Vice President Global Asset Allocation garry@bcaresearch.com Footnotes 1 In 2015, the ISM was already below 50 when the Fed hiked in December. 2 Please see Global Investment Strategy Report, “Is A Higher Neutral Rate Good Or Bad For Stocks?” dated March 18, 2022. Recommended Asset Allocation Model Portfolio (USD Terms)