Europe
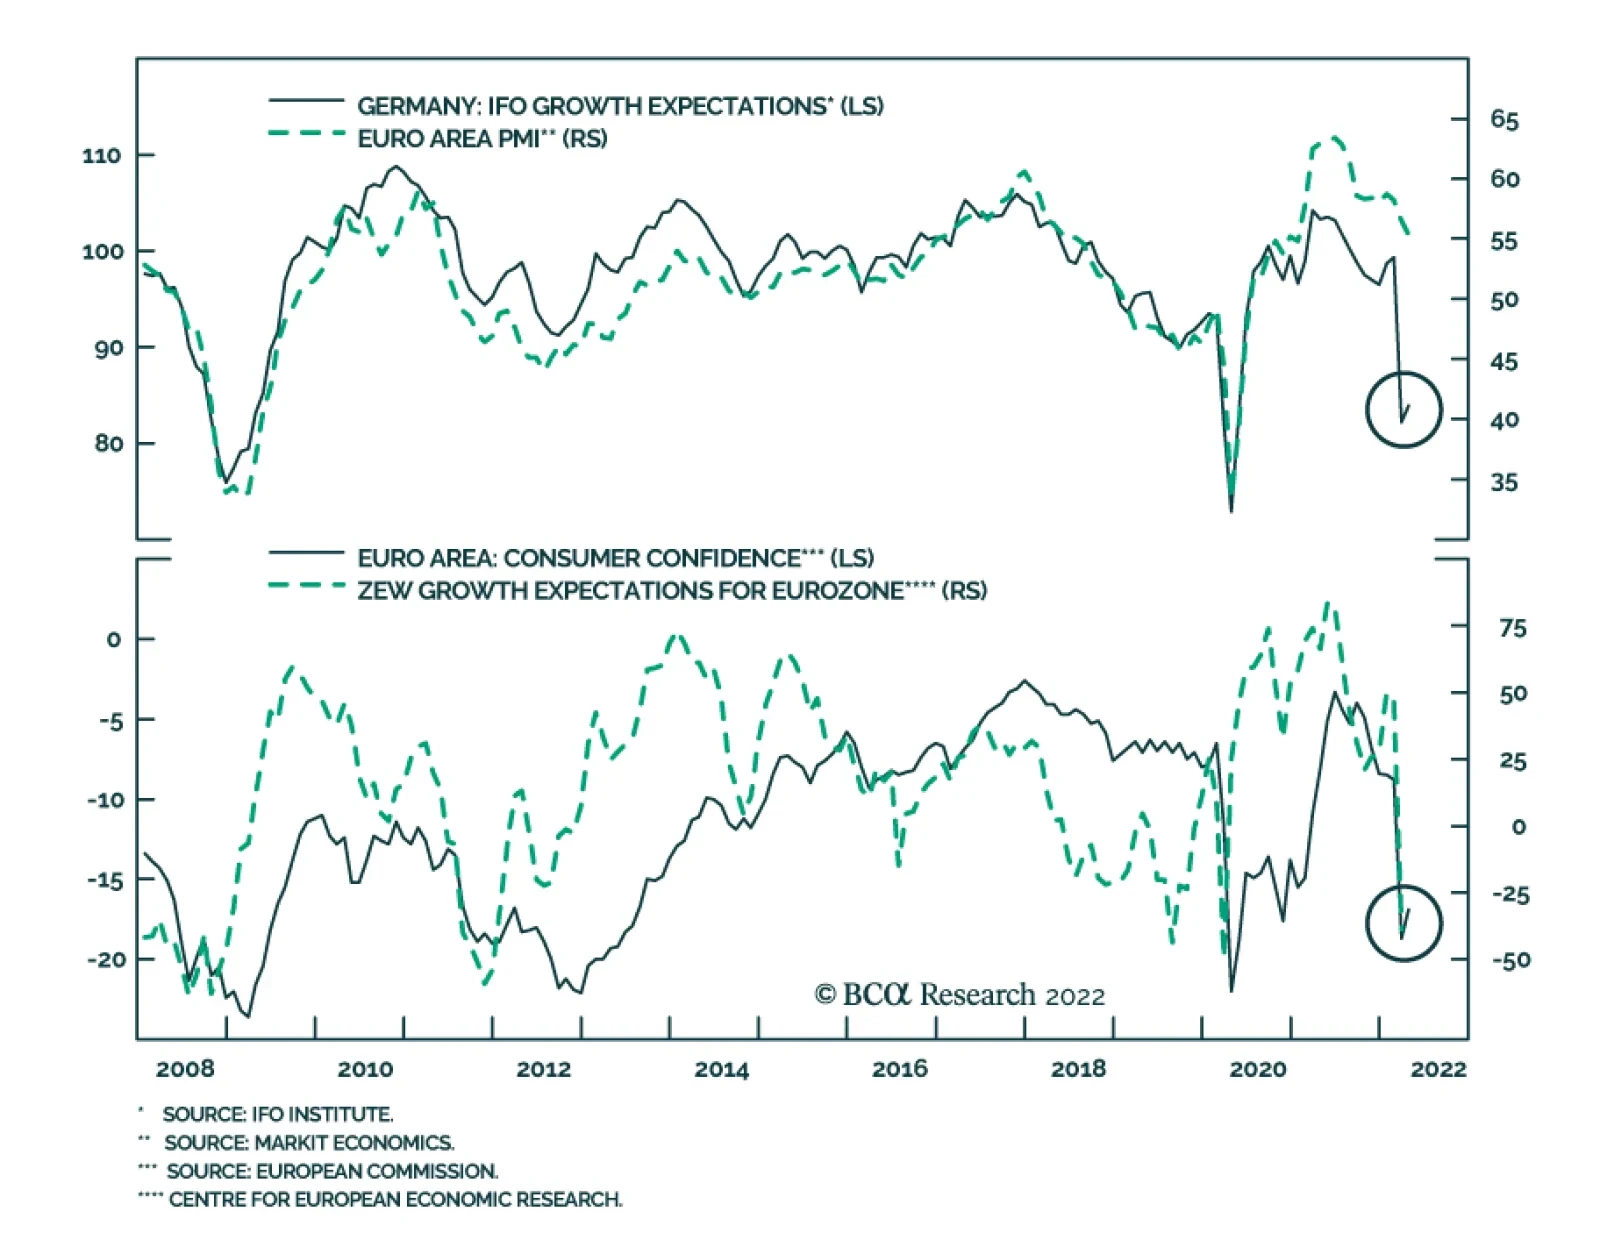
April’s release of the Ifo Business Climate Index for Germany surprised positively by edging up to 91.8 from last month’s 90.8 level, beating expectations of further deterioration. A pickup in German businesses’ expectations of future economic conditions was…
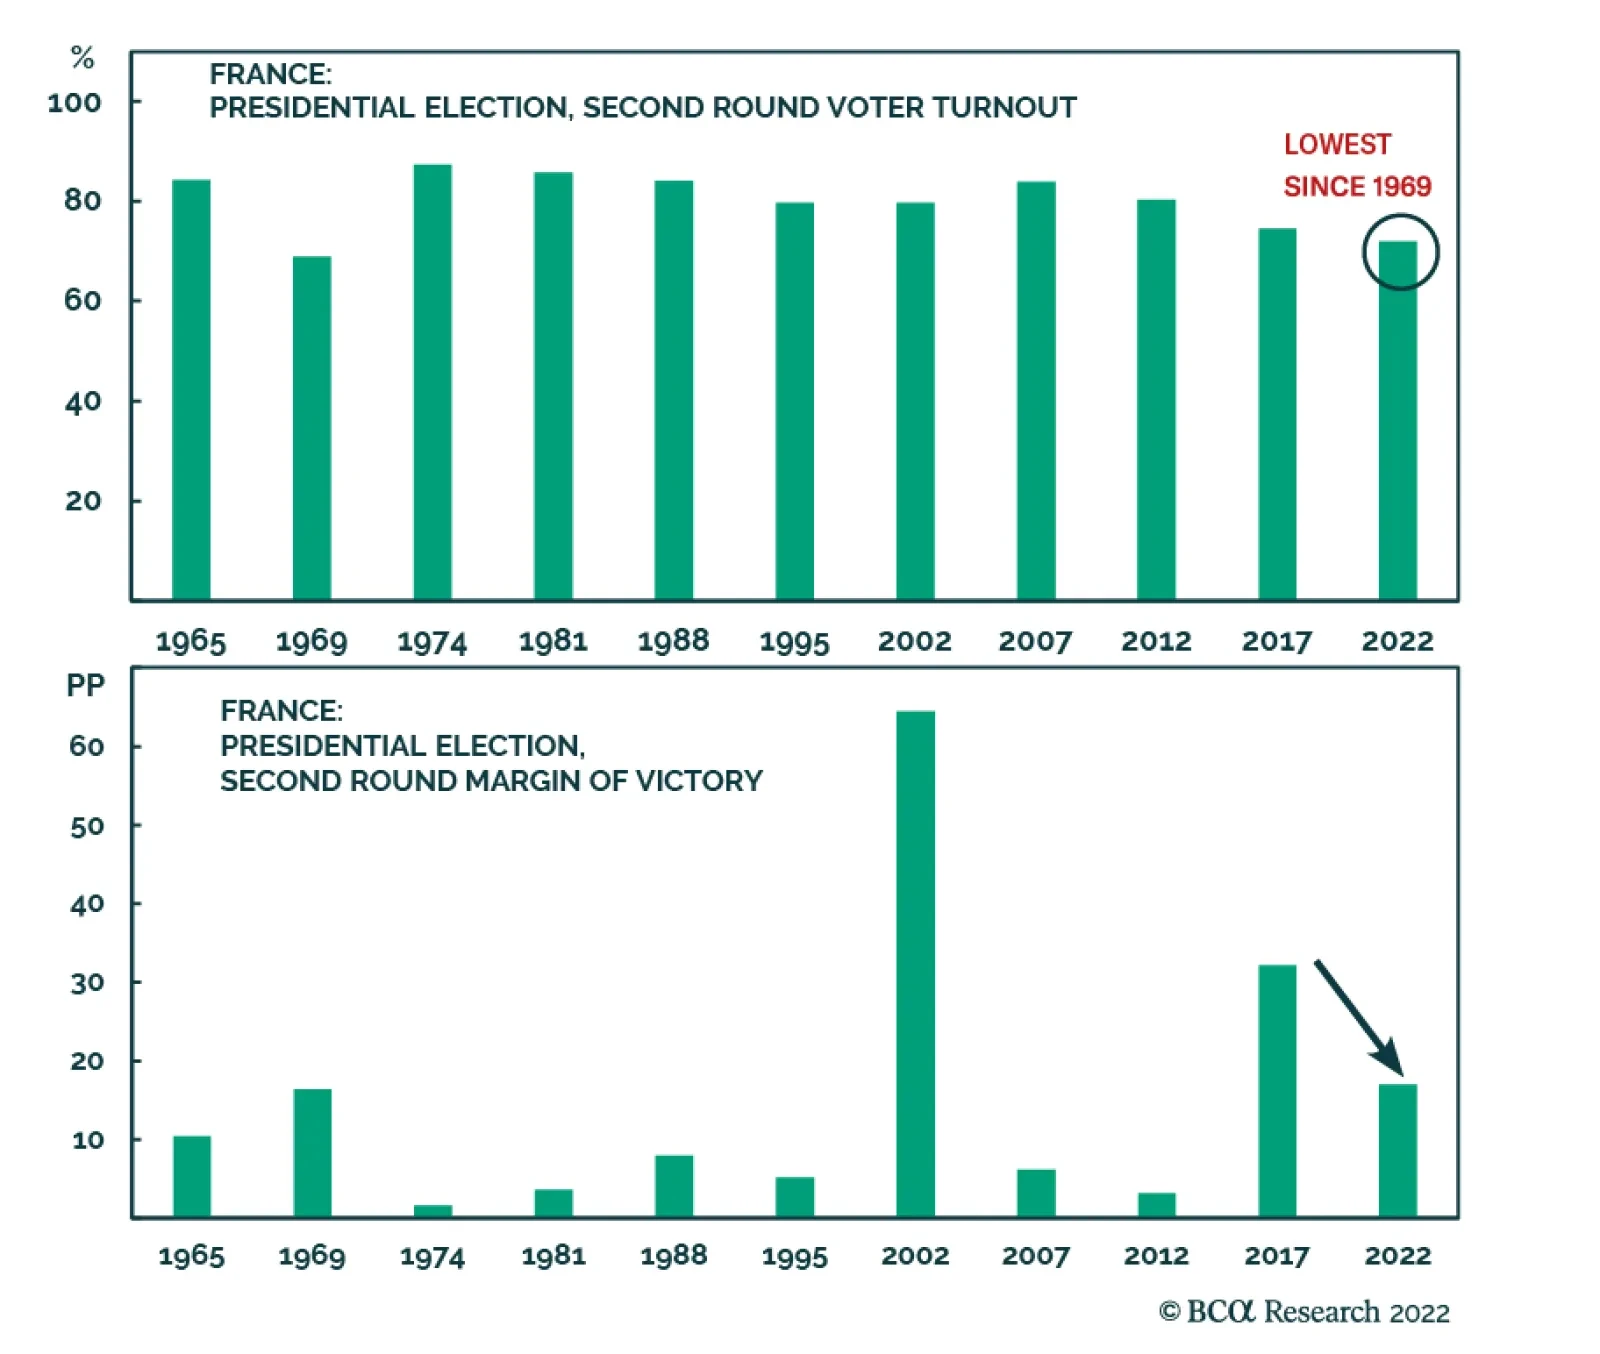
As expected, French President Emmanuel Macron secured a second term in the final round of the French presidential elections on Sunday, beating far-right rival Marine Le Pen by 58.5% to 41.5%. EUR/USD benefitted from a brief relief rally before reversing…
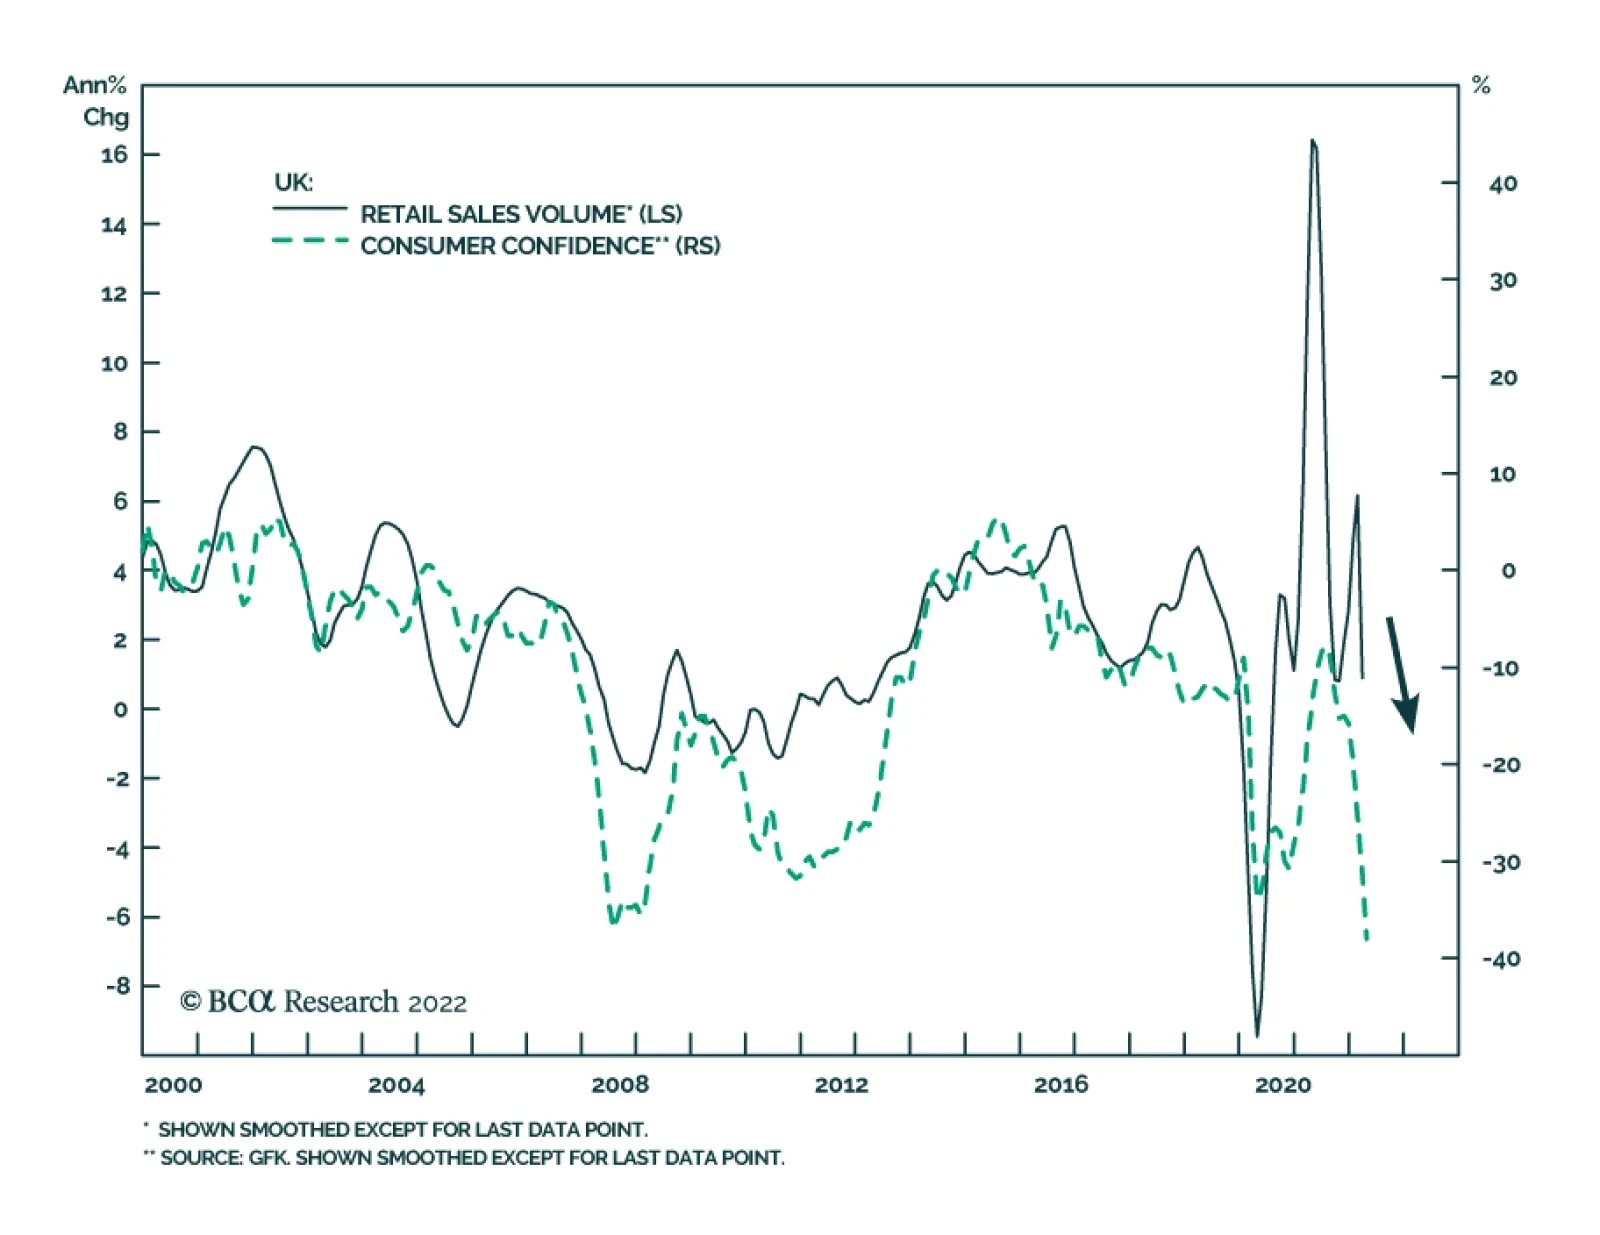
The UK economy faces multiple headwinds this year from tighter monetary and fiscal policies amid surging inflation. CPI inflation soared to a fresh 30-year high of 7% in March and the Bank of England raised interest rates at all three of its most recent MPC…
Several ECB Governing Council members spoke out in favor of a more hawkish policy stance in recent days. On Wednesday, Joachim Nagel noted that there is a possibility that net purchases are concluded at the end of the second quarter – earlier than the Q3…

Executive Summary Brent Stable As Demand + Supply Fall
Brent Stable As Demand + Supply Fall
Brent Stable As Demand + Supply Fall
Oil demand growth will slow this year and next by 1.6mm b/d and 1mm b/d, respectively. These expectations are in line with sharp downgrades in World Bank and IMF economic forecasts, which cite pressures from the Ukraine War, COVID-19-induced lockdowns in China, and central-bank policy efforts to contain rising inflation. Lower oil demand will be offset by lower supply from Russia and OPEC 2.0, which now are ~ 1.5mm b/d behind on pledges to restore production taken from the market during the pandemic. In 2022, US production will increase ~750k b/d year-on-year. The strategic relationship between the US and core OPEC 2.0 producers Saudi Arabia and the UAE is fraying. The Core's unwillingness to increase production despite pleas from the Biden administration likely motivated the US’s record SPR release of 180mm barrels (1mm b/d over 6 months). This will be augmented by another 60mm-barrel release of refined products by IEA member states. The EU's threat to stop importing half of Russia's 5mm b/d of oil exports would, if realized, force Russian storage to fill, and lead to production shut-ins. Oil prices would surge to destroy enough demand to cover this loss. Our base-case Brent forecast is at $94/bbl this year and $88/bbl in 2023, leaving our forecast over the period mostly unchanged. Bottom Line: Despite major shifts in global oil supply and demand over the past month, oil markets have remained mostly balanced. We remain long commodity index exposure via the S&P GSCI index, and the COMT ETF. We also are long oil and gas producer exposure via the XOP, and base metals producers via the PICK and XME ETFs. Feature Related Report Commodity & Energy StrategyDesperate Times, Desperate Measures: Aramco And The Saudi Security Dilemma Oil demand and supply growth are weakening on the back of the Ukraine War, COVID-19-induced lockdowns in China, and central-bank efforts to contain rising inflation. We expect global demand growth to slow this year and next by 1.6mm b/d and 1mm b/d, respectively, in line with downgrades in IMF and World Bank global growth forecasts.1 Demand will fall to 100mm b/d on average this year, down from our earlier expectation of 101.5mm b/d published in March. For next year, we expect global oil consumption to come in at 102.2mm b/d, down from our March estimate of 103.2mm b/d (Chart 1). EM consumption, the engine of oil-demand growth, falls to 54.2mm b/d vs. 55.8mm b/d in last month's forecast for 2022 demand. We have been steadily lowering our estimate for 2022 Chinese demand this year due to its zero-tolerance COVID policy and its associated lockdowns, and again take it down 250k b/d in this month's balances to 15.7mm b/d on average. In our estimates, Chinese oil demand grows 2.6% from its 2021 level of 15.3mm b/d. We have been expecting DM oil consumption to flatten out this year, following massive fiscal and monetary stimulus fueling oil demand during and after the pandemic, and continue to expect it to come in at ~ 45.7mm b/d this year. Chart 1Sharply Lower Oil Demand Expected
Sharply Lower Oil Demand Expected
Sharply Lower Oil Demand Expected
Oil Supply Gets Complicated Oil supply will continue to weaken along with demand this year, primarily due to sanctions imposed on Russia by Western buyers following its invasion of Ukraine. Russia's production reportedly was just above 10mm b/d. Estimates of Russian production losses over 2022-23 range from 1mm b/d to as much as 1.7mm b/d over at the US EIA. The outlier here is the IEA, which warns Russian production will fall 1.5mm b/d this month, then accelerate to 3mm b/d beginning in May. In our base-case modeling, we expect Russian output to average 9.8mm b/d in 2022 and 9.9mm b/d next year (Chart 2). Tracking Russia's production became more complicated, as the government this week announced it no longer would be reporting these data. Prices and satellite services will be needed to impute Russia's output in the future. Russia and the Kingdom of Saudi Arabia (KSA) are the putative leaders of OPEC 2.0 (otherwise known as OPEC+). In the wake of Russia's invasion of Ukraine, OPEC, the original cartel led by KSA, continues to maintain solidarity with Russia, referring in its Monthly Oil Market Report (MOMR), for example, to the "conflict between Russian and Ukraine," or the "conflict in Eastern Europe" – not the war in Ukraine. This would suggest KSA and its allies continue to place a high value in maintaining the OPEC 2.0 structure, which has shown itself to be an extremely useful organization for managing production and production declines among non-Core states – i.e., those states outside the Gulf that cannot increase output, or are managing declining production due to lack of capital, labor or both (Chart 3). Chart 2Brent Stable As Demand + Supply Fall
Brent Stable As Demand + Supply Fall
Brent Stable As Demand + Supply Fall
Chart 3OPEC 2.0 Remains Useful To KSA And Russia
War, Lockdowns, Rate Hikes Depress Oil Demand
War, Lockdowns, Rate Hikes Depress Oil Demand
The strategic relationship between core OPEC 2.0 producers capable of maintaining higher production – KSA and the UAE – and the US is fraying. Both states showed no interest in increasing production despite pleas from the Biden administration following Russia's invasion of Ukraine, and have shown a propensity to expand their diplomatic and financial relationships, e.g., exploring oil sales denominated in Chinese RMB, beyond their US relationships.2 This likely motivated the US’s record SPR release of 180mm barrels (1mm b/d over 6 months). This will be augmented by another 60mm-barrel release of refined products by IEA member states. Outside the OPEC 2.0 coalition, we continue to expect higher output from the US, led by shale oil production. According to Rystad Energy, horizontal drilling permits in the Permian basin hit an all-time high in March.3 If these permits are converted into new projects, oil supply growth will be boosted starting 2023. The US government’s recent announcement to lease around 144,000 acres of land to oil and gas companies – in a bid to bring down high US oil prices – also will spur supply growth towards the beginning of next year.4 These bullish factors are balanced out by nearer-term headwinds. Bottlenecks resulting from pent-up demand released following global lockdowns, the Russia-Ukraine crisis, and investor-induced capital austerity means US oil producers will not be able to turn on the taps as quickly this year as they've been able to do in days gone by. Given the near-term bearish factors and longer-term bullish factors, we expect total US crude production to grow slower this year and ramp up at a faster pace the next. US shale output (i.e., Lower 48 states (L48) ex Gulf of Mexico) is expected to average 9.73mm b/d in 2022 and 10.53mm b/d in 2023 (Chart 4). Total US crude supply is expected to average 11.92mm b/d and 12.74mm b/d, respectively, over this period. Additional production increases are expected from Canada, Brazil and Norway. Chart 4Shales Continue To Pace US Onshore Output Increases
Shales Continue To Pace US Onshore Output Increases
Shales Continue To Pace US Onshore Output Increases
Upside Risk Remains KSA's and the UAE's strategy to hold off on production increases despite US entreaties upends one of our expectations – i.e., that these state would increase production as the deficit in OPEC 2.0 output being returned to the market widened. We are coming around to the idea this could represent a desire to diversify their exposure to USD payments and assets, which, as Russia's invasion of Ukraine demonstrated, can become liabilities in an economic war. This also would begin to reduce the heavy reliance KSA and the UAE place on the US vis-à-vis defending its interests.5 Lastly, we would observe KSA's and the UAE's spare capacity is being husbanded closely, given it constitutes most, if not all, of OPEC 2.0's 3.4mm b/d of spare capacity (Chart 5). There are multiple scenarios in which this spare capacity would be needed by global markets to address production outages. One of the most imposing is an EU embargo on Russian oil imports floated by France this week, which triggers a cut-off of natural gas supplies by Russia to the EU.6 An embargo of Russian oil imports by the EU is a very low-probability event, but it is not vanishingly small. The EU imports about 2.5mm b/d of Russia's crude oil exports. The EU's threat to stop importing half of Russia's 5mm b/d of oil exports would, if realized, force Russian pipelines and storage to fill, and would lead to production shut-ins. Oil prices would have to surge to destroy enough demand to cover this loss of supply, even after OPEC's spare capacity was released into the market. If realized, such an event also would throw the world into recession, in our view. The prospect of a cut-off of Russian oil imports by the EU was addressed last month by Energy Minister Alexander Novak, who said such an act would prompt Russia to shut down natural gas exports to the EU.7 If Russia follows through on such a threat, it would shut down much of the EU's industrial and manufacturing activity. The experience of this past winter – when aluminum and zinc smelters were forced to shut as natural gas prices surged and made electricity from gas-fired generation too expensive for their operations – remains fresh in the mind of the market. An oil-import ban by the EU followed by a cut-off of natgas exports by Russia almost surely would spike volatility in these markets (Chart 6). In addition, a global recession would be a foregone conclusion, in our view. Chart 5OPEC Spare Capacity Concentrated In KSA, UAE
War, Lockdowns, Rate Hikes Depress Oil Demand
War, Lockdowns, Rate Hikes Depress Oil Demand
Chart 6Oil+ Gas Volatility Would Spike If EU Cuts Russian Oil Imports
Oil+ Gas Volatility Would Spike If EU Cuts Russian Oil Imports
Oil+ Gas Volatility Would Spike If EU Cuts Russian Oil Imports
Markets Remain Roughly Balanced … For Now Our supply-demand modeling indicates production losses are roughly balanced by consumption losses at present (Chart 7). If anything, the lost demand slightly outweighs the loss of production, when we run our econometric models. However, we are maintaining a $10/bbl risk premium in our estimates for 2022-23 Brent prices, which keeps our current forecast close to last month's levels. Persistent strength in the USD, particularly in the USD real effective exchange rate, acts as a headwind on prices by making oil more expensive ex-US (Chart 8). We expect this to continue, given the Fed's avowed commitment to raise policy rates to choke off inflation, which, all else equal, will make USD-denominated returns attractive. Chart 7Markets Remain Mostly Balanced
Markets Remain Mostly Balanced
Markets Remain Mostly Balanced
Chart 8Strong USD Restrains Oil Prices
War, Lockdowns, Rate Hikes Depress Oil Demand
War, Lockdowns, Rate Hikes Depress Oil Demand
Investment Implications Despite the major shifts in oil supply and demand over the past month, markets have remained mostly balanced (Table 1). Falling Russian output and weak OPEC 2.0 production – where most states are managing production declines – is being exacerbated by falling Chinese demand and SPR releases from the US and IEA. The market does not yet need the 1.3mm b/d of Iranian output that is being held at bay due to a diplomatic impasse between the US and Iran, which we believe will persist. With overall economic output growth slowing – per the forecasts of the major supranational agencies (WTO, IMF, World Bank) – weaker demand can be expected to persist. Table 1BCA Global Oil Supply - Demand Balances (MMb/d, Base Case Balances) To Dec23
War, Lockdowns, Rate Hikes Depress Oil Demand
War, Lockdowns, Rate Hikes Depress Oil Demand
This is not to say upside risk is non-existent. A move by the EU to ban Russian oil imports could set in motion sharply higher oil and gas prices and a deep EU recession, as discussed above. This could trigger an immediate need for OPEC spare capacity and those Iranian barrels waiting to return to export markets. We remain long commodity index exposure via the S&P GSCI index, and the COMT ETF. We also are long oil and gas producer exposure via the XOP, and base metals producers via the PICK and XME ETFs. Robert P. Ryan Chief Commodity & Energy Strategist rryan@bcaresearch.com Ashwin Shyam Research Analyst Commodity & Energy Strategy ashwin.shyam@bcaresearch.com Paula Struk Research Associate Commodity & Energy Strategy paula.struk@bcaresearch.com Commodity Round-Up Energy: Bullish Russia's concentration of exposure to OECD Europe – as customers for its energy exports – exceeds the latter's concentration of imports from Russia by a wide margin. Russia produced 10.1mm b/d of crude and condensates in 2021. Of the 4.7mm b/d of this Russia exported last year, OECD Europe was its largest customer, accounting for 50% of total oil exports, according to the US EIA (Chart 9). On the natgas side, more than one-third of the ~ 25 Tcf of natgas produced by Russia last year was exported via pipeline or as LNG, based on 2021 data from the EIA. This amounted to almost 9 Tcf. Most of this – 84% – was exported via pipeline to the OECD Europe, with the biggest customers being Germany, Turkey, Italy and France. As is the case with crude oil and liquids, OECD Europe is Russia's biggest natgas customer, accounting for ~ 75% of exports in either gaseous or liquid form. There is an argument to be made Russia needs OECD Europe as much or more than the latter needs Russia. Ags/Softs: Neutral Grains and vegetable oils are at multi-year or all-time highs, as a result of the war in Ukraine. This week, corn futures hit the highest since 2012, while wheat futures surged amid the ongoing war and unfavorable weather in U.S. growing areas. The U.N. Food and Agriculture Organization's Food Price Index rose 12.6% from February, its highest level since 1990. According to the FAO, the war in Ukraine was largely responsible for the 17.1% rise in the price of grains, including wheat and corn. Together, Russia and Ukraine account for around 30% and 20% of global wheat and corn exports. The cost of fertilizers has increased by almost 30% in many places due to the supply disruptions caused by the war and the tightening of natural gas markets, which is being driven by EU efforts to diversify away from Russian imports of the commodity.8 Planting is expected to be very irregular in the upcoming grain-sowing months, navigate through much higher prices for fuel and fertilizers (Chart 10). Chart 9
War, Lockdowns, Rate Hikes Depress Oil Demand
War, Lockdowns, Rate Hikes Depress Oil Demand
Chart 10
Wheat Price Level Going Down
Wheat Price Level Going Down
Footnotes 1 Please see the IMF's April 2022 World Economic Outlook report entitled War Sets Back the Global Recovery, and the World Bank's Spring Meetings 2022 Media Roundtable Opening Remarks by World Bank Group President David Malpass, posted on April 18, 2022. 2 Please see, e.g., Saudi Arabia Considers Accepting Yuan Instead of Dollars for Chinese Oil Sales published by wsj.com on March 15, 2022. 3 Please see Permian drilling permits hit all-time high in March, signaling production surge on the horizon, published by Rystad Energy on April 13, 2022. 4 Please see Joe Biden resumes oil and gas leases on federal land, published by the Financial Times on April 15, 2022. 5 Please see Desperate Times, Desperate Measures: Aramco And The Saudi Security Dilemma, which we published on January 14, 2014. In that report, we noted, "… the U.S. has decided to stop micromanaging the Middle East. The latter policy sucked in too much of Washington's material resources, blood and treasure, at a time when regional powers like China and Russia were looking to establish their own spheres of influence in East Asia and Eurasia respectively." Building deeper commercial relationships with China also would bind both states together in terms of addressing KSA's security concerns, given China's existing relationships with Iran. This is a longer-term strategy, in our view. 6 Please see An EU embargo on Russian oil in the works - French minister, published by reuters.com on April 19, 2022. 7 Please see War in Ukraine: Russia says it may cut gas supplies if oil ban goes ahead, published by bbc.co.uk on March 8, 2022. 8 Please refer to Food prices soar to record levels on Ukraine war disruptions, published by abcNEWS on April 8, 2022. Investment Views and Themes Strategic Recommendations Trades Closed in 2022
Image
Executive Summary A Good Time For A Pause In The Bond Bear Market
A Good Time For A Pause In The Bond Bear Market
A Good Time For A Pause In The Bond Bear Market
The global government bond selloff looks stretched from a technical perspective, and a consolidation phase is likely over the next few months as global growth and inflation momentum both roll over. Central banks are starting to turn more aggressive on the pace of rate hikes in the face of elevated inflation expectations, as evidenced by the 50bp rate hikes in Canada and New Zealand last week (and the likely similar move the Fed next month). However, forward pricing of policy rates over the next 12-18 months is already at or above policymaker estimates of neutral in most developed countries. Global bond yields will be capped until central banks and markets revise higher their estimates of neutral policy rates. This is more a 2023/24 story than a 2022 story. Interest rate expectations are too high in Canada. High household debt will limit the ability for the Bank of Canada to match the Fed’s rate hikes during the current tightening cycle without bursting the Canadian housing bubble. Bottom Line: Maintain a neutral stance on overall global duration exposure. Upgrade Canadian government bonds to neutral (3 out of 5) in global bond portfolios, ideally funded out of US Treasury allocations. How To Interpret Rising Real Bond Yields Chart 1Bonds Under Pressure From Both Inflation & Real Yields
Bonds Under Pressure From Both Inflation & Real Yields
Bonds Under Pressure From Both Inflation & Real Yields
The sharp rise in global government bond yields seen so far in 2022 has been driven by both rising inflation expectations and higher real yields (Chart 1). The former is a function of the war-fueled surge in oil prices at a time of high realized inflation, while the latter is a consequence of expectations for tighter monetary policy to fight that inflation. The magnitude of the yield increases seen year-to-date is surprising given the downgrades to global growth expectations. Just this week, the IMF downgraded its growth forecasts for the second time this year. It now expects global growth to reach 3.6% in both 2022 and 2023, shaving 0.8 and 0.2 percentage points, respectively, from the last set of yearly forecasts made back in January. The World Bank similarly chopped its growth forecast for 2022 to 3.2% from 4.1%. Spillovers from the Russia/Ukraine war were the main factor behind the downgrades, including more aggressive monetary tightening by global central banks in response to commodity-fueled inflation. We’re already seeing a faster pace of rate hikes from developed market central banks. The Bank of Canada (BoC) and Reserve Bank of New Zealand (RBNZ) lifted policy rates by 50bps last week and the Fed is signaling a similar move in May. Not all policymakers are sending hawkish signals, however. The ECB last week opted to not commit to the timing and pace of any future moves on rates, while the Bank of Japan has pledged to maintain monetary stimulus measures even in the face of a collapsing yen. Related Report Global Fixed Income StrategyPolicymakers Face The No-Win Scenario While government bond yields have risen across the developed world so far in 2022, the drivers of the yield increase have not been the same in all countries when looking at moves in benchmark 10-year nominal and inflation-linked bonds (Chart 2). About three-quarters of the nominal yield moves seen year-to-date in the US (+134bps), Canada (+136bps) and Australia (+130bps) have come from higher real yields, while the increase in the Gilt yield (+92bps) was more of an equal split between real yields and inflation breakevens. In Germany (+102bps) and Japan (+17bps), the upward move in 10-year yields this year has all been from higher breakevens, as real yields have fallen in both countries. Chart 2Real Yields (ex-Europe/Japan) Driving Nominal Yields Higher In 2022
Global Bond Yields Take A Breather
Global Bond Yields Take A Breather
In the US, Canada and UK – three countries where central banks have delivered rate hikes this year and are promising to do more – real yields have been highly correlated to rising interest rate expectations for the next two years taken from overnight index swap (OIS) curves (Chart 3). Meanwhile, in Germany, Japan and Australia - where central banks have kept rates steady and not sending strong messages on when that will change – the correlation between real yields and OIS-derived interest rate expectations has not been as strong (Chart 4). Chart 3Rising Real Yields Where Central Banks Have Been Hiking
Rising Real Yields Where Central Banks Have Been Hiking
Rising Real Yields Where Central Banks Have Been Hiking
Chart 4More Stable Real Yields Where CBs Are More Dovish
More Stable Real Yields Where CBs Are More Dovish
More Stable Real Yields Where CBs Are More Dovish
Chart 5Real Rate Expectations Have Risen Much Faster In The US
Global Bond Yields Take A Breather
Global Bond Yields Take A Breather
The link between interest rate expectations and real yields is intuitive after factoring in inflation expectations. In Chart 5, we show actual real interest rates (policy rates minus headline CPI inflation) in the US, euro area and UK, as well as a “market-based” measure of real interest rate expectations derived as the difference between forward rates from the nominal OIS and CPI swap curves (the dotted lines). The current path for real rates is the black dotted line, while the path as of the start of 2022 is the green dotted line. In all three countries, the market-derived path for real rates over the next decade has shifted upward since the start of the year, which is consistent with a rising path for real bond yields. Yet the largest move has been in the US where real rates are expected to average around zero over the next ten years. This lines up logically with the more hawkish messaging on rates from the Fed, leading to a repricing of the 10-year TIPS yield from -1% at the start of the year to a mere -0.04% today. By contrast, real rate expectations and real yields remain negative in the euro area and UK, as both the ECB and Bank of England have been much less hawkish compared to the Fed in terms of signaling the timing and magnitude of future rate hikes. We have long flagged deeply negative real bond yields, especially in the US, as the greatest source of vulnerability for global bond markets. Such yield levels can only be sustained in a rising inflation environment if central banks deliberately keep policy rates below inflation for a long time. The Fed was not going to allow that to happen with inflation reaching levels not seen since the early 1980s, leaving US Treasuries vulnerable to a sharp repricing of fed funds rate expectations that would drive real bond yields higher. Looking ahead, we do not expect to see much additional bearish repricing of global rate expectations and real yields over the rest of 2022, for the following reasons: Global growth momentum is slowing The combined shock of geopolitical uncertainty from the Ukraine war, high oil prices and tightening global monetary policy – in addition to the expected slump in Chinese growth due to the latest wave of COVID lockdowns – has damaged economic confidence. The April reading from global ZEW survey of professional forecasters and investors showed another modest decline in US and euro area growth expectations after the huge drop in March (Chart 6). Interestingly, the ZEW survey also showed a big decline in the net number of respondents expecting higher inflation and a small dip in the number of respondents expecting higher bond yields – both potential signals that the increase in global bond yields is ready to pause. Medium-term US inflation expectations have remained relatively contained The sharp run-up in US inflation has boosted survey-based measures of inflation expectations, although the increase has been much higher for shorter-term expectations (Chart 7). One-year-ahead inflation expectations from the University of Michigan and New York Fed consumer surveys have doubled over the past year and now sit at 6.6% and 5.4%, respectively. Yet the 5-10 year ahead inflation expectation from the Michigan survey has seen a much smaller increase and is holding stable around 3%. The 5-year/5-year forward TIPS breakeven is at even less worrisome levels and now sits at a trendline resistance level of 2.4% (bottom panel). Chart 6ZEW Survey Shows Weaker Growth & Inflation Expectations
ZEW Survey Shows Weaker Growth & Inflation Expectations
ZEW Survey Shows Weaker Growth & Inflation Expectations
Chart 7Medium-Term US Inflation Expectations Have Not Broken Out
Medium-Term US Inflation Expectations Have Not Broken Out
Medium-Term US Inflation Expectations Have Not Broken Out
US inflation is showing early signs of peaking Year-over-year headline US CPI inflation reached another cyclical high of 8.6% in March. However, core CPI inflation rose by a less-than-expected +0.3% on the month and the year-over-year rate of 6.5% was essentially unchanged versus the February level (Chart 8). Used car prices, a huge driver of the surge in US goods inflation in 2021, fell by a sizeable -3.8% in March, the second consecutive monthly decrease. Chart 8A Peak In US Core Inflation?
A Peak In US Core Inflation?
A Peak In US Core Inflation?
Chart 9Housing Cost Inflation Is A Global Problem
Housing Cost Inflation Is A Global Problem
Housing Cost Inflation Is A Global Problem
We expect US consumer spending to shift more towards services from goods over the next 6-12 months, which should lead to overall US inflation rates converging more towards lower services inflation. Services inflation is still well above the Fed’s inflation target, however, particularly with shelter inflation – one-third of the overall US CPI index – now at 5.0% and showing no signs of slowing. Chart 10A Good Time For A Pause In The Bond Bear Market
A Good Time For A Pause In The Bond Bear Market
A Good Time For A Pause In The Bond Bear Market
Rising housing costs are not only a problem in the US, and house prices and valuations have soared across the developed world (Chart 9). This suggests that housing and rental costs will remain an important driver of underlying inflation in many countries, not just the US. Summing it all up, we continue to see conditions conducive to a period of relative global bond market stability, with government bond yields remaining rangebound over the next several months. The stimulus for higher yields – from even more hawkish repricing of central bank expectations, even higher real bond yields or additional increases in inflation expectations – is not evident. Bond yields look stretched from a technical perspective, and our Global Duration Indicator continues to signal that global yield momentum should soon peak (Chart 10). Bottom Line: Maintain a neutral stance on overall global bond portfolio duration. Upgrade Canadian Government Bonds To Neutral The Bank of Canada (BoC) hiked its policy interest rate by 50bps last week to 1%, the first rate increase of that size since 2000. The BoC also announced that it will begin quantitative tightening of its balance sheet at the end of April when it stops buying Canadian government bonds to replace maturing debt it currently owns. In the press conference explaining the move, BoC Governor Tiff Macklem noted that the central bank now saw the Canadian economy in a state of “excess demand” with inflation that was “expected to be elevated for longer than we previously thought” and that “the economy could handle higher interest rates, and they are needed.” Chart 11Canadian Growth Momentum Peaking?
Canadian Growth Momentum Peaking?
Canadian Growth Momentum Peaking?
This is a very clear hawkish message from Macklem, who hinted that the BoC may have to lift rates above neutral for a period to bring Canadian inflation back down to the central bank’s target. We have our doubts that the BoC will be able to raise rates that far, and keep them there for long, before inflation pressures ease. The BoC Business Outlook Survey plays an important role in the central bank’s policy decisions. The survey for Q1/2022 showed dips in the overall survey, and the individual components related to sales growth expectations, investment intentions and hiring plans (Chart 11). There were even small drops in the net number of survey respondents seeing intense labor shortages and expecting faster wage growth (bottom panel). The moves in these survey components were modest, but they are important coming after the relentless upward rise since the trough in mid-2020. Importantly, this survey was conducted before the Russian invasion of Ukraine, which likely provided an additional drag on business confidence. The components of the Business Outlook Survey related to prices and costs continued to show that Canadian firms are facing lingering capacity constraints and intense cost pressures from both labor and supply chain disruption. A net 80% of respondents – a survey record – report they would have some or significant difficulty meeting an unexpected increase in demand. A net 35% of respondents in the Q1/2022 survey cited “labor cost pass through” as a source of upward pressure on their output prices, a huge jump from the Q4/2022 reading of 19% (Chart 12). Also, a net 33% of respondents noted “non labor cost pass through”, i.e. higher prices due to supply chain disruption, as a source of pressure on output prices. Only a net 12% of respondents cited strong demand as a source of pressure on prices, and the net balance of respondents noting that the competitive environment was inflationary was effectively zero. Chart 12Canadian Businesses See More Cost-Push Inflation Pressures
Global Bond Yields Take A Breather
Global Bond Yields Take A Breather
The two main messages from the Business Outlook Survey are: a) Canadian growth momentum likely cooled in Q1, and b) Canadian inflation pressures remain significant, but are more supply driven than demand driven. Overall Canadian inflation is still accelerating rapidly, with headline CPI hitting an 31-year high of 5.7% in February. Underlying measures of inflation are more subdued, but still elevated: the BoC’s CPI-trim and CPI-median measures are at 4.3% and 3.5%, respectively, both above the BoC’s 1-3% target band (Chart 13). Chart 13Mixed Messages On Canadian Inflation Expectations
Mixed Messages On Canadian Inflation Expectations
Mixed Messages On Canadian Inflation Expectations
There are more mixed messages coming out of Canadian inflation surveys. The 1-year-ahead inflation expectation from the BoC’s Survey of Consumer Expectations climbed to 5.1% in Q1/2022 from 4.9% in Q4, while the 5-year-ahead expectation dropped to 3.2% from 3.5%. The 10-year breakeven inflation rate on Canadian inflation linked bonds is even lower, now sitting near at 2.2%. There are also very mixed signals on wage expectations, even with the Canadian unemployment rate dropping to a record low of 5.3% in March. Canadian consumers expect wage growth to reach 2.2% over the next year, below the latest reading on actual wage growth of 2.5% and far below the 5.2% growth expected by Canadian businesses (bottom panel). If medium-term consumer inflation expectations are not rising in the current high inflation environment, and consumer wage expectations are not increasing with a record-low unemployment rate, then the BoC can potentially move slower than markets expect on rate hikes over the next year if realized inflation peaks. On that front there are tentative signs of optimism. When breaking down Canadian inflation into goods and services components, both are still accelerating rapidly (Chart 14). Goods inflation reached 7.6% in February, while services inflation hit 3.8%. However, the pace of year-over-year inflation for some key durable goods components like new cars, household appliances and furniture – items that saw demand and prices increase during the worst of the pandemic – appears to have peaked (middle panel). This may be a sign that overall goods inflation is set to roll over, similarly to what we expect in the US in the coming months. Also like the US, services inflation is less likely to decelerate, as rent inflation is accelerating and the housing cost component of Canadian inflation (home replacement costs) is still expanding at a 13.2% annual rate. On that note, housing remains the key component to watch to determine the BoC’s next move, given highly levered household balance sheets exposed to house prices and higher mortgage rates. The robust strength of the Canadian housing market has driven house prices to some of the most overvalued levels among the developed economies. There is a speculative aspect to the housing boom, with Canadian households expecting house prices to appreciate by 7.1% over the next year according to the BoC consumer survey (Chart 15). Canadian housing demand has also become more sensitive to rate increases by the choice of mortgages. 30% of outstanding mortgages are now variable rate, up from 18% at the start of the pandemic in 2020 after the BoC cut rates to near-0%. Chart 14The Goods-Driven Canadian Inflation Surge May Be Peaking
The Goods-Driven Canadian Inflation Surge May Be Peaking
The Goods-Driven Canadian Inflation Surge May Be Peaking
Chart 15BoC Rate Hikes Will Cool Off Canadian Housing
BoC Rate Hikes Will Cool Off Canadian Housing
BoC Rate Hikes Will Cool Off Canadian Housing
During the BoC’s last rate hiking cycle in 2017-19, national house price inflation slowed from 15% to 0%. Policy rates had to only reach 1.75% to engineer that outcome. With household balance sheets even more levered today, and with greater exposure to variable rate mortgages, it is unlikely that a policy rate higher than the previous cycle peak will be needed to cool off house price growth – an outcome that should also dampen Canadian services inflation with its large housing related component. In addition to the rate hike at last week’s policy meeting, the BoC also announced the results of its annual revision to its estimated range for the neutral policy rate. The range is now 2-3%, up slightly from 1.75%-2.75%. The current pricing of interest rate expectations from the Canadian OIS curve has the BoC lifting rates to the high-end of that new neutral range by the first quarter of 2023, then keeping rates near those levels over at least the next five years (Chart 16). Chart 16Markets Expect The BoC To Keep Rates Elevated For Longer
Global Bond Yields Take A Breather
Global Bond Yields Take A Breather
Chart 17Upgrade Canadian Government Bonds To Neutral
Upgrade Canadian Government Bonds To Neutral
Upgrade Canadian Government Bonds To Neutral
We doubt the BoC will be able to raise rates all the way to 3% without inducing instability in the housing market. More importantly, the current surge in inflation is not becoming embedded in medium-term inflation and wage expectations – outcomes that would require the BoC to keep policy rates at the high end of its neutral range or even move them into restrictive territory. Turning to bond strategy, we have had Canada on “upgrade watch” in recent weeks, with rate hike expectations looking a bit too aggressive. We now see it as a good time to pull the trigger on that upgrade. Thus, this week, we are moving our recommended exposure to Canadian government bonds to neutral (3 out of 5) from underweight (Chart 17). We are “funding” that move in our model bond portfolio by reducing exposure to US Treasuries (see the tables on pages 15-16), as we see the Fed as being more likely than the BoC to deliver on the rate hike expectations discounted in OIS curves. A move to an outright overweight stance, versus all countries and not just the US, will be appropriate once Canadian inflation clearly peaks and interest rate expectations begin to decline. It is too soon to make that move now, but we will revisit that call later this year. Bottom Line: Interest rate expectations are too high in Canada with medium-term inflation expectations relatively subdued. High household debt in Canada will limit the ability for the Bank of Canada to match the Fed’s rate hikes during the current tightening cycle without bursting the Canadian housing bubble. Upgrade Canadian government bonds to neutral (3 out of 5) in global bond portfolios, ideally funded out of US Treasury allocations. Robert Robis, CFA Chief Fixed Income Strategist rrobis@bcaresearch.com GFIS Model Bond Portfolio Recommended Positioning Active Duration Contribution: GFIS Recommended Portfolio Vs. Custom Performance Benchmark
Global Bond Yields Take A Breather
Global Bond Yields Take A Breather
The GFIS Recommended Portfolio Vs. The Custom Benchmark Index Global Fixed Income - Strategic Recommendations* Cyclical Recommendations (6-18 Months)
Global Bond Yields Take A Breather
Global Bond Yields Take A Breather
Tactical Overlay Trades
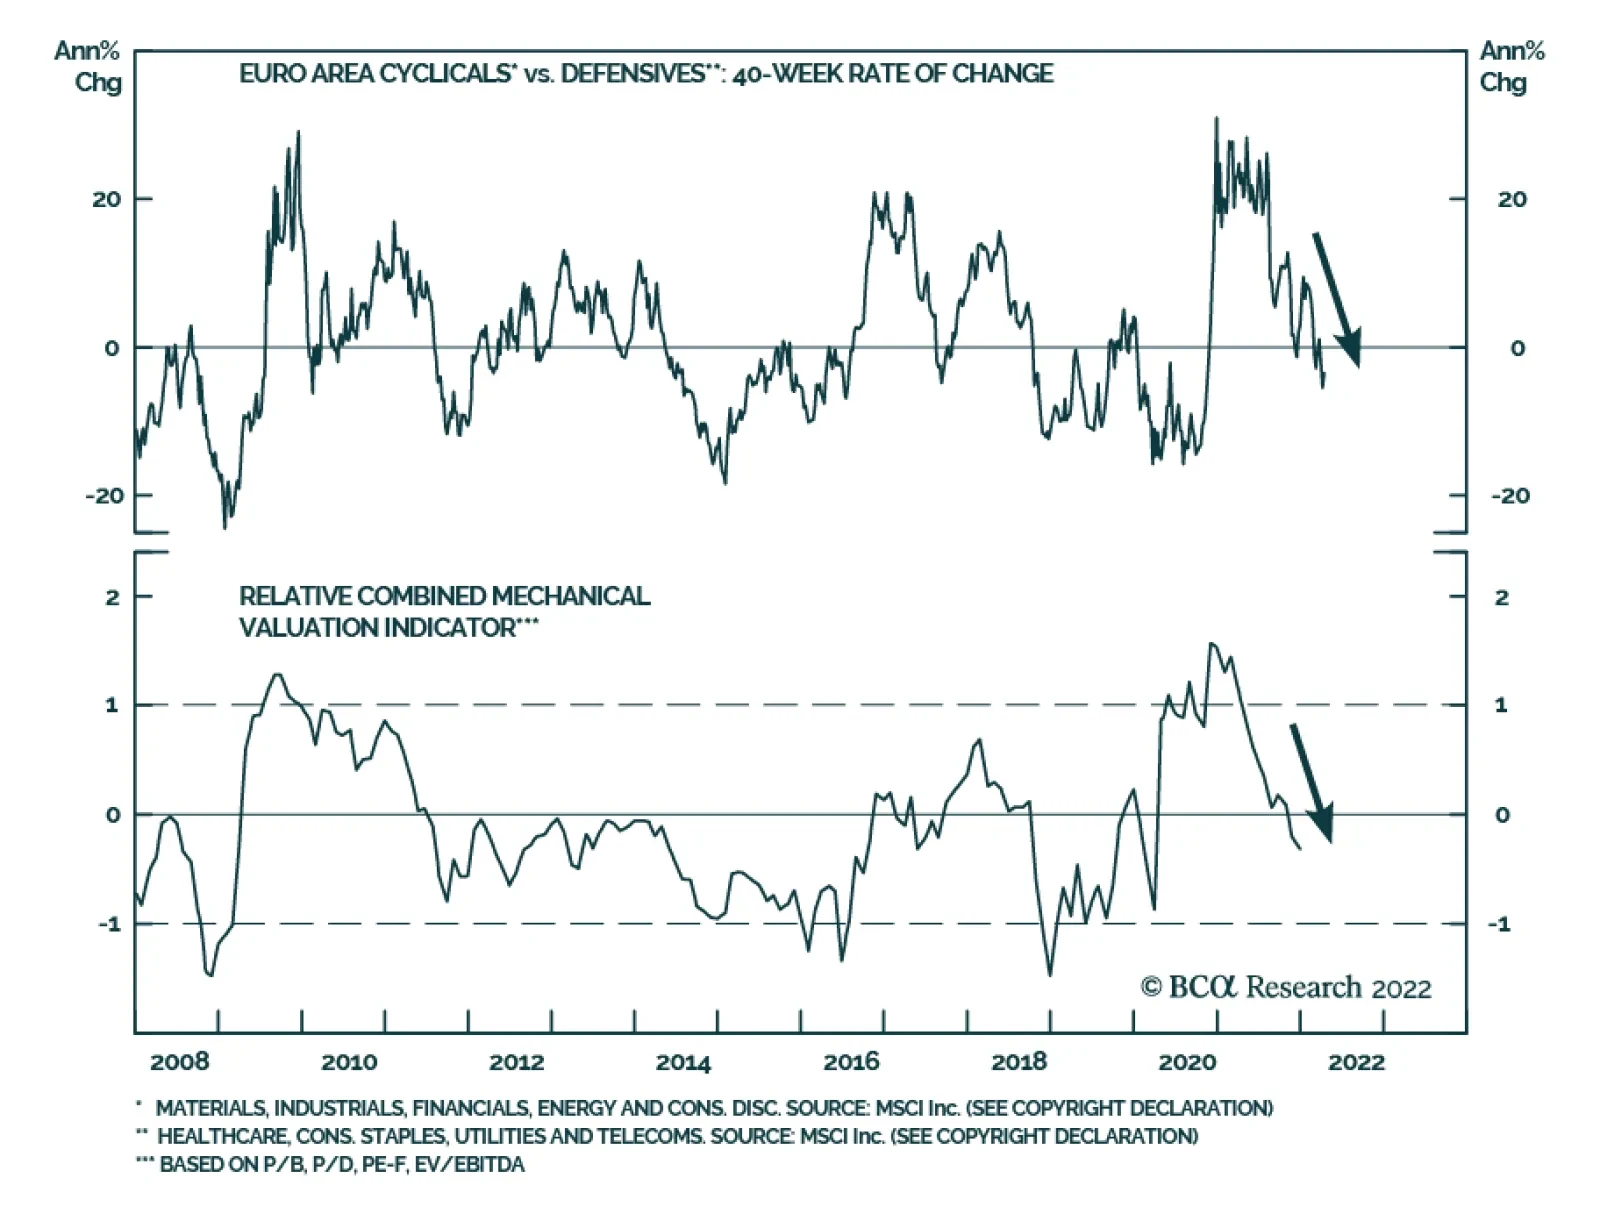
According to BCA Research’s European Investment Strategy service, European cyclicals remain vulnerable as they have not reached the kind of valuation discount necessary to compensate investors for weaker growth and tighter monetary policy. The global…
Dear Client, Next week, there will not be a written European Investment Strategy report; instead we will host a Webcast on April 26 with Chester Ntonifor, BCA’s Foreign Exchange Strategist. Regards, Mathieu Savary Executive Summary Cyclicals Are Not Cheap Enough
Cyclicals Are Not Cheap Enough
Cyclicals Are Not Cheap Enough
Global growth remains fragile as China’s economy becomes increasingly affected by COVID containment measures. The US economy is likely to slow down significantly in the coming months, while Europe flirts with a recession. This time around, monetary policy is unlikely to provide a relief valve. While European equities may inch higher in the coming months, cyclical stocks do not offer the necessary valuation discount relative to defensive equities to compensate investors against these risks. Heed the rotational patterns to guide near-term country and sector allocation. The French election remains an important source of risk, even though President Emmanuel Macron is still the favorite. Bottom Line: Maintain a modest positive bias toward equities, but overweight defensive stocks at the expense of cyclicals. Focus on short-term capital protection by favoring small-cap over momentum stocks, materials over energy, and UK equities over French ones. Chart 1So Far, Defensives Win
Plenty Of Risks For Cyclical Stocks
Plenty Of Risks For Cyclical Stocks
European equities have experienced a very volatile first quarter, with a maximum drawdown of nearly 23%. Since their March 7th low, they have rebounded 18% but remain 13% below the January 5th high. Apart from the energy sector, defensives have been running the show so far this year (Chart 1). We wrote four weeks ago that the European market is likely to have made its low for the year, but that the volatility of the first quarter of 2022 is likely to continue. We still hold this view. For now, we recommend investors stay long European equities, but defensive sector and country stances are appropriate. Cyclical stocks have corrected, but front-loaded global economic risks create additional downside. Economic Risks Abound The global economic environment remains fragile as headwinds continue to build. Cyclical equities do not seem to have fully discounted this threat. China’s economic outlook constitutes the first hindrance to global growth. COVID cases in Shanghai are surging and many Chinese cities are also witnessing an acceleration in new cases (Chart 2). The Communist Party is still adamant about its zero-tolerance policy, which suggests that these severe lockdowns will become the norm around the country. This situation creates significant downside for Chinese domestic demand, which will prompt a growth slowdown. The service sector is already feeling the pain from the lockdowns. The March import numbers also highlight an abrupt slowdown in the goods sector (Chart 3). In CNY terms, imports contracted 1.7% annually. This is a nominal number. Both global goods and commodity inflation are elevated, and thus, import volumes are weakening sharply. Furthermore, a recent Reuters article indicated that Chinese crude oil imports have already contracted 14% annually. Chart 2China's COVID Problem
China's COVID Problem
China's COVID Problem
Chart 3Slowing Chinese Domestic Demand
Slowing Chinese Domestic Demand
Slowing Chinese Domestic Demand
Chart 4Declining Shipping Costs, But For How Long?
Declining Shipping Costs, But For How Long?
Declining Shipping Costs, But For How Long?
China’s COVID policy also risks adding new supply chain bottlenecks. Freight within the country is grinding to a halt and ships are queuing up outside the port of Shanghai. As lockdowns multiply around China, risks to global supply chains will increase, hence, the recent decline in shipping rates out of China may soon be undone (Chart 4). This represents a major risk for the global economy, as it would tighten constraints to global economic activity. It also threatens European profitability, as PPI inflation would outpace CPI inflation for longer than anticipated (Chart 4, bottom panel). The US also shows signs of weakness. While a US recession is unlikely, a meaningful deceleration is probable. US consumers are feeling the pinch from surging food and energy prices. Consequently, real wages are contracting 1.8% annually and consumer confidence has plunged (Chart 5). Thankfully, US households have accumulated $185 billion in excess savings since the pandemic began and their net worth has increased by $33 trillion, which should prevent a complete meltdown. Nevertheless, a further deterioration in retail sales is still very likely. Businesses are also increasingly worried. The March NFIB survey shows that Small Business Optimism is falling quickly and that few companies believe it is a good time to expand (Chart 5, bottom panel). Adding to these stresses, the most cyclical sector of the US economy is weakening rapidly. The recent rise in US mortgage rates to 5% is causing a collapse in mortgage applications for house purchases and is behind the 30% tumble suffered by homebuilder stocks (Chart 6). Chart 5US Confidence Is Falling
US Confidence Is Falling
US Confidence Is Falling
Chart 6Tarnished US Housing Outlook
Tarnished US Housing Outlook
Tarnished US Housing Outlook
Europe is in a situation worse than the US and is at risk of a recession in the first half of 2022, or, at least, a very severe growth slowdown. As we highlighted six weeks ago, the energy shock in Europe is larger than it is in the US; moreover, Europe does not enjoy the counterweight of a large commodity sector. Recent data confirm that a slowdown is imminent. The ZEW Expectations survey, the German Ifo, and the European Commission’s Consumer Confidence data are all collapsing, which is consistent with a severe shock (Chart 7). To add insult to injury, bond yields continue to rise; therefore, the only relief valve for the region is a weak currency. Global monetary policy is unlikely to come to the rescue of investors anytime soon. The Fed began lifting rates in March and, if the actions of the Bank of Canada and the Reserve Bank of New Zealand are any indication, the FOMC will increase rates by 50bps in May. The OIS curve expects a Fed Funds rate at 2.2% by year-end, which seems appropriate. With a backdrop of weakening growth, a flat yield curve and an additional increase in real rates will feed risk aversion, especially against the cyclical sectors of the market (Chart 8). Chart 7Severe Slowdown In Europe... Or Worse
Severe Slowdown In Europe... Or Worse
Severe Slowdown In Europe... Or Worse
Chart 8Slowing Growth Meets Higher Real Rates
Slowing Growth Meets Higher Real Rates
Slowing Growth Meets Higher Real Rates
The liquidity tightening is not a phenomenon unique to the US. 63% of global central banks have removed monetary accommodation over the past three months (Chart 9). Moreover, our BCA Monetary Index continues to deteriorate. While we cannot characterize global monetary policy as being anywhere close to tight right now, cyclical equities remain vulnerable to the liquidity slowdown. Bottom Line: The global economy is likely to deteriorate in the coming months. The impact of COVID-19 on Chinese growth will only increase, while Europe flirts with a recession in the first half of the year. Meanwhile, US growth faces swelling headwinds. Expect a meaningful deterioration in global economic surprises (Chart 10). In this context, tighter policy will feed risk aversion, which will create a particularly strong headwind for cyclical stocks. Chart 9A Global Tightening
A Global Tightening
A Global Tightening
Chart 10Economic Surprises Will Fall
Economic Surprises Will Fall
Economic Surprises Will Fall
European Cyclicals Remain Vulnerable This backdrop is not equity-friendly and points to meagre returns over the next three to six months. Nonetheless, European stocks will not generate negative returns over this time frame because European benchmarks already discount a significant portion of the negative news, as illustrated by the surge in their earnings yield (Chart 11). Importantly, inflation in Europe should peak over the summer as the commodity impulse is decelerating (Chart 11, bottom panel). Therefore, fears of stagflation will recede, which will help aggregate European shares (Chart 12). Chart 11European Stocks Already Discount A Lot
European Stocks Already Discount A Lot
European Stocks Already Discount A Lot
Chart 12Ebbing Stagflation Fears Will Help European Equities
Ebbing Stagflation Fears Will Help European Equities
Ebbing Stagflation Fears Will Help European Equities
The consequence of the additional slowdown in global growth is likely to be reflected in the relative performance of European cyclical sectors. Already, Swedish economic growth and asset prices have deteriorated (Chart 13). This poor performance does not bode well for cyclical assets, considering the heightened sensitivity of Swedish assets to the global industrial cycle. More signals point to downside for the cyclical/defensive split. While the short-term momentum of the performance of cyclicals relative to defensives is becoming oversold, its 40-week rate of change has yet to reach a paroxysm (Chart 14). Additionally, cyclicals have not experienced the kind of valuation discount associated with a full discounting of the economic and monetary headwinds described in the previous section (Chart 14, bottom panel). Chart 13Heed Sweden's Message
Heed Sweden's Message
Heed Sweden's Message
Chart 14Cyclicals Are Not Cheap Enough
Cyclicals Are Not Cheap Enough Cyclicals Are Not Cheap Enough
Cyclicals Are Not Cheap Enough Cyclicals Are Not Cheap Enough
The commodity sector is also at risk of a pullback. China’s economic slowdown is likely to hurt commodity demand. While this will not end the secular commodity bull market underpinned by a lack of supply capacity, it could easily cause a significant correction in commodity prices. If, as we anticipate, inflation slows this summer, the inflation-hedging demand for commodities will also pause. These dynamics would hurt mining stocks, which have avoided a serious pullback, as well as the energy sector. Thus, a correction in commodities would cause additional weaknesses for the cyclicals-to-defensives ratio (Chart 15). Yields create a supplemental risk. Historically, rising US yields and inflation expectations correlate with an outperformance of cyclical shares. However, in 2022, cyclicals have bifurcated from yields and CPI swaps (Chart 16), because higher yields currently do not signal reflation but stagflation. If yields rise further, it will hurt growth prospects and damage cyclicals. If they fall, it will likely reflect increasing growth fears, which is also negative for cyclicals. Moreover, falling yields will hurt the profit margins of financials, which are a large component of cyclicals. Therefore, cyclicals seem stuck in a lose-lose situation with respect to yields. Chart 15The Commodity Link
The Commodity Link
The Commodity Link
Chart 16Yields and Cyclicals: A Lose-Lose Proposition
Yields and Cyclicals: A Lose-Lose Proposition
Yields and Cyclicals: A Lose-Lose Proposition
The strength in the dollar creates the last major hurdle for cyclicals. A strong dollar both tightens global financials conditions and indicates weak growth ahead. Consequently, it often heralds a period of softness in the cyclicals-to-defensives ratio (Chart 17). How should investors position themselves? We have a long-held preference for telecommunication services stocks over consumer discretionary equities and for healthcare relative to tech shares. These trades have respectively generated hefty gains of 32% and 13% since June 2021, but they are becoming long in the tooth (Chart 18). Chart 17A Strong Dollar Hurts Cyclicals
A Strong Dollar Hurts Cyclicals
A Strong Dollar Hurts Cyclicals
Chart 18Hedges Have Performed Strongly
Hedges Have Performed Strongly
Hedges Have Performed Strongly
Related Report European Investment StrategyThe Great Rotation As an alternative, we recommend investors stay nimble and use our Excess Returns Rotation Approach expanded in a Special Report two months ago. Below, you will find the new trades suggested by this process. Bottom Line: Cyclicals remain vulnerable. They have not reached the kind of valuation discount necessary to compensate investors for weaker growth and tighter monetary policy. To hedge against these risks, we recommended selling consumer discretionary relative to telecom stocks and tech shares relative to healthcare. However, investors should not add to those trades to mitigate against further weaknesses in cyclical stocks. Instead, investors should focus on relative rotational patterns (see next section). Mathieu Savary, Chief European Strategist Mathieu@bcaresearch.com Excess Returns Rotation Maps: An Update1 European Investment Styles The most noteworthy move comes from small-cap stocks, going from the “Lagging” quadrant to the “Leading” one rapidly (Chart 19). This is consistent with our view that European small-cap equities’ outperformance has further to run. The attractiveness of value stocks is thinning relative to growth stocks (Table 1). Chart 19Relative Rotation Graph: European Investment Styles
Plenty Of Risks For Cyclical Stocks
Plenty Of Risks For Cyclical Stocks
Table 1European Investment Styles Positioning
Plenty Of Risks For Cyclical Stocks
Plenty Of Risks For Cyclical Stocks
Trade Recommendations (12-Month Horizon): Volatility stocks relative to momentum (unchanged) Small-cap stocks relative to momentum (new) European Sectors Chart 20 illustrates the wild ride in European equity markets in the wake of the Ukraine/Russia conflict. Most sectors experienced violent swings, moving rapidly across several quadrants. Only consumer discretionary, tech, and utilities stocks have remained in the same quadrant, the former two in “Lagging” and the latter in “Leading.” Interestingly, the European energy sector has moved into the “Weakening” quadrant (Table 2). We are taking profit on our Long Energy / Short Financials recommendation. It delivered 14% returns since mid-February and is getting long in the tooth. Chart 20Relative Rotation Graph: European Sectors
Plenty Of Risks For Cyclical Stocks
Plenty Of Risks For Cyclical Stocks
Table 2European Sectors Positioning
Plenty Of Risks For Cyclical Stocks
Plenty Of Risks For Cyclical Stocks
Trade Recommendations (12-Month Horizon): Materials over energy (unchanged) Energy over financials (unchanged) Tech over communication services (unchanged) Utilities over healthcare (new) Communication services over healthcare (new) Consumer discretionary over healthcare (new) European National Markets Sectoral biases dictate the rotational patterns exhibited by European national bourses (Chart 21). The cyclicality of the German, French, and Italian markets caused them to lag behind their European counterparts. Meanwhile, the Dutch market remains solidly in the Lagging quadrant, mirroring tech equities. Only Spain and Sweden have shown signs of improvement over the past twelve weeks and should outperform the European benchmark over the short term (Table 3). Chart 21Relative Rotation Graph: European National Markets
Plenty Of Risks For Cyclical Stocks
Plenty Of Risks For Cyclical Stocks
Table 3European National Markets Positioning
Plenty Of Risks For Cyclical Stocks
Plenty Of Risks For Cyclical Stocks
Trade Recommendations (12-Month Horizon): UK stocks over Dutch ones (new) UK stocks over French ones (new) Italian stocks over Swedish ones (new) UK stocks over Swedish ones (new) French Elections: Preparing For The Second Round The first round of the French presidential elections did not surprise. As in 2017, incumbent President Emmanuel Macron will face Marine Le Pen in the second round. Beyond this expected outcome, two important takeaways will be crucial in the second round: The collapse of traditional right-wing (Les Républicains) and left-wing (Parti Socialiste) parties. Far-left candidate Jean-Luc Mélenchon surprised to the upside with 22% of votes, right behind Marine Le Pen. The key implication is that the vote transfer has become more favorable to Macron (Diagram 1). In 2017, Marine Le Pen created the surprise and bested center-right candidate François Fillon by the narrowest of margins. As a result, Le Pen’s attempt to appeal to Fillon’s voters was a real threat. Today, the third largest pool of voters belongs to far-left candidate Mélenchon, who has already called upon his voters “not to give a single vote to Marine Le Pen.” Diagram 1Extrapolating France’s First-Round Election To The Second Round
Plenty Of Risks For Cyclical Stocks
Plenty Of Risks For Cyclical Stocks
How does it translate into voting intentions for the second round? Assuming a full transfer of votes from the defeated candidates based on the support they made public, Macron will crush Marine Le Pen as he did in 2017. However, this is unlikely, since many voters feel stuck between a rock and a hard place, and may decide not to vote. Related Report European Investment StrategyFrance: Macron And Macro Assuming Macron obtains only half of the voting intentions from other parties, while Marine Le Pen retains the full support from other far-right candidates’ voters, acquires half of the center-right votes, and secures a quarter of Mélenchon’s votes, the outcome will be much narrower at 53.4% vs. 46.6% in favor of Macron. This is in line with national polls. Two weeks ago, we presented the investment implications of a second Macron mandate. Since then, we have received many questions about the market consequences should Marine Le Pen enjoy a surprise victory. While this is not our base-case, we cannot rule out the possibility of a negative shock to the markets. Chart 22A Le Pen Surprise Victory Would Hurt The Euro
A Le Pen Surprise Victory Would Hurt The Euro
A Le Pen Surprise Victory Would Hurt The Euro
The only certainty within this very uncertain outcome is that Marine Le Pen would be constrained by a strong opposition in the Assemblée Nationale. Although she has changed her stance on “Frexit,” her presidency would undoubtfully carry an increased geopolitical risk within the European Union (EU) and hurt European unity and integration efforts. Thus, the resulting French isolationism would be synonymous with a weaker euro (Chart 22). French assets would be de-rated because her presidency would reverse previous reform efforts, which would hurt trend GDP growth, productivity, and the role of France within the EU. These trends are not only negative for stocks, but they would also put long-term upward pressure on OATs yields as French public finances would deteriorate meaningfully under a populist Le Pen presidency. In this context, underweighting both French equities and government bonds would be warranted. Jeremie Peloso, Associate Editor JeremieP@bcaresearch.com Footnotes Tactical Recommendations Cyclical Recommendations Structural Recommendations
Listen to a short summary of this report. Executive Summary The Currency And Interest Rates: On A Collision Course?
The Currency And Interest Rates: On A Collision Course?
The Currency And Interest Rates: On A Collision Course?
The dip in the Swedish krona has priced in a recession in the domestic economy. If a contraction does indeed occur, the impact on the currency is already a fait accompli. If it does not, the currency is poised for a coiled spring rebound. Fundamentally, the krona is cheap, and there is a dearth of SEK bulls, which is positive from a contrarian perspective. The Riksbank’s mandate is price stability. Given inflationary pressures and a weak currency, the Riksbank will have no choice but to turn more hawkish or lose credibility (Feature chart). There is potential for a brewing demand boom in Sweden – via refugees from Ukraine and Russia – that would increase government outlays and strengthen the need for higher rates. Admittedly, catalysts for SEK weakness remain in place – geopolitical tensions, rising energy costs and a stampede into safe-haven assets, including the dollar. Our strategy therefore is to buy on dips. We could be on the precipice of a capitulation phase that will present investors with an opportunity to accumulate the SEK at a fire-sale price. RECOMMENDATIONS INCEPTION LEVEL inception date RETURN Short chf/sek 10.15 2022-04-14 0.27 Bottom Line: Sweden is a small, open economy, very sensitive to global economic conditions. A recession is already priced by weakness in the SEK. Investors willing to tolerate volatility should buy the SEK on any further weakness. Feature Chart 1The SEK Tracks The DXY
The SEK Tracks The DXY
The SEK Tracks The DXY
The Riksbank has been one of the more dovish central banks, both within the G10 and globally. Policy rates in Sweden are still at the zero bound, while they are rising in many other countries. In the Riksbank’s latest monetary policy report, domestic inflationary pressures were characterized as transitory. As such, the repo rate would not be raised until the second half of 2024. The consequence of the Riksbank’s dovishness has been weakness in the Swedish krona, and a steep rise in inflation expectations. Most central banks are admitting that emergency policy settings are no longer appropriate in the current environment, especially after unprecedented monetary and fiscal stimulus. Yet, Sweden remains in the dovish camp. In this report, we argue that the Riksbank will have to raise rates sooner rather than later to maintain credibility and fend off inflationary pressures. The result of the Riksbank’s easy monetary policy has been the proliferation of massive carry trades, as investors sell the SEK and buy the dollar and/or other higher yielding currencies (Chart 1). As a small open economy, this could potentially unanchor longer-term inflation expectations, via a weak currency. Why Should The Riksbank Hike Rates? Chart 2The SEK Has Priced A Swedish Recession
The SEK Has Priced A Swedish Recession
The SEK Has Priced A Swedish Recession
Sweden is likely to experience a technical recession in the coming quarters. The new orders-to-inventories ratio has contracted sharply, underscoring that the manufacturing sector will deflate (Chart 2). As a small, open economy, the manufacturing sector holds the key to the business cycle. Despite this, our bias is that the Riksbank will overlook the temporary dip in economic activity for the following reasons: The currency has already acted as a relief valve, which should cushion further downside in manufacturing activity (Chart 3). This is especially beneficial in a world where purchasing managers’ indices are declining everywhere. By the same token, the incentive for a central bank to raise rates when inflation is rising and the currency is more compelling, compared to a regime where a stronger currency tightens monetary conditions. Chart 4 shows that is weak is krona has been a fluid conduit for higher inflation in Sweden. A stronger krona will cap rising inflation expectations. Chart 3SEK Weakness Has Been A Welcome Relief Valve
SEK Weakness Has Been A Welcome Relief Valve
SEK Weakness Has Been A Welcome Relief Valve
Chart 4SEK Weakness = High Imported Inflation
SEK Weakness Equals High Imported Inflation
SEK Weakness Equals High Imported Inflation
It is remarkable that the traditional relationship between the SEK and oil prices (which is positive) has broken down (Chart 5). This is because rising oil prices usually reflect strong global demand, which benefits Sweden. This time around, a weak SEK is a tax on the economy as energy prices soar. Chart 5The Energy Shock To Sweden Has Been Unusual
The Energy Shock To Sweden Has Been Unusual
The Energy Shock To Sweden Has Been Unusual
The Chinese credit impulse has bottomed, which is historically a good sign that Swedish central bankers can tolerate a stronger currency (Chart 6). Sweden’s biggest trade surplus is with the US, which in turn has the biggest trade deficit with China (Chart 7). As such, the relationship between the Swedish krona and the Chinese credit impulse is tightly knit. China’s zero COVID-19 policy is generating huge supply bottlenecks that are affecting inter-oceanic supply chains, but the pent-up demand once that ends could be tectonic. Chart 6The SEK Tracks The Chinese Credit Impulse
The SEK Tracks The Chinese Credit Impulse
The SEK Tracks The Chinese Credit Impulse
Chart 7Sweden Needs The US And China
Sweden Needs The US And China
Sweden Needs The US And China
The Riksbank’s mandate is to manage inflation expectations. Inflation is at 6%. The Riksbank’s own measure of resource utilization is at a level that has typically been associated with a much higher repo rate. The output gap is closing, raising the risk of a wage inflation spiral (Chart 8). Simply put, the Riksbank would have to raise interest rates or engender a crisis of confidence in monetary policy. Chart 8A Taylor Rule Approach Suggests Interest Rates Are Too Low
A Taylor Rule Approach Suggests Interest Rates Are Too Low
A Taylor Rule Approach Suggests Interest Rates Are Too Low
Finally, house prices are surging to record highs, on the back of very low mortgage rates and extremely accommodative monetary policy (Chart 9). Chart 9Low Rates Have Led To A Debt Binge And Housing Boom
Low Rates Have Led To A Debt Binge And Housing Boom
Low Rates Have Led To A Debt Binge And Housing Boom
A Potential Demand Boom The unemployment rate in Sweden remains above pre-pandemic levels. More importantly, it might rise in the coming quarters, but that would not be particularly worrisome. The reason is a potential increase in the labor dividend in Sweden, as new entrants increase the size of the labor force. First, the employment component of the manufacturing PMI index suggests employment growth should remain around 2% or so. There has been a tight correlation between employment growth in Sweden and the purchasing managers’ survey of the employment outlook (Chart 10). In our view, there is good reason to expect employment growth to remain resilient and in turn, stimulate demand. Related Report Foreign Exchange StrategyThe Unsung Case For The Euro Sweden has a long history of openness towards immigration compared to many other European countries. If we go back to the Syrian crisis several years ago, the number of asylum seekers skyrocketed to over 160,000 or circa 1.5% of the total population (Chart 11). This was a huge labor dividend. This time around, migrants from both Ukraine and Russia will add to the skilled pool of domestic workers. Some estimates suggest there could be as many as 200,000 immigrants, just from the current crisis. This said, it will also increase frictional unemployment, as new migrants integrate into the labor force and adopt a new language. Chart 10Employment Is Holding Up In Sweden
Employment Is Holding Up In Sweden
Employment Is Holding Up In Sweden
Chart 11There Is Potential For A Huge Labor Dividend
There Is Potential For A Huge Labor Dividend
There Is Potential For A Huge Labor Dividend
Foreign-born workers have been rising as a share of the Swedish labor force and now constitute about 20% of the total population (Chart 12). This growth dividend will be reaped for years to come. With the Social Democrats in power, upside surprises to immigration numbers are within a reasonable confidence interval of outcomes. In a nutshell, Sweden enjoys a relatively positive demographic outlook (Chart 13). Chart 12Foreign Workers Are Important
Foreign Workers Are Important
Foreign Workers Are Important
Chart 13Sweden Has A Demographic Dividend
Sweden Has A Demographic Dividend
Sweden Has A Demographic Dividend
The inflow of migrants has a mixed impact on inflation. While there is downward pressure on wages, due to an increase of lower-paying jobs, there is still upward pressure on housing and consumption, notwithstanding a fiscal boost as the government spends more on social services. Meanwhile, the unemployment rate among foreign-born people is around 16.2%. This means that the Phillips curve is flat for the first few years, before it starts to steepen. The Riksbank clearly understands these dynamics, which is why over the prior years, its stance has been dovish even when the Swedish economy has been holding up well. The difference this time is that inflation is surging, and the potential for cost-push pressures to translate into demand-pull inflation (via higher wages) is rising in Sweden. In our view, Governor Stefan Ingves will renormalize policy as quickly as possible, given that he is managing a small open economy with one of the cheapest currencies in the G10 universe, with a large footprint of imported inflation. Trading Strategy Chart 14The Riksbank Will Have To Raise Rates
The Riksbank Will Have To Raise Rates
The Riksbank Will Have To Raise Rates
Our currency strategy is to buy the SEK on weakness. The recent dovish path by the ECB will mean that the Riksbank will tread very carefully in sounding too hawkish. However, every real-time indicator of its mandate suggests emergency policy settings are no longer necessary. Real rates are falling in Sweden relative to both the US and the euro area. As such, the SEK has not yet priced a shift in the Riksbank's policy setting. (Chart 14). This suggests that while the carry cost is high from being long the SEK at current levels, a capitulation phase will present investors with an opportunity to accumulate the SEK at a fire-sale price. As for Long EUR/SEK, the cross could overshoot, but will head lower on a 12–18-month horizon. Long SEK/CHF positions are also attractive. Chester Ntonifor Foreign Exchange Strategist chestern@bcaresearch.com Trades & Forecasts Strategic View Cyclical Holdings (6-18 months) Tactical Holdings (0-6 months) Limit Orders Forecast Summary
As expected, the ECB did not announce any changes to its policy at the conclusion of its meeting on Thursday. Instead, it highlighted that elevated uncertainty requires flexibility, gradualism and optionality in its conduct of monetary policy. The central…