Europe
According to BCA Research’s European Investment Strategy service, European yields will sport a structural uptrend for the remainder of the decade. Three forces support this assertion: Profligate governments: Europe is not as fiscally conservative as…

Executive Summary Expansion In European Defense
Expanding Military Spending
Expanding Military Spending
European yields have significant upside on a structural basis. European government spending will remain generous, which will boost domestic demand; meanwhile, lower global excess savings will lift the neutral rate of interest and structurally higher inflation will boost term premia. A short-term pullback in yields is nonetheless likely; however, it will not short-circuit the trend toward higher yields on a long-term basis. CYCLICAL INCEPTION DATE RETURN SINCE INCEPTION (%) COMMENT EQUITIES Favor European Aerospace & Defense Over European Benchmark 3/28/2022 Favor European Aerospace & Defense Over Other Industrials 3/28/2022 Bottom Line: Investors should maintain a below-benchmark duration in their European fixed-income portfolios. Higher yields driven by robust domestic demand and strong capex also boost the appeal of industrial, materials, and financials sectors. Aerospace and defense stocks are particularly appealing. The economic impact of the war in Ukraine continues to drive the day-to-day fluctuations of the market; however, investors cannot ignore the long-term trends in the economy and markets. The direction of bond yields over the coming years is paramount among those questions. Does the recent rise in yields only reflect the current inflationary shock caused by both supply-chain impairments and commodity inflation—that is, is it finite? Or does that rise mirror structural forces and therefore have much further to run? We lean toward yields having more upside over the coming years, propelled higher by structural forces. As a result, we continue to recommend investors structurally overweight sectors that benefit from a rising yield environment, such as financials and industrials, while also favoring value over growth stocks. The defense sector is particularly attractive. Three Structural Forces Behind Higher Yields The current supply-chain disruptions and inflation crises have played a critical role in lifting European yields. However, a broader set of factors underpins our bearish bond view—namely, the lack of fiscal discipline accentuated by the consequences of the Ukrainian war, the likely move higher in the neutral rate of interest generated by lower savings, and the long-term uptrend in inflation. Profligate Governments Chart 1
The Lasting Bond Bear Market
The Lasting Bond Bear Market
Larger government deficits will contribute to higher European yields. Europe is not as fiscally conservative as it was before the COVID-19 crisis. Establishment politicians must fend off pressures caused by voters attracted to populist parties willing to spend more. Consequently, IMF estimates published prior to the Ukrainian war already tabulated that, for the next five years, Europe’s average structurally-adjusted budget deficit would be 2.4% of GDP wider than it was last decade (Chart 1). Chart 2Expanding Military Spending
Expanding Military Spending
Expanding Military Spending
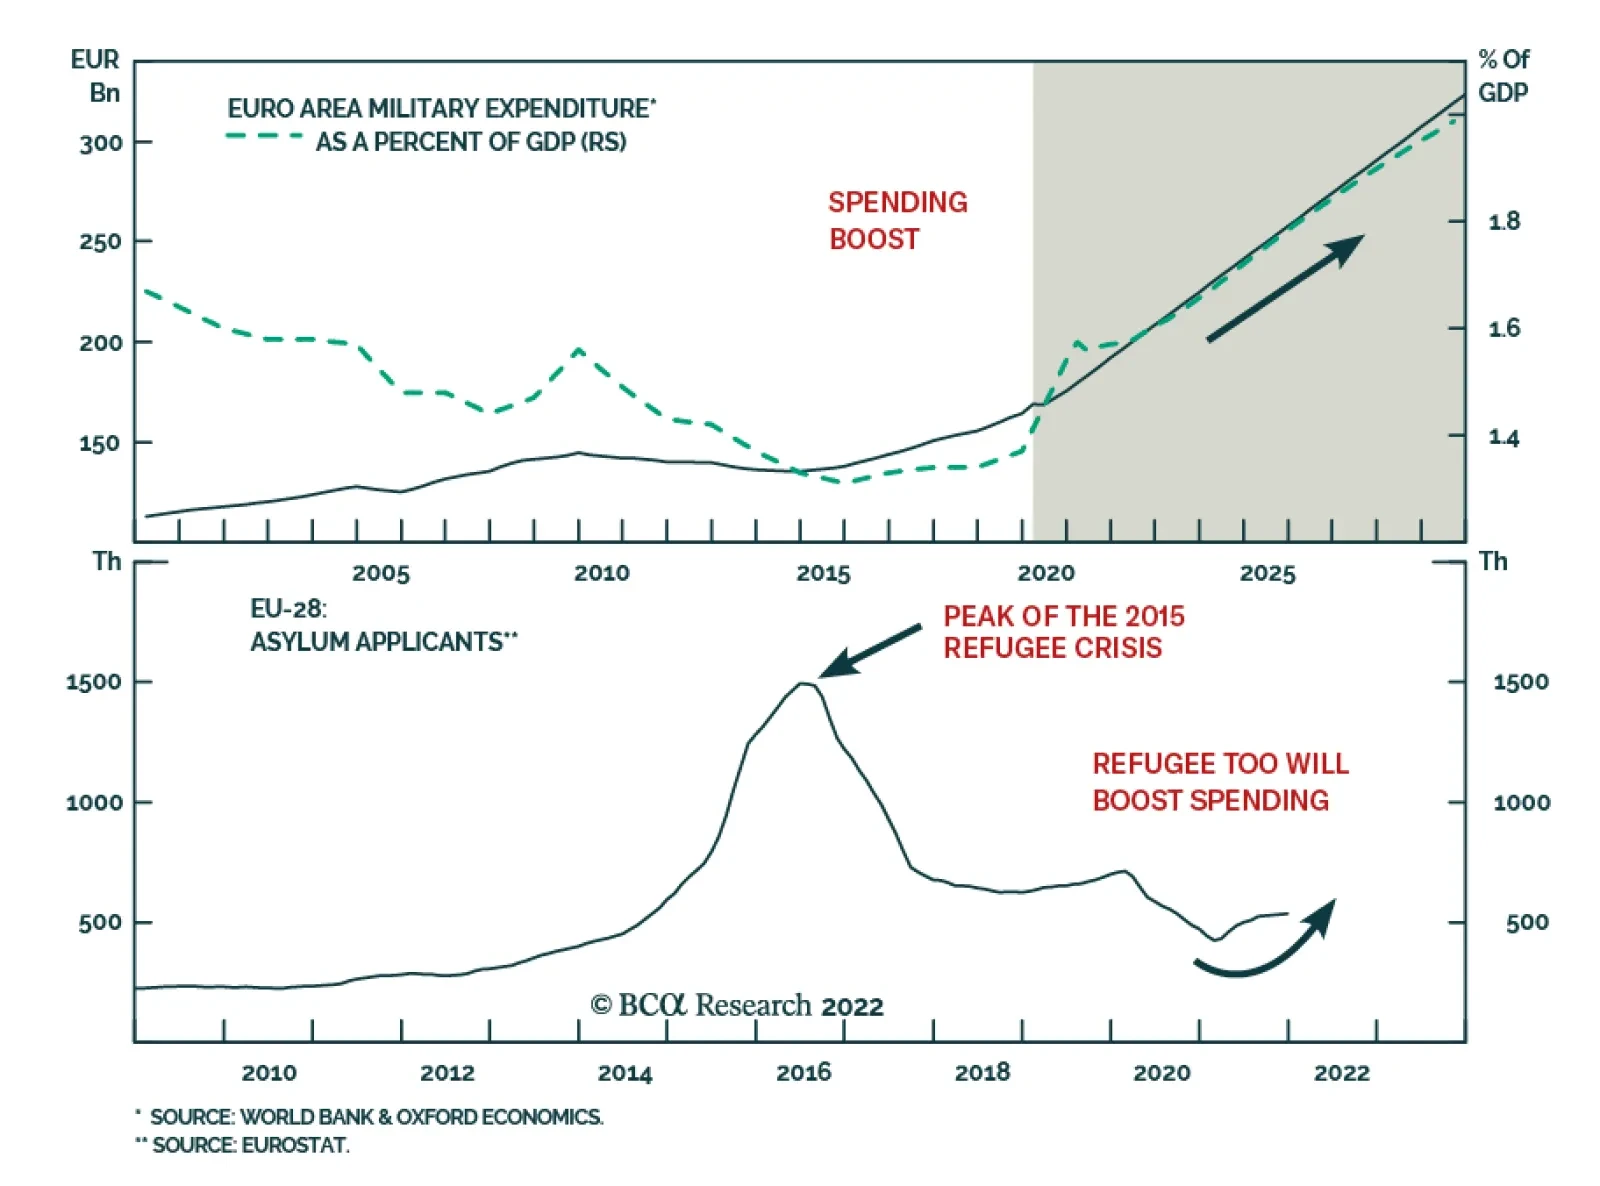
The Ukrainian crisis is also prompting a fiscal response that will last many years. Europe does not want to stand still in the face of the Russian threat. Today, Western Europe’s military spending amounts to 1.5% of GDP, or €170 billion. This is below NATO’s threshold of 2% of GDP. Rebuilding military capacity will take large investments. Thus, European nations are likely to move toward that target and even go beyond. Conservatively, if we assume that military spending hits 2% of GDP by the end of the decade, it will rise above €300 billion (Chart 2). Weaning Europe off Russian energy will also prevent a significant fiscal retrenchment. This effort will take two dimensions. The first initiative will be to build infrastructures to receive more LNG from the rest of the world to limit Russian intake. Constructing regasification and storage facilities as well as re-directing pipeline networks be costly and require additional CAPEX over the coming years. The second initiative will be to double-up on green initiatives to decrease the need for fossil fuel. The NGEU funds are already tackling this strategic goal. Nonetheless, the more than €100 billion reserved for renewable energy and energy preservation initiatives was only designed to kick-start hitting the EU’s CO2 emission target for 2050. Accelerating this process not only helps cutting the dependence on Russian energy, but it is also popular with voters. The path of least resistance is to invest in that sphere and to increase such investment beyond the current sums from the NGEU program. The last fiscal push is likely to be more temporary. The UN estimates that four million refugees have left Ukraine, with the vast majority settling in the EU. Accommodating that many individuals will be costly and will add to government spending across the region. Even if mostly transitory, this spending will have an important impact on activity. Larger fiscal deficits push yields higher for two reasons. Greater sovereign issuance that does not reflect a negative shock to the private sector will need to offer higher rates of returns to attract investors. Moreover, greater government spending will boost aggregate demand, which increases money demand. As a result, the price of money will be higher than otherwise, which means that interest rates will rise—as will yields. Decreasing Global Excess Savings Decreasing global excess savings will put upward pressure on the global neutral rate of interest, a phenomenon Peter Berezin recently discussed in BCA’s Global Investment Strategy service. This process will be visible in Europe as well. The US will play an important role in the process of lifting global neutral rates because the dollar remains the foundation of the global financial system. Compared to last decade, the main drag on US savings is that household deleveraging is over. As households decreased their debt load following the global financial crisis, a large absorber of global savings vanished, putting downward pressure on the price of those savings. Today, US households enjoy strong net worth equal to 620% of GDP and have resumed accumulating debt (Chart 3). Consequently, the downward trend in US total private nonfinancial debt loads has ended. The US capex cycle is likely to experience a boost as well. As Peter highlighted, the US capital stock is ageing (Chart 4). Moreover, the past five years have witnessed three events that underscore the fragility of global supply-chains: a disruptive Sino-US trade war, a pandemic, and now a military conflict. This realization is causing firms to move from a “just-in-time” approach to managing supply-chains to a “just-in-case” one. The process of building redundancies and localized supply chains will add to capex for many years, pushing up ex-ante investments relative to savings, and thus, interest rates. Chart 3US Households Are Done Deleveraging
US Households Are Done Deleveraging
US Households Are Done Deleveraging
Chart 4An Ageing US Capital Stock
An Ageing US Capital Stock
An Ageing US Capital Stock
China’s current account surplus is also likely to decline. For the past two decades, China has been one of the largest providers of savings to the global economy. This is a result of an annual current account surplus that first averaged $150 billion per year from 2000 to 2010 and then $180 billion from 2010 to 2020, and now stands at $316 billion. Looking ahead, China wants to use fiscal policy more aggressively to support demand, which often boosts imports without increasing exports. Also, more domestically-oriented supply chains around the world will limit the growth of Chinese exports. This combination will compress Chinese excess savings, which will place upward pressure on the global neutral rate of interest. Europe is not immune to declining savings. Over the past ten years, the Euro Area current account surplus has averaged €253 billion. Germany’s current account surplus stood at 7.4% of GDP before the pandemic. Those excess savings depressed global rates in general and European ones especially (Chart 5). As in the US, Europe’s capital stock is ageing and needs some upgrade (Chart 6). Moreover, greater government spending boosts aggregate demand. Because investment is a form of derived demand, stronger overall spending promotes capex to a greater extent. Thus, Europe’s public infrastructure push will lift private capex and curtail regional excess savings beyond the original drag from wider fiscal deficits. Additionally, the European population is getting older and will have to tap into their excess savings as they retire. This process will further diminish Europe’s current account surplus, that is, its excess savings. Chart 5Excess Savings Cap Relative Yields
Excess Savings Cap Relative Yields
Excess Savings Cap Relative Yields
Chart 6An Ageing European Capital Stock Too
An Ageing European Capital Stock Too
An Ageing European Capital Stock Too
Structurally Higher Inflation BCA believes that the current inflation surge is temporary and mostly reflects a mismatch between demand and supply. However, we also anticipate that, once this inflation climax dissipates, inflation will settle at a level higher than that prior to COVID-19 and will trend higher for the remainder of this decade. Labor markets will tighten going forward because policy rates remain well below neutral interest rates. Output gaps will close because of robust government spending and capex. This will keep wage growth elevated in the US and reanimate moribund salary gains in the Eurozone (Chart 7). This process, especially when combined with less efficient global supply chains and lower excess savings (which may also be thought of as deficient demand), will maintain inflation at a higher level than in the past two decades. Higher inflation will lift yields for two main reasons. First, investors will require both greater long-term inflation compensation and higher policy rates than in the past. Second, higher inflation often generates greater economic volatility and policy uncertainty, which means that today’s minimal term premia will increase over time (Chart 8). Together, these forces will create a lasting upward drift in yields. Chart 7European Wages Will Eventually Revive
European Wages Will Eventually Revive
European Wages Will Eventually Revive
Chart 8Term Premia Won't Stay This Low
Term Premia Won't Stay This Low
Term Premia Won't Stay This Low
Bottom Line: European yields will sport a structural uptrend for the remainder of the decade. Three forces support this assertion. First, European government spending will remain generous, supported by infrastructure and military spending. Second, global excess savings will recede as US consumer deleveraging ends, global capex rises, and the Chinese current account surplus narrows. Europe will mimic this process in response to an ageing population, greater government spending, and capex. Finally, inflation is on a structural uptrend, which will warrant higher term premia across the world. Not A Riskless View There are two main risks to this view, one in the near-term and one more structural. The near-term risk is the most pertinent for investors right now. Global yields may have embarked on a structural upward path, but a temporary pullback is becoming likely. As Chart 9 highlights, the expected twelve-month change in the US policy rate is at the upper limit of its range of the past three decades. Historically, when the discounter attains such a lofty level, a retrenchment in Treasury yields ensues, since investors have already discounted a significant degree of tightening. The same is true in Europe, where the ECB discounter is also consistent with a temporary pullback in German 10-year yields (Chart 10). Chart 9Discounters Point To A Treasury Rally...
Discounters Point To A Treasury Rally...
Discounters Point To A Treasury Rally...
Chart 10... And A Bund Rally
... And A Bund Rally
... And A Bund Rally
Chart 11A Mixed Message
A Mixed Message
A Mixed Message
Investor positioning confirms the increasing tactical odds of a yield correction. The BCA Composite Technical Indicator for bonds is massively oversold, which often anticipates a bond rally (Chart 11). This echoes the signals from the JP Morgan surveys that highlight the very low portfolio duration of the bank’s clients. However, the BCA Bond Valuation Index suggests that bonds remain expensive. Together, these divergent messages point toward a temporary bond rally, not a permanent one. The longer-term risk is regularly highlighted by Dhaval Joshi in BCA’s Counterpoint service. Dhaval often shows that the stock of global real estate assets has hit $300 trillion or 330% of global GDP. Real estate is a highly levered asset class and global cap rates have collapsed with global bond yields. With little valuation cushion, real estate prices could become very vulnerable to higher yields. Nevertheless, real estate is also a real asset that produces an inflation hedge. Moreover, rental income follows global household income, and stronger aggregate demand will likely lift median household income especially in an environment in which globalization has reached its apex and populism remains a constant threat. Bottom Line: Global investor positioning has become stretched; therefore, a near-term pullback in yield is very likely, especially as central bank expectations have become aggressive. Nonetheless, a bond rally is unlikely to be durable in an environment in which bonds are expensive and in which growth and inflation will remain more robust than they were last decade. A greater long-term risk stems from expensive global real estate markets. However, real estate is sensitive to global economic activity and inflation, which should allow this asset class ultimately to weather higher yields. Investment Conclusions An environment in which yields rise will inflict additional damage on global bond portfolios. This is especially true in inflation-adjusted terms, since real yields stand at a paltry -0.76% in the US and -2.5% in Germany. Hence, we continue to recommend investors maintain a structural below-benchmark duration bias in their portfolios. Nonetheless, investors with enough flexibility in their investment mandate should take advantage of the expected near-term pullback in yields. Those without this flexibility should use the pullback as an opportunity to shorten their portfolio duration. Higher yields will also prevent strong multiple expansion from taking place; hence, the broad stock market will also offer paltry long-term real returns. Another implication of rising yields, especially if they reflect stronger growth and rising neutral interest rates, is to underweight growth stocks relative to value stocks (Chart 12). Growth stocks are expensive and very vulnerable to the pull on discount rates that follows rising risk-free rates. Meanwhile, stronger economic activity driven by infrastructure spending and capex will help the bottom line of industrial and material firms. Financials will also benefit. Higher yields help this sector and robust capex also boosts loan growth, which will generate a significant tailwind for banking revenues. Hence, rising yields will boost the attractiveness of banks, especially after they have become significantly cheaper because of the Ukrainian war (Chart 13). Chart 12Favor Value Over Growth
Favor Value Over Growth
Favor Value Over Growth
Chart 13Bank Remain Attractive
Bank Remain Attractive
Bank Remain Attractive
Related Report European Investment StrategyFallout From Ukraine Finally, four weeks ago, we highlighted that defense stocks were particularly appealing in today’s context. The re-armament of Europe in response to secular tensions with Russia is an obvious tailwind for this sector. However, it is not the only one. A long-term theme of BCA’s Geopolitical Strategy service is the expanding multipolarity of the world. The end of an era dominated by a single hegemon (the US) causes a rise in geopolitical instability and tensions. The resulting increase in conflict will invite a pickup in global military spending. Chart 14Defense Will Outshine The Rest
Defense Will Outshine The Rest
Defense Will Outshine The Rest
European defense and aerospace stocks are expensive, with a forward P/E ratio approaching the top-end of their range relative to the broad market and other industrials. However, their relative earnings are also depressed following the collapse in airplane sales caused by the pandemic. Our bet on the sector is that its earnings will outperform the broad market as well as other industrials because of the global trend toward military buildup. As relative earnings recover their pandemic-induced swoon, so will relative equity prices (Chart 14). Bottom Line: Higher yields warrant a structural below-benchmark duration in European fixed-income portfolios, even if a near-term yield pullback is likely. As a corollary, value stocks will outperform growth stocks while industrials, materials, and financials will also beat a broad market whose long-term real returns will be poor. Within the industrial complex, aerospace and defense equities are particularly appealing because a global military buildup will boost their earnings prospects durably. Mathieu Savary, Chief European Strategist Mathieu@bcaresearch.com Tactical Recommendations Cyclical Recommendations Structural Recommendations Closed Trades
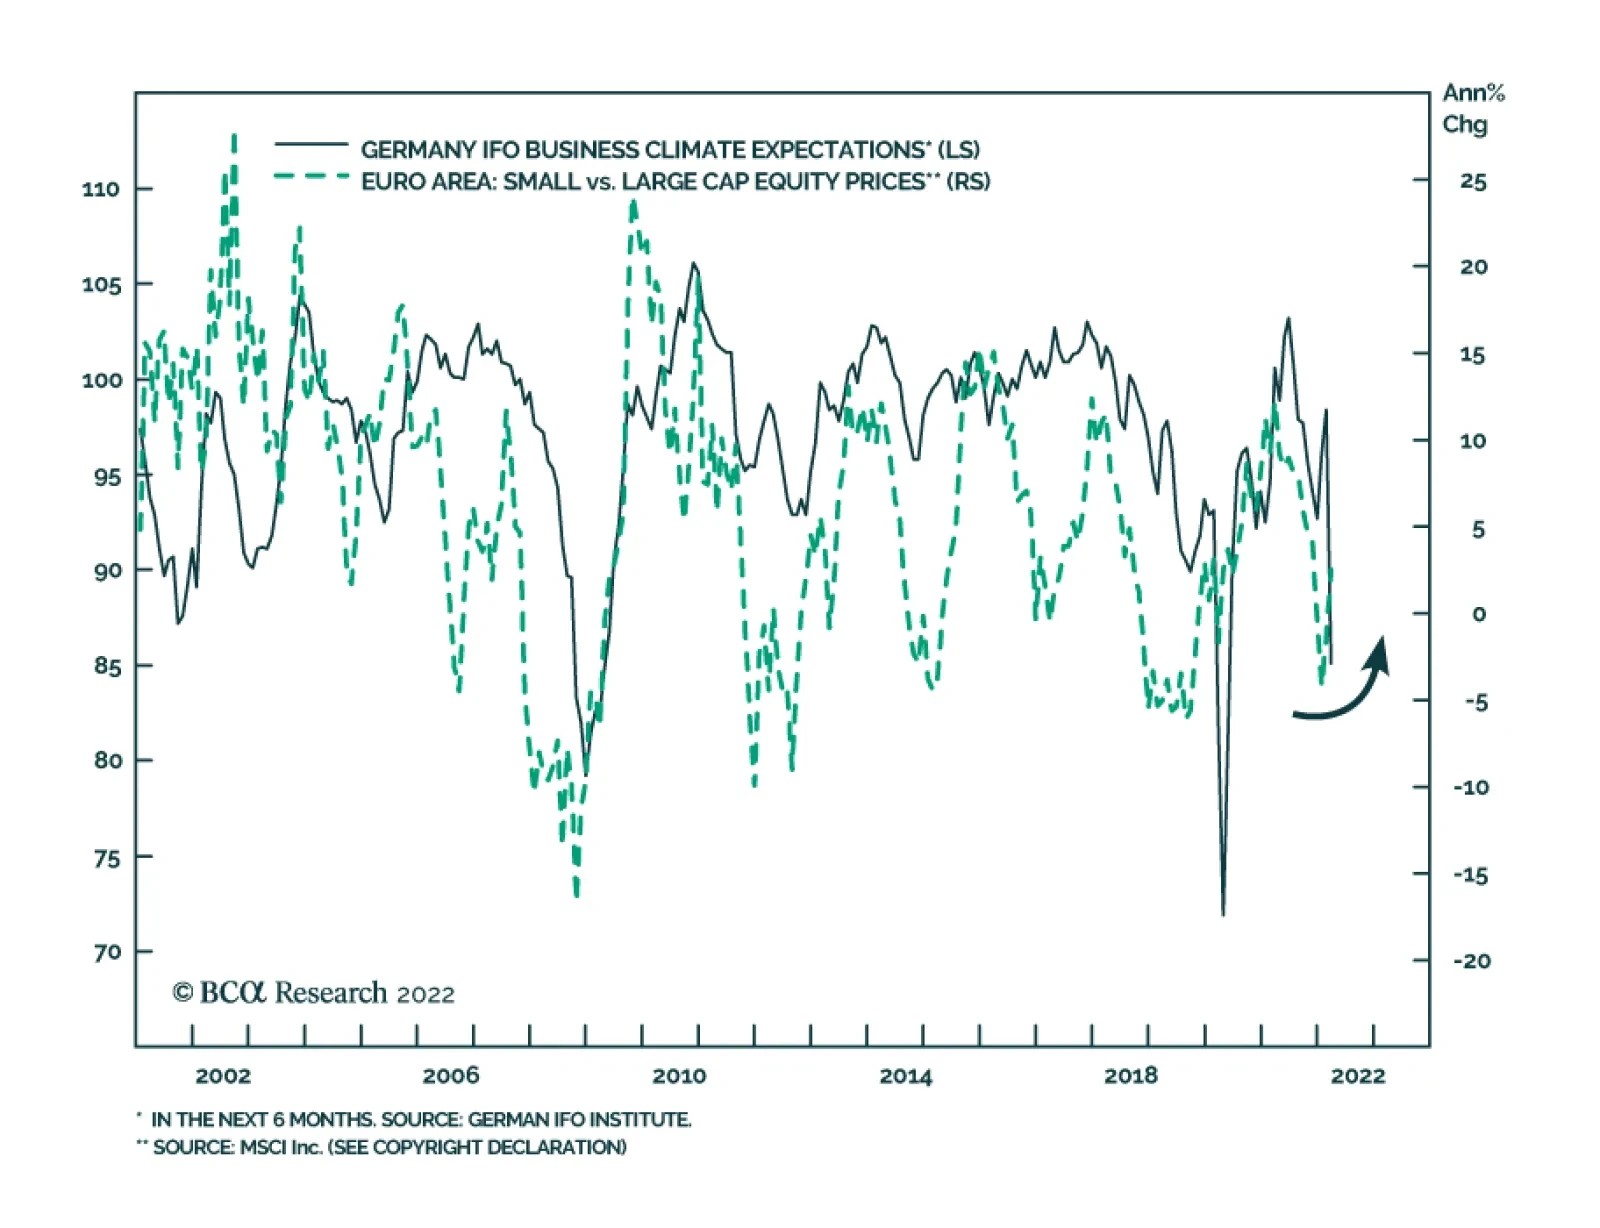
The German Ifo Business Climate Indicator dropped 7.7 points to 90.8 in March, falling below expectations of a smaller decline to 94.2. Both the Current Assessment and – to a greater extent – the Expectations components deteriorated. Moreover, the business…
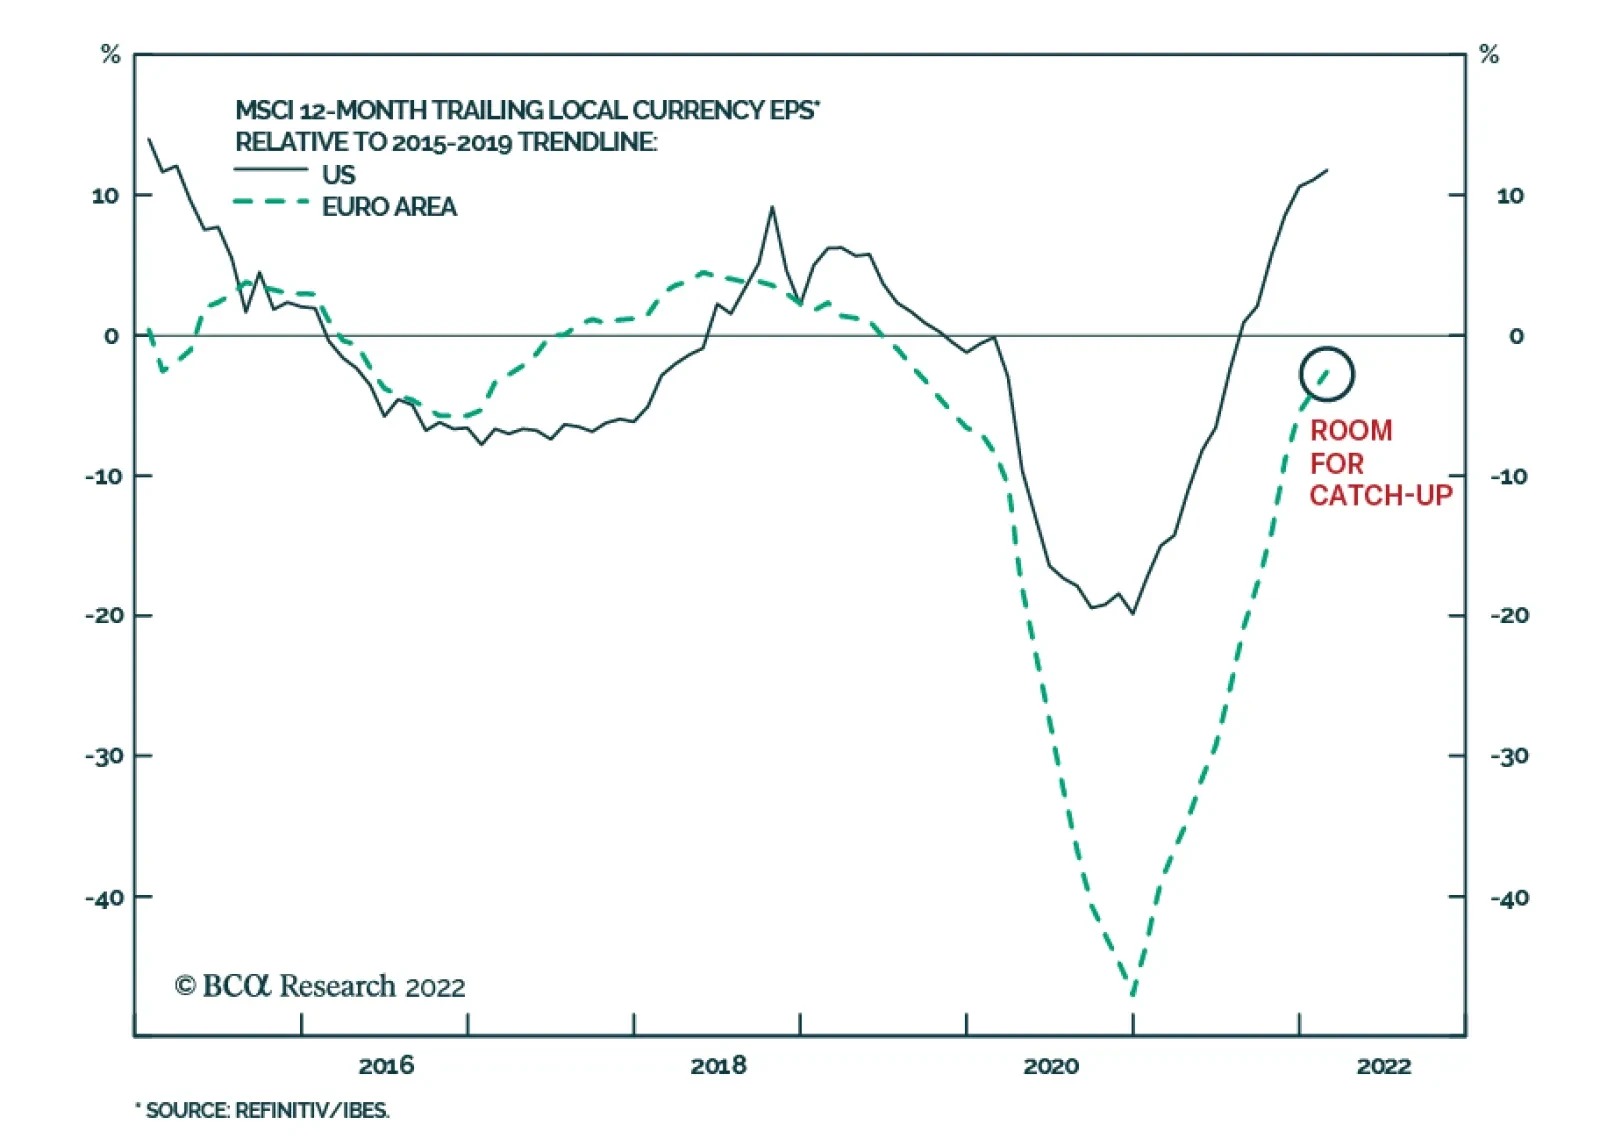
The economic expansion is in a more advanced stage in the US than it is in the Eurozone. US GDP recovered to its Q4 2019 pre-Covid level in the second quarter of 2021, and by the fourth quarter it was 3.2% above where it was prior to the pandemic. The Euro…
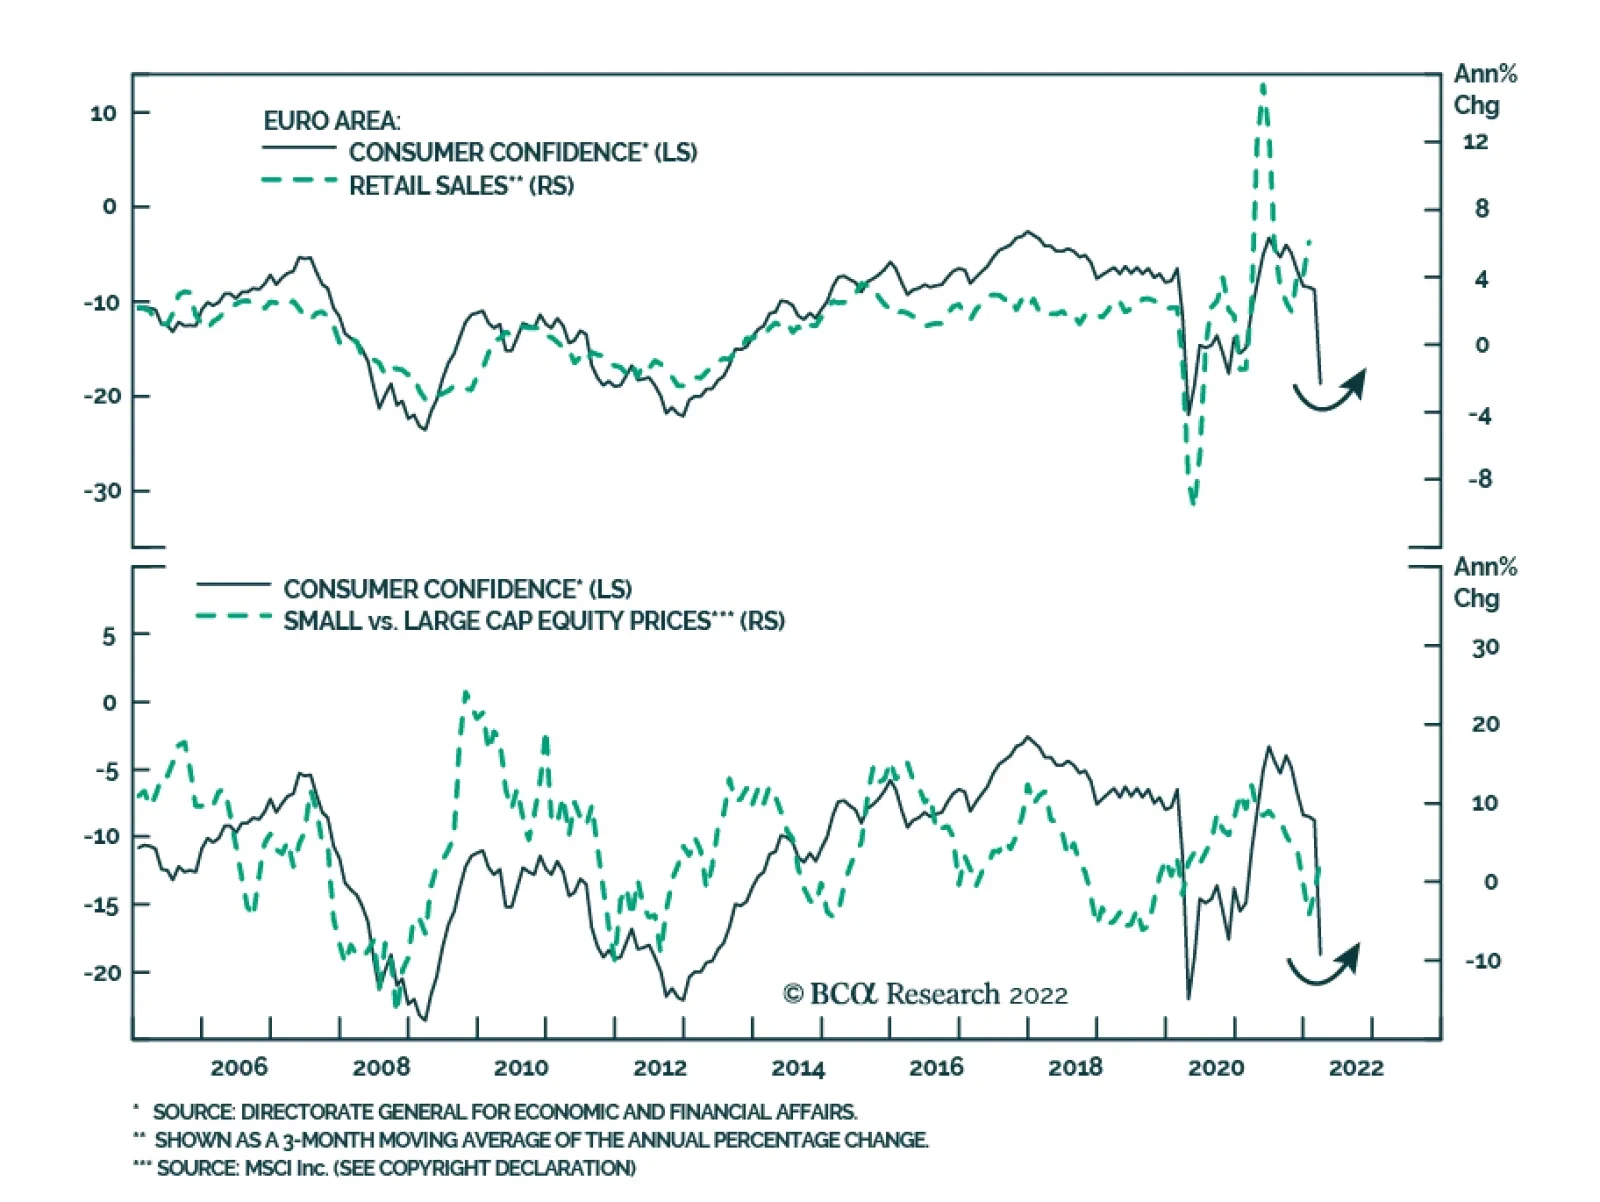
Eurozone consumer confidence plunged 10 points to -18.7 in March, falling below estimates of -12.9. The deterioration highlights the negative effect of surging energy prices amid the war in Ukraine. Indeed, earlier this week our European Investment…
We do not expect the relief measures announced in UK Chancellor of the Exchequer Rishi Sunak’s spring statement to offset headwinds from rising taxes, higher energy prices, and higher interest rates (see The Numbers). Nevertheless, the announcement highlights…
UK headline CPI inflation surged to a 30-year high of 6.2% y/y in February, beating estimates of 6.0%. Similarly, core CPI inflation jumped by 0.8 percentage points to 5.2% while the retail price index rose 8.2% y/y following 7.8% y/y in the previous month.…

BCA Research’s European Investment Strategy service concludes that European headline inflation will rise further before peaking this summer. European headline inflation is set to exceed 7% this summer and core CPI will increase between 2.8% and 3.2% by the…
Executive Summary Ebbing Stagflation Fear Will Prompt Rerating
Ebbing Stagflation Fear Will Prompt Rerating
Ebbing Stagflation Fear Will Prompt Rerating
European inflation will rise further before peaking this summer. Core CPI will reach between 2.8% and 3.2% by year-end before receding. The combination of stabilizing growth and the eventual peak in inflation will cause stagflation fears to recede. European assets have greater upside. Cyclicals, small-caps, and financials will be major beneficiaries of declining stagflation fears. The underperformance of UK small-cap stocks is nearing its end. UK large-cap equities are a tactical sell against Eurozone and Swedish shares. TACTICAL INCEPTION DATE RETURN SINCE INCEPTION (%) COMMENT EQUITIES Buy European & Swedish Equities / Sell UK Large Caps Stocks 03/21/2022 Bottom Line: Stagflation fears are near an apex as commodity inflation recedes. A peak in these fears will allow European asset prices to perform strongly over the coming quarters. Despite a glimmer of hope that Ukraine and Russia may find a diplomatic end to the war, the reality on the ground is that the conflict has intensified. Although the hostilities are worsening and the European Central Bank (ECB) surprised the markets with its hawkish tone, European assets have begun to catch a bid. The crucial question for investors is whether this rebound constitutes a new trend or a counter-trend move? Our view about Europe is optimistic right now. The path is not a direct line upward. The recent optimism about the outcome of the Russia-Ukraine talks is premature; however, we are getting to the point when markets are becoming desensitized to the war and energy prices are losing steam. Moreover, the increasing number of statements by Chinese economic authorities pointing toward greater stimulus and support to alleviate the pain created by China’s stringent zero-COVID policy are another positive omen. Higher Inflation For Some Time European headline inflation is set to exceed 7% this summer and core CPI will increase between 2.8% and 3.2% by the end of 2022. Related Report European Investment StrategySpring Stagflation The main force that will push inflation higher in Europe remains commodity prices. Energy inflation is extremely strong at already 32% per annum (Chart 1). It will increase further because of both the recent jump in Brent prices to EUR122/bbl on March 8 and the upsurge in natural gas prices, which were as high as EUR212/MWh on the same day before settling to EUR106/MWh last Friday. The impact of energy prices will not be limited to headline inflation and will filter through to core CPI (Chart 1, bottom panel). The average monthly percentage change in the Eurozone core CPI inflation stands at 0.25% for the past six months (compared to an average of 0.09% over the past ten years), or the period when energy-prices inflation has been the strongest. Assuming monthly inflation remains at such an elevated level, annual core CPI will hit 3.3% in the Eurozone by the end of 2022 (Chart 2). Chart 2Core CPI to Rise Further
Core CPI to Rise Further
Core CPI to Rise Further
Chart 1Energy Inflation: Alive And Well
Energy Inflation: Alive And Well
Energy Inflation: Alive And Well
The picture is not entirely bleak. Many forces suggest that these inflationary forces will recede before year-end in Europe. Energy prices are peaking, which is consistent with a diminishing inflationary impulse from that space. We showed two weeks ago that the massive backwardation of oil curves, the heavy bullish sentiment, and the high level of risk-reversals were consistent with a severe but transitory adjustment in the energy market. Oil markets will experience further volatility, as uncertainty around peace/ceasefire negotiations continues to evolve in Ukraine. Nonetheless, the peak in energy prices has most likely been reached. BCA’s energy strategists expect Brent to average $93/bbl in 2022 and in 2023. The potential for a decline in headline CPI after the summer is not limited to energy prices. Dramatic moves in the commodity market, from metals to agricultural resources, have made headlines. Yet, the rate of change of commodity prices is decelerating, hence, the commodity impulse to inflation is slowing sharply. As Chart 3 shows, this is a harbinger of a slowdown in European headline CPI. Related Report European Investment StrategyFallout From Ukraine Looking beyond commodity markets, the recent deceleration in European economic activity also suggests weaker inflation in the latter half of 2022. Germany will likely suffer a recession because it already registered a negative GDP growth in Q4 2021. Q1 2022 growth will be even worse because of the country’s high exposure to both China and fossil fuel prices. More broadly, the recent deceleration in the rate of change of both the manufacturing and services PMIs is consistent with an imminent peak in the second derivative of goods and services CPI (Chart 4). Chart 3Commodity Impulse Is Peaking
Commodity Impulse Is Peaking
Commodity Impulse Is Peaking
Chart 4Inflation's Maximum Momentum Is Now
Inflation's Maximum Momentum Is Now
Inflation's Maximum Momentum Is Now
Underlying drivers of inflation also remain tame in Europe. European negotiated wages are only expanding at a 1.5% annual rate, which translates into unit labor costs growth of 1% (Chart 5). This contrast with the US, where wages are expanding at a 4.3% annual rate. A peak in inflation, however, does not mean that CPI readings will fall below the ECB’s 2% threshold anytime soon. The European economy continues to face supply shortages that the Ukrainian conflict exacerbates (Chart 6). Moreover, the recent wave of COVID-19 in China increases the risk of disruptions in supply chains, as highlighted by the closure of Foxconn factories in Shenzhen. Finally, inflation has yet to peak; mathematically, it will take a long time before it falls back below levels targeted by Frankfurt. Chart 5The European Labor Market Is Not Inflationary
The European Labor Market Is Not Inflationary
The European Labor Market Is Not Inflationary
Chart 6Not Blemish-Free
Not Blemish-Free
Not Blemish-Free
Bottom Line: European headline inflation will peak this summer, probably above 7%. Additionally, core CPI is likely to reach between 2.8% and 3.2% in the second half of 2022. As a result of a decline in the commodity impulse, inflation will decelerate afterward, but it will remain above the ECB’s 2% target for most of 2023. Hopes For Growth Two weeks ago, we wrote that Europe was facing a stagflation episode in the coming one to two quarters, but that, ultimately, economic activity will recover well. Recent evidence confirms that assessment. Chart 7A Coming Chinese Tailwind?
A Coming Chinese Tailwind?
A Coming Chinese Tailwind?
The tone of Chinese policymakers is becoming more aggressive, in favor of supporting the economy. On March 16, Vice-Premier Liu He highlighted that Beijing was readying to support property and tech shares and that it will do more to stimulate the economy. True, this response was made in part to address the need to close cities affected by the sudden spike of Omicron cases around China. Nonetheless, the global experience with Omicron demonstrates that, as spectacular and violent the surge in cases may be, it is short-lived. Meanwhile, the impact of stimulus filters through the economy over many months. As a result, Europe will experience the impact of China’s Omicron-induced slowdown, while it also suffers from the growth-sapping effects of the Ukrainian conflict; however, it will also enjoy the positive effect on growth of a rising credit impulse over several subsequent quarters (Chart 7). Beyond China, the other themes we have discussed in recent weeks remain valid. First, European fiscal policy will become looser, as governments prepare to fight the slowdown caused by the war, while also increasing infrastructure spending to wean Europe off Russian energy. Moreover, European military spending is well below NATO’s 2% objective. This will not remain the case, as military expenditure may leap from less than EUR100bn per year to nearly EUR400bn per year over the coming decade. Second, European spending on consumer durable goods still lags well behind the trajectory of the US. With the energy drag at its apex today, consumer spending on durable goods will be able to catch up in the latter half of the year, especially with the household savings rate standing at 15% or 2.5 percentage points above its pre-COVID level. Bottom Line: European growth will be very low in the coming quarters. Germany is likely to face a technical recession as Q1 2022 data filters in. Nonetheless, Chinese stimulus, European fiscal support, pent-up demand, and a declining energy drag will allow growth to recover in the latter half of the year. As a result, we agree with the European Commission estimates that European growth will slow markedly this year. Market Implications In the context of a transitory shock to European economic activity and a coming peak in inflation, European stock prices have likely bottomed. Chart 8Depressed Sentiment To Help Beta
Depressed Sentiment To Help Beta
Depressed Sentiment To Help Beta
Sentiment has reached levels normally linked with a durable market floor. The NAAIM Exposure Index has fallen to a point from which global markets often recover. Europe’s high beta nature increases the odds that European equities will greatly benefit in that context (Chart 8). Valuations confirm that sentiment toward European assets has reached a capitulation stage. The annual rate of change of the earnings yields in the earnings yields has hit 73%, which is consistent with a market bottom (Chart 9). More importantly, the change in European forward P/E tracks closely our European Stagflation Sentiment Proxy (ESSP), based on the difference between the Growth and Inflation Expectations’ components of the ZEW survey (Chart 10). For now, our ESSP indicates that stagflation fears in Europe have never been so widespread, but these fears will likely dissipate as energy inflation declines. This process will lift European earnings multiples. Chart 9Bad News Discounted?
Bad News Discounted?
Bad News Discounted?
Chart 10Ebbing Stagflation Fear Will Prompt Rerating
Ebbing Stagflation Fear Will Prompt Rerating
Ebbing Stagflation Fear Will Prompt Rerating
Earnings revisions will likely bottom soon as well. The ESSP is currently consistent with a dramatic decline in European net earnings revisions (Chart 10, bottom panel). It will take a few more weeks for lower earnings revisions to be fully reflected. However, they follow market moves and, as such, the 17% decline in the MSCI Europe Index that took place earlier this year already anticipates their fall. Consequently, as stagflation fears recede, earnings revisions will rise in tandem with equity prices. Chart 11Maximum Pressure On Corporate Spreads
Maximum Pressure On Corporate Spreads
Maximum Pressure On Corporate Spreads
A decline in stagflation fears is also consistent with a decrease in European credit spreads in the coming months (Chart 11). This observation corroborates the analysis from the Special Report we published jointly with BCA’s Global Fixed-Income Strategy team last week. In terms of sectoral implications, a decline in stagflation fears is often associated with a rebound in the performance of small-cap equities relative to large-cap ones (Chart 12, top panel). This reflects the greater sensitivity of small-cap equities to domestic economic conditions compared to large-cap stocks. Moreover, small-cap equities had been oversold relative to their large-cap counterparts but now, momentum is improving (Chart 12). As a result, it is time to buy these equities. Similarly, financials have suffered greatly from the recent events associated with the Ukrainian conflict. European financial institutions have not only been penalized for their modest exposure to Russia, they have also historically declined when stagflation fears are prevalent (Chart 13). This relationship reflects poor lending activity when the economy weakens, and the risk of a policy-induced recession caused by high inflation. Financials will continue their sharp rebound as stagflation fears dissipate. Chart 13Financials Have Suffered Enough
Financials Have Suffered Enough
Financials Have Suffered Enough
Chart 12Small-Caps Time To Shine
Small-Caps Time To Shine
Small-Caps Time To Shine
The dynamics in inflation alone are very important. As Table 1 highlights, in periods of elevated inflation over the past 20 years, financials underperform the broad market by 11.3% on average. It is also a period of pain for small-cap equities and cyclicals. Logically, exiting the current environment will offer opportunities in European cyclical equities and for financials in particular. Table 1Who Suffers From High Inflation?
Is Europe Turning The Corner?
Is Europe Turning The Corner?
Chart 14Long Industrials & Materials / Short Energy
Long Industrials & Materials / Short Energy
Long Industrials & Materials / Short Energy
Finally, a pair trade buying industrials and materials at the expense of energy makes sense today. Materials and industrials suffer relative to energy equities when stagflation rises, especially in periods when these fears reflect rising energy pressures (Chart 14). A reversal in relative earnings revisions in favor of materials and industrials will propel this position higher. Bottom Line: Sentiment toward European assets reached a selling climax in recent weeks. Stagflation fears in Europe have reached an apex, and their reversal will lift both multiples and earnings revisions in the subsequent quarters. Diminishing stagflation fears will also boost the appeal of European corporate credit, contributing to an easing in financial conditions. Small-cap stocks, cyclicals, and financials will reap the greatest benefits from this adjustment. Going long materials and industrials at the expense of energy stocks is an attractive pair trade. Key Risk: A Policy Mistake The view above is not without risks. The number one threat to European growth and assets is a policy mistake from the ECB. On March 10, 2022, the ECB’s policy statement and President Christine Lagarde’s press conference showed that the Governing Council (GC) will decrease asset purchases faster than anticipated. Chart 15Will The ECB Repeat It Past Mistakes?
Will The ECB Repeat It Past Mistakes?
Will The ECB Repeat It Past Mistakes?
It is important to keep in mind the dynamics of 2011. Back then, the ECB opted to increase interest rates as European headline CPI was drifting toward 2.6% on the back of rising energy prices. According to our ESSP, the April 2011 interest rates hike took place at the greatest level of stagflation fears recorded until the current moment (Chart 15). Lured by rising inflation, the ECB ignored underlying weaknesses in European economic activity, which wreaked havoc on European financial markets and growth. If the ECB were to increase rates as growth remains soft, a similar outcome would take place. For now, the ECB’s communications continue to de-emphasize the need for rate hikes in the near term, which suggests that the GC is cognizant of the risk created by weak growth over the coming months. Waiting until next year, when activity will be stronger and the output gap will be closed, will offer the ECB a better avenue to lift rates durably. This risk warrants close monitoring of the ECB’s communication over the coming months. If headline inflation does not peak by the summer, the ECB is likely to repeat its past error, which will substantially hurt European assets. Our optimism is tempered by this threat. UK Outperformance Long In The Tooth? Last week, the Bank of England (BoE) increased the Bank Rate by 25bps to 0.75%, in a move that was widely expected. Yet, the pound fell 0.7% against the euro and gilt yields fell 6 bps. This market reaction reflected the BoE’s choice to temper its forward guidance. The central bank is now expected to increase interest rates to 2.2% next year, before they decline in 2024. The dovish projection of the BoE shows the MPC’s concerns over the impact of higher energy costs and rising National Insurance contributions on household spending. In the BoE’s opinion, the economy is very inflationary right now, but it will slow, which will mitigate the inflationary impact down the road. We share the BoE’s worries about the UK’s near-term economic outlook. The combination of higher taxes, higher interest rates, and rising energy costs will have an impact on growth. However, the rapid decline in small-cap stocks, which have massively underperformed their large cap-counterparts, already discounts considerable bad news (Chart 16). Additionally, small-cap equities relative to EPS have begun to stabilize, while relative P/E and price-to-book ratios have also corrected their overvaluations. In this context, UK small-cap equities are becoming attractive. Chart 17UK vs Eurozone: A Stagflation Bet
UK vs Eurozone: A Stagflation Bet
UK vs Eurozone: A Stagflation Bet
Chart 16UK Small-Cap Stocks Have Purged Their Excesses
UK Small-Cap Stocks Have Purged Their Excesses
UK Small-Cap Stocks Have Purged Their Excesses
In contrast to small-cap stocks, UK large-cap equities have greatly benefited from the global stagflation scare. The UK large-cap benchmark had the right sector mix for the current environment, overweighting defensive names as well as energy and resources. It is likely that when stagflation fears recede, UK equities will undo their outperformance (Chart 17). Technically, UK equities are massively overbought against Euro Area and Swedish stocks, both of which have been greatly impacted by stagflation fears and their pro-cyclical biases (Chart 18 & 19). An attractive tactical bet will be to sell UK large-cap stocks while buying Eurozone and Swedish equities, as energy inflation declines and as China’s stimulus boosts global industrial activity in the latter half of 2022 Bottom Line: Move to overweight UK small-cap stocks within UK equity portfolios. Go long Euro Area and Swedish equities relative to UK large-cap stocks as a tactical bet. Chart 18UK Overbought Relative To Euro Area...
UK Overbought Relative To Euro Area...
UK Overbought Relative To Euro Area...
Chart 19… And Sweden
... And Sweden
... And Sweden
Mathieu Savary, Chief European Strategist Mathieu@bcaresearch.com Tactical Recommendations Cyclical Recommendations Structural Recommendations Closed Trades
Executive Summary Investors Think The Fed Will Not Be Able To Raise Rates Much Above 2%
Is A Higher Neutral Rate Good Or Bad For Stocks?
Is A Higher Neutral Rate Good Or Bad For Stocks?
The neutral rate of interest is 3%-to-4% in the United States. This is substantially higher than the market estimate of around 2%. It is also higher than the central tendency range for the Fed’s terminal interest rate dot, which remained at 2.3%-to-2.5% following this week’s FOMC meeting. If the neutral rate turns out to be higher than expected, this is arguably good news for stocks over the short-to-medium term because it lowers the risk that the Fed will accidentally induce a recession this year by bringing rates into restrictive territory. Over a longer-term horizon of 2-to-5 years, however, a higher neutral rate is bad news for stocks because it means that investors will eventually need to value equities using a higher discount rate. It also means that the Fed could find itself woefully behind the curve in normalizing monetary policy. Bottom Line: Global equities will rise over the next 12 months as the situation in Ukraine stabilizes, commodity prices recede, and inflation temporarily declines. Stocks will peak in the second half of 2023 in advance of a second, and currently unexpected, round of Fed tightening beginning in late-2023 or 2024. Dear Client, Instead of our regular report next week, we will be sending you a Special Report written by Matt Gertken, BCA Research’s Chief Geopolitical Strategist, discussing the geopolitical implications of the war in Ukraine. We will be back the following week with the GIS Quarterly Strategy Outlook, where we will explore the major trends that are set to drive financial markets in the rest of 2022 and beyond. As always, I will hold a webcast discussing the outlook the week after, on Thursday, April 7th. Best regards, Peter Berezin Chief Global Strategist https://www.linkedin.com/in/peter-berezin-1289b87/ https://twitter.com/BerezinPeter A Two-Stage Fed Tightening Cycle The FOMC raised rates by 25 basis points this week, the first of seven rate hikes that the Federal Reserve has telegraphed in its Summary of Economic Projections for the remainder of 2022. We expect the Fed to follow through on its planned rate hikes this year, but then go on pause in early-2023, as inflation temporarily comes down. However, the Fed will resume raising rates in late-2023 or 2024 once inflation begins to reaccelerate and it becomes clear that monetary policy is still too easy. This second round of monetary tightening is currently not anticipated by market participants. If anything, investors think the Fed is more likely to cut rates than raise rates towards the end of next year (Chart 1). The Fed’s own views are not that different from the markets’: The central tendency range for the Fed’s terminal interest rate dot remained at 2.3%-to-2.5% following this week’s FOMC meeting, with the median dot actually ticking lower to 2.4% from 2.5% (Chart 2).
Image
Chart 2The Fed Is Still In The Secular Stagnation Camp
The Fed Is Still In The Secular Stagnation Camp
The Fed Is Still In The Secular Stagnation Camp
A Higher Neutral Rate
Image
Our higher-than-consensus view of where US rates will eventually end up reflects our conviction that the neutral rate of interest is somewhere between 3% and 4%. One can think of the neutral rate as the interest rate that equates the amount of investment a country wants to undertake at full employment with the amount of savings that it has at its disposal.1 Anything that reduces savings or increases investment would raise the neutral rate (Chart 3). As we discussed last month, a number of factors are likely to lower desired savings in the US over the next few years: Households will spend down their accumulated pandemic savings. US households are sitting on $2.3 trillion (10% of GDP) in excess savings, the result of both decreased spending on services during the pandemic and the receipt of generous government transfer payments (Chart 4). Household wealth has soared since the start of the pandemic (Chart 5). Conservatively assuming that households spend three cents of every additional dollar in wealth, the resulting wealth effect could boost consumption by nearly 4% of GDP.
Image
Chart 5Net Worth Has Soared Since The Pandemic
Net Worth Has Soared Since The Pandemic
Net Worth Has Soared Since The Pandemic
The household deleveraging cycle has ended (Chart 6). Household balance sheets are in good shape. After falling during the initial stages of the pandemic, consumer credit has begun to rebound. Banks are easing lending standards on consumer loans across the board. Baby boomers are retiring. They hold over half of US household wealth, considerably more than younger generations (Chart 7). As baby boomers transition from savers to dissavers, national savings will decline. Chart 6US Household Deleveraging Pressures Have Abated
US Household Deleveraging Pressures Have Abated
US Household Deleveraging Pressures Have Abated
Chart 7Baby Boomers Have Amassed A Lot Of Wealth
Is A Higher Neutral Rate Good Or Bad For Stocks?
Is A Higher Neutral Rate Good Or Bad For Stocks?
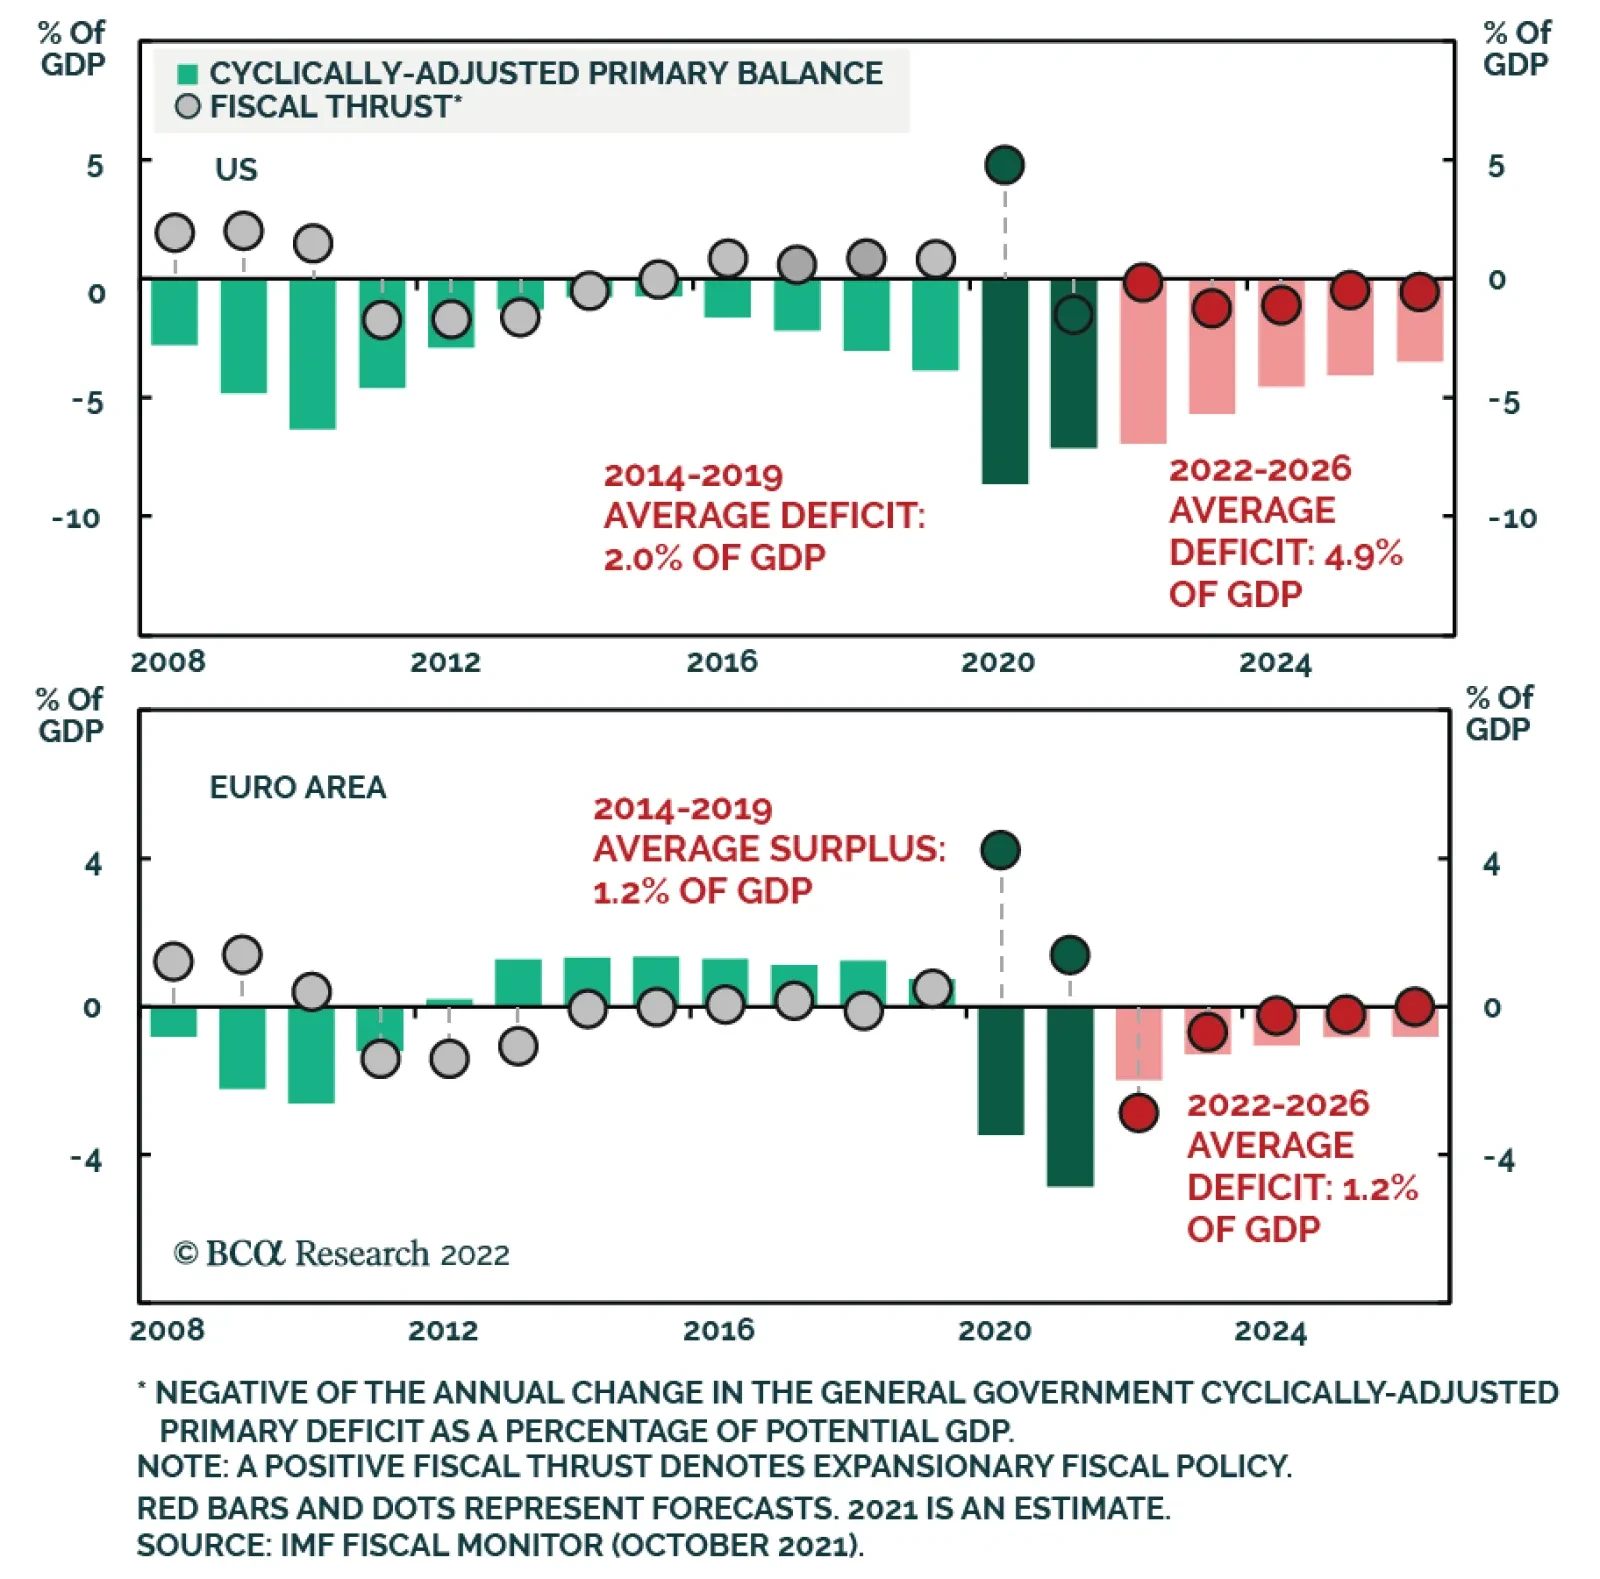
Government budget deficits will stay elevated. Fiscal deficits subtract from national savings. While the US budget deficit will come down over the next few years, the IMF estimates that the structural budget deficit will still average 4.9% of GDP between 2022 and 2026 compared to 2.0% of GDP between 2014 and 2019 (Chart 8). On the investment front: The deceleration in trend GDP growth, which depressed investment spending, has largely run its course.2 According to the Congressional Budget Office, real potential GDP growth fell from over 3% in the early 1980s to about 1.9% today. The CBO expects potential growth to edge down only slightly to 1.7% over the next few decades (Chart 9). Chart 8Fiscal Policy: Tighter But Not Tight
Is A Higher Neutral Rate Good Or Bad For Stocks?
Is A Higher Neutral Rate Good Or Bad For Stocks?
Chart 9Much Of The Deceleration In Potential Growth Has Already Happened
Much Of The Deceleration In Potential Growth Has Already Happened
Much Of The Deceleration In Potential Growth Has Already Happened
After moving broadly sideways for two decades, core capital goods orders – a leading indicator for capital spending – have broken out to the upside (Chart 10). Capex intention surveys remain upbeat (Chart 11). The average age of the nonresidential capital stock currently stands at 16.3 years, the highest since 1965 (Chart 12). Chart 10Positive Signs For Capex (I)
Positive Signs For Capex (I)
Positive Signs For Capex (I)
Similar to nonresidential investment, the US has been underinvesting in residential real estate (Chart 13). The average age of the housing stock has risen to a 71-year high of 31 years. The homeowner vacancy rate has plunged to the lowest level on record. The number of newly finished homes for sale is half of what it was prior to the pandemic. Chart 11Positive Signs For Capex (II)
Positive Signs For Capex (II)
Positive Signs For Capex (II)
Chart 12An Aging Capital Stock
An Aging Capital Stock
An Aging Capital Stock
Chart 13Housing Is In Short Supply
Housing Is In Short Supply
Housing Is In Short Supply
The New ESG: Energy Security and Guns The war in Ukraine will put further pressure on the neutral rate, especially outside of the United States. Chart 14European Capex Should Recover
European Capex Should Recover
European Capex Should Recover
After staging a plodding recovery following the euro debt crisis, European capital spending received a sizable boost from the launch of the NextGenerationEU Recovery Fund (Chart 14). Capital spending will rise further in the years ahead as European governments accelerate efforts to make their economies less reliant on Russian energy. Meanwhile, European governments are trying to ease the burden from rising energy costs. France has introduced a rebate on fuel starting on April 1st. It is part of a EUR 20 billion package aimed at cutting heating and electricity bills. Other countries are considering similar measures. European military spending will also rise. Germany has already announced that it will spend EUR 100 billion more on defense. European governments will also need to boost spending to accommodate potentially several million Ukrainian refugees. A Smaller Chinese Current Account Surplus? Chart 15Will China Be A Source Of Excess Savings?
Will China Be A Source Of Excess Savings?
Will China Be A Source Of Excess Savings?
The difference between what a country saves and invests equals its current account balance. Historically, China has been a major exporter of savings, which has helped depress interest rates abroad. While China’s current account surplus has declined as a share of its own GDP, it has remained very large as a share of global ex-China GDP, reflecting China’s growing weight in the global economy (Chart 15). Many analysts assume that China will double down on efforts to boost exports in order to offset the drag from falling property investment. However, there is a major geopolitical snag with that thesis: A country that runs a current account surplus must, by definition, accumulate assets from the rest of the world. As the freezing of Russia’s foreign exchange reserves demonstrates, that is a risky proposition for a country such as China. Rather than increasing its current account surplus, China may seek to bolster its economy by raising domestic demand. This could be achieved by either boosting domestic investment on infrastructure and/or consumption. Notably, the IMF’s latest projections foresee China’s current account surplus falling by more than half between 2021 and 2026 as a share of global ex-China GDP. If this were to happen, the neutral rate in China and elsewhere would rise. The Path to Neutral: The Role of Inflation If one accepts the premise that the neutral rate in the US is higher than widely believed, what will the path to this higher rate look like?
Image
The answer hinges critically on the trajectory of inflation. If inflation remains stubbornly high, the Fed will be forced to hike rates by more than expected over the next 12 months. In contrast, if inflation comes down rapidly, then the Fed will be able to raise rates at a more leisurely pace. As late as early February, one could have made a strong case that US inflation was set to fall. The demand for goods was beginning to moderate as spending shifted back towards services. On the supply side, the bottlenecks that had impaired goods production were starting to ease. Chart 16 shows that the number of ships anchored off the coast of Los Angeles and Long Beach has been trending lower while the supplier delivery components of both the ISM manufacturing and nonmanufacturing indices had come off their highs. Since then, the outlook for inflation has become a lot murkier. As we discussed last week, the war in Ukraine is putting upward pressure on commodity prices, ranging from energy, to metals, to agriculture. BCA’s geopolitical team, led by Matt Gertken, expects the war to worsen before a truce of sorts is reached in a month or two. Meanwhile, a new Covid wave is gaining momentum. New daily cases are rising across Europe and have exploded higher in parts of Asia (Chart 17). In China, the number of new cases has reached a two-year high. The government has already locked down parts of the country encompassing 37 million people, including Shenzhen, a major high-tech hub adjoining Hong Kong. Chart 17Covid Cases Are On The Rise Again In Some Countries
Is A Higher Neutral Rate Good Or Bad For Stocks?
Is A Higher Neutral Rate Good Or Bad For Stocks?
Most new cases in China and elsewhere stem from the BA.2 subvariant of Omicron, which appears to be at least 50% more contagious than Omicron Classic. Given its extreme contagiousness, China may be forced to rely on massive nationwide lockdowns in order to maintain its zero-Covid strategy. While such lockdowns may provide some relief in the form of lower oil prices, the overall effect will be to worsen supply-chain disruptions. Watch For Signs of a Wage-Price Spiral As the experience of the 1960s demonstrates, the relationship between inflation and unemployment is inherently non-linear: The labor market can tighten for a long time with little impact on prices and wages, only for a wage-price spiral to suddenly develop once unemployment falls below a certain threshold (Chart 18). Chart 18A Wage-Price Spiral Was Ignited By Very Low Unemployment Levels In The 1960s
Is A Higher Neutral Rate Good Or Bad For Stocks?
Is A Higher Neutral Rate Good Or Bad For Stocks?
Chart 19Wage Growth Has Picked Up, But Mostly At The Bottom End Of The Income Distribution
Wage Growth Has Picked Up, But Mostly At The Bottom End Of The Income Distribution
Wage Growth Has Picked Up, But Mostly At The Bottom End Of The Income Distribution
For the time being, a wage-price spiral does not appear imminent. While wage growth has picked up, most of the increase in wages has occurred at the bottom end of the income distribution (Chart 19). Chart 20More Low-Wage Employees Should Return To Work
More Low-Wage Employees Should Return To Work
More Low-Wage Employees Should Return To Work
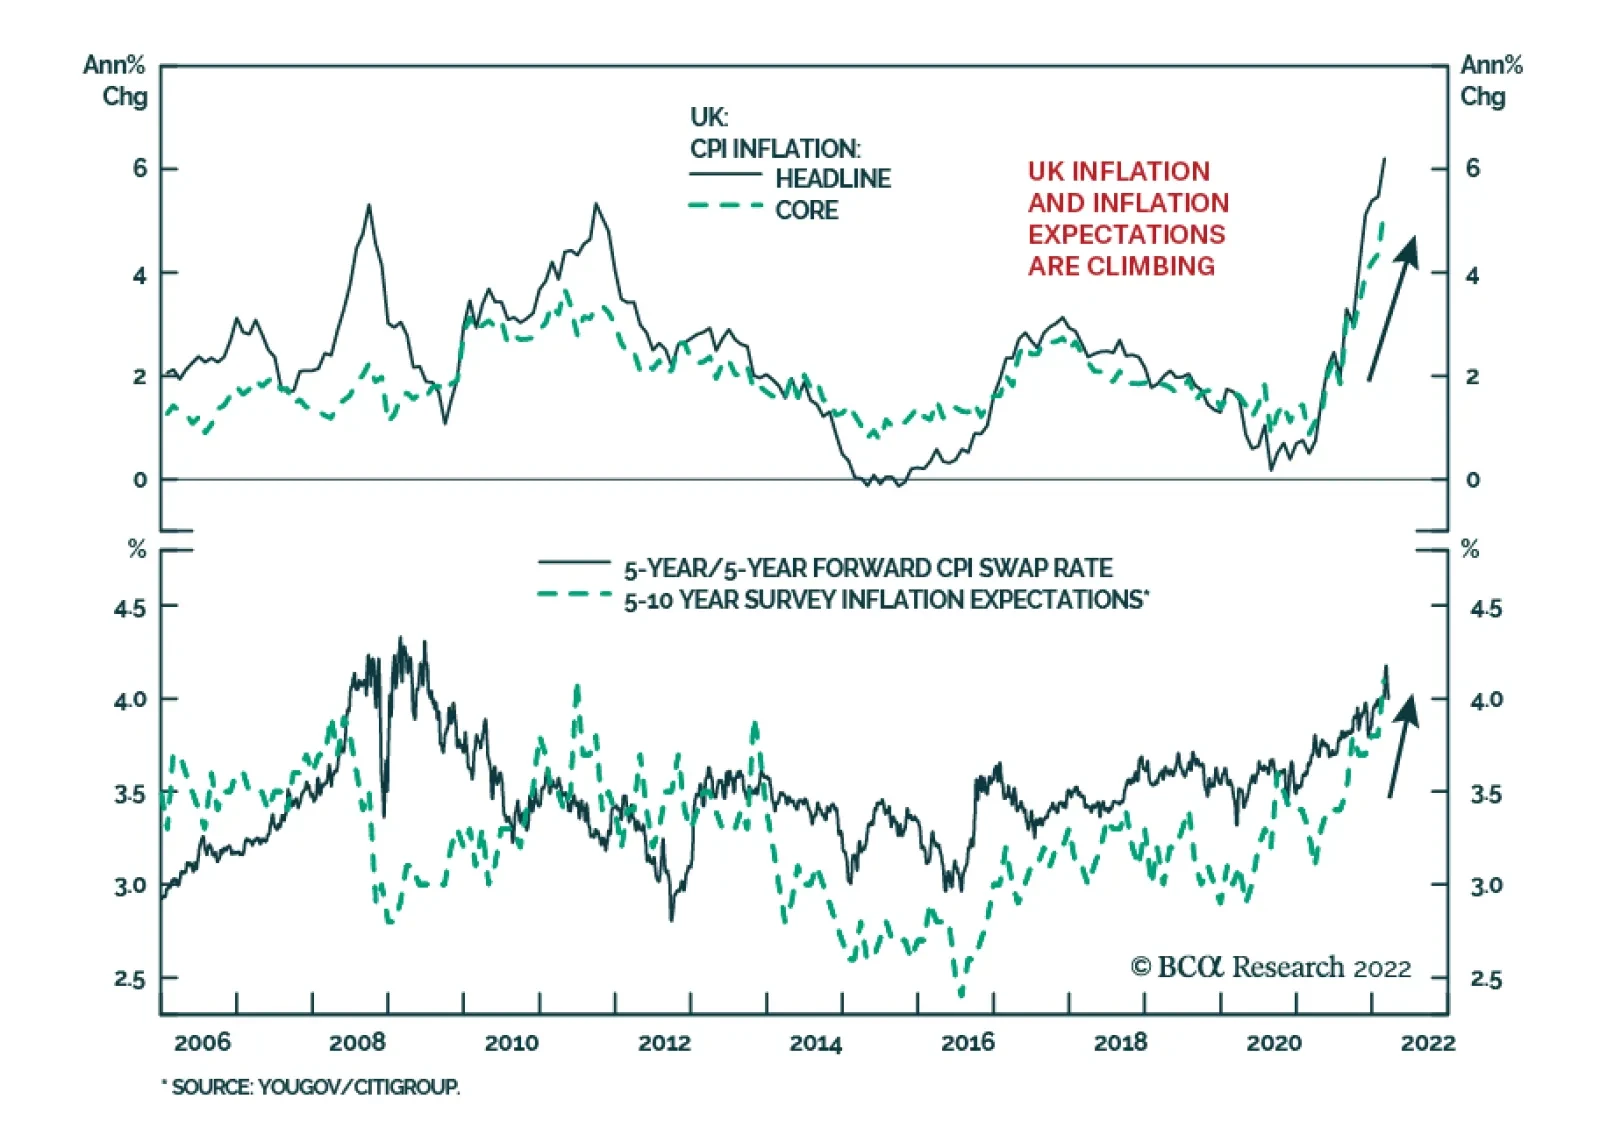
Low-wage workers have not returned to the labor force to the same extent as higher-wage workers (Chart 20). However, now that extended unemployment benefits have lapsed and savings deposits are being drawn down, the incentive to resume work will strengthen. An influx of workers back into the labor market will cap wage growth, at least for this year. Long-Term Inflation Expectations Still Contained A sudden increase in long-term inflation expectations can be a precursor to a wage-price spiral because the expectation of higher prices can induce consumers to shop now before prices rise further, while also incentivizing workers to demand higher wages. Reassuringly, long-term inflation expectations have not risen that much. Expected inflation 5-to-10 years out in the University of Michigan survey registered 3.0% in March, down a notch from 3.1% in February (Chart 21). While the widely followed 5-year, 5-year forward TIPS inflation breakeven rate has climbed to 2.32%, it is still at the bottom of the Fed’s comfort zone of 2.3%-to-2.5% (Chart 22).3 Chart 21Long-Term Inflation Expectations Remain Contained (I)
Long-Term Inflation Expectations Remain Contained (I)
Long-Term Inflation Expectations Remain Contained (I)
Chart 22Long-Term Inflation Expectations Remain Contained (II)
Long-Term Inflation Expectations Remain Contained (II)
Long-Term Inflation Expectations Remain Contained (II)
Chart 23The Magnitude Of Damage Depends On How Long The Commodity Price Shock Lasts
Is A Higher Neutral Rate Good Or Bad For Stocks?
Is A Higher Neutral Rate Good Or Bad For Stocks?
Moreover, the jump in market-based inflation expectations since the start of the war in Ukraine has been fueled by rising oil prices. The forwards are pointing to a fairly pronounced decline in the price of crude and most other commodity prices over the next 12 months (Chart 23). If that happens, inflation expectations will dip anew. Investment Implications The neutral rate of interest is higher in the United States than widely believed. A higher neutral rate is arguably good for stocks over the short-to-medium term because it lowers the risk that the Fed will accidentally induce a recession this year by bringing rates into restrictive territory. Over a longer-term horizon of 2-to-5 years, however, a higher neutral rate is bad news for stocks because it means that investors will eventually need to value stocks using a higher discount rate. It also means that the Fed could find itself woefully behind the curve in normalizing monetary policy. While the war in Ukraine and yet another Covid wave could continue to unsettle markets for the next month or two, global equities will be higher in 12 months than they are now. With inflation in the US likely to temporarily come down in the second half of the year, bond yields probably will not rise much more this year. However, yields will start moving higher in the second half of next year as it becomes clear that policy rates still have further to rise. The bull market in stocks will end at that point. Peter Berezin Chief Global Strategist peterb@bcaresearch.com Footnotes 1 These savings can either by generated domestically or imported from abroad via a current account deficit. 2 Theoretically, there is a close relationship between trend growth and the equilibrium investment-to-GDP ratio. For example, if real trend growth is 3% and the capital stock-to-GDP ratio is 200%, a country would need to invest 6% of GDP net of depreciation to maintain the existing capital stock-to-GDP ratio. In contrast, if trend growth were to fall to 2%, the country would only need to invest 4% of GDP. 3 The Federal Reserve targets an average inflation rate of 2% for the personal consumption expenditures (PCE) index. The TIPS breakeven is based on the CPI index. Due to compositional differences between the two indices, CPI inflation has historically averaged 30-to-50 basis points higher than PCE inflation. This is why the Fed effectively targets a CPI inflation rate of about 2.3%-to-2.5%. View Matrix
Is A Higher Neutral Rate Good Or Bad For Stocks?
Is A Higher Neutral Rate Good Or Bad For Stocks?
Special Trade Recommendations Current MacroQuant Model Scores
Is A Higher Neutral Rate Good Or Bad For Stocks?
Is A Higher Neutral Rate Good Or Bad For Stocks?