Europe

Executive Summary Stronger Capex Than Last Decade
Fallout From Ukraine
Fallout From Ukraine
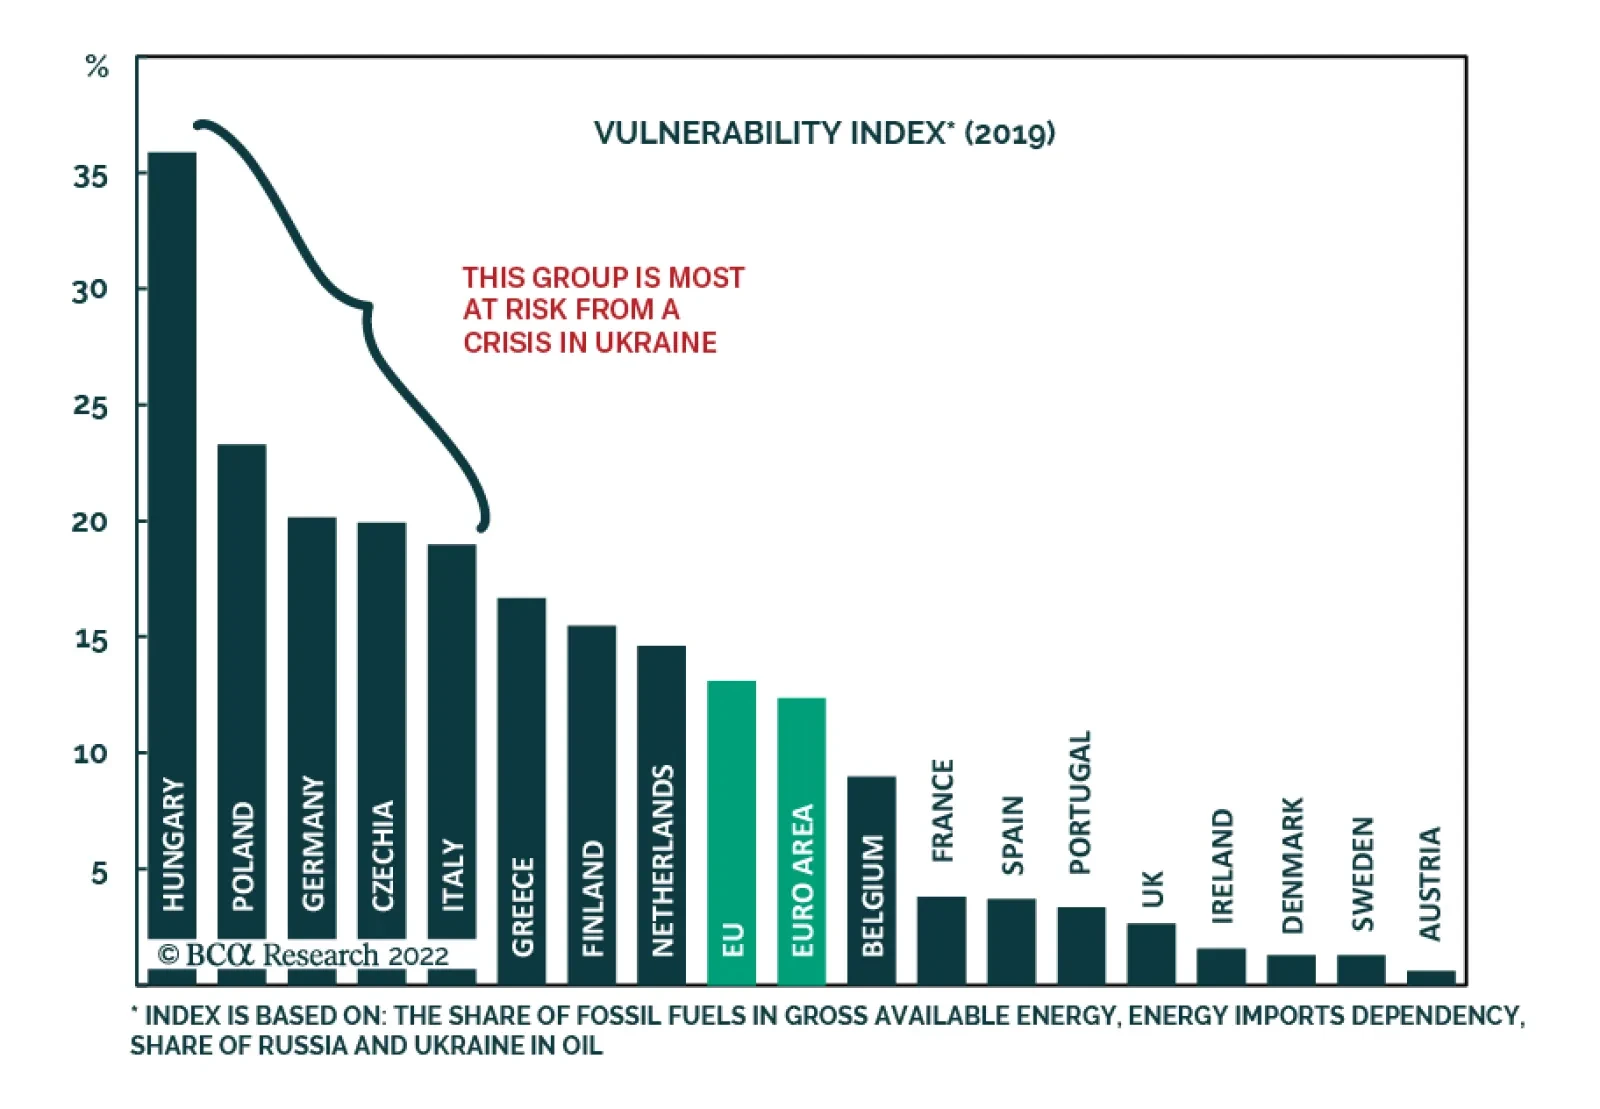
The fog of war continues, but the worst potential outcome for the market—a freeze of Russian energy exports to Europe—has been avoided. Energy inflation is reaching its apex. Markets will remain volatile in the near term as uncertainty remains elevated in the coming days. Moreover, a transition from a recovery driven by consumer durable goods to services remains a hurdle against near-term European outperformance. Italian bonds and European banks are attractive, but it is not yet prudent to plunge headfirst into the euro. The longer-term consequences of the conflicts point toward greater capex and public deficits in Europe. This will boost the neutral rate of interest and European yields. Industrials and defense stocks are also key structural beneficiaries. Bottom Line: Keep hedges in place for the near term, as uncertainty remains rife. Buy Italian bonds and European banks, which will benefit from ECB support. Industrials still face near-term hurdles but should be a structural overweight position in European equity portfolios, along with financials and defense stocks. Feature The situation in Ukraine is reaching a climax. Following Russia’s recognition of the breakaway Luhansk and Donetsk People’s Republics (LPR and DPR) and its invasion of Ukraine, the S&P 500 entered correction territory. Importantly, the Dow Jones Euro Stoxx 50 is now down 10% since its January 5th high, which validates our repeated call over the past four weeks to hedge risk asset portfolios by selling EUR/CHF and EUR/JPY. An international conflict has begun and a human tragedy is unfolding; but, at the time of writing, it looks like the worst-case scenario for markets will be avoided. Germany is folding Nord Stream 2 indeterminably and Western allies have imposed painful economic sanctions on Russia. However, an expulsion of the SWIFT payment system is not in the cards. This is crucial because it greatly limits the risk that Russia will stop sending natural gas and oil to the EU. Ultimately, neither Russia nor the EU wants this outcome, since it imposes an enormous loss of revenues on the former (which needs hard currency to finance its war) and guarantees a recession for the latter (Chart 1). The war will still cost Europe. European natural gas prices surged again on Thursday, rising by more than 60% intraday. While a spike above EUR200/MWh is unlikely in the absence of an oil embargo, 20% of European natural gas imports pass through Ukraine. The conflict suggests that these flows will remain disrupted for now and that natural gas prices will remain between EUR80/MWh and EUR100/MWh for the next few months. This translates into elevated energy and electricity costs for the EU (Chart 2). Chart 1A European Recession Averted
Fallout From Ukraine
Fallout From Ukraine
Chart 2Peaking But Elevated
Fallout From Ukraine
Fallout From Ukraine
Chart 3Ebbing Energy Inflation
Fallout From Ukraine
Fallout From Ukraine
Oil markets are set to peak soon. The run-up in Brent prices in recent weeks was largely driven by geopolitical concerns. With the odds of an oil embargo declining, the pressure on Brent will also recede. Bob Ryan, BCA’s commodity and energy strategist, believes that Saudi Arabia, the UAE, and Kuwait will increase their own production in coming weeks to burnish their credentials as reliable oil producers, especially if oil experiences more turmoil. Bob expects crude prices to drop to $85/bbl by the second half of 2022. These dynamics are important because they imply that European headline inflation will soon peak. Yes, the recent spike in natural gas prices will keep energy inflation higher for a few more months, but, ultimately, ebbing base effects will bring down energy CPI. As Chart 3 highlights, even if Brent and natural gas prices stay at today’s levels for the remainder of the year, their year-on-year inflation rates will collapse, which will drive HICP lower. Near-Term Market Dynamics In this context, what to do with European assets? It is probably still too early to abandon our hedges, but we will likely do so next week or soon after. While the market has probably bottomed, prudence remains of prime consideration as a war is taking place and the situation on the ground may deteriorate. Chart 4A Buying Opportunity
Fallout From Ukraine
Fallout From Ukraine
The clearest near-term investment implication comes for European peripheral bonds. Italian spreads have widened significantly in the wake of the hawkish pivot by the ECB (Chart 4). However, we argued that, when interest rate expectations priced in 50bps of the hike for 2022, the move was excessive and that only one ECB hike in the fourth quarter was likely this year. Now that the Ukrainian crisis is reaching a climax, even some of the ECB’s most hawkish members, such as Robert Holzmann, Governor of the Austrian National Bank, indicate that the removal of liquidity will be slower than originally anticipated. This means that the ECB is likely to continue to backstop the European peripheral bond markets. Italian and Greek bonds, which offer spreads of 165bps and 249bps over German bunds, are appealing in light of this explicit backstop. European financials are another attractive buy. Investors should buy banks outright. As Chart 5 highlights, all the major Eurozone countries’ banking stocks have suffered widespread selloffs. However, the exposure to Russian debt is limited at $67 billion (Chart 6). Additionally, the European yield curve slope is unlikely to flatten significantly from here. The ECB will limit the upside in the German 2-year yields by not hiking until Q4 2022, while the terminal rate proxy in Europe has significant upside from here. A steeper yield curve will boost the appeal of banks, especially in a context in which peripheral spreads are likely to narrow. Chart 5Too Much Of A Dive
Fallout From Ukraine
Fallout From Ukraine
Chart 6Limited Russian Exposure
Fallout From Ukraine
Fallout From Ukraine
The outlook for the euro is more complex. Narrower peripheral spreads would boost the euro’s appeal, a cheap currency currently trading at a 17% discount to its PPP fair value. EUR/USD also trades at a 5% discount to the BCA Intermediate-Term Timing Model, which suggests that considerable bad news is already embedded in the exchange rate (Chart 7). The fact that the EUR/USD did not close below its January 27th low in the face of a major war on European soil adds to the notion that the euro already embeds a significant risk premium. However, there are still ample reasons to worry about additional volatility in the coming week or so. The ECB is sounding less hawkish, while the Fed is not changing its tone. Meanwhile, 1-month and 3-month risk reversals are not at levels consistent with a bearish capitulation, which suggests that the euro could suffer one last wave of liquidation (Chart 8). Thus, we are not buying the euro yet and are willing to forego the first few cents of gains for a clearer signal. Chart 7EUR/USD Is Cheap
Fallout From Ukraine
Fallout From Ukraine
Chart 8Sentiment Could Get More Negative
Fallout From Ukraine
Fallout From Ukraine
Circling back to the equity front, European equities had become very oversold after the 14-day RSI fell below 30. The diminishing risk of an energy crisis will also help. However, global equities face more risks than just Ukraine. As we wrote earlier this week, the transition away from consumer durable goods as the driver of global growth to services will involve some adjustments for stocks, especially in an environment in which the Fed is allowing global monetary conditions to deteriorate (Chart 9). Thus, the window of volatility in stocks is unlikely to close in the near term. The relative performance of European equities vis-a-vis the US is complex as well. European equities have undone most of the relative gains accrued so far in 2022 (Chart 10). On the one hand, the global growth transition will hurt European equities more than US ones, as a result of their greater exposure to manufacturing activity. Additionally, high energy costs are more of a problem for Europe right now than the US. On the other hand, the continued hawkishness of the Fed is likely to limit the ability of tech stocks to extend the rebound that began last Thursday. As a result, the most likely pattern is for some churning in the relative performance of Europe and the US in the coming week. Chart 10Vanishing Outperformance
Fallout From Ukraine
Fallout From Ukraine
Chart 9Tightening US Liquidity Conditions
Fallout From Ukraine
Fallout From Ukraine
For the remainder of the year, we expect the European equity outperformance to re-establish itself in view of the favorable relative profits picture for 2022, a topic that we will explore more deeply in the coming weeks. Bottom Line: The near-term outlook for European assets remains extremely murky. Not only is a war in Ukraine a major threat that can hurt sentiment further, but European assets still have to handle the short-term implications of a change in global growth leadership away from goods consumption. Nonetheless, the dovish message of the ECB in the wake of the Ukrainian invasion suggests that the collapse in Italian bonds and European banks in recent weeks is overdone. European stocks will likely continue to churn against US stocks in the near term but outperform for the remainder of the year. The sell-off in the euro is advanced, but prudence prevents us from buying EUR/USD today. Keep short EUR/CHF and short EUR/JPY hedges in place for now. Longer-Term Implications The crisis in Ukraine heightens Europe’s need to diversify its energy sourcing away from Russia. However, this is not a transition that can be executed on a dime. It will take years. For now, Europe remains dependent on Russian energy, which greatly limits the EU’s options. However, time offers many more possibilities. First, kicking Russia out of SWIFT will become feasible, because it will increase the robustness of the SPFS payment system, allowing Russia to receive funds for its energy, even if it is out of SWIFT. Second, and most importantly, time will allow Europe to find new energy sources. For example, Qatari LNG is often mentioned as a potential replacement for Russian natural gas. Qatar currently does not have the capacity to service Europe extensively, while fulfilling its previous contractual obligations, but the expansion of the production in its North Field East will increase capacity to 126MTPA by 2027. The LNG export capacity of the US may also increase over the coming years. Even if Qatar and the US could send enough LNG to satisfy the hole left by Russia tomorrow, Europe would not be able to accept delivery, as it does not have enough terminals to accommodate these shipments. Thus, investments in that sector will expand. Chart 11The Renewables Envelope Will Expand
Fallout From Ukraine
Fallout From Ukraine
Chart 12Nuclear Skepticism Remains
Fallout From Ukraine
Fallout From Ukraine
Most importantly, Europe will accelerate its transition toward renewable energy. Renewables are already a major focus of the NGEU program (Chart 11). However, we expect that, for the remainder of the decade, the NGEU program will be enlarged to allow greater investments in that space. Not only does it fit European green goals, but this policy would also increase the region energy security. More investment in nuclear electricity production is also possible but lacks popular support (Chart 12). The main message of these observations is that European infrastructure spending is likely to remain elevated in the coming years. As a result, industrial stocks may face some near-term headwinds as the global economy transitions away from the consumer goods-buying binge of COVID-19, but they will ultimately benefit greatly from an expansion of the capital stock around the world. Another long-term theme derived from the current crisis is that European defense stocks will fare well on a structural basis. The current crisis will force greater European unity. The presence of a common enemy will incentivize European nations to increase military spending, especially as the US continues to pivot toward Asia. Investors should overweight these stocks. In terms of bond market developments, more military spending and investment in energy infrastructures means that European budget deficits will be wider than if the Ukrainian crisis had not emerged. More accommodative fiscal policy will support aggregate demand, which will feed through greater capex (Chart 13). Thus, the experience of the last decade, whereby aggregate demand was curtailed by unnecessarily stringent European fiscal policy, will not be repeated. This confirms our expectation that the neutral rate of interest will rise in Europe and that Europe will escape an environment of zero rates (Chart 14). Therefore, German bunds yields have upside, the yield curve can steepen, and the outlook for European financials is positive on a long-term basis, not just on a near-term one. Chart 13Stronger Capex Than Last Decade...
Fallout From Ukraine
Fallout From Ukraine
Chart 14...Means Higher Yields And A steeper Curve
Fallout From Ukraine
Fallout From Ukraine
Chart 15Ebbing Fixed-Income Outflows?
Fallout From Ukraine
Fallout From Ukraine
Finally, the picture for the euro is murky. On the one hand, its inexpensiveness is a major advantage while a higher neutral rate of interest will limit the European fixed-income outflows that have plagues the Euro for the past decade (Chart 15). However, if we are correct that European capex will increase and that budget deficits will remain wider than in the last decade, this also means that the European current account surplus will narrow as excess savings recede. This implies that one of the key underpinnings of the euro will dissipate. In the end, productivity will be the long-term arbiter of the exchange rate. Europe still lags behind the US on this front, which augurs poorly for the performance of the euro (Chart 16). Reforms and capex may save the day, but it is too early to make this call. Chart 16The Productivity Handicap
Fallout From Ukraine
Fallout From Ukraine
Bottom Line: The events in Ukraine portend a structural shift in European capex. Europe will need to ween itself off its Russian energy dependency, which will require major investments in LNG facilities and renewable power. Moreover, European defense spending will rise. These will continue to support fiscal and infrastructure spending. As a result, industrials will benefit from a structural tailwind, as will European defense stocks. These same forces will put upward pressure on European risk-free yields, which will benefit beleaguered European financials and banks. The long-term outlook for the euro is murkier. More research must be conducted before making a definitive directional bet. Mathieu Savary, Chief European Strategist Mathieu@bcaresearch.com Tactical Recommendations Cyclical Recommendations Structural Recommendations
Dear client, In addition to this weekly report, we sent you a Special Report from our Geopolitical Strategy service, highlighting the risk from the Russo-Ukrainian conflict. Kind regards, Chester Executive Summary The Ukraine crisis will lead to a period of strength for the DXY. Countries requiring foreign capital will be most at risk from an escalation in tensions. Portfolio flows have reaccelerated into the US, on the back of a rise in Treasury yields. This will be sustained in the near term. The euro area on the other hand has already witnessed significant portfolio outflows, on the back of Russo-Ukrainian tensions and an energy crisis. Countries with balance of payment surpluses like Switzerland and Australia are good havens amidst the carnage. Oil-producing countries such as Norway and Canada have also seen an improvement in their balance of payments, on the back of a strong terms-of-trade tailwind. This will be sustained in the near term. Balance Of Payments Across The G10
The Ukraine Crisis And Balance Of Payments
The Ukraine Crisis And Balance Of Payments
Bottom Line: The dollar is king in a risk-off environment. That said, the US and the UK sport the worst balance of payments backdrops, while Norway, Switzerland, and Sweden have the best. This underpins our long-term preference for Scandinavian currencies in an FX portfolio. In the near term, we think the DXY will peak near 98-100, but volatility will swamp fundamental biases. Feature Chart 1The US Runs A Sizeable Deficit
The Ukraine Crisis And Balance Of Payments
The Ukraine Crisis And Balance Of Payments
The Russia-Ukraine conflict continues to dictate near-term FX movements. With Russia’s invasion of Ukraine, the risk of escalation and/or a miscalculation has risen. FX volatility is increasing sharply, and with it, the risk of a further selloff in currencies dependent on foreign capital inflows. As a reserve currency, the dollar has also been strong. It is difficult to ascertain how this imbroglio will end. However, in this week’s report, we look at which currencies are most vulnerable (and likely to stay vulnerable) from a balance of payments standpoint. Chart 1 plots the basic balance – the sum of the current account balance and foreign investment – across G10 countries. It shows that at first blush, Norway, Switzerland, Sweden, and Australia are the most resilient from a funding standpoint, while New Zealand, the UK, and the US are the most vulnerable. In Chart 2, we rank G10 currencies on eight different criteria: The basic balance, which we highlighted above. Real interest rate differentials, using the 10-year tenor and headline inflation. Relative growth fundamentals, as measured by the Markit manufacturing PMI. Three fair value models which we use in-house. The first is our Purchasing Power Parity model, which adjusts consumption basket weights across the G10 to reflect a more apples-to-apples comparison. The second is our long-term fair value model (LTFV), which adjusts for productivity differentials between countries; and the final is our intermediate-term timing model (ITTM), which separates procyclical from safe-haven currencies by including a risk factor such as corporate spreads. All three models are equally weighted in our rankings. The net international investment position (NIIP), which highlights currencies that are most likely to witness either repatriation flows or a positive income balance in the current account. Finally, net speculative positioning, which tells us which currencies have crowded long positions, and which ones sport a consensus sell. Chart 2The Scandinavian Currencies Are Attractive
The Ukraine Crisis And Balance Of Payments
The Ukraine Crisis And Balance Of Payments
The conclusions from this chart are similar to our basic balance scenario – NOK, SEK, AUD, CHF, and JPY stand out as winners while GBP, NZD, and USD are the least attractive. The US dollar is a special case given its reserve currency status, with a persistent balance of payments deficit. The rise in the greenback amidst market volatility is a case in point. However, portfolio flows into the dollar also tend to be cyclical, so a resolution in the Ukraine/Russia conflict will put a cap on inflows. Equity portfolio flows had dominated financing of the US current account deficit but are relapsing (Chart 3). Bond portfolio flows have rebounded on the back of rising US yields, but US TIPS yields remain very low by historical standards (Chart 4). If they do not improve much further, specifically relative to other developed markets, it will be tough to justify further inflows into US Treasurys. Chart 3Equity Portfolio Flows Into The US Are Relapsing
Equity Portfolio Flows Into The US Are Relapsing
Equity Portfolio Flows Into The US Are Relapsing
Chart 4Bond Portfolio Flows Into The US Are Strong
Bond Portfolio Flows Into The US Are Strong
Bond Portfolio Flows Into The US Are Strong
In this week’s report, we look at the key drivers of balance of payments dynamics across the G10, starting with the US, especially amidst a scenario where the forfeit of foreign capital could come to the fore. United States Chart 5US Balance Of Payments
US Balance Of Payments
US Balance Of Payments
The US trade deficit continues to hit record lows at -$80.7 billion for the month of December. Over the last few years, it has become increasingly difficult to fund this widening trade deficit via foreign purchases of US Treasurys. A positive net income balance has allowed a slower deterioration in the US current account balance, though at -$214.8 billion for Q3, it remains close to record lows. The overall picture for both the trade and current account balance is more benign as a share of GDP, given robust GDP growth (Chart 5). That said, as a share of GDP, the trade balance stands at -3.5%, the worst in over a decade. Foreign direct investment into the US has been improving of late. This probably reflects an onshoring of manufacturing, triggered by the Covid-19 crisis. That said, despite this improvement, the US still sports a negative net FDI backdrop. In a nutshell, the basic balance in the US (the sum of the current account and foreign direct investment) is still deteriorating. The dollar tends to decline on a multi-year basis when the basic balance peaks and starts worsening. Euro Area Chart 6Euro Area Balance Of Payments
Euro Area Balance Of Payments
Euro Area Balance Of Payments
The trade balance in the euro area has significantly deteriorated in recent quarters, on the back of an escalating energy crisis. Russia’s invasion of Ukraine marks the cherry on top. On a rolling 12-month basis, the trade surplus has fallen to 1% of GDP (Chart 6). This is particularly telling since for the month of December, the trade balance came in at €-4.6 billion, the worst since the euro area debt crisis. The current account continues to post a surplus of 2.6% of GDP, on the back of a positive income balance. However, FDI inflows are relapsing. After about two decades of underinvestment in the euro area, FDI inflows were at their highest level, to the tune of about 2% of GDP in 2021. Those have now completely reversed on the back of uncertainty. The combination of an energy crisis and dwindling FDI is crushing the euro area’s basic balance surplus. A rising basic balance surplus has been one of the key pillars underpinning a bullish euro thesis. Should the deterioration continue, it will undermine our longer-term bullish stance on the euro. It is encouraging that portfolio investments have turned less negative in recent quarters, as bond yields in the euro area are rising. Should this continue, it will be a good offset to the deterioration in FDI. Japan Chart 7Japan Balance Of Payments
Japan Balance Of Payments
Japan Balance Of Payments
Like the euro area, the trade balance in Japan continues to be severely hampered by rising energy imports. The trade deficit in January deteriorated to a near record of ¥2.2 trillion, even though export growth remained very robust. Income receipts from Japan’s large investment positions abroad continue to buffer the current account, but a resolution to the energy crisis will be necessary to stem Japan’s basic balance from deteriorating (Chart 7). The process of offshoring has sharply reversed since the Covid-19 crisis. While FDI is still deteriorating, it now stands at -2.4% of GDP, compared to -4.3% just before the pandemic. Net portfolio investments are also accelerating, especially given the rise in long-term interest rates in Japan, positive real rates, and the value bias of Japanese equities. We are buyers of the yen over the long term, but a further rise in global yields and energy prices are key risks to our view. United Kingdom Chart 8UK Balance Of Payments
UK Balance Of Payments
UK Balance Of Payments
The UK has the worst trade balance in the G10, and the picture has not improved much since the pandemic (currently at -6.7% of GDP). Similar to both the euro area and Japan, much of the drag on the trade balance has been due to rising import costs from energy and fuels. This puts the UK at risk of an escalation in the conflict between Ukraine and Russia. Meanwhile, the improvement in the income balance over the last few years has started to deteriorate, as transfer payments under the Brexit withdrawal agreement kick in. As a result, the current account balance is deteriorating anew (Chart 8). Both portfolio and direct investment in the UK were robust in the post-Brexit environment but have started to deteriorate. This is critical since significant foreign investment is necessary to boost productivity in the UK and prevent the pound from adjusting much lower. With bond yields in the UK rising, and the FTSE heavy in cyclical stocks, this should limit further deterioration in the UK’s financial account. A significant drop in the estimated path of settlement payments for Brexit will also boost the income balance. The key for the pound over the coming years remains how fast the UK can improve productivity, which will convince foreign investors that the return on capital for UK assets will increase. Canada Chart 9Canada Balance Of Payments
Canada Balance Of Payments
Canada Balance Of Payments
Canada’s domestic economy has been relatively insulated from the geopolitical shock in Europe, but its export sector is benefiting tremendously from it. Rising oil prices are boosting Canadian terms of trade. As a result, the current account has turned into a surplus for the first time since 2009, in part driven by an improving trade balance (Chart 9). Outside of trade, part of the improvement in the Canadian current account balance is specifically driven by income receipts from Canada’s positive net international investment position. At C$1.5 trillion, income receipts are becoming an important component of the current account balance. Foreign direct investment into Canada continues to remain robust, given strong commodity prices. This is boosting our basic balance measure, which today sits at a surplus of 2.4% of GDP and should continue to improve. Finally, because of Canada’s improving balance-of-payments backdrop, it is no longer reliant on foreign capital as it had been in the past, which supports the loonie. Australia Chart 10Australia Balance Of Payments
Australia Balance Of Payments
Australia Balance Of Payments
Australia continues to sport the best improvement in both its trade and current account balances over the last few years. As a result, the basic balance has eclipsed 4% of GDP for the first time since we have been measuring this series (Chart 10). The story for Australia remains improving terms of trade, specifically in the most desirable commodities – copper, high-grade iron ore, liquefied natural gas, and to a certain extent, high-grade coal. Foreign direct investment in Australia has eased significantly. Investment in projects in the resource space are now bearing fruit, easing the external funding constraint. Meanwhile, domestic savings can now be easily recycled for sustaining capital investment. In fact, foreign direct investment turned negative in Q4 2021. This also explains the drop in net portfolio investment since Australians now need to build a positive net international investment position. We have a limit buy on the Aussie dollar at 70 cents, as we are bullish the currency over a medium-term horizon. New Zealand Chart 11New Zealand Balance Of Payments
New Zealand Balance Of Payments
New Zealand Balance Of Payments
For the third quarter of 2021, New Zealand’s current account balance hit record lows, despite robust commodity (agricultural) prices. Imports of fertilizers, crude oil, and vaccines have led to a widening trade deficit. A drop in the exports of wood also affected the balance. With a negative net international investment position of about 48% of GDP, the income balance also subtracted from the current account total (Chart 11). From a bigger-picture perspective, New Zealand’s basic balance has been negative for many years, as coupon and dividend payments to foreign investors, as well as valuation adjustments from net foreign liabilities, have kept the current account in structural deficit. However, as the prices of key agricultural goods head higher, New Zealand can begin to benefit from a terms-of-trade boom that will limit its external funding requirement. In that respect, portfolio investments are also improving. New Zealand has the highest bond yield in the G10, on the back of the highest policy rate so far (the RBNZ raised interest rates again this week). New Zealand’s defensive equity market has also corrected sharply amidst the general market riot. As such, foreign investors could begin to favor this market again based on high yields and a reset in valuations. Going forward, New Zealand should continue to see further improvement in its basic balance relative to the US, supporting the kiwi. Switzerland Chart 12Switzerland Balance Of Payments
Switzerland Balance Of Payments
Switzerland Balance Of Payments
The Swiss trade balance remains in a structural surplus, with a post Covid-19 boom that has led a new high as a share of GDP (Chart 12). Global trade has been rather resilient due to high demand for goods. While Switzerland has a large net international investment position, income flows this quarter were hampered by servicing costs for foreign direct investments. The net international investment position did improve by CHF27 billion on a quarter-over-quarter basis in Q3, on the back of a net increase in foreign asset purchases. Currency movements also had little impact on the portfolio in Q3, which is atypical. The SNB will always have to contend with a structural trade surplus that puts upward pressure on the currency. This will keep the Swiss franc well bid, especially in times of crisis when the positive balance-of-payments backdrop makes the CHF a safe haven. Norway Chart 13Norway Balance Of Payments
Norway Balance Of Payments
Norway Balance Of Payments
Q3 2021 saw a strong recovery in Norway’s trade account that is likely to carry over to this year. A recovery in crude oil and natural gas prices was a welcome boon. The lack of tourism also boosted the services account (Norwegians travel and spend less abroad than foreigners visiting Norway). The ongoing electricity crisis in Europe was also an opportune export channel for Norway, which for the first time, opened its 450-mile-long, 1400-megawatt North Sea cable link to the UK. Positive income flows also benefit the current account and the krone (Chart 13). With one of the largest NIIPs in the world heavily skewed towards equity dividends, the NOK benefits when yields rise, even though the domestic fixed-income market is highly illiquid. While a resolution of the Russian-Ukrainian crisis could sap the geopolitical risk premium from oil, the reopening of the global economy will benefit Norwegian exports of oil and gas. Tepid investment in global oil and gas exploration will also ensure Norway’s terms of trade remain robust. Sweden Chart 14Sweden Balance Of Payments
Sweden Balance Of Payments
Sweden Balance Of Payments
The Swedish current account balance has deteriorated slightly in the last few quarters, on the back of supply-side bottlenecks. Particularly, exports of cars have been hampered amidst a semiconductor shortage. That said, the primary income surplus remains a key pillar of the current account, keeping the basic balance at a healthy surplus of about 6% of GDP (Chart 14). Portfolio inflows into Sweden have dwindled, like most other European economies. If this has been due to geopolitical tensions in Europe, it will eventually prove to be fleeting. That said, the Riksbank remains one of the most dovish in the G10 and the OMX is also one of the most cyclical stock markets, which may have spooked short-term foreign investments. The Swedish krona has been the weakest G10 currency year-to-date. Given that we expect most of the headwinds to be temporary, and the basic balance backdrop remains solid, we will go long SEK versus both the euro and the US dollar. Chester Ntonifor Foreign Exchange Strategist chestern@bcaresearch.com Trades & Forecasts Strategic View Cyclical Holdings (6-18 months) Tactical Holdings (0-6 months) Limit Orders Forecast Summary
European risk assets sold off and commodities rallied on Thursday on news that Russia launched an invasion of Ukraine that includes attacks on the capital Kyiv and dozens of other Ukrainian cities. President Putin’s goal is to replace the Ukrainian…
Executive Summary Copper Demand Follows GDP
Copper Demand Follows GDP
Copper Demand Follows GDP
European copper demand will increase on the back of still-accommodative monetary policy, coupled with a loosening of COVID-19-related gathering and mobility restrictions as the virus becomes endemic. Copper demand will be supported by the EU's need to diversify natural gas supplies in favor of increased LNG import capacity over the next 10 years, which will require incremental infrastructure investment. Increasing policy stimulus in China and government measures to increase lending to metals-intensive sectors – e.g., construction and grid infrastructure – will boost global copper demand. In the US, the Biden administration is backing a $550 billion bill to fund its renewable-energy buildout, which will result in higher demand for metals and steel over the next decade. Global copper supply growth will be restrained by local politics going forward, particularly in the Americas. Bottom Line: Copper prices have been grinding higher even as China maintains its zero-tolerance COVID-19 public health policy, and markets wait out the Russia-Ukraine standoff. We are maintaining our forecast for COMEX copper to trade to $5.00/lb this year and $6.00/lb next year. We remain long commodity-index exposure (S&P GSCI and the COMT ETF), along with equity exposure to miners and traders via the XME and PICK ETFs. Feature Ever since it hit its record high in May 2021, copper prices have been range-bound, despite tight market fundamentals and record low inventories in 3Q21, which, as it happens, have not significantly rebuilt since then (Chart 1, panel 1). This can be explained by weak global macro conditions since prices peaked, which have not been especially conducive to higher copper prices, particularly in Europe and China. Activity in these two markets accounting for ~ 60% and 11% of global refined copper demand, respectively, has had a stop-start aspect that has hindered full recovery to now. Chart 1Global Copper Inventories Remain Tight
Global Copper Inventories Remain Tight
Global Copper Inventories Remain Tight
Chart 2Copper Demand Follows GDP
Copper Demand Follows GDP
Copper Demand Follows GDP
As GDP in these regions rises, demand for copper will rise, as Chart 2 shows. Per our modelling, refined copper demand in China, the EU and the world are highly cointegrated with Nominal GDP estimates provided by the IMF. The coefficient associated with nominal GDP in all three instances is positive. Further, running Granger Causality tests indicate that past and present values of nominal GDP explain present refined copper demand values for all three entities. These results indicate that economic growth and refined copper demand have a positive long-run relationship. China’s zero-COVID tolerance policy and the property-market crisis there have restricted economic growth, activity and hence demand for the metal used heavily in construction and manufacturing. In Europe, lockdowns due to the Omicron variant restricted activity causing supply chain disruptions, which contributed to inflation. Now, Europe is relying on immunity among large shares of its population to keep economies open, as COVID-19 becomes endemic. Germany is loosening restrictions at a slower rate than its neighbors, as COVID still has not reached endemicity (Chart 3). Europe’s top manufacturer reportedly is expected to ease restrictions and increase economic activity by March-end. Chart 3New EU COVID-19 Cases Collapse
Copper Will Grind Higher
Copper Will Grind Higher
Natural Gas Remains Critical To Europe Apart from COVID, elevated natural gas prices have and will continue to affect economic activity in Europe. These prices will only get more volatile as fears of a Russian invasion of Ukraine increase. In the short term, we do not expect Russia to cut off all gas supplies to the EU in case of an invasion.1 However, supplies going through Ukraine likely would be cut. Coupled with the region’s precariously low natgas inventory levels, this could fuel a gas price spike (Chart 4). Higher gas prices could lead to demand destruction, if, as occurred this winter, higher power-generating costs arising from higher natgas costs makes electricity too expensive to keep industrial processes like aluminum smelters up and running. In addition, another regional bidding war could incentivize more re-routing of LNG to Europe instead of Asia. This would reduce European prices, but could force Asian markets to raise their bids. Chart 4EU's Natgas Inventories Remain Critical
Copper Will Grind Higher
Copper Will Grind Higher
Assuming gas prices do not remain significantly higher for the rest of the year, Europe will start seeing economic activity improve, and as our European Investment Strategy notes, PMIs will bottom out by the second quarter of this year. High immunity levels are allowing European nations to relax restrictions as it becomes apparent that COVID in the continent – at least in Western Europe – appears to be reaching endemicity. Importantly for base metals generally, and copper in particular, lower natgas prices will allow smelters and refining units to remain in service as electricity prices stabilize or even fall in the EU. During the pandemic, households – primarily in DM economies – built up significant levels of excess savings, particularly in Europe. The IMF reported that households in Europe have amassed nearly 1 trillion euros more in savings vs. normal levels over the last two years than if the pandemic had never occurred.2 While the entirety of excess savings will not be released as spending, even a portion of it will spur economic activity, once supply-chain issues are ironed out when the global economy reopens. China's Copper Demand Will Revive China’s property sector crisis last year was a major drag on economic growth. The Chinese government’s efforts to stabilize this sector seem to be paying off. China’s National Bureau of Statistics reported that for January housing prices in China’s first-tier cities reversed a month-on-month decline from December. The number of cities that saw home prices fall in January also was lower compared to December. Continued improvements in the property sector in China will be bullish for copper. Once macro hurdles related to COVID and high gas prices dissipate, and China’s property market stabilizes, economic activity will increase and copper demand will rebound (Chart 5). However, a timeline for this is difficult to handicap, given China's insistence – at least for now – on maintaining a zero-covid public-health policy. The zero-covid policy has resulted in sharply lower infection rates than the rest of the world, but, because it has not been accompanied by wide distribution of mRNA vaccines, immunity in the population is low. As global macro factors become conducive for copper, investors’ focus will switch to tight fundamentals in the copper market (Chart 6). Unlike the first half of 2021, copper’s high prices will be more sustained, given COVID’s current trajectory towards endemicity globally, and relatively higher immunity rates. Chart 5China's Demand Will Rebound
Copper Will Grind Higher
Copper Will Grind Higher
Chart 6Coppers Tight Fundamentals Will Come Into Focus Again
Coppers Tight Fundamentals Will Come Into Focus Again
Coppers Tight Fundamentals Will Come Into Focus Again
In addition, markets will have to factor in additional demand from the US that heretofore did not exist: The Biden administration is backing a $550 billion bill to fund renewable-energy development. More such funding can be expected in coming years as the US leans into decarbonization, and competes with the likes of the EU and China for limited base metals supplies. Supply Side Difficulties Mount Local governance is becoming increasingly critical to the supply side of base metals, no moreso than in the Americas – chiefly in Chile, Peru and, of late, the US., where the Biden administration recently shut down a Minnesota mining proposal in a major win for environmental groups.3 A number of these critical commodity-producing states in the Americas have elected – or are leaning toward – left-of-center candidates, some of whom are proposing fundamental changes in the laws and regulations governing resource extraction. Gabriel Boric, Chile’s new president, takes office in March. He has largely focused his campaign on the environment, human rights, and closer ties with other Latin American countries. Boric promotes a “turquoise” foreign policy, which includes “green” policies to combat climate change, and “blue” ones to protect oceans. He is likely to commit Chile, which accounts for ~ 30% of global copper mining, to participation in the Escazú Agreement, is being positioned to span the region.4 Of greatest import to the global metals and mining markets, Boric will push for a constitutional re-write affecting taxes on copper mining, decarbonization, Chile's water crisis and the nationalization of lithium mining. Chile's new constitution is expected to be put up for a vote by the end of 2022. In Peru, which accounts for ~ 10% of global copper output, President Pedro Castillo announced at the UN General Assembly that Peru would declare a "climate emergency," and promised to reach net-zero in Peru by 2050. Civil unrest in Peru directed at mining operations is becoming more widespread, as citizens become increasingly frustrated with pollution and poverty.5 Colombia is not a major metals producer, but it is a resource-based economy leaning left. In May it will hold its general elections to Congress and Presidency. The future president will have pressure on the ratification of the Escazú Agreement, fight against illegal mining, and work on the Amazon deforestation. Presently, a left-of-center candidate, Gustavo Petro, leads the polling, according to the latest December survey by the National Consulting Center.6 Petro is promising to stop approving oil exploration contracts to restructure Colombia's economy away from hydrocarbons, and plans to accelerate the transition towards renewable energy.7 In addition, Petro is trying to gather ideological allies across Latin America and the world to fight against climate change. He hopes Chile’s president-elect Gabriel Boric will be joining this alliance.8 Caution: Downside Risks Remain Apart from the Russia-Ukraine crisis discussed above, there are more headwinds to the bullish copper view. China’s zero-covid policy will lead to reduced activity in the world’s largest producer and consumer of refined copper. This will disrupt global supply chains and, along with high energy prices, spur global inflation, prolonging slow economic growth and activity. Central bank tightening globally – led by the Federal Reserve – will increase borrowing costs, reduce manufacturing, and act as a downside risk to copper, particularly if the Fed miscalculates and lifts rates too high too soon and sparks a USD rally. Finally, while DM economies have high vaccination rates, EM states do not have the same level of immunity (Chart 7). Europe exhibits this dichotomy in immunization rates between advanced and developing countries well. While most of Western Europe appears to be nearing endemicity and reopening, Omicron is spreading quickly into Eastern Europe, where immunity is low. As long as a majority of the global population is not vaccinated, COVID-19 mutations into more virulent and transmissive variants remain a major risk. Chart 7COVID-19 Remains A Risk
Copper Will Grind Higher
Copper Will Grind Higher
Investment Implications Copper prices have been grinding higher even as China maintains its zero-tolerance COVID-19 public-health policy, and markets wait out the Russia-Ukraine standoff (Chart 8). As large economies continue to emerge from COVID-19-related disruptions demand for base metals can be expected to increase, particularly for copper. We are maintaining our forecast for COMEX copper to trade to $5.00/lb this year and $6.00/lb next year. We remain long commodity-index exposure (S&P GSCI and the COMT ETF), along with equity exposure to miners and traders via the XME and PICK ETFs. Chart 8Copper Continues To Grid Higher
Copper Continues To Grid Higher
Copper Continues To Grid Higher
Ashwin Shyam Research Associate Commodity & Energy Strategy ashwin.shyam@bcaresearch.com Paula Struk Research Associate Commodity & Energy Strategy paula.struk@bcaresearch.com Robert P. Ryan Chief Commodity & Energy Strategist rryan@bcaresearch.com Commodities Round-Up Energy: Bullish The US will expand its leading position as the EU-27's and UK's top liquified natural gas (LNG) supplier this year, in our view, although Qatar will provide stiff competition (Chart 9). In January, the EIA reported half of the Europe's LNG originated in the US. For all of 2021, 26% of Europe's LNG came from the US, while 24% came from Qatar and 20% came from Russia. We expect the Russia-Ukraine military standoff, which has the potential to become a kinetic engagement, will prompt Europe to diversify its natural gas supplies away from Russia to reduce its exposure to military and geopolitical pressure on its energy supplies. This also would apply, in our estimation, to pipeline supplies of natural gas from Russia, which shipped 10.7 Bcf/d to Europe in 2021 (vs. 11.8 Bcf and 14.8 Bcf/d in 2020 and 2019, respectively. Norway supplied 10.4 Bcf/d in 2019 and 2020, rising to 11.1 Bcf/d in 2021. We also would expect additional North Sea supplies to be developed to supply Europe in the wake of the current Russia-Ukraine tensions. Base Metals: Bullish Russia’s recognition of the two breakaway states of Donetsk and Luhansk People’s Republics (DPR and LPR), elicited US sanctions targeting Russian sovereign debt and its banking sector. The possibility of sanctions on Russian nickel and aluminum exports sent both metals to multi-year highs in LME trading. Russia constitutes around 6% and 9% of global primary aluminum and nickel ore supply, respectively. Precariously low inventory levels for both nickel and aluminum are inducing high price volatility. Year-over-year, global January LME aluminum and nickel stocks are 45% and 64% lower respectively. Precious Metals: Bullish Geopolitical uncertainty due to the Russia-Ukraine crisis and Western sanctions levied on Russia has pushed gold prices to levels not seen since its last bull run last year. While gold has risen, Bitcoin – once considered to be a safe-haven asset – has fallen on this uncertainty. Over the last two years, Bitcoin has been moving more in tandem with equity markets than with other safe-haven assets, as cryptocurrency has become more popular and central banks began large asset purchase programs in response to the pandemic (Chart 10). From beginning 2018 to end-2019 the coefficient measuring daily Bitcoin prices’ correlation with the S&P 500 index was ~0.31. From beginning 2020 to present day, this value has increased to ~ 0.86. Chart 9
Copper Will Grind Higher
Copper Will Grind Higher
Chart 10
Bitcoin Price Aligns With Gold Price And S&P 500 INDEX
Bitcoin Price Aligns With Gold Price And S&P 500 INDEX
Footnotes 1 Please see our report from February 3, 2022 entitled Long-Term EU Gas Volatility Will Increase. It is available as ces.bcaresearch.com. 2 Please see Europe’s Consumers are Sitting on 1 Trillion Euros in Pandemic Savings published by the International Monetary Fund on February 10, 2022. 3 Please see our report from on November 25, 2021 entitled Add Local Politics To Copper Supply Risks, and Biden administration kills Antofagasta's Minnesota copper project published by reuters.com on January 26, 2022. 4 Please see Chile Turns Left: The Foreign Policy Agenda of President Gabriel Boric, published by Australian Institute of Mining Affairs on January 28, 2022. 5 Please see China's MMG faces Peru whack-a-mole as mining protests splinter, published by reuters.com on February 16, 2022. 6 Please see Six Challenges Facing Colombia in 2022, published by Global Americas on January 6, 2022. 7 Please see Gustavo Petro, who leads polls in Colombia, seeks to create an anti-oil front published by Bloomberg on January 14, 2022. 8 Please see Colombia Presidential Favorite Gustavo Petro Wants to Form a Global Anti-Oil Bloc, published by Time on January 14, 2022. Investment Views and Themes Strategic Recommendations Trades Closed in 2021
Image
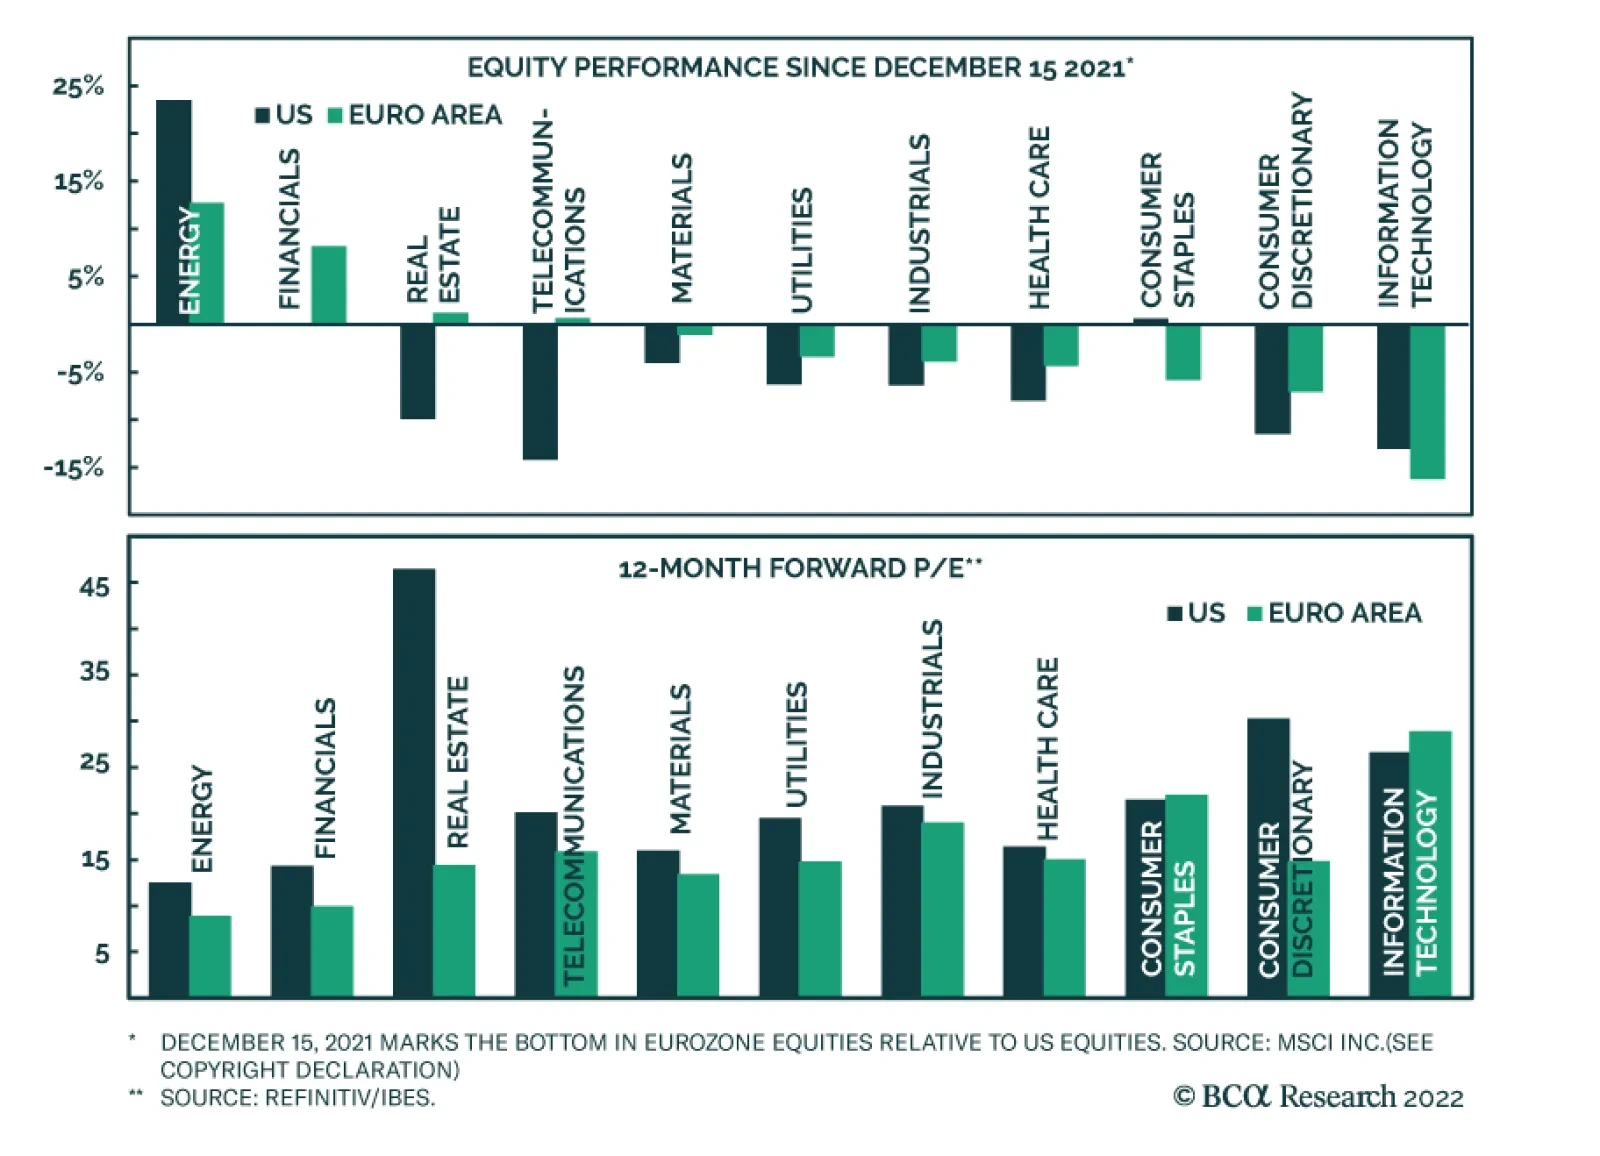
Even though the Eurozone economy is more exposed to potential negative ramifications from the deterioration in Russia’s relationship with the West, Euro Area equities have been passively outperforming US ones since mid-December. Several factors likely explain…
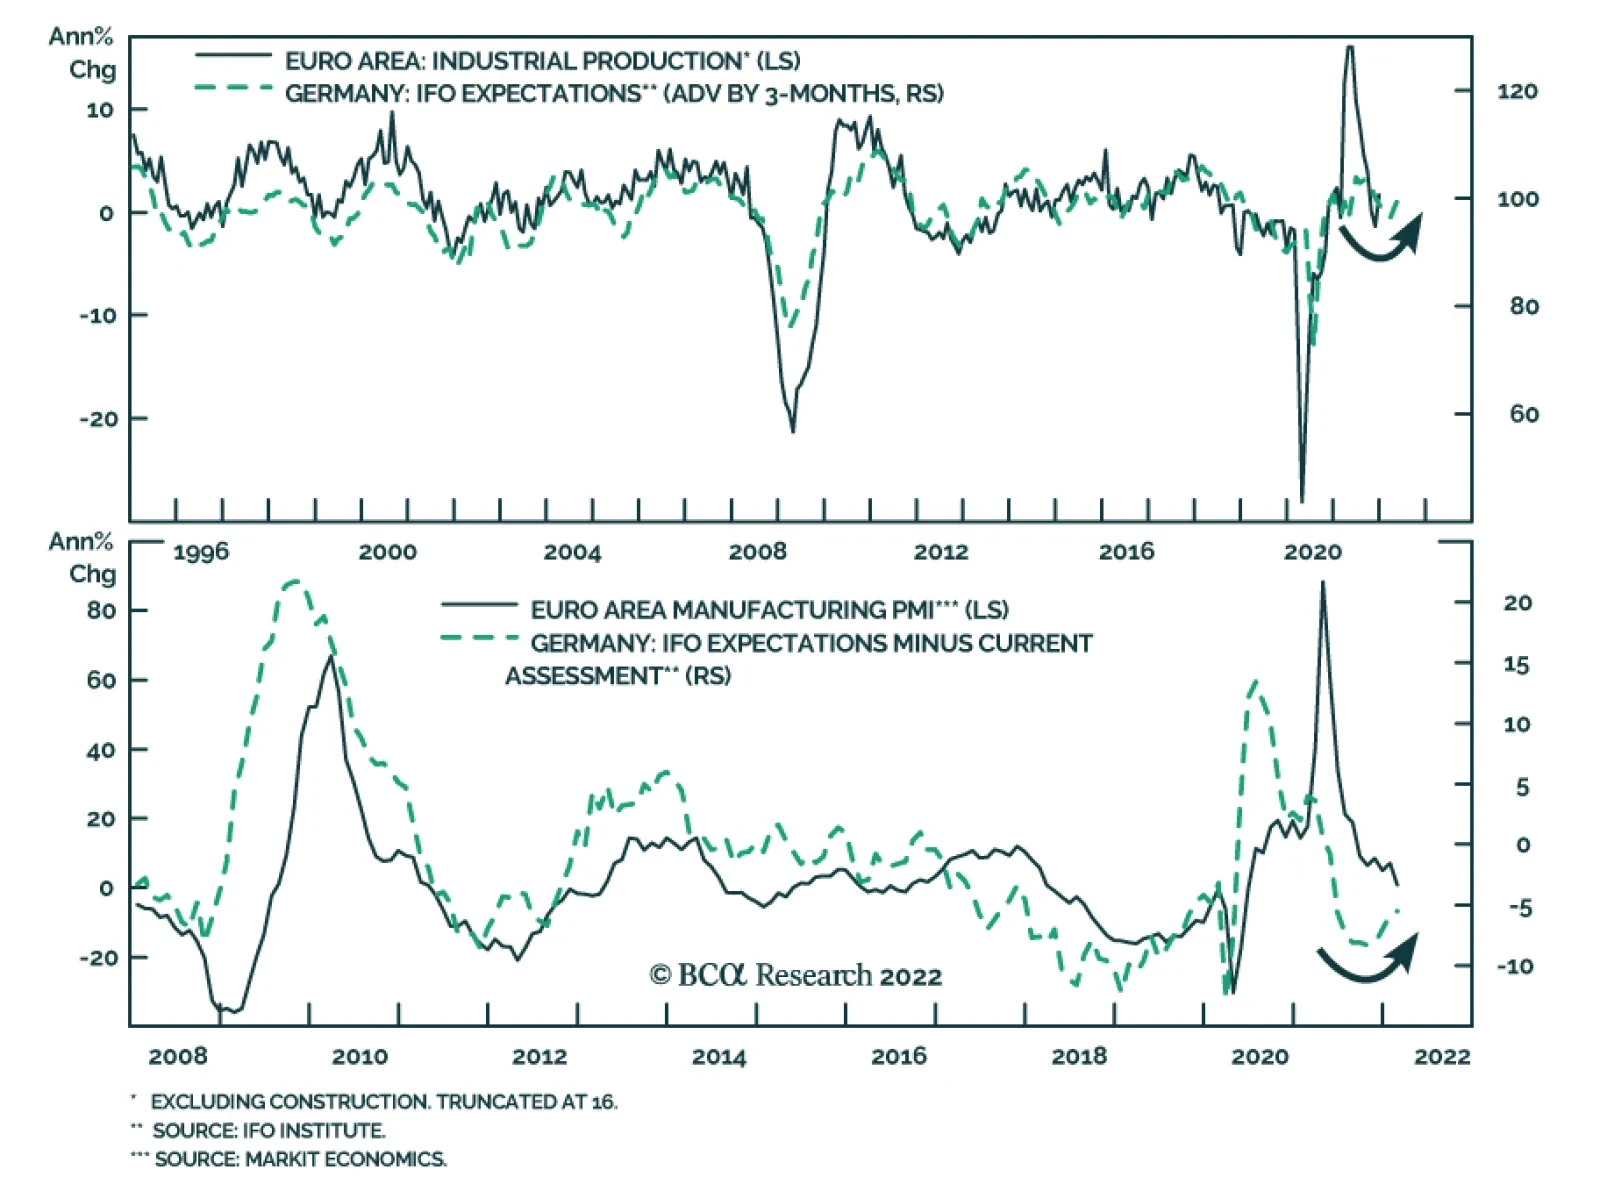
The German Ifo survey for February corroborates the upbeat signal from the Eurozone Flash PMIs, highlighting that the recent soft patch does not reflect underlying economic weakness. The Business Climate Index increased from 96 to 98.9, above the…
Executive Summary A Swedish Warning
A Swedish Warning
A Swedish Warning
Stocks are oversold but downside risks persist. The Fed is on the verge of beginning a tightening cycle, which creates a process often linked to deeper and longer equity corrections around the world. Global economic activity is decelerating, as growth transitions away from splurging on consumer goods to a return to trend in the service sector. Equities are more levered to industrial than services activity, which creates a risk window. Ukraine remains another near-term hurdle. Equity risk premia are not elevated enough to compensate for these threats. Despite near-term risks, the equity bull market will recover and Europe stocks will ultimately outperform. Bottom Line: Investors need to continue to hold portfolio hedges as the near-term outlook remains treacherous for equities. Nonetheless, a wholesale portfolio liquidation is unwarranted as we face a mid-cycle slowdown, not a recession. Feature Last week’s pattern of relaxation and renewed tensions in Ukraine is an acute reminder that markets remain fragile in the near-term. Investors must still contend with an imminent monetary tightening cycle in the US. Additionally, a few cracks are emerging on the global growth picture as a transition from spending on goods to services takes place. Under this light, we worry that risk premia remain too low, and that equities are still vulnerable to further near-term pullbacks. The situation is particularly complex for Europe, which is most exposed to the Ukrainian problems and to the global manufacturing cycle. We thus continue to recommend investors exposed to Europe hold protections. Oversold Enough? Many commentators argue that following the January equity sell-off, the mood of investors soured enough to warrant buying equities anew and closing our eyes. Most famously, the AAII Bull/Bear ratio is once again flirting with its 2018 and 2020 lows, two periods that, in hindsight, proved to be selling climaxes (Chart 1). The picture is complex. BCA’s Equity Capitulation Index is indeed becoming oversold (Chart 2). However, its reading is murky. It can either decline further, which would imply greater weaknesses in stocks, or rebound. Our first instinct is to look at the indicator’s behavior at the onset of Fed tightening cycles, which constitute close historical analogues: Chart 2... But Maybe Not Enough
... But Maybe Not Enough
... But Maybe Not Enough
Chart 1Stocks Are Oversold...
Stocks Are Oversold...
Stocks Are Oversold...
In late 2015, when the last Fed tightening cycle began, the Capitulation Index plunged to much lower levels as stocks collapsed. In the background, the global economy was weakened by EM countries hammered by China’s slowdown and balance of payments crises. Around the hiking cycle that begun in June 2004, the Capitulation Index never plunged considerably, but the S&P 500 fell more than 8% between March and August 2004, in a volatile pattern. Back then, both US and global growth was very robust. In 1999, once the Fed resumed hiking rates after the 75bps of cuts following the LTCM debacle, the Capitulation Index and equities were very resilient. This strength persisted until the Nasdaq peaked in March 2000. The S&P 500 formed a complex top between March and August before starting a relentless collapse that September. Following the onset of the 1994-1995 tightening cycle, the Capitulation Index collapsed to much more oversold readings than current ones and equities entered a range-bound volatile episode that lasted until Q1 1995, as the Fed stopped hiking rates. The economy was replete with inflation fears and a mid-cycle slowdown was descending upon the US. The hiking cycle that started in 1988 did not witness significant downside in the Capitulation Index and stocks, but it took place soon after the 1987 crash when equities had become exceptionally oversold. Black Monday itself happened as inflation fear rose as a result of a weak dollar and as the Fed hiked rates through 1987. In 1984, the rate hike cycle was accompanied by a collapse in the Capitulation Index. The tightening in financial conditions caused by the Fed was exacerbated by the surge in the dollar that hurt US profitability and increased EM borrowing costs tremendously. After the 1981 hiking cycle, the Capitulation Index plunged as the US economy entered the second leg of the early 1980s double-dip recession. The latter was an economic crisis prompted by Federal Chairman Paul Volcker’s willingness to put an end to the inflation mentality of the 1970s. These historical experiences highlight one thing: Economic conditions were key to periods when the beginning of a tightening cycle caused a deeper correction in stocks than the one witnessed until now. Economic Clouds Today, the big question shaping the investment world is inflation. BCA expects inflation to peak over the coming months, whether in the US or in Europe. However, this process will take more time. CPI will not crest until after the Fed has begun to hike rates. In the meantime, there are plenty of factors that could easily fan inflation worries and, consequently, a continued upward repricing of the Fed’s interest rate path in the next few weeks. As Arthur Budaghyan highlighted in the most recent Emerging Market Strategy Report, US labor costs are rapidly rising, with the Atlanta Fed Median Wage growth measure up 5.1% annually and the Employment Cost Index (ECI) expanding at a 4.5% annual rate. Of particular worry, this surge in wages does not reflect underlying productivity and unit labor costs, which are up 3.2% annually (Chart 3), their highest rate since 2001, when the Fed funds rate was 4% and 10-year Treasurys yielded 5.4%. Chart 3US Wage-Price Spiral?
US Wage-Price Spiral?
US Wage-Price Spiral?
Elevated unit labor costs are a powerful inducement for inflation and, thus, are likely to continue to fan inflation fears among market participants. Of particular concern today, the rise in unit labor costs is not counterbalanced by a decline in US import prices and foreign deflationary pressures. Inflation fears remain a major risk for the market. As our BCA Monetary Indicator highlights, the liquidity backdrop is not supportive of equities anymore (Chart 4). Moreover, the technical picture is deteriorating, while speculation remains elevated. With investors fretting about the threat of inflation, the danger is that they start to anticipate a greater deterioration in monetary conditions. The problem is not unique to the US. At the global level, 75% of central banks are tightening policy and those that have not yet done so are gearing up to remove monetary accommodation. Adding to inflation fears are signs of a slowdown in the global goods sector. This slowdown reflects a natural transition from the spending binge on goods that took place during the pandemic, which is ebbing, to service spending, which is accelerating (Chart 5). This pattern is particularly evident for US consumers, the largest spenders in the world. Chart 5Transitioning From Goods To Services
Transitioning From Goods To Services
Transitioning From Goods To Services
Chart 4Deteriorating Liquidity Conditions
Deteriorating Liquidity Conditions
Deteriorating Liquidity Conditions
One of the world’s most sensitive economies to the global industrial cycle is already feeling the pinch from this adjustment: Sweden. Swedish economic numbers have been weakening and Swedish assets are particularly soft (Chart 6), which heralds poorly for the global manufacturing sector. This deceleration in goods spending and industrial activity is a problem for equities because stock market profits are more geared toward the evolution of the industrial cycle than the service sector (Chart 7). Chart 6A Swedish Warning
A Swedish Warning
A Swedish Warning
Chart 7Manufacturing, Not Services, Drives Profits
Manufacturing, Not Services, Drives Profits
Manufacturing, Not Services, Drives Profits
Investment Conclusions In this context, it is prudent to maintain hedges to protect stock holdings. It is commonly argued that stocks are expensive, but if one considers the low level of bond yields, these valuations can be justified. Chart 8 challenges this notion. Yes, the earnings yield is still very elevated relative to 30-year Treasury bond yields; however, it is at its lowest in 42 years against core inflation. Why would core inflation be relevant? In a context in which investors are worried about the impact of inflation on both profit margins (higher labor costs) and the direction of policy, they are unlikely to remain unmoved by inflation fears, especially as the perception of higher policy rates may lift rates higher. Moreover, with many investors anxious that the Fed is falling far behind the curve, the marginal market players could easily become the individuals concerned that a catch up by the Fed will lead the economy into a recession. Considering the risks linked to Ukraine, the potentially negative impact on profitability of slowing goods spending, the growing policy uncertainty globally and in the US, and the inversion of many segments of the yield curve, prudence remains appropriate (Chart 9). Chart 8Value Is In The Eye Of The Beholder
Value Is In The Eye Of The Beholder
Value Is In The Eye Of The Beholder
Chart 9Rising Policy Uncertainty
Rising Policy Uncertainty
Rising Policy Uncertainty
Chart 10The Importance Of Manufacturing To Europe
The Importance Of Manufacturing To Europe
The Importance Of Manufacturing To Europe
The problem for European equities is their elevated beta and pro-cyclicality. A pullback in US stocks will automatically drag down European stocks. Moreover, the region’s heavy reliance on manufacturing activity is reflected in the sectoral tilt of European benchmarks. As a result, the performance of European stocks is particularly sensitive to the evolution of the global industrial cycle (Chart 10). Add the fact that European economies are much more exposed to potential energy market disruptions emanating from Ukraine and the recent rebound in Europe’s relative equity performance becomes tenuous at best. Why would these dynamics be temporary and only warrant hedges, not a cyclical underweight in stocks and Europe? First, the inflation fear will recede in the second half of 2022. Our Global Supply Disruption Index has peaked and suggests that inflation surprises will soon ebb. Moreover, a measure of suppliers’ constraints based on the ISM Supplier Delivery Times, Backlog of Orders, Prices Paid, and Inventories is also rolling over (Chart 11). Second, a deepening of the stock market correction will tighten financial conditions and push credit spreads higher. This is a deflationary process that will cause inflation fears to recede and, thus, the pricing of expected Fed rate hikes to lessen. Third, the slowdown in the goods sector is concentrated among consumer goods. Capex will firm up. Capex intentions are elevated in Europe and the US, and global capital goods orders remain robust, despite having decelerated from their extraordinary rebound following the Q1 2020 shutdowns (Chart 12). Moreover, the political and corporate demand to build greater redundancy in global supply chains following the disruptions caused by the Sino-US trade war and COVID-19 will also boost corporate investments for a few more years. This means that many industrial sectors will recover globally and propel industrial equities higher. Chart 11Apex Bottlenecks?
Apex Bottlenecks?
Apex Bottlenecks?
Chart 12Capex Will Stay Strong
Capex Will Stay Strong
Capex Will Stay Strong
Fourth, Matt Gertken, BCA’s geopolitical strategist, continues to see a limited Ukrainian conflict as the most likely outcome of the current tensions. As a result, any dislocation to global stocks and European assets caused by a conflict will be transitory. Finally, the business cycle has further to run. In 1994/95 and in 2015/16, the Fed tightening cycle materialized around the time of a mid-cycle slowdown. The economy recovered and profit firmed up anew, which allowed stocks to rebound. The Fed Funds rate is rising but remains below the neutral rate. Interest rates in Europe also have ample scope to rise before monetary policy becomes tight. Simultaneously, the recovering service sector will continue to support employment and, thus, final demand. Equity bear markets rarely materialize outside of recessions (Chart 13). Chart 13Bear Markets Demand A Recession
Bear Markets Demand A Recession
Bear Markets Demand A Recession
Bottom Line: Global equities are oversold, but the combination of rising inflation, Fed tightening, Ukrainian risks, and a transition from a goods-driven recovery to a service sector-led economy means that stocks risk becoming even more oversold in the near term. European equities are not immune to these threats. While rising rates are a lesser problem for Europe than the US, the developments in Ukraine and a manufacturing transition represent greater hurdles. Ultimately, the difficulties faced by stocks reflect a mid-cycle slowdown taking place alongside a period of policy tightening. It will be, therefore, temporary. Consequently, investors should not abandon stocks, but rather continue to hold protections. Mathieu Savary, Chief European Strategist Mathieu@bcaresearch.com Tactical Recommendations Cyclical Recommendations Structural Recommendations Closed Trades
Feature This week, we present the third edition of the BCA Research Global Fixed Income Strategy (GFIS) Global Credit Conditions Chartbook – a review of central bank surveys of bank lending standards and loan demand. The data from lending surveys during the last quarter of 2021 were mixed, with business credit standards easing in the US, Japan, Canada, and New Zealand while remaining mostly unchanged in the euro area and UK (Chart 1). Supply chain disruptions have had a two-pronged effect on borrowing. While they have hurt business confidence and prospects, they have also created loan demand as firms look to replenish depleted inventory stocks. The overall picture is one of solid economic fundamentals that are nonetheless perturbed by inflation concerns and lingering uncertainty regarding Covid-19 infections. Chart 1Credit Standards Eased In Most Developed Markets In Q4/2021
Credit Standards Eased In Most Developed Markets In Q4/2021
Credit Standards Eased In Most Developed Markets In Q4/2021
An Overview Of Global Credit Conditions Surveys Chart 2Credit Standards And Spreads Are Correlated
Credit Standards And Spreads Are Correlated
Credit Standards And Spreads Are Correlated
After every quarter, major central banks compile surveys to assess prevailing credit conditions. The purpose is to obtain from banks an assessment of how their lending standards and demand for loans, for both firms and consumers, changed over the previous quarter. Most surveys also ask questions about the key factors driving these changes and expectations for the next quarter.1 For fixed income investors, these surveys are valuable for a few reasons. Firstly, data on consumer lending is a window into consumer health while business loan demand sheds light on the investment picture. These help derive a view on the path of future economic growth and interest rates and thus, the appropriate duration stance of a bond portfolio. Also, credit standards can tell us about the pass-through from fiscal and monetary policy measures to realized financial conditions (i.e. corporate borrowing rates). Most importantly, credit standards exhibit a direct correlation with corporate bond spreads (Chart 2). As they have access to detailed, non-public information on a large number of borrowers, loan officers are uniquely positioned to evaluate corporate health. When banks are tightening standards, they see an issue with the credit quality of either current or future loans, which impacts borrowing costs in the corporate bond market. Tightening standards indicate a worsening borrowing backdrop and weaker growth, which then pushes up corporate spreads. Vice-versa, easing standards imply a favorable backdrop and plentiful liquidity—both bullish signs for spread product. US In the US, a net percentage of domestic respondents to the Fed’s Senior Loan Officer Survey, reported easing standards for commercial and industrial (C&I) loans to firms of all sizes over Q4/2021 (Chart 3). This marks the fourth consecutive quarter of easing standards. However, banks did report a slower pace of easing, which correlates with tighter financial conditions on the margin (top panel). While we are still in a period of easy financial conditions in absolute terms, this could soon start to change as hot inflation prints and booming economic data cause the Fed to turn increasingly hawkish. Despite this, banks expect to ease standards further over 2022, indicating confidence that underlying economic fundamentals and corporate health will be able to weather monetary tightening. US banks also reported stronger C&I loan demand from all firms in Q4, marking three consecutive quarters of improvement (middle panel). The picture was optimistic, with banks attributing increased loan demand to inventory financing, mergers & acquisitions, and fixed investment. Meanwhile, only 4.2% and 12.5% of banks saw a decrease in internal funds and increasing precautionary demand, respectively, as somewhat important. Inventories accounted for all but 2% of the 6.9% annualized GDP growth in Q4. With inventory stocks still depressed in absolute terms, we expect inventory restocking will continue to buoy demand over 2022. Chart 3US Credit Conditions
US Credit Conditions
US Credit Conditions
Chart 4US Loan Demand Outlook For 2022
Q1/2022 Credit Conditions Chartbook: Tightening Cometh?
Q1/2022 Credit Conditions Chartbook: Tightening Cometh?
On the consumer side, banks reported easier standards across the board, with standards easing for credit card, auto, and other consumer loans (bottom panel). However, the pace of easing, which has historically been good at calling turning points in consumer confidence (on a rate-of-change basis), appears to have peaked. Consumer sentiment has already been battered by rampant inflation and falling real wage expectations; tighter credit standards down the road could prove to be a further headwind. As part of the one-off special questions in this edition of the survey, respondents were asked about the reasoning behind their outlook for loan demand over 2022 (Chart 4). Of those that expected higher demand, 70% cited higher spending and investment demand from borrowers as their income prospects improved. Meanwhile, only 33% thought that precautionary demand for liquidity would be a factor. Lenders thought that both, a worsening or an improvement in supply chain disruptions, could contribute to increased demand. 53% expected that continued disruption would create greater inventory financing needs. Meanwhile, 55% expected that easing supply chain troubles would boost demand as product availability concerns faded. Of those that expected weaker loan demand, interest rates were by-and-large the biggest factor, with an overwhelming 96% believing that rising rates would quell loan demand. This was followed by concerns that supply chain disruptions would keep prices high and product availability scarce (70%). On the whole, the responses capture a US economy that is at a tipping point, with market participants watching to see how it weathers an aggressive rate hiking cycle from the Fed. While underlying economic variables such as growth and employment remain strong, it still remains to be seen how much of a tightening in financial conditions the markets can bear. Euro Area In the euro area, banks on net reported a very slight tightening of standards to enterprises for the second consecutive quarter in Q4/2021 (Chart 5). Effectively, standards were unchanged as 96 of the 100 respondents to the survey reported no change from Q3. Slightly lower risk tolerance from banks contributed to tightening while lower risk perceptions related to the general economic outlook and the value of collateral had an easing effect. As in the US, standards in the euro area do show a correlation to overall financial conditions. Those have already tightened noticeably since the February 3rd meeting of the European Central Bank (ECB) Governing Council where President Lagarde set a more hawkish tone. While banks do expect a slight easing of standards over Q1/2022, that is unlikely given high inflation and geopolitical uncertainties which will negatively impact risk perceptions. Chart 5Euro Area Credit Conditions
Euro Area Credit Conditions
Euro Area Credit Conditions
Chart 6Credit Demand In Major Euro Area Economies
Credit Demand In Major Euro Area Economies
Credit Demand In Major Euro Area Economies
Loan demand growth from enterprises was remarkably strong in Q4, with 18% of firms reporting increased demand for loans (middle panel). The main driver was increased demand for inventories, followed closely by fixed investment and merger & acquisition needs. Loan demand leads realized growth in inventories, which has been already been picking up. In Q1, banks expect continued growth in loan demand, albeit at a slower pace. On the consumer side, however, loan demand only increased slightly, with the pace of growth slowing from the previous quarter (bottom panel). This was in line with consumer confidence taking a hit from rising inflation and the Omicron variant in the fourth quarter. The generally low level of interest rates had a small positive impact, while durable goods spending had a slight negative impact on consumer credit demand. Lenders expect moderate growth in consumer credit demand in Q1. Moving to the four major euro area economies, demand for loans to enterprises picked up in Germany, France, and Italy, while remaining unchanged in Spain (Chart 6). Fixed investment needs made a positive contribution across the board. This is corroborated by data on total lending, which is still growing on a year-on-year basis, even though the pace of growth is slowing in all the major euro area economies except Spain. UK In the UK, overall corporate credit standards eased slightly in Q4/2021, marking the fourth straight quarter of easing (Chart 7). However, there was dispersion along firm size. Large private non-financials accounted for all the easing and standards for small and medium firms actually tightened slightly. Going forward, lenders expect a further easing in standards in Q1, about on par with the easing seen in Q4. Chart 7UK Credit Conditions
UK Credit Conditions
UK Credit Conditions
Chart 8UK Lenders Expect A Robust Growth To Ease Credit Availability
Q1/2022 Credit Conditions Chartbook: Tightening Cometh?
Q1/2022 Credit Conditions Chartbook: Tightening Cometh?
On the demand side, lenders reported slightly weaker corporate demand for lending in Q4. Again, the results were uneven across firm size – loan demand from large firms strengthened moderately, while demand from small and medium firms weakened. On average, lenders expect a slight pickup in corporate demand over Q1. Moving to the UK consumer, demand for unsecured lending continued to rise at a brisk pace, hovering around the highest levels since Q4/2014 (bottom panel). Going forward, lenders expect a continued increase in demand, but at a much slower pace. The strong developments in loan growth are seemingly at odds with the GfK consumer confidence index which has declined a total of 12 points since its July peak. Although the Bank of England does not survey respondents on the factors driving household unsecured lending demand, the divergence between confidence and loan demand suggests that precautionary demand for liquidity is playing a role. This lines up with the GfK survey, where expectations for the general economic situation over the next year are in freefall with consumers bracing for high inflation and further Bank Rate increases. Pivoting back to the drivers of corporate lending, the leading factor behind increased credit availability was an improvement in the overall economic outlook, followed by market share objectives (Chart 8). In contrast to the UK consumer, lenders are bullish on the economic outlook and believe it will continue to drive further easing over Q1/2022. On the demand side, investment in commercial real estate, which has seen steady improvement since Q3/2020, was the leading factor. This was followed by merger & acquisition and inventory financing needs. Capital investment needs, meanwhile, were a drag on demand. Moving forward, real estate investment and inventory restocking needs are expected to drive demand. Japan In Japan, credit standards to firms and households continued to ease in Q4/2021 (Chart 9). However, more than 90% of respondents in each case reported that standards were basically unchanged, and there were no reported instances of tightening among the sample of 50 lenders. Those that did report easier standards cited aggressive competition from other banks and strengthened efforts to grow the business. The vast majority of lenders expect standards to remain unchanged over Q1, but there is a slight easing expected on a net percentage basis. Chart 9Japan Credit Conditions
Japan Credit Conditions
Japan Credit Conditions
Business loan demand on the whole was unchanged in Q4 although small and medium firms did increase demand slightly (middle panel). In contrast to other regions, business loan demand tends to behave counter-cyclically in Japan, with businesses borrowing more on a precautionary basis when they are pessimistic and vice-versa. Those dynamics were at play in Q4, with lenders attributing increased demand to a fall in firms’ internally generated funds. Banks expect a slight net pickup in demand next quarter, in line with business confidence which has fallen from its September peak on the back of concerns about Covid-19 infections, supply chain disruptions, and rising input prices. On the consumer side, loan demand was basically unchanged, with a very small net percentage of banks reporting weaker demand (bottom panel). The key reason for decreased demand was a decrease in household consumption, which is in line with retail sales, where the pace of growth has been falling. Even though core inflation in Japan is low, consumers are still exposed to rising energy prices, which might cause them to tighten other parts of their budgets. Canada Chart 10Canada Credit Conditions
Canada Credit Conditions
Canada Credit Conditions
In Canada, business lending standards continued to ease at a slightly slower pace in Q4/2021 (Chart 10). This marks the fourth consecutive quarter of easing conditions, coming amid booming economic activity, high capacity utilization, and buoyant sentiment. Both, price and non-price lending conditions eased at roughly the same pace. On the consumer side, non-mortgage lending conditions continued to ease, but at a slower pace (middle panel). 1-year ahead consumer spending growth expectations, sourced from the Bank of Canada’s (BoC) Survey Of Consumer Expectations, and non-mortgage lending conditions typically display an inverse correlation, with expected spending growth increasing when standards are getting easier on the margin and vice-versa. The divergence in Q4 is explained in part by excess savings accumulated during the pandemic that have yet to be spent down, and in part by expected price increases over the coming year. In either case, it demonstrates that nominal spending has room to grow even in an environment where consumer credit availability is worsening. We also saw mortgage standards ease at a slightly slower pace in Q4, with both price and non-price lending conditions easing (bottom panel). While the BoC has made a hawkish pivot, underlying conditions are still easy – the conventional 5-year mortgage rate is still flat at 4.79%, the same level as Q3/2020. However, house price growth has peaked, and rate hikes this year will help prices moderate further. New Zealand Chart 11New Zealand Credit Conditions
New Zealand Credit Conditions
New Zealand Credit Conditions
In New Zealand, business credit standards eased in the six month period ended September 2021 (Chart 11). However, the real impact of the Reserve Bank of New Zealand’s (RBNZ) tightening is being felt in the housing market, where actual standards entered tightening territory. More importantly, a net 23.1% of respondents expect mortgage credit availability to erode by the end of March; if realized, this figure would be a series high. Banks reporting less credit availability cited regulatory changes and risk perceptions. On the mortgage loan demand side, banks continued to see increased demand even after the record spike in March 2021 (middle panel). Going forward, demand is expected to moderate and fall from current levels. These dynamics have already made their mark on house prices which have already peaked, indicating that the RBNZ’s push is working as intended. Business loan demand does not appear to have been much affected by higher rates, with demand picking up slightly and expected to increase going forward (bottom panel). However, confidence has been falling since September 2021, with businesses feeling the twin bite of supply chain disruptions and labor shortages. Shakti Sharma Senior Analyst ShaktiS@bcaresearch.com Appendix: Where To Find The Bank Lending Surveys A number of central banks publish regular surveys of bank lending conditions in their domestic economies. The surveys, and the details on how they are conducted, can be found on the websites of the central banks: US Federal Reserve: https://www.federalreserve.gov/data/sloos.htm European Central Bank: https://www.ecb.europa.eu/stats/ecb_surveys/bank_lending_survey/ Bank of England: https://www.bankofengland.co.uk/credit-conditions-survey/2021/2021-q4 Bank of Japan: https://www.boj.or.jp/en/statistics/dl/loan/loos/index.htm/ Bank of Canada: https://www.bankofcanada.ca/publications/slos/ Reserve Bank of New Zealand: https://www.rbnz.govt.nz/statistics/c60-credit-conditions-survey Footnotes 1 The weblinks to each individual survey for the US, euro area, UK, Japan, Canada and New Zealand can be found in the Appendix on page 12. GFIS Model Bond Portfolio Recommended Positioning Active Duration Contribution: GFIS Recommended Portfolio Vs. Custom Performance Benchmark
Q1/2022 Credit Conditions Chartbook: Tightening Cometh?
Q1/2022 Credit Conditions Chartbook: Tightening Cometh?
The GFIS Recommended Portfolio Vs. The Custom Benchmark Index
Q1/2022 Credit Conditions Chartbook: Tightening Cometh?
Q1/2022 Credit Conditions Chartbook: Tightening Cometh?
Global Fixed Income - Strategic Recommendations* Duration Regional Allocation Spread Product Tactical Overlay Trades
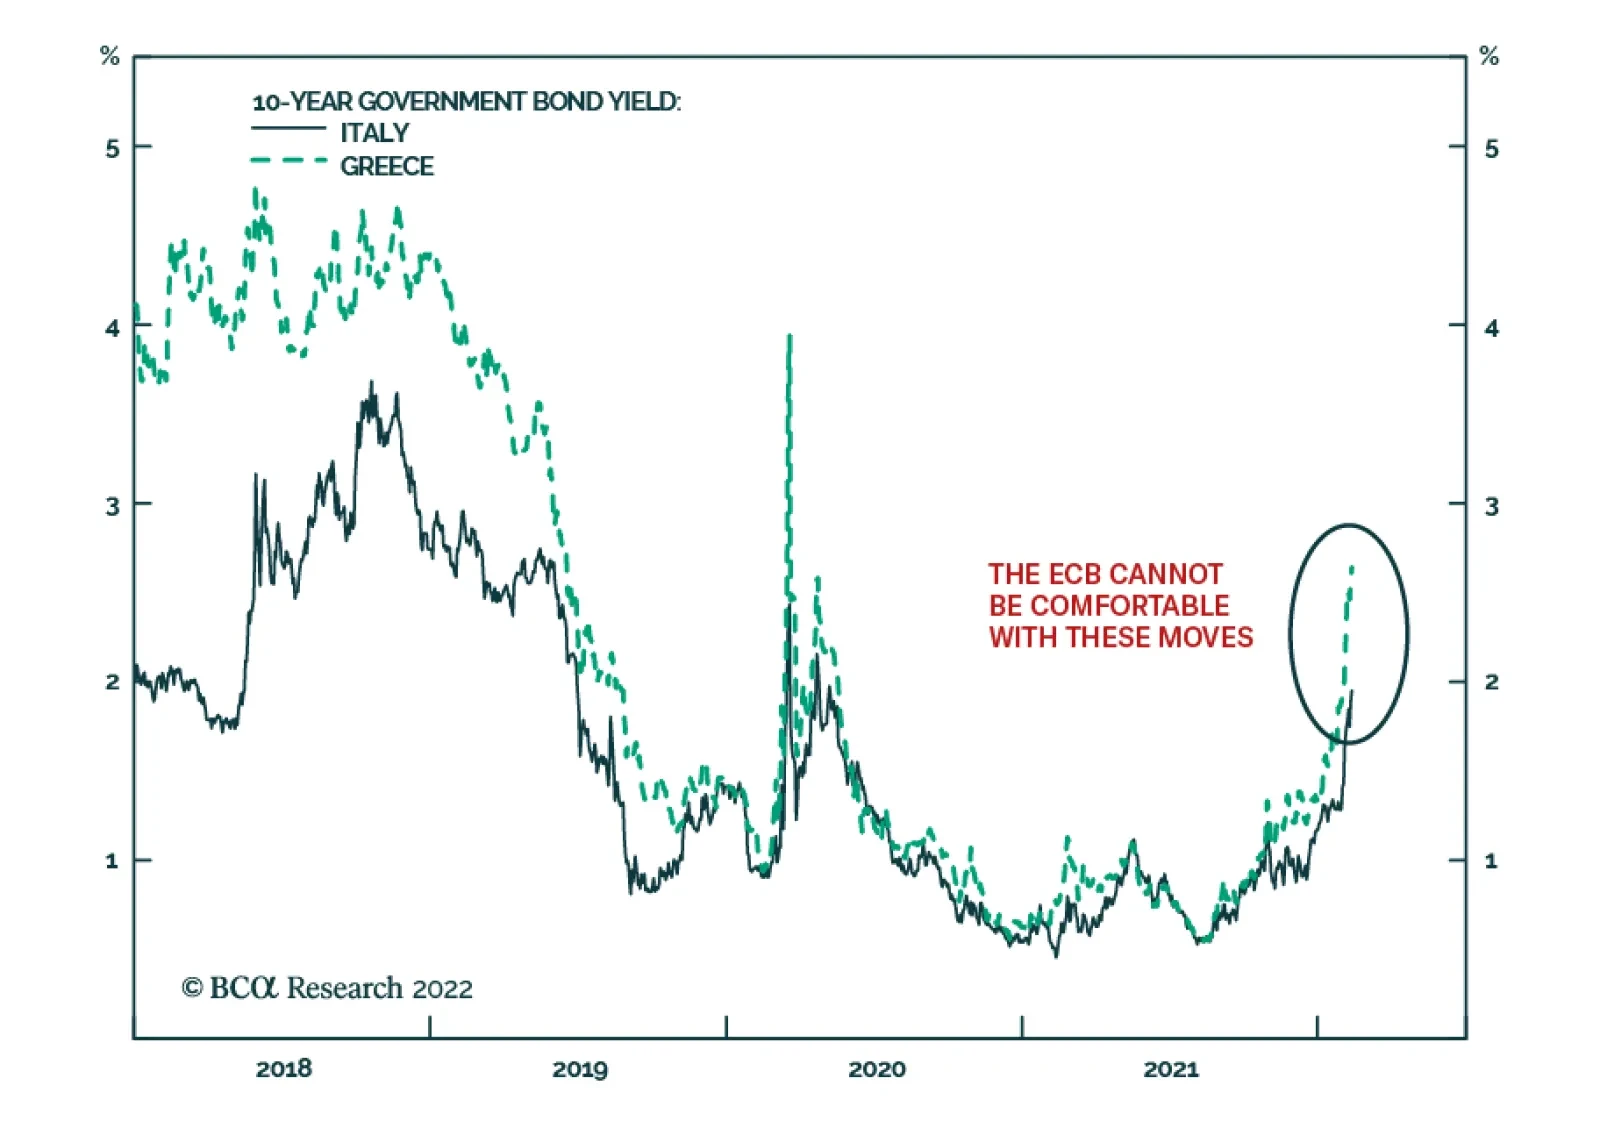
BCA Research’s European Investment Strategy service concludes that tightening financial conditions will preempt the European Central Bank from hiking rates as much as the money market is pricing in. First, the behavior of Italian and Greek bond markets…
Highlights A feedback loop has emerged in European markets. Tightening financial conditions will preempt the European Central Bank from hiking rates as much as the money market is pricing in. The widening in peripheral and credit spreads is overdone. Investors already long should maintain their positions. Investors without exposure will soon find an attractive entry point. Despite these near-term gyrations, the ECB is still on track to hike interest rates once in Q4 2022 and lift them aggressively in 2023. Feature Last week’s hawkish pivot by the European Central Bank (ECB) continues to affect markets. We take the words of the ECB at their face value; we anticipate the Governing Council (GC) to begin lifting interest rates at the end of 2022 and to continue to do so steadily over 2023 and 2024. However, as the shock filters through financial asset prices, we become more confident that the ECB will not lift rates five times in 2022 as the Euro Short Term Rate (ESTR) curve currently anticipates. Chart 1Growing Tensions In The Periphery...
Growing Tensions In The Periphery...
Growing Tensions In The Periphery...
First, the behavior of Italian and Greek bond markets constitutes a major support to our view. Italian and Greek 10-year spreads have widened by respectively 46 and 65 basis points over the past six trading days (Chart 1). This tension highlights that investors still view these economies as continental trouble spots. Meanwhile, the ECB’s communication continues to highlight the need for flexibility to maintain order in the sovereign debt market. The GC does not want inadvertently to engineer a severe tightening in financial conditions in the already fragile periphery. In this context, it is highly unlikely that the ECB will rush to terminate the Asset Purchase Program (APP), an end on which rate hikes depend. Second, the corporate bond market is also going through a significant period of ruction. Both investment grade and high-yield bond yields have risen rapidly in recent days, and they are now retesting their late-2018 levels (Chart 2, top two panels). Spreads too are widening meaningfully, even though they remain further away from their 2018 highs (Chart 2, bottom two panels) The ECB is unwilling to let a liquidity shock morph into a solvency problem for European firms. For now, the behavior of the European credit market remains consistent with a liquidity shock. Funding markets are experiencing a violent adjustment, which is bleeding into the overall level of spreads. However, investors are not differentiating based on credit risk. Chart 3 shows that CCC credit (the lowest rated HY bonds) is not selling off relative to the overall high-yield index, which we would anticipate if investors were worried about underlying default risk. Chart 3No Distinction On Credit Risk
No Distinction On Credit Risk
No Distinction On Credit Risk
Chart 2...And In European Corporates
...And In European Corporates
...And In European Corporates
If the liquidity shock were to deepen further and last long enough, the resilience of the corporate sector would fritter away. However, the GC has tried to resist a deflationary shock for more than ten years now, and a solvency problem would undo all the progress made toward escaping the European liquidity trap, especially because wages have yet to recover. Third, members of the ECB’s GC are already trying to talk down the market. President Christine Lagarde displayed a more dovish tone when she spoke in front of the EU Parliament on February 7, 2022. ECB Chief Economist Philippe Lane remains steadfast that wages are not yet a problem. The Governor of the Bank of France, François Villeroy de Galhau still sees an imminent peak in CPI, and Olli Rehn, Governor of the Bank of Finland, recently lectured about the need for a gradual normalization of policy. Even hawks like the Bundesbank’s Joachim Nagel or the DNB’s Klaas Knot have gestured toward higher rates, but only toward the end of the year. In this context, we expect credit spreads to begin to narrow again; however, it will likely first require an easing in funding pressures. This is unlikely to happen until US yields form an interim peak. However, as Chart 4 highlights, the Treasury market is becoming extremely oversold. Moreover, a JP Morgan survey shows that its clients are massively short duration. The risk of a pullback in Treasury yields is growing, even if rising inflation and fears of a tighter Fed prevail for now. If US yields were to decline Bunds would likely follow the Treasury market because the ECB is becoming louder that it does not want to tighten financial conditions abruptly. Hence, a pullback in global risk-free yields will be the key to a period of calm in credit spreads, since valuations have improved materially, with the breakeven spreads on investment grade and high-yield bonds moving back to their 43rd and 44th percentiles, respectively (Chart 5). A stabilization in global yields and European spreads should also percolate to the peripheral sovereign bond market and limit the upside to Italian and Greek spreads. Chart 4Oversold Treasurys
Oversold Treasurys
Oversold Treasurys
Chart 5Restoring Value In Corporates
Restoring Value In Corporates
Restoring Value In Corporates
Bottom Line: The tightening in financial conditions taking place in Europe indicates that money market curves are pricing in the path for European policy rates too aggressively. The ECB has changed since 2011. It will not let peripheral borrowing costs threaten the recovery in Southern European economies, nor will it allow a liquidity shock in the corporate bond market to become a solvency issue that will damage growth prospects. European peripheral and corporate spreads will narrow once global risk-free rates peak. Mathieu Savary, Chief European Strategist Mathieu@bcaresearch.com