Europe

HighlightsSince 2008, US equity outperformance versus global ex-US stocks has not been driven by stronger top-line growth. Instead, it has been caused by a narrowly-based increase in profit margins, the accretive impact of share buybacks on the EPS of US growth stocks, and an outsized expansion in equity multiples. To a lesser extent, the dollar has also boosted common currency relative performance.There are significant secular risks to these sources of US equity outperformance over the past 14 years. Elevated tech sector profit margins are likely to lead to increased competition and higher odds of regulatory action, leveraging has reduced the ability of US companies to continue to accrete EPS through changes to capital structure, relative multiples are not justified by relative ROE, and the US dollar is expensive and is likely to fall over a multi-year horizon.In absolute terms, we forecast that US stocks will earn annualized nominal total returns of between 1.8 - 4.7% over the coming decade, assuming 4-5% annual revenue growth, flat profit margins, a constant 2% dividend yield, and a constant equity risk premium. Long-maturity bond yields are below their equilibrium levels and are likely to rise in real terms over time, which will weigh on elevated equity multiples.Over the coming 6-12 months, our view that US 10-Year Treasury yields are likely to rise argues for an underweight stance toward growth versus value stocks. In turn, this implies that US stocks will underperform global stocks, especially versus developed markets ex-US.The risks that we have highlighted to the sources of US outperformance suggest that US stocks may be flat versus their global peers over the long-term, arguing for a neutral strategic allocation. It also suggests that investors should be prepared to accept more volatility in order to reduce the gap between expected and desired returns, and should look towards riskier investments and asset classes (such as real estate and alternative investments) as potential portfolio return enhancements.Feature Chart II-1The US Has Massively Outperformed Other Equity Markets Since The Global Financial Crisis
The US Has Massively Outperformed Other Equity Markets Since The Global Financial Crisis
The US Has Massively Outperformed Other Equity Markets Since The Global Financial Crisis
The US equity market has vastly outperformed its peers since the 2008/2009 global financial crisis. Chart II-1 highlights that an investment in US stocks at the end of 2007 is now worth over 4 times the invested amount, versus approximately 1.6 times for global ex-US stocks (when measured in US dollar terms). The chart also shows that USD-denominated total returns have been roughly the same for developed markets ex-US as they have been for emerging markets, highlighting the exceptional nature of US equities.In this report we provide a deep examination of the sources of US equity performance, their likely sustainability, and what this implies for long-term investor return expectations. US stocks have not outperformed because of stronger top-line (i.e. revenue) growth, and instead have benefitted from a narrowly-based increase in profit margins, active changes to capital structure that have benefitted stockholders, an outsized expansion in equity multiples relative to global stocks, and a structural appreciation in the US dollar.We conclude that there are significant risks to all of these sources of outperformance, and that a neutral strategic allocation to US equities is now likely warranted. We also highlight that, while a strategic overweight stance is still warranted toward stocks versus bonds, investors should no longer count on US stocks to deliver returns that are in line with or above commonly-cited absolute return expectations. This argues for a greater tolerance of volatility, and the pursuit of riskier investments and asset classes (such as real estate and alternative investments) as potential portfolio return enhancements.A Deep Examination Of US Outperformance Since 2008Breaking down historical total return performance is the first step in judging whether US equities are likely to outperform their global ex-US peers on a structural basis. Below we deconstruct US and global total return performance over the past 14 years into six different components, and analyze the impact of some of these components on a sector-by-sector basis. The six components presented are:Total revenue growth for each equity market, in local currency termsThe change in profit marginsThe impact of changes in capital structure and index compositionThe change in the trailing P/E ratioThe income return from dividendsThe impact of changes in foreign exchangeThe sum of the first three factors explains the total growth in earnings per share over the period, and the addition of the fourth factor explains each market’s local currency price return. Income returns are added to explain total return over the period, with the sixth factor then explaining common currency total return performance. The FX effect for US stocks is zero by construction, given that we measure common currency performance in US$ terms. Chart II-2Strong US Returns Have Not Been Due To Strong Top Line Growth
October 2021
October 2021
Chart II-2 presents the annualized absolute impact of these factors for the MSCI US index since 2008. The chart highlights that U.S. stock prices have earned roughly 11% per year in total return terms over the past 14 years, with significant contributions from revenue growth, multiple expansion, margins, and the return from dividends.Interestingly, however, Chart II-3 highlights that US equities have not significantly outperformed on the basis of the first factor, total local currency revenue growth, at least relative to overall global ex-US stocks (see Box II-1 for more details). DM ex-US stocks have experienced very weak revenue growth since 2008, but this has been compensated for by outsized EM revenue growth. It is also notable that US revenue growth has actually underperformed US GDP growth over the period, dispelling the notion that US equity outperformance has been due to strong top-line effects.Chart II-3The US Has Outperformed Due To Margins, Capital Structure, Multiples, And The Dollar
October 2021
October 2021
Box II-1Proxying The Impact Of Changes In Shares OutstandingWe proxy the impact of changes in shares outstanding (and thus the impact of equity dilution / accretion) by dividing each index’s market capitalization by its stock price. This measure is not a perfect proxy, as changes in index composition (such as the addition/deletion of index constituents) will change the index’s market capitalization but not its stock price. We also calculate total revenue for each market by multiplying local currency sales per share by the market cap / stock price ratio, meaning that the total revenue growth figures shown in Chart II-3 should best be viewed as estimates that in some cases reflect index composition effects.However, Chart II-B1 highlights that adjusting the market cap / stock price ratio for the number of firms in the index does not meaningfully change our overall conclusions. This approach would imply a larger dilution effect for DM ex-US than suggested in Chart II-3, and a smaller effect for emerging markets (due to a significant rise in the number of EM index constituents since 2008). In addition, global ex-US revenue growth is modestly lower than US revenue growth when using this approach. But this gap would account for a fraction of US equity outperformance over the period, underscoring that the US has massively outperformed global ex-US stocks due to margin, capital structure, and multiple expansion effects. Chart II-B1The US Has Not Meaningfully Outperformed Due To Revenue Growth, No Matter How You Slice It
October 2021
October 2021
Chart II-3 also highlights that global ex-US stocks have modestly outperformed the US in terms of the fifth factor, the income return from dividends. This has almost offset the negative FX return (the sixth factor) from a net rise in the US dollar over the period.What is clear from the chart is that the second, third, and fourth factors explain almost all of the difference in total return between US and global ex-US stocks since 2008. The US experienced a significant increase in profit margins versus a modest contraction for global ex-US, a modest fillip from changes in capital structure and index composition versus a substantial drag for ex-US stocks, and a sizable rise in equity multiples that has outpaced what has occurred around the globe in response to structurally lower interest rates. Chart II-4US Margin Outperformance Has Been Narrowly-Based
October 2021
October 2021
The significant rise in aggregate US profit margins over the past 14 years has often been attributed to the strong competitiveness of US companies, but Chart II-4 highlights that the aggregate change mostly reflects a narrow sector composition effect. The chart shows the change in US and global ex-US profit margins by level 1 GICS sector since 2008, and underscores that overall profit margins outside of the US have fallen mostly due to lower oil prices. Conversely, in the US, profit margins have substantially risen in only three out of ten sectors: health care, information technology, and communication services.Chart II-5 highlights that global ex-US equity multiples have risen in a majority of sectors since 2008, but not by the same magnitude as what has occurred in the US. De-rating in the resource sector partially explains the gap, but stronger US multiple expansion in the heavily-weighted consumer discretionary, information technology, and communication services sectors appears to explain most of the gap in multiple expansion.Chart II-5Multiples Have Risen Globally, But More So For Broadly-Defined US Tech Stocks
October 2021
October 2021
Finally, Charts II-6 & II-7 highlights that there has been a strong growth versus value dimension to the impact of changes in capital structure and index composition on regional equity performance. The charts show that equity dilution and other changes to index composition have caused a similar drag on the returns from value stocks in the US and outside the US. However, the charts also highlight that the more important effect has been the accretive impact of share buybacks on the EPS of US growth stocks, which has not been matched by growth stocks outside of the US. As noted in Box II-1, part of this gap may be explained by an increase in the number of companies included in the MSCI Emerging Markets index, but Chart II-8 highlights that the global ex-US ratio of market capitalization to stock price has still risen significantly over the past 14 years, in contrast to that of the US even after controlling for the number of index components. Chart II-6There Has Been A Strong Style Dimension…
There Has Been A Strong Style Dimension...
There Has Been A Strong Style Dimension...
Chart II-7…To The Impact Of Changes In Capital Structure And Index Composition
...To The Impact Of Changes In Capital Structure And Index Composition
...To The Impact Of Changes In Capital Structure And Index Composition
Chart II-8The Accretive Impact Of US Growth Stock Buybacks Has Not Been Matched Globally
The Accretive Impact Of US Growth Stock Buybacks Has Not Been Matched Globally
The Accretive Impact Of US Growth Stock Buybacks Has Not Been Matched Globally
The bottom line for investors is that there have been multiple factors contributing to US equity outperformance since 2008, but aggregate top-line growth has not been one of them. Broadly-defined technology companies (including media & entertainment and internet retail firms) have been responsible for nearly all of the relative rise in profit margins and most of the relative expansion in multiples over the past 14 years, and US growth stocks have benefitted from the accretive impact of share buybacks to a larger degree than what has occurred globally.The Relative Secular Return Outlook For US StocksWe present below several structural risks to the continued outperformance of US equities for the factors that have been most responsible for this performance over the past 14 years. In some cases, these risks speak to the potential for US outperformance to end, not necessarily that the US will underperform. But even the cessation of US outperformance along one or more of these factors would be significant, as it would imply a potential inflection point in the most consequential trend in regional equity performance since the 2008/2009 global financial crisis.Profit MarginsChart II-9 presents the 12-month trailing combined profit margin for the US consumer discretionary, information technology, and communication services sector versus that of the remaining sectors. The chart underscores the points made by Chart II-4 in time series form, namely that the net increase in overall US profit margins since 2008 has been narrowly based. Chart II-9The US Profit Margin Expansion Has Been Driven By Broadly-Defined Tech Stocks
The US Profit Margin Expansion Has Been Driven By Broadly-Defined Tech Stocks
The US Profit Margin Expansion Has Been Driven By Broadly-Defined Tech Stocks
Over a 6-12 month time horizon, the clear risk to US profit margins is an end to the COVID-19 pandemic. The profitability of broadly-defined tech stocks has surged during the pandemic, in response to a significant shift toward online goods purchases and elevated spending on tech equipment. A durable end to the pandemic is likely to reverse some of these spending patterns, which will likely weigh on margins for broadly-defined tech stocks. Chart II-10The Regulatory Risks Facing Big Tech Are Real
October 2021
October 2021
Over the longer term, the risk is that extremely elevated profit margins are likely to increase the odds of regulatory action from Washington and invite competition. On the former point, our US Political Strategy service has highlighted that a bipartisan consensus in public opinion holds that Big Tech needs tougher regulation (Chart II-10), and this consensus grew substantially over the controversial 2020 political cycle.1 This regulatory pressure is currently best described as a “slow boil,” as not all surveys show strong majorities in favor of regulation, and Republicans and Democrats disagree on the aims of regulation.But the bottom line is that Big Tech is likely to remain in the hot seat after the various controversies of the pandemic and 2016-2020 elections, just as big banks faced tougher regulation in the wake of the subprime mortgage crisis. This underscores that a “slow boil” may turn into a faster one at some point over the secular horizon, which would very likely weigh on profit margins. Elevated tech sector profit margins makes regulatory action more likely because policymakers will perceive a stronger ability for these firms to weather a “regulatory shock.”On the latter point about competition, it is true that broadly-defined tech stocks follow a “platform” business model that will be difficult to supplant. These companies benefit from powerful network effects that have taken years to accrue, suggesting that they will not be rapidly replaced by competitors.Still, the experience of Microsoft in the years following its meteoric rise in the second half of the 1990s provides a cautionary tale for broadly-defined tech stocks today. In the late-1990s, it was difficult for investors to envision how Microsoft’s near-total product dominance of the PC ecosystem could ever be displaced, but it eventually lost market share due to the rise of mobile devices and their competing operating systems.In addition, Microsoft’s fundamental performance suffered even before the rise of the modern-day smartphone & mobile device market. Chart II-11 highlights the annualized components of Microsoft’s price return from 1999-2007 versus the late-1990s period, which underscores that changes in margins, changes in multiples, and stock price returns may be persistently negative in a scenario in which revenue growth slows (even if revenue growth itself remains positive).Chart II-11Microsoft Offers A Cautionary Tale For Dominant Business Models
October 2021
October 2021
Some of the reversal of Microsoft’s fortunes during this period were self-inflicted, and the firm also suffered from an economy-wide slowdown in tech equipment spending as a result of the 2001 recession that persisted into the early years of the subsequent recovery. But the key point for investors is that company and sector dominance may wane, and the fact that broadly-defined tech sector profit margins are extremely elevated raises the risk that further increases may not materialize.Capital Structure And Index CompositionAs noted above, the beneficial impact from changes in capital structure and index composition for US equities has occurred due to the accretive impact of share buybacks on the EPS of US growth stocks, which has not been matched by growth stocks outside of the US.In our view, this accretive impact has occurred for two reasons. First, US growth stocks have taken advantage of historically low interest rates and leverage to shift their capital structure to be more debt-focused over the past 14 years. Second, this shift has been aided by the fact that US growth stocks have experienced stronger cash flows than their global peers, which have been used to service higher debt payments.However, Charts II-12 and II-13 suggest that this process may be in its late innings. Chart II-12 highlights that the US nonfinancial corporate sector debt service ratio (DSR) did indeed fall below that of the euro area following the global financial crisis, but that this reversed in 2016. At the onset of the pandemic, the US nonfinancial corporate sector DSR was rising sharply, and was approaching its early-2000 highs. During the pandemic, the corporate sector DSR has continued to rise in both regions, but this almost exclusively reflects a (temporary) decline in operating income, not a surge in corporate sector debt or a rise in interest rates.Not all of the pre-pandemic rise in the US corporate sector DSR was concentrated in broadly-defined tech stocks, but some of it likely was. The key point for investors is that the US nonfinancial corporate sector had a lower capacity to leverage itself relative to companies in the euro area at the onset of the pandemic, which implies a less accretive impact on relative earnings per share in the future. Chart II-13 reinforces this point by highlighting that the uptrend in relative cash flow for US growth stocks, versus global ex-US, appears to have ended in 2015. The uptrend has continued in per share terms, but this appears to be flattered by the impact of buybacks itself. Chart II-12Can The US Continue To Accrete EPS Through Stock Buybacks?
Can The US Continue To Accrete EPS Through Stock Buybacks?
Can The US Continue To Accrete EPS Through Stock Buybacks?
Chart II-13US Growth Companies Are No Longer Generating More Cash Than Their Global Peers
US Growth Companies Are No Longer Generating More Cash Than Their Global Peers
US Growth Companies Are No Longer Generating More Cash Than Their Global Peers
Admittedly, we see no basis to conclude that the persistent earnings dilution that has occurred in emerging markets over the past 14 years will end, or even slow, over the secular horizon. This underscores that emerging markets will need to generate stronger revenue growth to prevent the dilution effect from acting as a continued drag on EM vs. US equity performance, and it is an open question as to whether this will occur. Thus, for now, we have more conviction in the view that capital structure and index composition changes may contribute less to US equity outperformance versus developed markets ex-US over the coming several years.Equity MultiplesThere are three arguments against the idea that US equity multiples will continue to expand relative to those of global ex-US stocks. First, Chart II-14 highlights a point that we have made in previous Bank Credit Analyst reports, which is that aggressive multiple expansion in the US has now rendered US stocks to be the most dependent on low long-maturity bond yields than at any point since the global financial crisis. Chart II-14US Stocks Are The Most Dependent On Low Bond Yields In Over A Decade
US Stocks Are The Most Dependent On Low Bond Yields In Over A Decade
US Stocks Are The Most Dependent On Low Bond Yields In Over A Decade
Over the coming 6- to 12-months, we strongly doubt that US 10-year Treasury yields will rise outside of the range that would be consistent with the US equity risk premium from 2002 to 2007 (discussed in further detail in the next section). But the chart also shows that this range is now clearly below trend nominal GDP growth, suggesting that higher interest rates on a structural basis may cause outright multiple contraction for US stocks. This is particularly true for growth stocks, which have been responsible for a significant portion of US equity outperformance, given their comparatively long earnings duration. Chart II-15US Multiples Are Not Justified By Higher Return On Equity
US Multiples Are Not Justified By Higher Return On Equity
US Multiples Are Not Justified By Higher Return On Equity
Second, it has been often argued by some investors that a premium is warranted for US stocks given their comparatively high return on equity, but Chart II-15 highlights that this is not the case. The chart shows the relative price-to-book ratio for the US versus global and developed markets ex-US compared with regression-based predicted values based on relative return on equity. The chart clearly highlights that the US price-to-book ratio is meaningfully higher than it should be relative to global stocks, especially when compared to other developed markets. Versus DM ex-US, the only comparable period that saw a relative P/B – relative ROE deviation of this magnitude occurred in the late-1980s, when US stocks were meaningfully less expensive than relative ROE would have suggested. This relationship completely normalized in the years that followed, which would imply a substantial relative multiple contraction for US stocks over the coming several years were the gap shown in Chart II-15 to close.Third, Chart II-16 presents the share of US stock market capitalization accounted for by the largest 10% of stocks by size. The chart highlights that the concentration of US market capitalization has risen to an extreme level that has only been reached in two other cases over the past century. Historically, prior stock market concentration has been associated with future increases in the equity risk premium, underscoring that broadly-defined US tech sector concentration bodes poorly for future returns. Chart II-16The US Stock Market Is Now Extremely Concentrated
The US Stock Market Is Now Extremely Concentrated
The US Stock Market Is Now Extremely Concentrated
The Foreign Exchange EffectAs a final point, Chart II-17 illustrates the degree to which US relative performance has meaningfully benefitted from a rise in the US dollar since 2008. The chart highlights that an equity market-weighted dollar index has risen 20% from its late-2007 level, which has boosted US common currency relative performance.The US dollar was arguably modestly undervalued just prior to the 2008/2009 global financial crisis, but Chart II-18 highlights that it is now meaningfully overvalued versus other major currencies. Over a multi-year horizon, this argues against further relative common currency gains for US stocks from the foreign exchange effect. Chart II-17The US Dollar Has Helped US Common Currency Performance...
The US Dollar Has Helped US Common Currency Performance...
The US Dollar Has Helped US Common Currency Performance...
Chart II-18…And Is Now Expensive
October 2021
October 2021
The Absolute Secular Return Outlook For US StocksOver a secular horizon, the most common method for forecasting equity returns is to predict whether earnings are likely to grow faster or slower than nominal potential GDP growth, and whether equity multiples are likely to rise or fall.For the reasons described above, we have no plausible basis on which to forecast that US profit margins are inclined to rise further over time given how extended they have become. This suggests that a reasonable long-term earnings forecast should be closely linked to one’s forecast for revenue growth. Chart II-19S&P 500 Revenue Is Low Relative To US GDP, And May Rise Over The Next Decade
S&P 500 Revenue Is Low Relative To US GDP, And May Rise Over The Next Decade
S&P 500 Revenue Is Low Relative To US GDP, And May Rise Over The Next Decade
Chart II-19 presents S&P 500 revenue as a percent of nominal GDP, and underscores a fact that we noted above: revenue growth for US equities has underperformed US GDP since the global financial crisis. This undoubtedly has been linked to the fallout from the crisis and other exogenous shocks like the massive decline in energy prices in 2014/2015, which are unlikely to be repeated. Over the next ten years, the US Congressional Budget Office is forecasting nominal potential growth of roughly 4%; allowing for a potential rise in US equity revenue to GDP suggests that investors should expect earnings growth on the order of 4-5% per year over the coming decade, if extremely elevated profit margins are sustained. Chart II-20Multiples Seem To Predict Future Returns Well…
October 2021
October 2021
Unfortunately for equity investors, there are slim odds that US equity multiples will continue to rise or even stay at their current level. Equity valuation has been shown to have nearly zero ability to predict stock returns over a 6-12 month time horizon or even over the following 3-5 years, but 10-year regressions relating current valuations on future 10-year compound returns tend to be highly predictive (Chart II-20). Utilizing this approach, today’s 12-month forward P/E ratio would imply a 10-year future total return of just 2.9% (Chart II-21). That, in turn, would imply a annual drag of 3-4% from multiple contraction over the coming decade, given our 4-5% earnings growth forecast and a historically average dividend yield of roughly 2%.One problem with the method shown in Charts II-20 and II-21 is the fact that the relationship between today’s P/E ratio and 10-year future returns captures more than the impact of potentially mean-reverting multiples. It also includes any correlation between the starting point of valuation and subsequent earnings growth, which is likely to be spurious. This effect turns out to be important: we can see in Chart II-21 that the strong fit of the relationship is influenced by the fact that the global financial crisis occurred roughly 10-years after the equity market bubble of the late-1990s. Chart II-21...But That Depends Heavily On The Tech Bubble / GFC Relationship
...But That Depends Heavily On The Tech Bubble / GFC Relationship
...But That Depends Heavily On The Tech Bubble / GFC Relationship
Astute investors may infer a legitimate causal link between these two events, via too-easy monetary policy. But from the perspective of forecasting, predicting future returns based on prevailing equity multiples confusingly mixes together three effects: the relative timing of business cycles, the impact of changes in interest rates, and the potential mean-reverting nature of the equity risk premium.In order to disentangle these effects for the purposes of forecasting, we present a long-history estimate of the US equity risk premium based on Robert Shiller’s Irrational Exuberance dataset (Chart II-22). We define the equity risk premium as earnings per share (as reported) as a percent of the S&P 500, minus the real long-maturity interest rate. We calculate the real rate by subtracting the BCA adaptive inflation expectations model – essentially an exponentially smoothed version of actual inflation – from the nominal long-term bond yield. Chart II-22The US ERP Seems Normal Based On A Very Long Term History...
The US ERP Seems Normal Based On A Very Long Term History...
The US ERP Seems Normal Based On A Very Long Term History...
The chart highlights that this estimate of the ERP is currently exactly in line with its median value since 1872. Chart II-23 presents essentially the same conclusion, based on data since 1979, using the forward operating P/E ratio for the S&P 500 and the same definition for real bond yields.This implies that, if interest rates were at equilibrium levels, investors would have a reasonable basis to conclude that equity multiples would be unchanged over a secular investment horizon. However, as we have highlighted several times in previous reports, long-maturity government bond yields are likely well below equilibrium levels. Chart II-24 highlights that long-maturity US government bond yields have not been this low relative to trend growth since the late-1970s. Chart II-23...And Based On The Forward Earnings Yield Over The Past Four Decades
...And Based On The Forward Earnings Yield Over The Past Four Decades
...And Based On The Forward Earnings Yield Over The Past Four Decades
Chart II-24Interest Rates Are Well Below Equilibrium, And Are Likely To Rise Over Time
Interest Rates Are Well Below Equilibrium, And Are Likely To Rise Over Time
Interest Rates Are Well Below Equilibrium, And Are Likely To Rise Over Time
We presented in an April report why a gap between interest rates and trend rates of growth was indeed justified for a few years following the global financial crisis, but that a decline in the equilibrium real rate of interest (“r-star”) only appeared to be permanent due to persistent, non-monetary policy shocks to aggregate demand that occurred over the course of the last economic cycle.2In a scenario where the US output gap turns positive, inflation rises modestly above target, and where permanent damage to the labor market from the pandemic is relatively limited over the coming 6-18 months, it seems reasonable to conclude that the narrative of secular stagnation may ultimately be challenged and that investor expectations for the neutral rate may converge toward trend rates of economic growth. This would weigh on equity multiples, and thus lower equity total returns from the 6-7% implied by our earnings forecast and income return assumption. Chart II-25US Stocks Are Likely To Earn Annual Total Returns Between 1.8-4.7% Over The Next Decade
October 2021
October 2021
Were real long-maturity bond yields to rise by 100-200bps over the coming decade, this would imply annualized total returns of between 1.8 - 4.7% from US stocks, assuming 4-5% annual revenue growth, flat profit margins, a constant 2% dividend yield, and a constant ERP (Chart II-25). While this would beat the returns offered by bonds, implying that investors should still be structurally overweight equities versus fixed-income assets, it would also fall meaningfully short of the average pension fund return objective (Chart II-26), as well as the absolute return goals of many investors. Chart II-26Future Returns From US Stocks Will Greatly Disappoint Investors
Future Returns From US Stocks Will Greatly Disappoint Investors
Future Returns From US Stocks Will Greatly Disappoint Investors
Investment Conclusions Chart II-27Over The Coming Year, Favor Value And Global Ex-US Stocks
Over The Coming Year, Favor Value And Global Ex-US Stocks
Over The Coming Year, Favor Value And Global Ex-US Stocks
Over the coming 6-12 months, our view that 10-year US Treasury yields are likely to rise supports an overweight stance toward value versus growth stocks. Chart II-27 highlights that the underperformance of growth argues for an underweight stance toward US stocks within a global equity portfolio, especially versus developed markets ex-US.Over a longer-term horizon, there are two key investment implications from our research. First, the risks that we have highlighted to the sources of US outperformance over the past 14 years suggests that investors should not bank on a continuation of this trend over the next decade. We have not made the case in this report for the outperformance of global ex-US stocks, merely that the continued outperformance of US stocks now rests on an unreliable foundation. This may suggest that US relative performance will be flat over the structural horizon, arguing for a neutral strategic allocation. But even the cessation of US outperformance would be a significant development, as it would end the most consequential trend in regional equity performance in the post-GFC era.Second, investors should expect meaningfully lower absolute returns from US stocks over the next decade than what they have earned since 2008/2009, barring a continued rise in the already stretched profit margins of broadly-defined tech stocks. A structurally overweight stance is still warranted toward equities versus fixed-income, but even a 100% equity allocation is unlikely to meet investor return expectations in the high single-digits. As a consequence, global investors should be prepared to accept more volatility in order to reduce the gap between expected and desired returns, and should look towards riskier investments and asset classes (such as real estate and alternative investments) as potential portfolio return enhancements.Jonathan LaBerge, CFAVice PresidentThe Bank Credit AnalystFootnotes1 Please see US Political Strategy "Forget Biden's Budget," dated June 2, 2021, available at usps.bcaresearch.com2 Please see The Bank Credit Analyst “R-star, And The Structural Risk To Stocks,” dated March 31, 2021, available at bca.bcaresearch.com
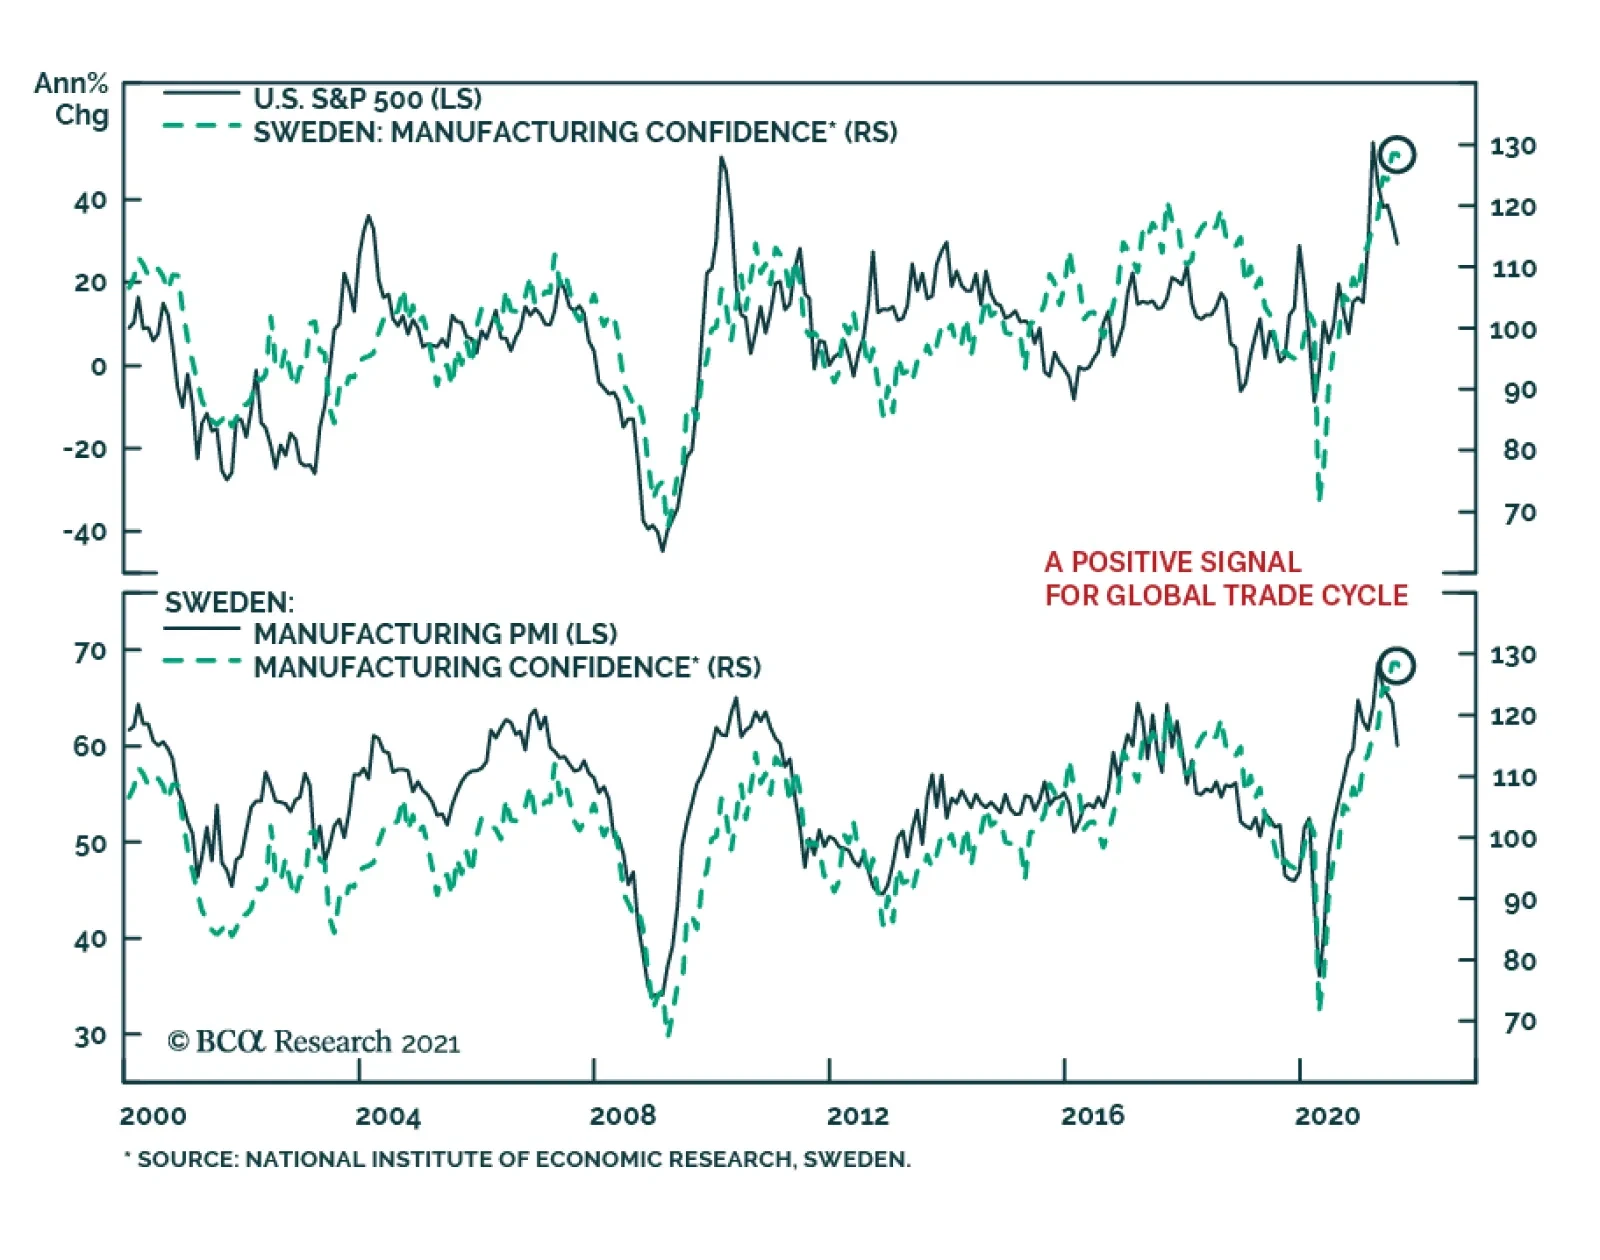
Results from Sweden’s September Economic Tendency survey were a minor disappointment. The headline indicator slipped 0.7 points to 119.9. The confidence indicators for both the manufacturing industry and consumer declined marginally. Despite the slight…
Highlights Monetary Policy: Last week’s numerous central bank meetings across the world confirmed that the overall direction for global monetary policy is shifting in a more hawkish direction. The main reason: growing fears that elevated inflation will persist for much longer than expected, even with global growth having lost some momentum. Country Allocation: The relative degrees of central banker hawkishness support our current government bond country allocation strategy. Stay underweight the US, UK, Canada, New Zealand and Norway where markets are discounting a path for future policy rates over the next two years that is too flat. Remain overweight countries where there is less need for a more aggressive tightening response: the euro area (both the core and periphery), Australia, Sweden and Japan. Still The Only Game In Town Last week was a busy one for global bond markets, with no fewer than 14 central banks within both the developed markets (DM) and emerging markets (EM) holding policy meetings. The results were eventful: Within EM, Brazil and Hungary lifted policy rates. Norway followed suit to become the first G-10 central bank to hike during the COVID era. The Fed teed up a formal announcement on tapering asset purchases at the next FOMC meeting in November. The Bank of England (BoE) gave strong hints that rate hikes could come sooner than expected, perhaps even before year-end. Chart of the WeekMonetary Policy Backdrop Turning More Bond-Bearish
Monetary Policy Backdrop Turning More Bond-Bearish
Monetary Policy Backdrop Turning More Bond-Bearish
Global bond yields in the developed markets took notice of the change in central bank guidance, especially from the Fed and BoE. The benchmark 10-year US Treasury yield rose from a pre-FOMC low of 1.30% to an intraday high of 1.57% yesterday – a level last seen late June. Longer-dated yields in the UK also rose significantly, with the 30-year Gilt yield rising from a pre-BoE meeting low of 1.11% to an intraday high of 1.40% yesterday – also the highest level since June. The pull on yields extended to other countries, as well, with 10-year yields in Germany, Canada and Australia climbing to three-month highs. The overall message from all of those policy meetings was one of an incremental shift toward less accommodative policies, even as the pace of global economic growth has slowed in recent months. Policymakers are growing more concerned that higher inflation could linger for longer (Chart of the Week). At the same time, loose policy settings have fueled a boom in asset markets that supports growth through easy financial conditions, but also raises future stability risks that worry the central banks. The number of countries seeing actual rate hikes is growing. Our Global Monetary Policy Tightening Indicator shows that just over one-quarter of G-10 and EM central banks have lifted rates over the past three months (Chart 2). All but one (Norway) are in EM, where policymakers have had to act more mechanistically in response to high inflation, even with softening economic growth momentum. While the slower pace of growth is more visible in EM relative to DM, when looking at cyclical indicators like manufacturing PMIs, inflation rates are simply too high around the world for inflation-targeting central banks to ignore (Chart 3). Chart 2Our Global Monetary Policy Indicator Shows A More Hawkish Turn
Our Global Monetary Policy Indicator Shows A More Hawkish Turn
Our Global Monetary Policy Indicator Shows A More Hawkish Turn
Chart 3Global CBs Growing More Worried About Inflation Risks
Global CBs Growing More Worried About Inflation Risks
Global CBs Growing More Worried About Inflation Risks
Within the major DM countries, there has been a notable shift in interest rate expectations in a more hawkish direction. Interest rate markets are, for the most part, still underestimating the potential for tighter monetary policies over the next couple of years. This is the main reason why we continue to recommend an overall below-benchmark strategic stance on global duration exposure. However, the relative expected pace of rate hikes also informs our views on country allocation. In Table 1, we show expectations for the timing of the next rate hike, as well as the cumulative amount of rate increases to the end of 2024, that are currently discounted in DM overnight index swap (OIS) curves. We present the latest level for both, as well as the reading from earlier this month to see how expectations have changed. Table 1Markets Still Pricing Very Modest Tightening Cycles
Marking-To-Market Our Bond Calls After "Central Bank Week"
Marking-To-Market Our Bond Calls After "Central Bank Week"
The so-called “liftoff date” for the first rate hike has been most notably pulled forward in the UK from January 2023 to May 2022, while other countries have seen more modest shifts in the timing of the next rate increase. More importantly, the discounted pace of rate hikes to end-2024 for all countries shown in the table has increased since early September (including Norway, factoring in last week’s tightening move by the Norges Bank). In our view, the biggest driver of relative government bond market yield movements and returns over the next 6-12 months will be the relative adjustments in the expected pace of rate hikes. On that front, the biggest shift higher in cumulative tightening has occurred in countries where we are more pessimistic on government bond performance on a relative basis to the global benchmark: the US, Canada, the UK and Norway. The smaller increases in the pace of hikes have occurred in our more preferred markets – Australia, Sweden, the euro area, and Japan. Assessing Our Two Biggest Government Bond Underweights: The US & UK For last week’s Fed meeting, a new set of economic and interest rate projections from the FOMC members (“the dots”) were presented (Chart 4). Compared to the forecasts from the June meeting, US real GDP growth expectations for 2021 were revised down (5.9% vs 7.6%) but were boosted for 2022 (3.8% vs 3.3%) and 2023 (2.5% vs 2.4%). A new forecast for 2024 was added, coming in at 2.0%. Importantly, none of those growth forecasts was below the median FOMC estimate of the longer-run real GDP growth rate of 1.8% (top panel). In other words, the Fed is not anticipating below-trend growth anytime in the next three years. Chart 4The Fed’s Rate Projections Look Too Low
Marking-To-Market Our Bond Calls After "Central Bank Week"
Marking-To-Market Our Bond Calls After "Central Bank Week"
The same conclusion goes for the US unemployment rate (second panel), with the median FOMC projection for 2022 (3.8%), 2023 (3.5%) and 2024 (3.5%) all below the median longer-run “full employment” estimate of 4.0%. The forecasts for US inflation (third panel) reflect that persistent low level of unemployment. Headline PCE inflation is expected to end 2021 at 4.2%, to be followed by a somewhat slower pace – but still above the 2% Fed inflation target – in 2022 (2.2%), 2023 (2.2%) and 2024 (2.1%). Yet despite these forecasts that show US growth and inflation exceeding its longer-run estimates for the next few years, the FOMC is projecting a relatively slow upward path for interest rates. The median dot now calls for the Fed to hike the funds rate once in 2022 and three more times in both 2023 and 2024. This would bring the funds rate to 1.75% by the end of 2024 – still 75bps below the Fed’s estimate of the longer-run “neutral” funds rate of 2.5% (bottom panel). That projected path for the funds rate is higher than the June dots, which only called for 75bps of cumulative hikes to the end of 2023. There is a wide divergence of opinions on the future path of rates within the FOMC, but the hawks appear to be winning the internal battle (Chart 5). There is now a 9-9 split of FOMC members who are calling for a rate hike in 2022, compared to a 7-11 split back in June, while the number of those projecting a funds rate above 1% in 2023 rose from 5 to 9. Chart 5A Wide Dispersion Of FOMC Interest Rate Views For 2023/24
A Wide Dispersion Of FOMC Interest Rate Views For 2023/24
A Wide Dispersion Of FOMC Interest Rate Views For 2023/24
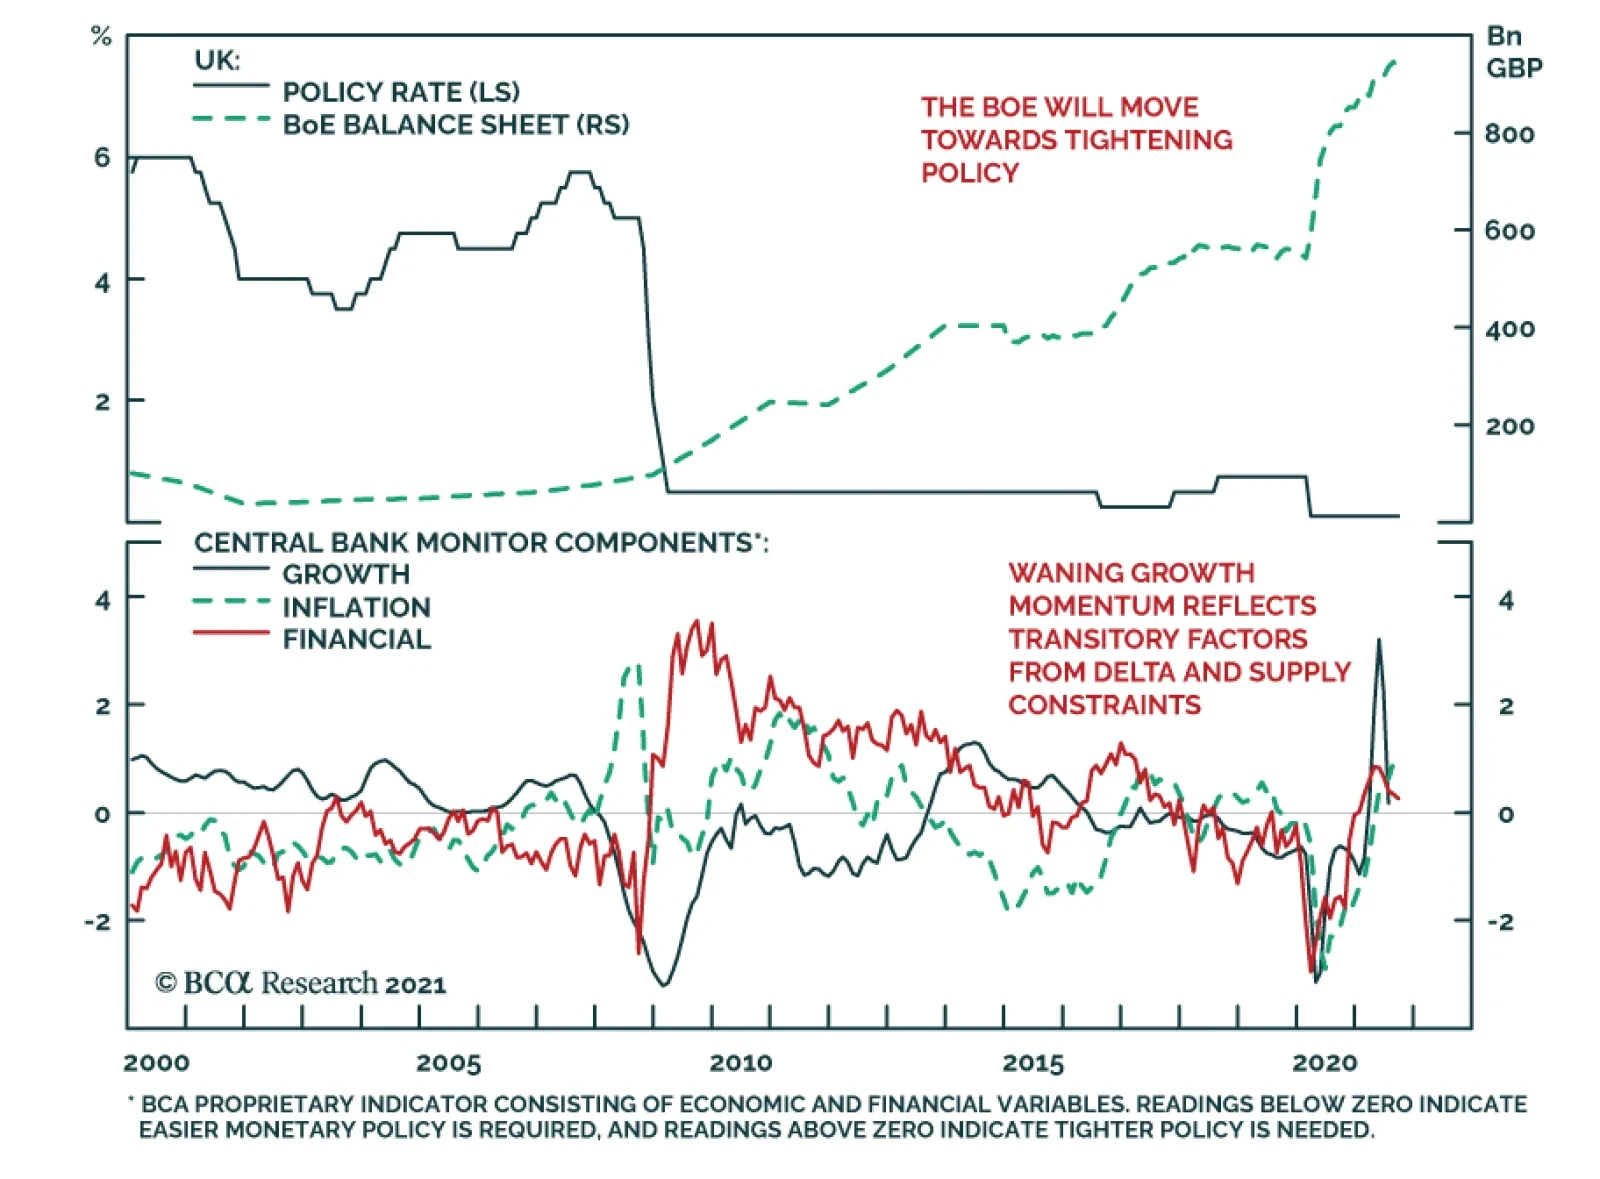
One area where there does appear to be a consensus is on the timing and pace of tapering. Fed Chair Powell noted at his post-FOMC press conference that an announcement on the reduction of Fed asset purchases could come as soon as the next FOMC meeting on November 6. Powell also signaled that there was general agreement on the FOMC that the taper should end by mid-2022, barring any economic setbacks. That would likely open the door to a rate hike in the latter half of next year, given the Fed’s longstanding view that lifting the funds rate should only occur after tapering is complete, to avoid sending conflicting signals about the Fed’s policy bias. It is clear that the Fed’s policy guidance has shifted incrementally in a more hawkish direction, and confirms our long-held expectation that tapering would be announced by year-end, with rate hikes to begin in late 2022. This dovetails with our recommended investment positioning in the US Treasury market for the next 12-18 months. Maintain a below-benchmark US duration exposure, with a curve-flattening bias, while staying underweight US Treasuries in global (USD-hedged) fixed income portfolios (Chart 6). Our other high-conviction underweight government bond call is in the UK. The BoE’s recent messaging has turned more hawkish in a very short period of time, justifying our decision to downgrade our recommended UK Gilt exposure to underweight last month.1 The BoE Monetary Policy Committee had already sharply upgraded its inflation forecast for the end of 2021 to just above 4% at the last policy meeting in August. That was categorized as just a temporary surge due to rising energy prices and goods prices elevated by shorter-term global supply chain bottlenecks. At last week’s meeting, however, the MPC noted that +4% UK inflation could persist into Q2 2022 because of the current surge in wholesale natural gas prices that has driven many UK gas suppliers out of business (Chart 7). Chart 6Our Recommended Strategy For US Treasuries
Our Recommended Strategy For US Treasuries
Our Recommended Strategy For US Treasuries
Chart 7BoE Growing More Worried About Inflation
BoE Growing More Worried About Inflation
BoE Growing More Worried About Inflation
Chart 8Our Recommended Strategy For UK Gilts
Our Recommended Strategy For UK Gilts
Our Recommended Strategy For UK Gilts
The official view of the BoE has been like that of other central banks, that much of the current high inflation is supply driven and, hence, will not last. Yet within the MPC, there is clearly some growing nervousness about high realized inflation becoming more embedded in longer-term inflation expectations, which are moving higher. BoE Governor Andrew Bailey has noted in recent speeches that there was a growing case for interest rate hikes because of stubbornly higher inflation. Two members of the MPC even voted last week to reduce the size of the BoE’s QE program that is already set to end in just three months. The markets have begun to heed the more hawkish signals from the BoE. Our 24-month UK discounter, measuring the amount of rate hikes priced into the UK OIS curve, has jumped 24bps since September 7 (Chart 8). Over that same period, UK Gilts have underperformed the Bloomberg Barclays Global Treasury index by 108bps (on a USD-hedged and duration-matched basis). We are sticking with our underweight recommendation on UK Gilts, as there are still too few rate hikes priced into the UK curve relative to the BoE’s guidance and upside inflation risks. What About The BoJ? Same Old, Same Old Chart 9Reasons Why JGBs Will Outperform
Reasons Why JGBs Will Outperform
Reasons Why JGBs Will Outperform
Lost amid the hawkish din from the Fed and BoE meetings last week was the Bank of Japan (BoJ) meeting. The message from policymakers in Tokyo was predictably dovish, as Japan has not seen anything resembling the high inflation that has pushed central bankers elsewhere in a more hawkish direction. Japanese growth has also not seen the same magnitude of recovery from the pandemic shock as the other major developed markets, despite suffering comparable losses during the 2020 recession (Chart 9). One of the main reasons has been that Japan’s vaccine rollouts were much slower than those of other major countries. This forced an extension of emergency lockdowns and other economic restrictions that depressed domestic demand and delayed a return to normal economic activity (second panel). COVID outbreaks even cost Japan the one-time economic windfall from hosting an Olympics, with the Tokyo Games first delayed by a year and then taking place with no fans. Japan has also not suffered any of the higher inflation rates witnessed elsewhere over the past year, despite presumably facing many of the same inflationary forces from global supply chain disruption (third panel). Both headline and core CPI inflation are now in deflation. Governor Haruhiko Kuroda stated last week that it will take longer for Japan to see inflation return back to its 2% target than other developed countries, with the official BoJ forecast calling for that level to be reached by 2023 – a forecast that appears too optimistic. We continue to view Japanese government bonds (JGBs) as a relative safe haven during the period of rising global bond yields that we expect over the next 6-12 months. The BoJ is nowhere close to seeing the conditions necessary to begin exiting its Yield Curve Control and negative interest rate policies, both of which have crushed JGB volatility and kept longer-term bond yields hovering near 0%. We continue to recommend a moderate overweight stance on Japan in global government bond portfolios, particularly on a USD-hedged basis to make the yields more attractive. The Scandinavian Policy Divergence Last week, the Norges Bank raised its benchmark interest rate from 0% to 0.25% (Chart 10), stating that a normalizing economy requires a gradual normalization in monetary policy. The bank’s decision reflects idiosyncratic factors unique to the Norwegian economy, but also some of the same broader themes that are forcing other central banks in a more hawkish direction. As a small economy driven heavily by oil exports, both the Norwegian krone and the price of oil weigh heavily on the policy decisions of the Norges Bank. On that front, the rise in energy prices since the crisis has outpaced the appreciation in the krone (Chart 10, top panel). With this relative weakness in the krone comes higher import price inflation and increased export competitiveness, both of which mean that the Norges Bank must pull forward its path of rate hikes to compensate. As opposed to other G10 central banks, the Norges Bank clearly believes a pre-emptive move on rates is necessary to nip future inflation risk in the bud. The bank expects that increased capacity utilization and wage growth will help push up underlying inflation to approximately 1.9% by the end of 2024, with the ongoing supply chain disruptions creating additional upside risk to that forecast. Like other G10 banks, however, the Norges Bank is concerned about increasing financial imbalances. The Norwegian house price-to-disposable income ratio is now at all-time highs and the Norges Bank expects it to remain elevated to the end of its forecast horizon (Chart 10, bottom panel). With the growth in house prices substantially outpacing income growth during the pandemic, housing market vulnerabilities have increased as households have taken on greater leverage to enter the market. In contrast to the Norges Bank, the other major Scandinavian central bank, Sweden’s Riksbank, has hewed more closely to the prevailing global monetary policy orthodoxy – avoiding pre-emptive policy tightening in order to boost inflation. The central bank chose to hold its repo rate at 0% at last week’s policy meeting, even with a Swedish economy that has recovered the 2020 pandemic losses and is projected to return to pre-COVID growth rates in 2022 (Chart 11). In its decision, the Riksbank mirrored rhetoric from the Fed and ECB, citing that high inflation was driven by rising energy prices and supply logjams, both factors which are expected to subside over the coming year (Chart 11, middle panel). Both headline and core versions of the bank’s favored CPI-F (CPI with Fixed Interest Rate) measure are projected by the Riksbank to remain below target in 2022, reaching 2% only in 2024. Chart 10The Norges Bank Isn't Waiting Around...
The Norges Bank Isn't Waiting Around...
The Norges Bank Isn't Waiting Around...
Chart 11...But The Riksbank Will Remain Patient
...But The Riksbank Will Remain Patient
...But The Riksbank Will Remain Patient
Chart 12The Central Bank Story Will Further Widen The Norway-Sweden Spread
The Central Bank Story Will Further Widen The Norway-Sweden Spread
The Central Bank Story Will Further Widen The Norway-Sweden Spread
The Riksbank is less willing than the Norges Bank to respond to temporarily higher inflation because of the former’s growing reluctance to return to negative nominal interest rates in response to an economic shock. The Riksbank would likely be more comfortable in lifting nominal rates only when real rates were significantly lower than current levels, which requires higher inflation. In contrast to the neighboring Norges Bank, the Riksbank has an additional tool which it can use to express shifts in monetary policy—the size of its balance sheet. The bank forecasts that holdings of securities will remain unchanged in 2022 (Chart 11, bottom panel), implying that purchases, net of redemptions, will be drawn down roughly to zero. However, the bank does believe that the existing stock of purchases will continue to support financial conditions. Chart 12 shows the impact of the Norges Bank’s relatively hawkish reaction function. Despite relatively similar underlying growth and inflation profiles, sovereign debt from Norway has markedly underperformed Swedish counterparts, a dynamic that has been even more obvious since the pandemic. On the currency side, the NOK/SEK cross has recovered much of the losses from 2020, and will likely rally further as Norway-Sweden rate differentials will turn even more favorable for the NOK. Relative to the global benchmark on a currency-hedged and duration-matched basis, Norwegian government debt has underperformed much more than Sweden following the pandemic. We see these tends continuing over the next 6-12 months, with the Norges Bank likely to remain far more hawkish than the Riksbank. Our bias is to favor Swedish sovereign debt over Norwegian government bonds. Robert Robis, CFA Chief Fixed Income Strategist rrobis@bcaresearch.com Shakti Sharma Senior Analyst ShaktiS@bcaresearch.com Ray Park, CFA Research Analyst ray@bcaresearch.com Footnotes 1 Please see BCA Research Global Fixed Income Strategy/European Investment Strategy Report, "The UK Leads The Way", dated August 11, 2021, available at gfis.bcaresearch.com. Recommendations The GFIS Recommended Portfolio Vs. The Custom Benchmark Index
Marking-To-Market Our Bond Calls After "Central Bank Week"
Marking-To-Market Our Bond Calls After "Central Bank Week"
Duration Regional Allocation Spread Product Tactical Trades Yields & Returns Global Bond Yields Historical Returns
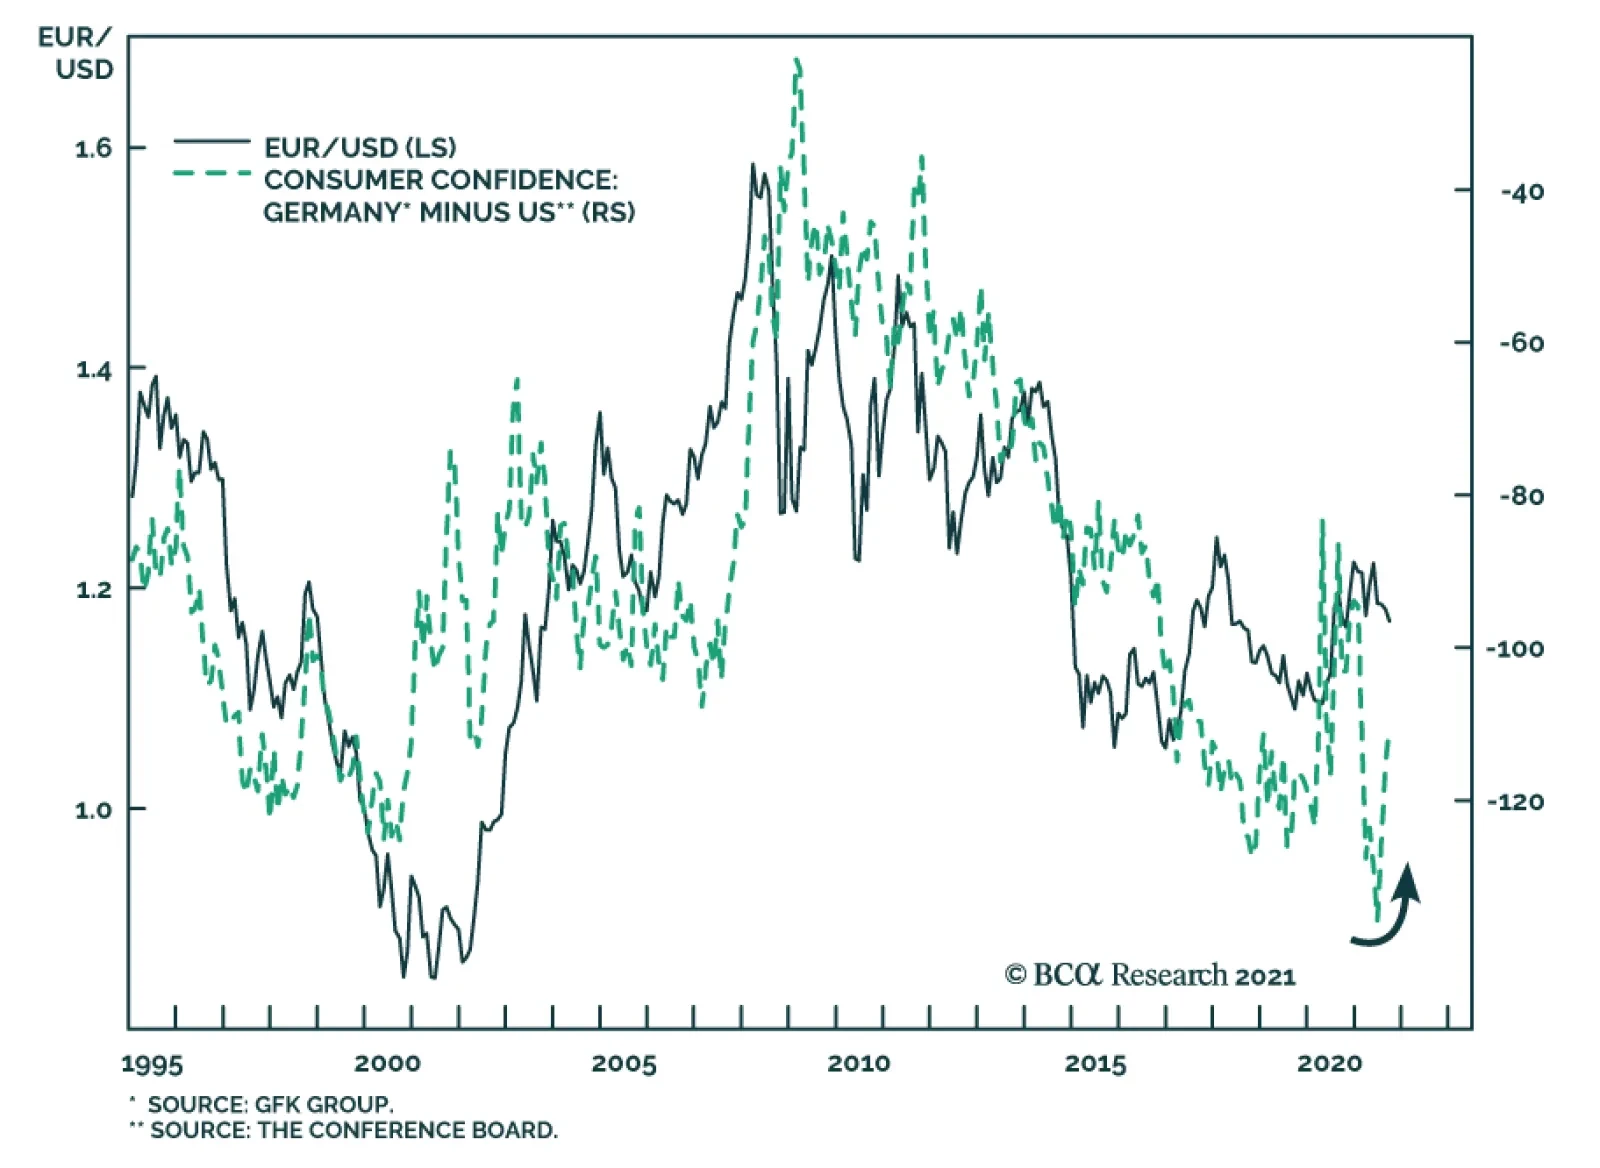
US and Euro Area measures of consumer confidence are diverging. According to the Conference Board survey, US consumer sentiment declined for the third consecutive month to a seven-month low of 109.3 in September. The nearly six-point drop is well below…
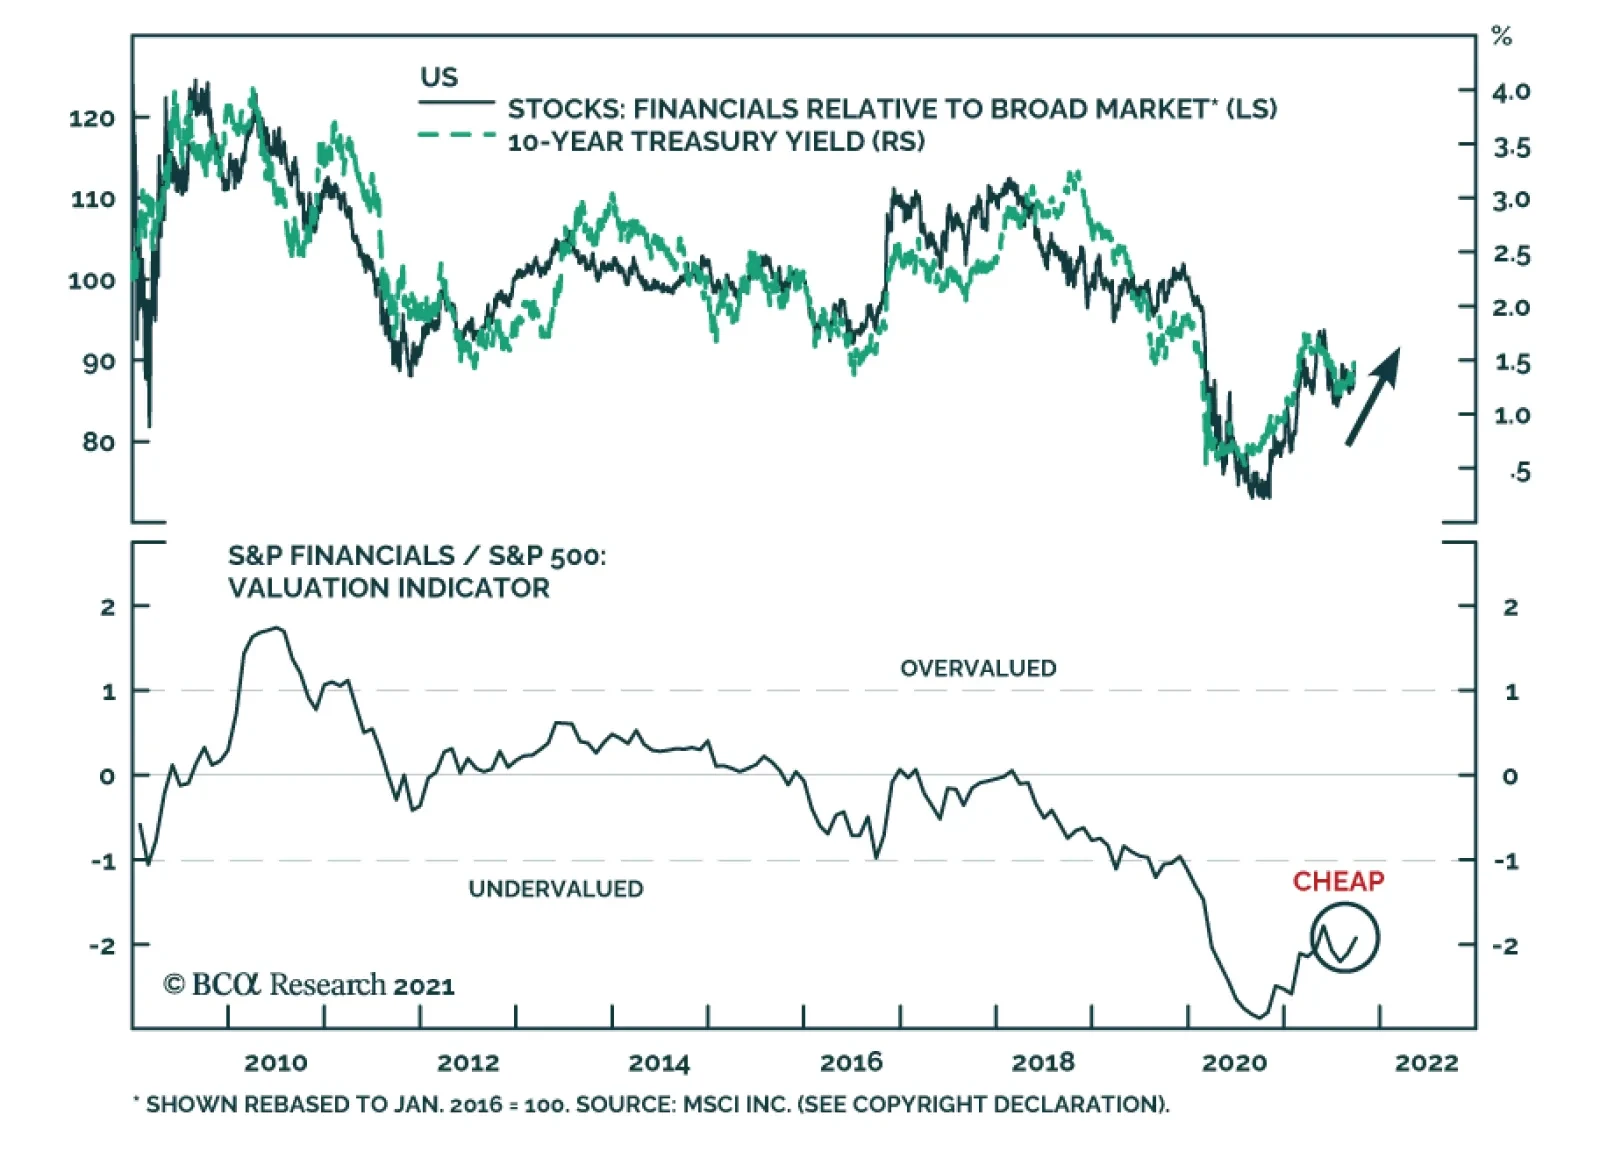
US Financials is among the best performing US equity sectors over the past three months. We expect these positive relative gains to continue. Financials will benefit from rising US bond yields over the coming year. Not only are higher interest rates…
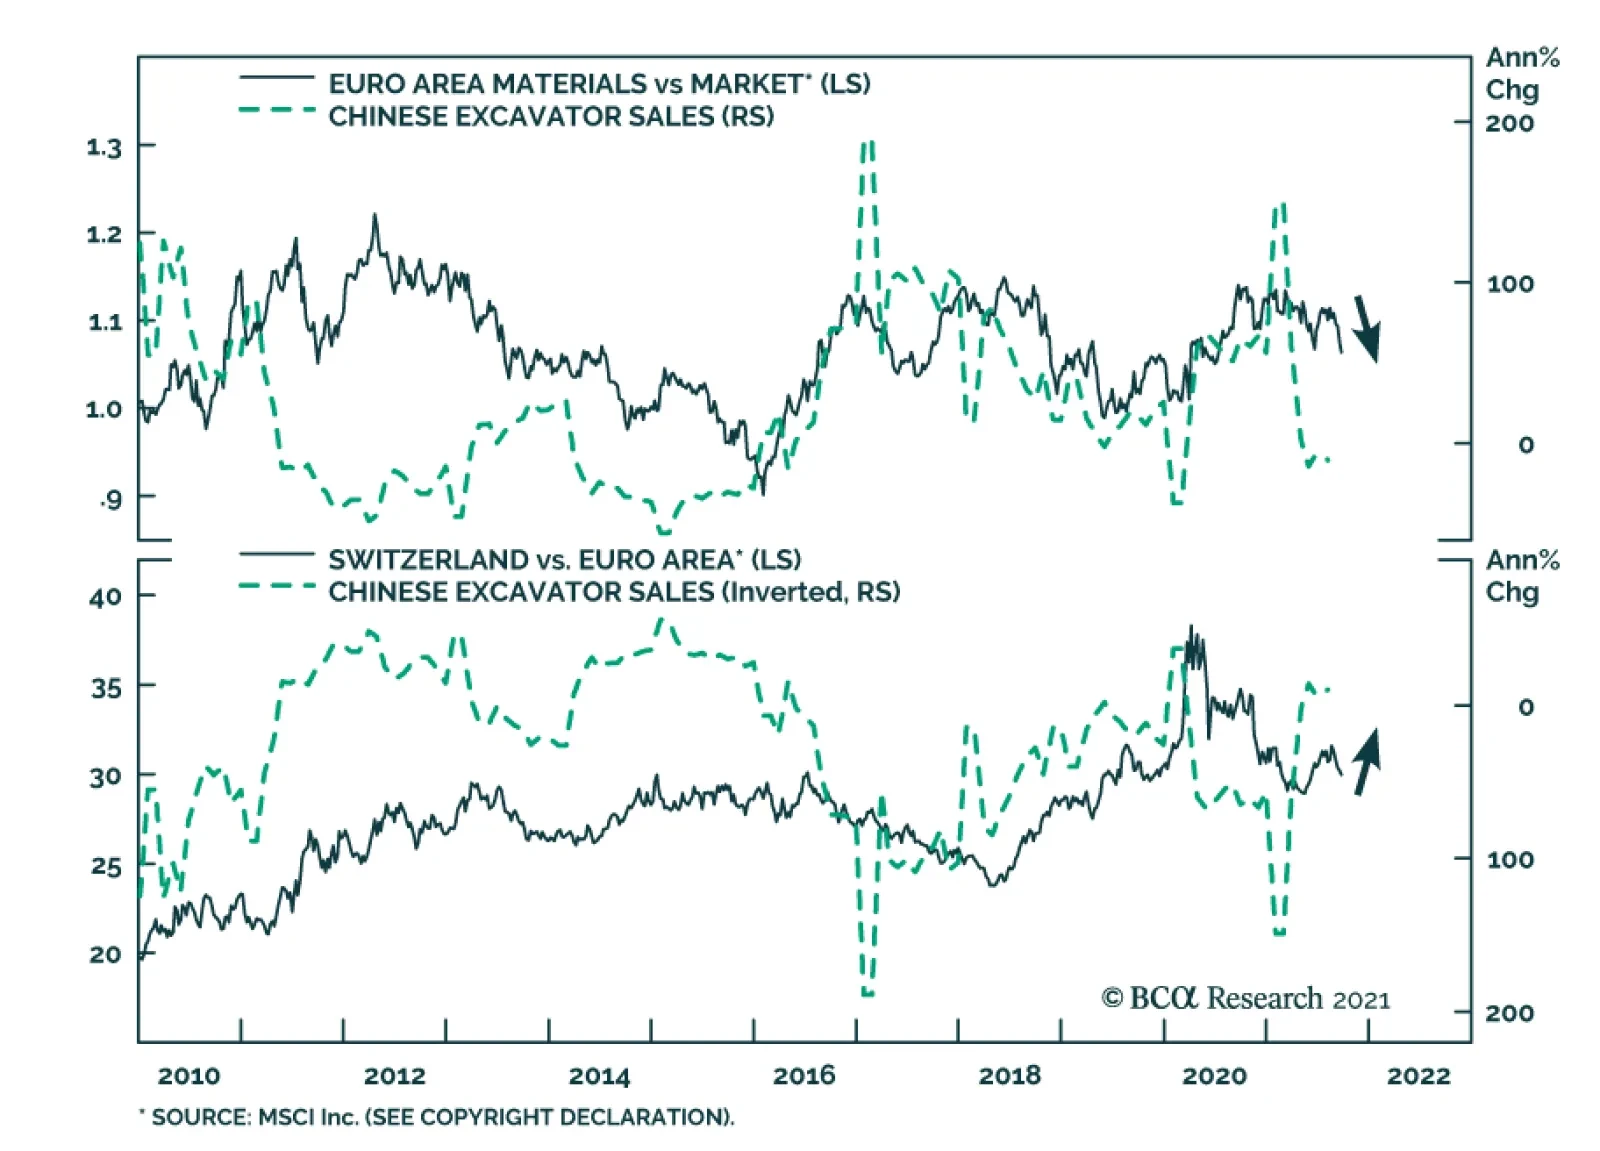
According to BCA Research’s European Investment Strategy service, the tactical environment is dangerous for European cyclicals in general, and materials in particular. The fallout from Evergrande’s problem will extend to the performance of European equity…
Highlights The Evergrande crisis is not China’s Lehman moment. Nonetheless, Chinese construction activity will decelerate further in response to this shock. Global equities are frothy enough that a weaker-than-expected Chinese construction sector will remain a near-term risk to stocks prices. European markets are more exposed to this risk than US ones. Tactically, this creates a dangerous environment for cyclicals in general and materials in particular. Healthcare and Swiss stocks would be the winners. Despite these near-term hurdles, we maintain a pro-cyclical portfolio stance, which we will protect with some temporary hedges. We will lift these hedges if the EURO STOXX corrects into the 430-420 zone. A busy week for European central banks confirms our negative stance on EUR/GBP, EUR/SEK, and EUR/NOK. While EUR/CHF has upside, Swiss stocks should outperform Euro Area defensives. Stay underweight UK Gilts in fixed-income portfolios. Feature The collapse of property developer Evergrande creates an important risk for European markets. It threatens to slow Chinese construction activity further, which affects European assets that are heavily exposed to the Chinese real estate sector, directly and indirectly. This risk is mostly frontloaded, as Chinese authorities cannot afford a complete meltdown of the domestic property sector. Moreover, this economy has slowed significantly and more policy support is bound to take place. Additionally, forces outside China create important counterweights that will allow Europe to thrive despite the near-term clouds. While we see more short-term risk for European stocks and cyclical sectors, the 18-month cyclical outlook remains bright. Similarly, European stocks will not outperform US ones when Chinese real estate activity remains a source of downside surprise; but they will afterward. China’s Construction Slowdown Is Not Over The Evergrande crisis is not China’s Lehman moment. Beijing has the resources to prevent a systemic meltdown and understands full well what is at stake. At 160% of GDP, China’s nonfinancial corporate debt towers well above that of other major emerging markets and even that of Japan in the 1980s (Chart 1). If an Evergrande bankruptcy were allowed to topple this debt mountain, China would experience the kind of debt-deflation trap that proved so disastrous in the 1930s. A further deterioration of conditions in Chinese real estate activity is nonetheless in the cards, even if the country avoids a global systemic financial shock. First, the inevitable restructuring of Evergrande will result in losses for bond holders, especially foreign ones. Consequently, risk premia in the Chinese off-shore corporate bonds market will remain wide following the resolution of the Evergrande debacle. While Chinese banks are likely to recover a large proportion of the funds they lent to the real estate giant, they too will face higher risk premia. At the margin, the rising cost of capital will curtail the number of projects real estate developers take on over the coming two to three years. Second, the eventual liquidation of Evergrande will hurt confidence among real estate developers. This process may take many forms, but, as we go to press, the most discussed outcome is a breakup and restructuring where state-owned enterprises and large local governments absorb Evergrande’s operations. Evergrande’s employees, suppliers, and clients who have deposited funds while pre-ordering properties will be made whole one way or the other. However, shareholders and management will not. Wiping out shareholders and senior management will send a message to the operators of other developers, which will negatively affect their risk taking (Chart 2). Chart 1China Cannot Afford A Lehman Moment
China Cannot Afford A Lehman Moment
China Cannot Afford A Lehman Moment
Chart 2Downside To Chinese Construction Activity
Downside To Chinese Construction Activity
Downside To Chinese Construction Activity
Third, one of President Xi Jinping’s key policy objectives is to tame rampant income inequality in the Chinese economy. Rapidly rising real estate prices and elevated unaffordability only worsen this problem. Hence, Beijing wants to avoid blind stimulus that mostly pushes house prices higher but that would have also boosted construction activity. Thus, if credit growth is pushed through the system, the regulatory tightening in real estate will not end. This process is likely to result in further contraction in floor space sold and started. Bottom Line: The Evergrande crisis is unlikely to morph into China’s Lehman moment. However, its fallout on the real estate industry means that Chinese construction activity will continue to contract in the coming six to twelve months or so. Chinese Construction Matters For European Equities The risk of further contraction in Chinese construction activity implies a significant near-term risk for European equities, especially relative to US ones. Even after the volatility of the past three weeks, global equities remain vulnerable to more corrective action. Speculative activity continues to grip the bellwether US market. Our BCA Equity Speculation Index is still around two sigma. Previous instances of high readings did not necessarily herald the end of bull markets; however, they often resulted in sideways and volatile trading, until the speculative excesses dissipated (Chart 3). The case for such volatile trading is strong. The Fed is set to begin its taper at its November meeting. Moreover, an end of the QE program by the middle of next year and the upcoming rotation of regional Fed heads on the FOMC will likely result in a first rate hike by the end of 2022. Already, the growth rate of the global money supply has declined, and the real yield impulse is not as supportive as it once was. Therefore, the deterioration in our BCA Monetary Indicator should perdure (Chart 4), which will heighten the sensitivity of global stocks to bad news out of China. Chart 3Rife With Speculation
Rife With Speculation
Rife With Speculation
Chart 4Liquidity Deterioration At The Margin
Liquidity Deterioration At The Margin
Liquidity Deterioration At The Margin
Chart 5Still Too Happy
Still Too Happy
Still Too Happy
Investor sentiment is also not as washed out as many news stories ascertain. The AAII survey shows that the number of equity bulls has fallen sharply, but BCA’s Complacency-Anxiety Index, Equity Capitulation Indicator and Sentiment composite are still inconsistent with durable market bottoms. Moreover, the National Association of Active Investment Managers’ Exposure Index is still very elevated. When this gauge is combined with the AAII bulls minus bears indicator, it often detects floors in the US dollar-price of the European MSCI index (Chart 5). For now, this composite sentiment measure is flashing further vulnerability for European equities, especially if China remains a source of potential bad news in the coming months. Economic linkages reinforce the tactical risk to European stocks. Chinese construction activity affects the Euro Area industrial production because machinery and transportation goods represent 50% of Europe’s export to China (Chart 6). This category is very sensitive to Chinese real estate activity. Moreover, Europe’s exports to other nations are also indirectly affected by the demand from Chinese construction. Financial markets bear this footprint. Excavator sales in China are a leading indicator of construction activity. Historically, they correlate well with both the fluctuations of EUR/USD and the performance of Eurozone stocks relative to those of the US (Chart 7). Hence, if we anticipate that the problems Evergrande faces will weigh on excavator sales in the coming months, then the euro will suffer and Euro Area stocks could continue to underperform. Chart 6Europe's Exports To China Are Sensitive To Construction Activity
Europe's Exports To China Are Sensitive To Construction Activity
Europe's Exports To China Are Sensitive To Construction Activity
Chart 7A Near-Term Risk To European Assets
A Near-Term Risk To European Assets
A Near-Term Risk To European Assets
Similarly, the fallout from Evergrande’s problem will extend to the performance of European equity sectors. The sideways corrective episode in cyclical relative to defensive shares is likely to continue in the near term. This sector twist remains frothy, and often declines when Chinese credit origination is soft (Chart 8). Materials stocks are the most likely to suffer due to their tight correlation with Chinese excavator sales (Chart 9); meanwhile, healthcare equities will reap the greatest benefit as a result of their appealing structural growth profile and their strong defensive property. Geographically, Swiss stocks should perform best (Chart 9, bottom panel), because they strongly overweigh healthcare and consumer staple names. Moreover, as we recently argued, the SNB’s monetary policy is an advantage for Swiss stocks compared to Eurozone defensives.1 Additionally, Dutch equities, with their 50% weighting in tech and their small 12% combined allocation to industrials and materials, could also enjoy a near-term outperformance as investors digest the sectoral impact of weaker Chinese construction activity. Chart 8The Vulnerability Of Cyclicals/Defensives Remains
The Vulnerability Of Cyclicals/Defensives Remains
The Vulnerability Of Cyclicals/Defensives Remains
Chart 9Responses To Weaker Construction
Responses To Weaker Construction
Responses To Weaker Construction
Bottom Line: No matter how the Evergrande story unfolds, its consequence on Chinese construction activity may still cause market tremors. Global equity benchmarks may be rebounding right now, but, ultimately, they remain vulnerable to this slowdown. Any negative surprise out of China is likely to cause Europe to underperform because of its greater exposure to Chinese construction activity. Investment Conclusion: This Too Shall Pass The risks to the European equity market and its cyclicals sectors will prove transitory and will finish by the end of the year. Beijing will tolerate some pain to the real estate sector, but the stakes are too high to let the situation fester for long. The main problem is China’s large debt. Already sequential GDP growth in the first half of 2021 was worse than the same period in 2020, and credit accumulation is just as weak as in early 2018 (Chart 10). In this context, if real estate activity deteriorates too much, aggregate profits will contract and, in turn, will hurt the corporate sector’s ability to service its debt. Employment and social tensions create another stress point that will force Beijing’s hand. At 47, the non-manufacturing PMI employment index is already well into the contraction zone (Chart 11). Weakness in construction activity will hurt the labor market further. In an environment where protests have been springing up all over China, the Communist Party does not want to see more stress applied to workers. Chart 10In The End, Stimulus Will Come
In The End, Stimulus Will Come
In The End, Stimulus Will Come
Chart 11Worsening Chinese Employment Conditions
Worsening Chinese Employment Conditions
Worsening Chinese Employment Conditions
These two constraints will force Beijing to alleviate the pain caused by a weaker construction sector. As a result, we still expect the Chinese credit and fiscal impulse to re-accelerate by Q2 2022. Developments outside of China will create another important offset that will allow risk assets to thrive once their immediate froth has receded. Strong DM capex will be an important driver of global activity next year. As Chart 12 shows, capex intentions in the US and the Euro Area are rapidly expanding, which augurs well for global investments. Moreover, re-building depleted inventories (Chart 13) will be a crucial component of the solution to global supply bottlenecks. Both activities will add to global demand. As an example, ship orders are already surging. Chart 12DM Capex Intentions Are Firming
DM Capex Intentions Are Firming
DM Capex Intentions Are Firming
Chart 13Don't Forget About Inventories
Don't Forget About Inventories
Don't Forget About Inventories
We maintain a pro-cyclical stance in European markets after weighing the near-term negatives against the underlying positive forces. For now, hedging the tactical risk still makes sense and our long telecommunication / short consumer discretionary equities remain the appropriate vehicle – so does being long Swiss stocks versus Euro Area defensives. However, we will use any correction in the EURO STOXX (Bloomberg: SXXE Index) to the 430-420 zone to unload this protection. Bottom Line: The potential market stress created by a slowdown in Chinese construction activity will be a temporary force. Beijing will not tolerate a much larger hit to the economy, especially as tensions are rising across the country. Thus, even if the stimulus response to the Evergrande crisis will not be immediate, it will eventually come, which will support Chinese economic activity. Additionally, the capex upside and inventory rebuilding in advanced economies will create an offset for slowing Chinese growth. Consequently, while we maintain a pro-cyclical bias over the medium term, we are also keeping in place our hedges in the near term, looking to shed them if SXXE hits the 430-420 zone. A Big Week For Central Banks Chart 14The BoE's Is Listening To The UK's Economic Conditions...
The BoE's Is Listening To The UK's Economic Conditions...
The BoE's Is Listening To The UK's Economic Conditions...
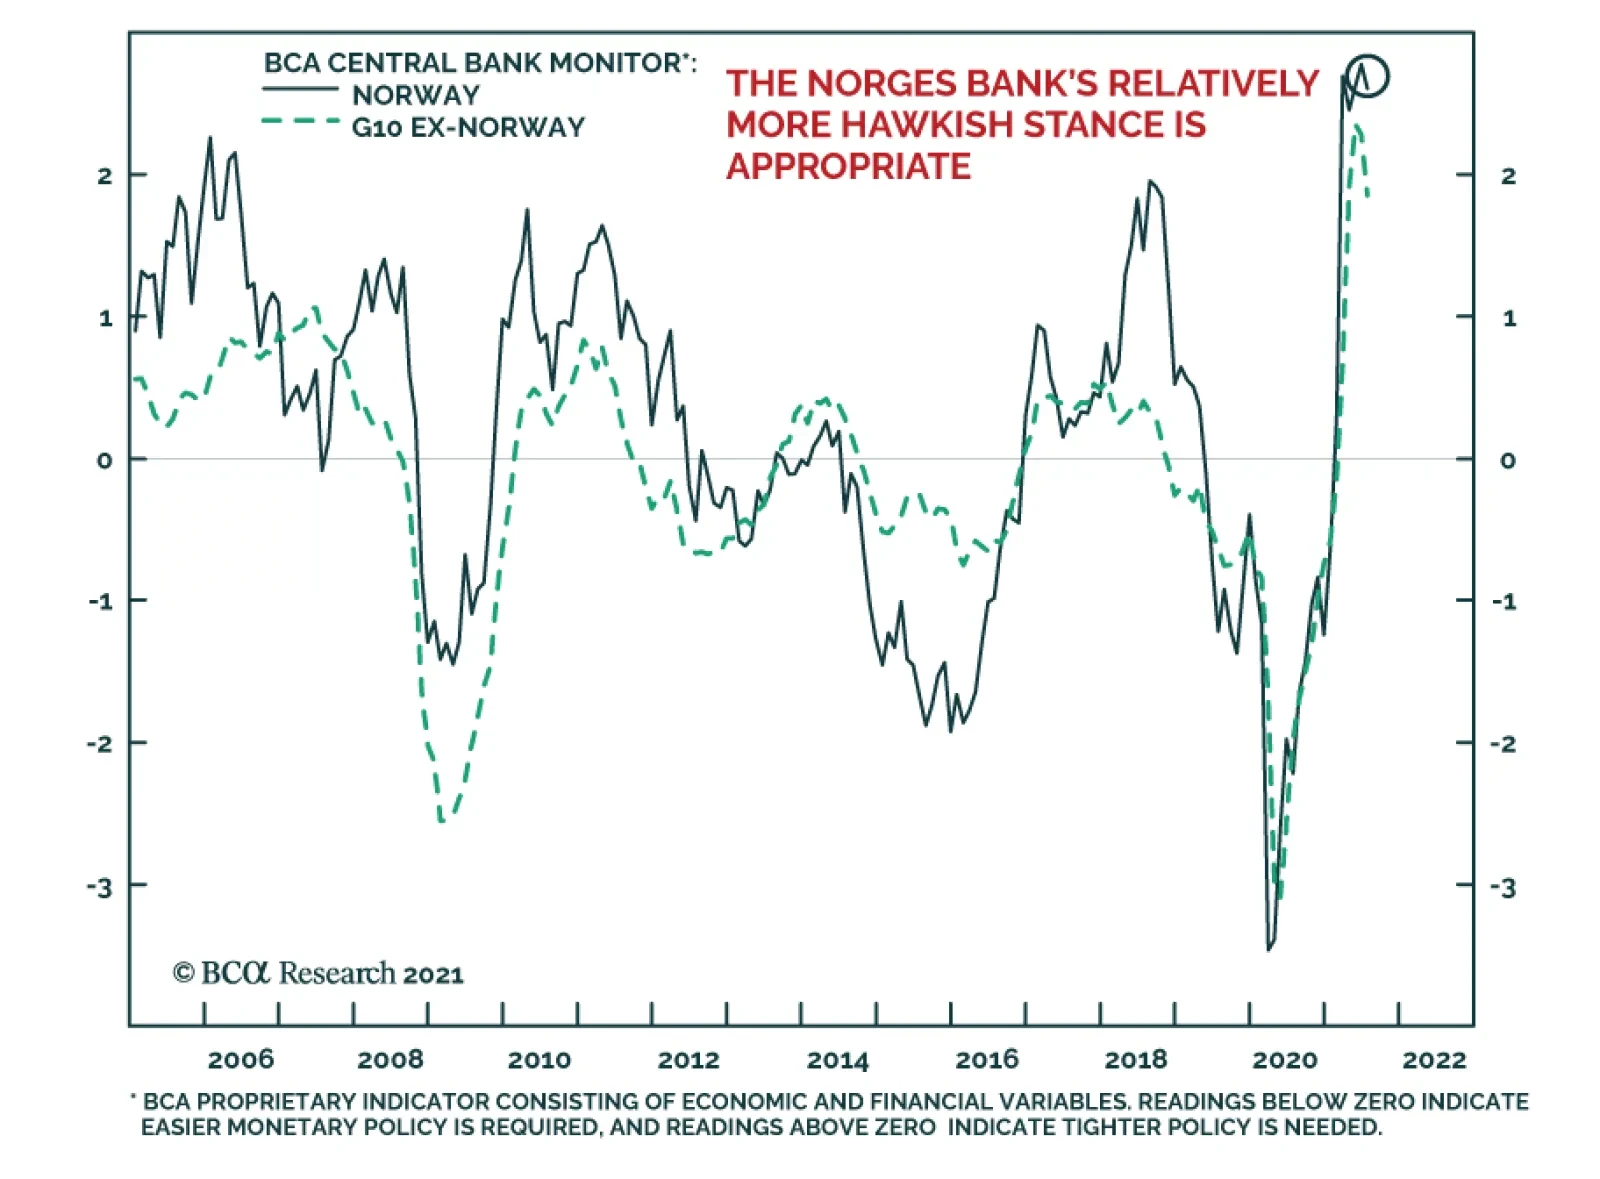
Last week, four European central banks held their policy meetings: The Riksbank, the Swiss National Bank, the Norges Bank, and the Bank of England. No major surprises came out of these meetings, with central banks discourses and policy evolving in line with their respective economies. The BoE veered on the hawkish side, highlighting that rates could rise before its QE program is over. This implies a small possibility of a rate hike by the end of 2021. However, our base case remains that the initial hike will be in the first half of 2022. The BoE is behaving in line with the message from our UK Central Bank Monitor (Chart 14). Moreover, the combination of rapid inflation and strong house price appreciation is incentivizing the BoE to remove monetary accommodation, especially because UK financial conditions are extremely easy (Chart 14, bottom panel). One caution advanced by the MPC is the uncertainty surrounding the impact of the end of the job furlough scheme this month. However, the global economy will be strong enough next spring to mitigate the risks to the UK. The results of last week’s MPC meeting and our view on the global and UK business cycles support the short EUR/GBP recommendation of BCA’s foreign exchange strategist,2 as well as the underweight allocation to UK Gilts of our Global Fixed Income Strategy group.3 The Norges Bank is the first central bank in the G-10 to hike rates and is likely to do so again later this year. While Norwegian core inflation remains low, house prices are strong, monetary conditions are extremely accommodative, and our Norway Central Bank Monitor is surging (Chart 15). The Norwegian central bank will continue to focus on these positives, especially in light of our Commodity and Energy team’s view that Brent will average more than $80/bbl by 2023.4 In this context, we anticipate the NOK to outperform the euro over the coming 24 months. Nonetheless, the near-term outlook for Norwegian stocks remains fraught with danger. Materials account for 17% of the MSCI Norway index and are the sector most vulnerable to a deterioration in Chinese construction activity. The Riksbank continues to disregard the strength of the Swedish economy. Relative to economic conditions, it is one of the most dovish central banks in the world. The Swedish central bank is completely ignoring the message from our Sweden Central Bank Monitor, which has never been as elevated as it is today (Chart 16). Moreover, the inexpensiveness of the SEK means that Swedish financial conditions are exceptionally accommodative. At first glance, this picture is bearish for the SEK. However, easy monetary conditions will cause Sweden’s real estate bubble to expand. Expanding real estate prices and transaction volumes will boost the profits of Swedish financials, which account for 27% of the MSCI Sweden index. Moreover, Swedish industrials remain one of our favorite sectors in Europe, and they represent 38% of the same index. As a result, equity flows into Sweden should still hurt the EUR/SEK cross. Chart 15...And The Norges Bank, To Norway's
...And The Norges Bank, To Norway's
...And The Norges Bank, To Norway's
Chart 16The Riksbank Is Blowing Real Estate Bubbles
The Riksbank Is Blowing Real Estate Bubbles
The Riksbank Is Blowing Real Estate Bubbles
Chart 17The CHF Still Worries The SNB
The CHF Still Worries The SNB
The CHF Still Worries The SNB
Finally, the SNB proved reliably dovish. Our Switzerland Central Bank Monitor is rising fast as inflation and house prices improve (Chart 17). However, the SNB is rightfully worried about the expensiveness of the CHF, which generates tight Swiss financial conditions (Chart 17, bottom panel). Consequently, the SNB will keep fighting off any depreciation in EUR/CHF. Thus, the SNB will be forced to expand its balance sheet because the ECB is likely to remain active in asset markets longer than many of its peers. This process will be key to the outperformance of Swiss stocks relative to other European defensive equities. Mathieu Savary, Chief European Strategist Mathieu@bcaresearch.com Footnotes 1 Please see European Investment Strategy “The ECB’s New Groove,” dated July 19, 2021, available at eis.bcarsearch.com 2 Please see Foreign Exchange Strategy “Why Are UK Interest Rates Still So Low?,” dated March 10, 2021, available at fes.bcarsearch.com 3 Please see European Investment Strategy “The UK Leads The Way,” dated August 11, 2021, available at eis.bcarsearch.com 4 Please see Commodity & Energy Strategy “Upside Price Risk Rises For Crude,” dated September 16, 2021, available at fes.bcarsearch.com Tactical Recommendations
Europe’s Evergrande Problem
Europe’s Evergrande Problem
Cyclical Recommendations
Europe’s Evergrande Problem
Europe’s Evergrande Problem
Structural Recommendations
Europe’s Evergrande Problem
Europe’s Evergrande Problem
Closed Trades
Europe’s Evergrande Problem
Europe’s Evergrande Problem
Currency Performance Fixed Income Performance Equity Performance
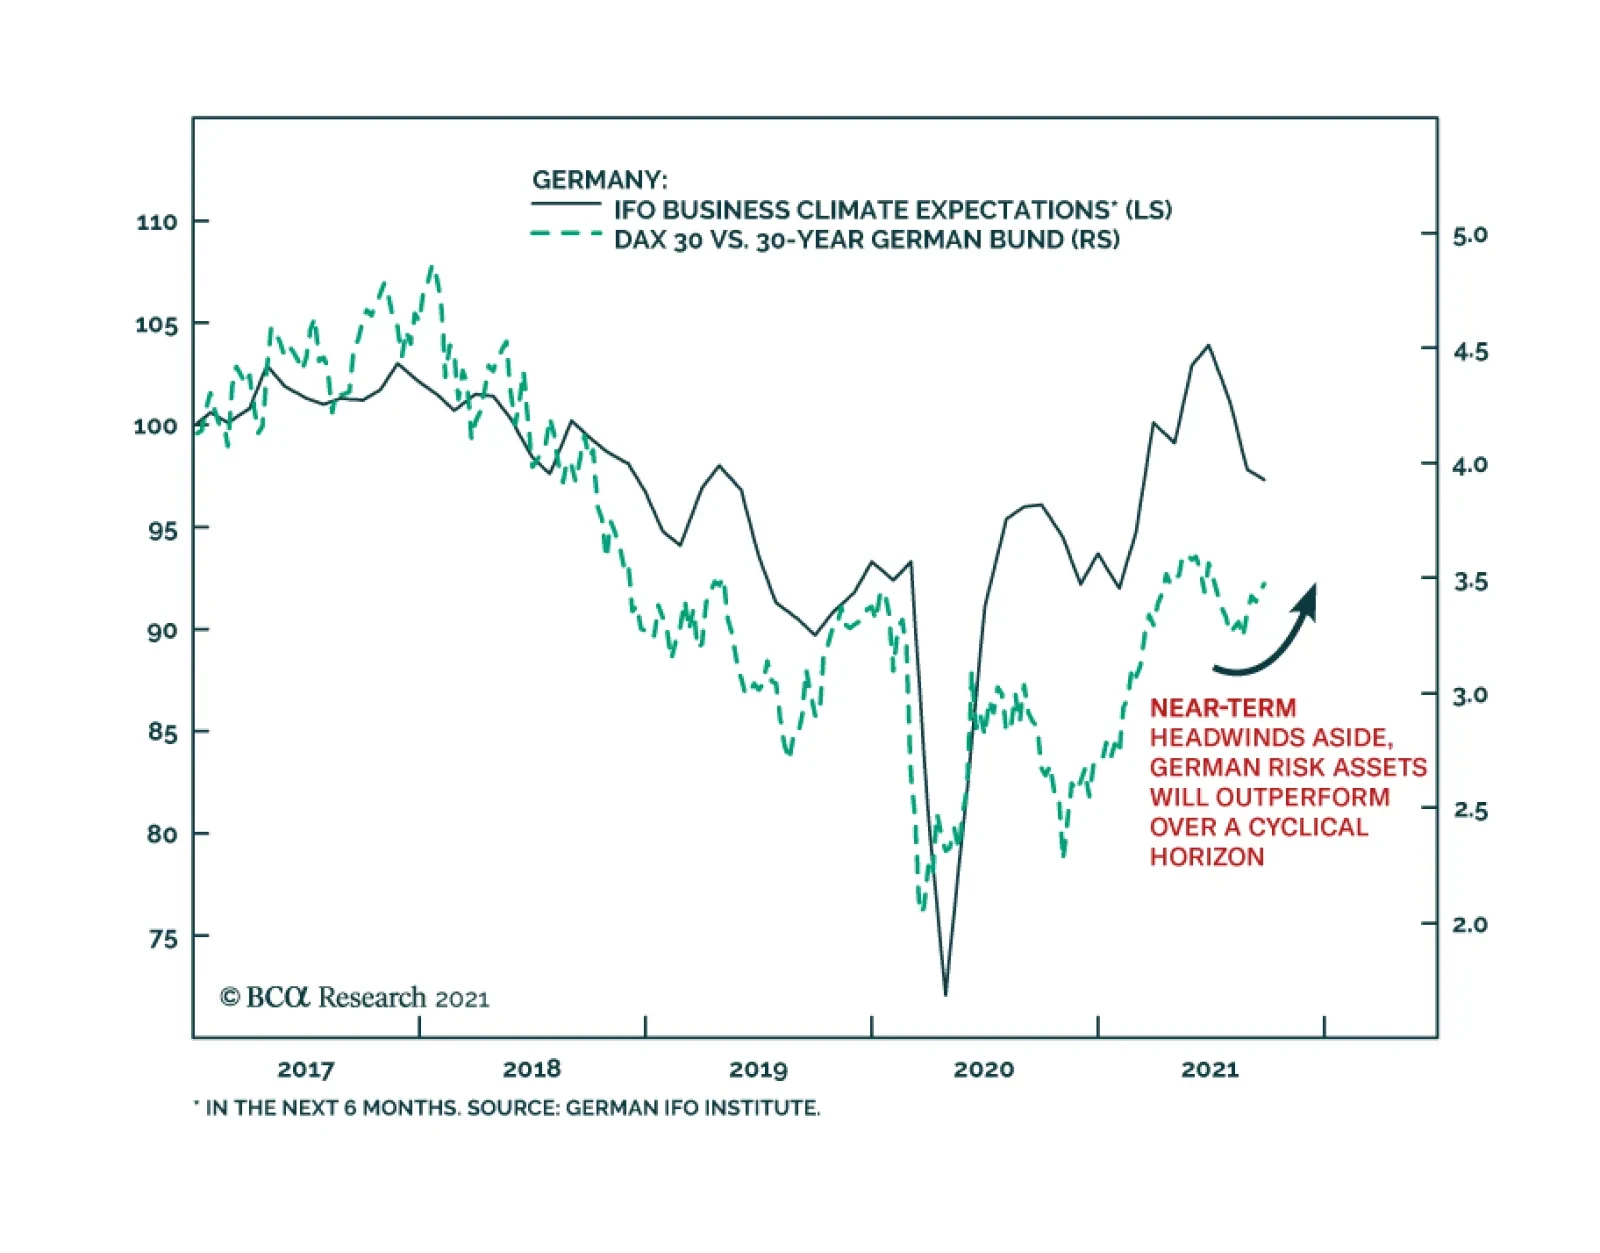
The German IFO’s Business Climate Index softened for the third consecutive month in September, falling to 98.8 from 99.6. The weakness was led by the Current Assessment number which lost 1-point versus expectations of a minor improvement. Meanwhile, the…
As expected, the Norges Bank delivered its first rate hike on Thursday, bringing its benchmark policy rate to 0.25%. It is the first developed market central bank to raise rates in the post-COVID-19 crisis period. The central bank statement revealed that…
The Bank of England kept policy unchanged at its meeting on Thursday. Instead, it revised down its Q3 growth outlook to 2.1% from last month’s 2.9%. However, it highlighted that this revision largely reflects the dampening effect of supply constraints on…