Europe
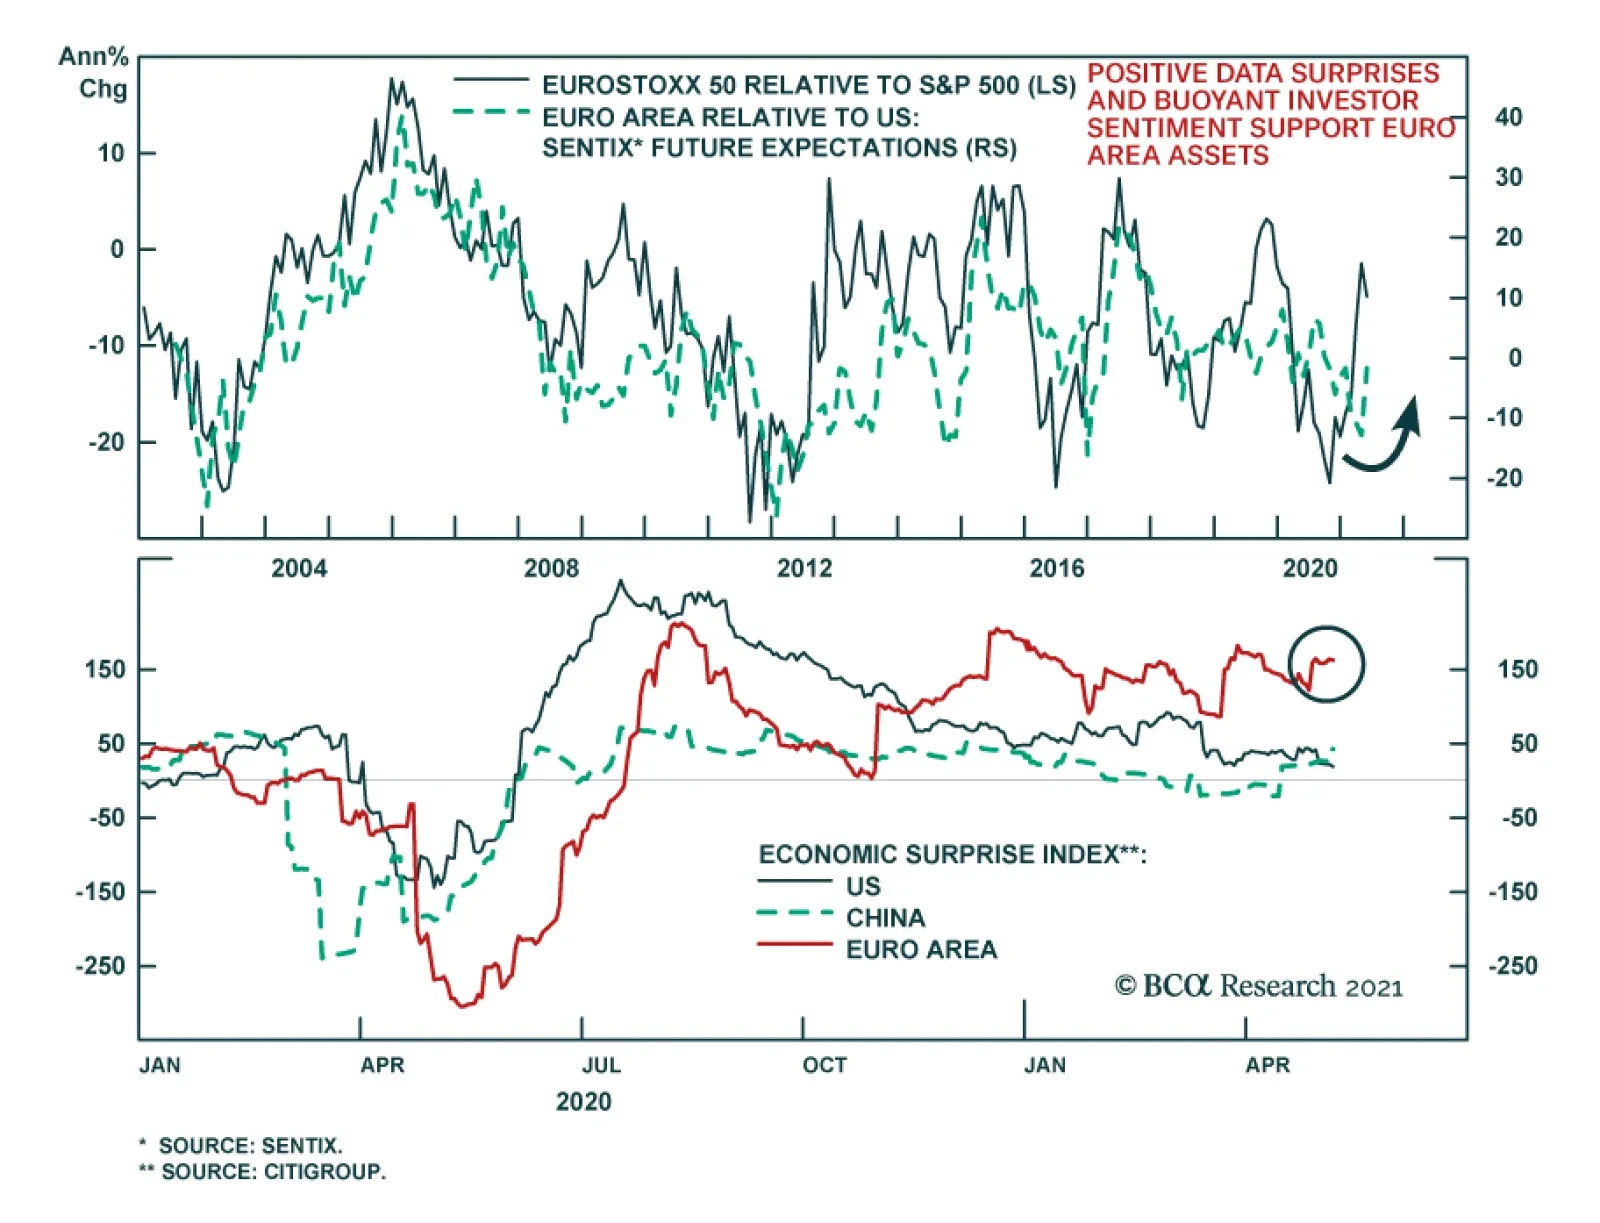
The May Sentix survey suggests that investors are looking beyond the current economic slowdown in the Euro Area to a catch-up phase later this year. The headline index jumped to 21.0 from 13.1, surpassing an anticipated 15.0. The improvement comes on the back…
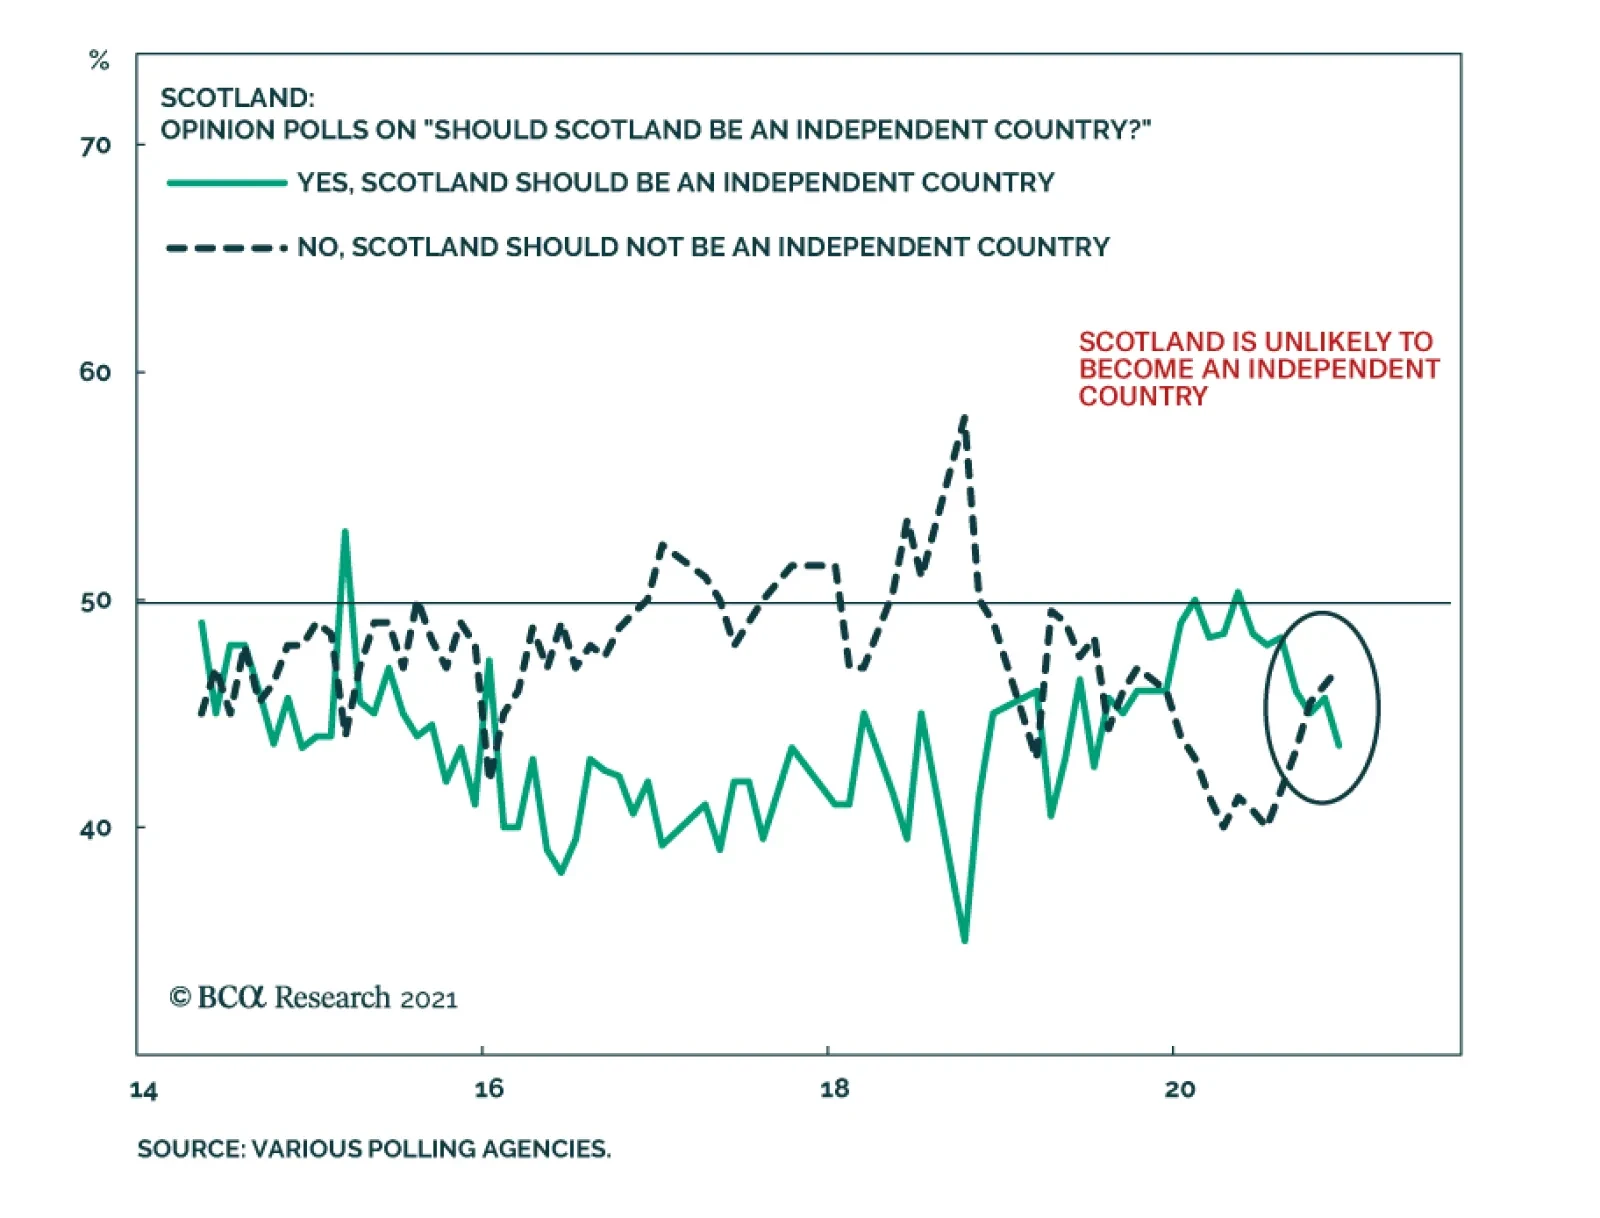
The United Kingdom will remain united – at least for now. The Scottish parliamentary election occurred on May 6 and the result does not herald a second Scottish independence referendum anytime soon. The Scottish National Party (SNP) won its fourth…
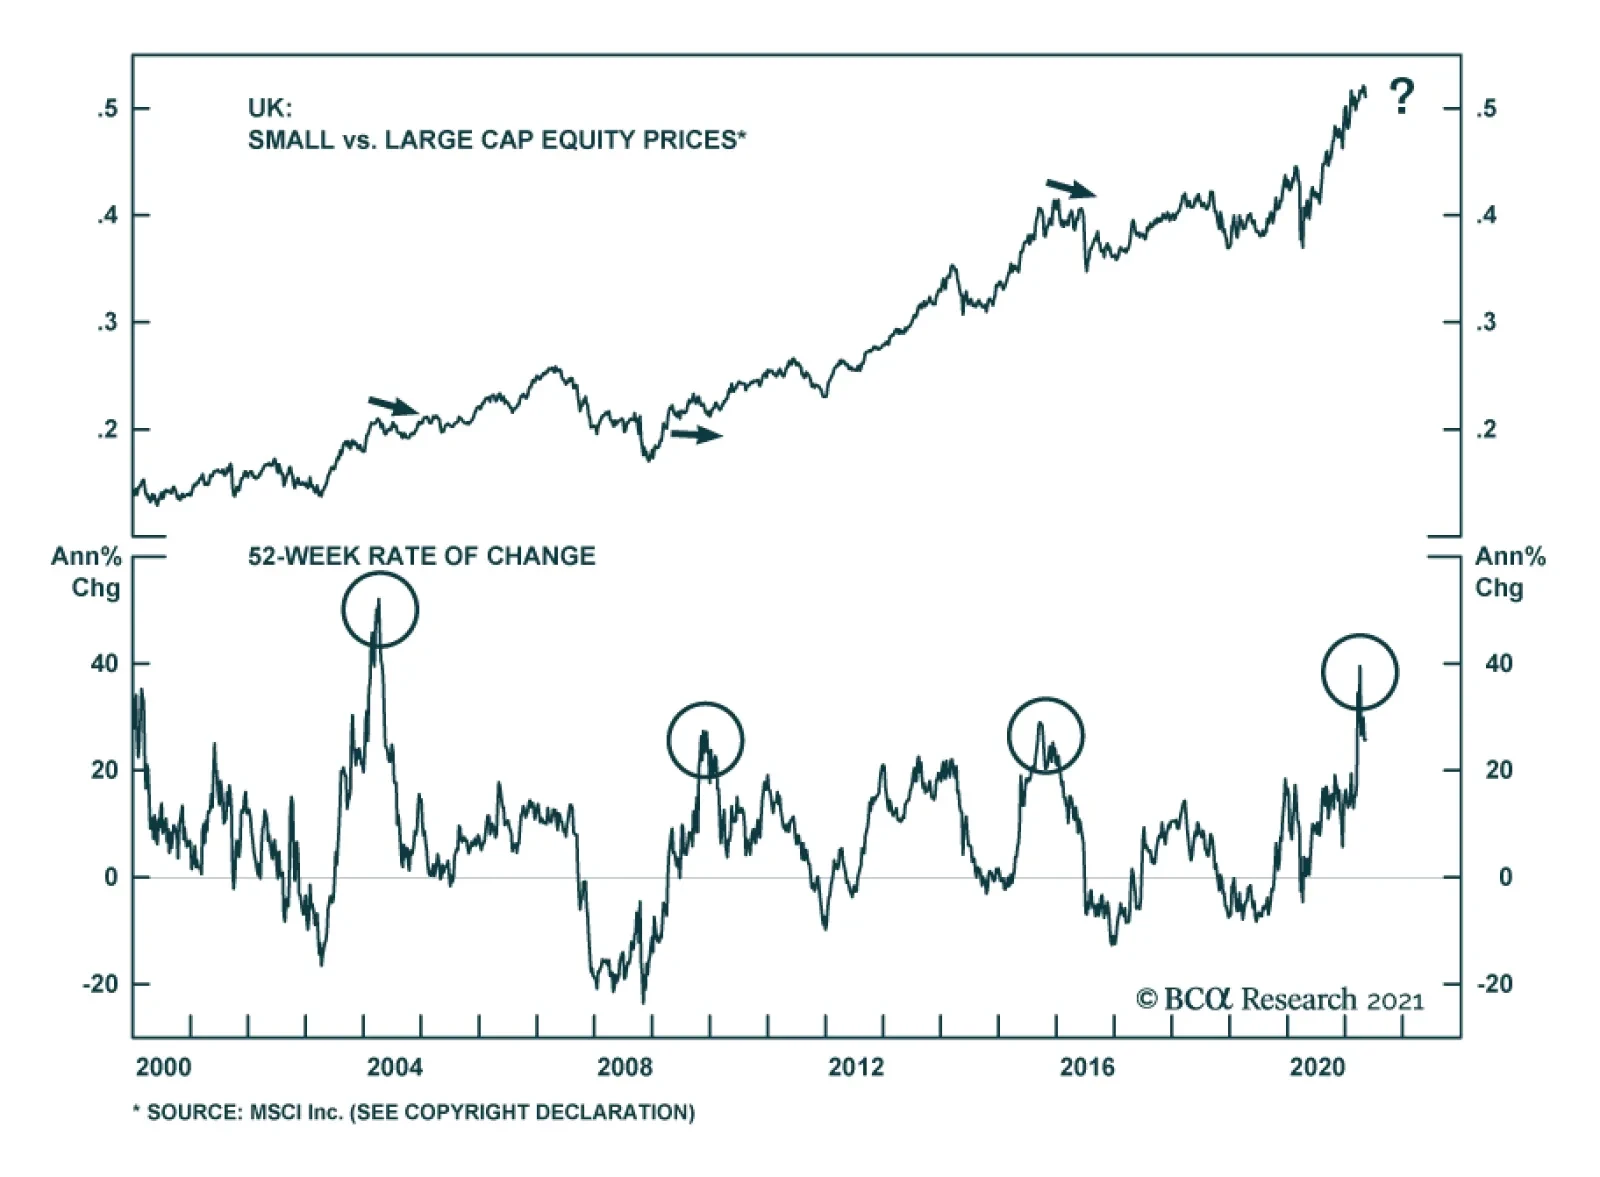
BCA Research’s European Investment Strategy service downgraded UK small-cap stocks to neutral on a tactical basis. Despite the positive UK economic outlook, investors should adopt a more cautious tactical stance toward UK markets. The problem for British…

Highlights Important leading indicators of Eurozone activity point to record growth in the coming quarters. Progress on the vaccination front, global pent-up demand, and easing fiscal policy will fuel the Euro Area recovery. Consensus growth expectations for the Eurozone do not reflect this upbeat outlook; hence, European economic surprises will remain firm. Robust economic surprises will help European stocks, especially small-cap ones. They will also allow for a stronger EUR/USD and rising German 10-year yields. The UK economy is strong, and the BoE will be among the first central banks to tighten policy meaningfully. However, investors understand the UK’s strength well. While the cyclical outlook for the pound is bright against both the USD and the EUR, the GBP is vulnerable to some near-term profit taking. Downgrade UK small-cap stocks to neutral on a tactical basis. Feature The case for the Eurozone’s recovery is only growing stronger. However, consensus growth forecasts for the Euro Area remain modest. Faced with this dichotomy, the European economy has ample room to generate positive surprises in the coming months. This process will support European financial assets, small-cap stocks in particular. This contrasts with UK assets, where investors have already embedded generous growth assumptions in response to the country’s rapid pace of vaccination. A tactical downgrade of UK small-cap equities is appropriate. Surprise! Two indicators from outside the Eurozone point to an elevated likelihood that the European economy will generate some exceptionally strong growth numbers over the coming 12 months. First, the Swiss KOF Economic Barometer hit an all-time high in April. The KOF series is an excellent leading indicator of Switzerland’s economic activity, and it currently forecasts record GDP growth and PMIs for that country (Chart 1). This message of strength for Switzerland bodes well for the Eurozone. While the Swiss market is defensive, owing to its heavy exposure to healthcare and consumer staple stocks, the Swiss economy is pro-cyclical. Exports represent 60% of GDP, and exports to the Eurozone account for 40% of this total. Moreover, the growth-sensitive machinery, consumer goods, and chemicals categories account for almost 50% of shipments. Based on these observations, the KOF Economic Barometer forecasting ability unsurprisingly extends beyond Swiss economic variables; it also anticipates positive growth for the Global Manufacturing PMI, the Euro Area Manufacturing PMI, and the Eurozone’s forward earnings (Chart 2). Chart 1Climbing Swiss Peaks
Climbing Swiss Peaks
Climbing Swiss Peaks
Chart 2A Good Sign For The Eurozone
A Good Sign For The Eurozone
A Good Sign For The Eurozone
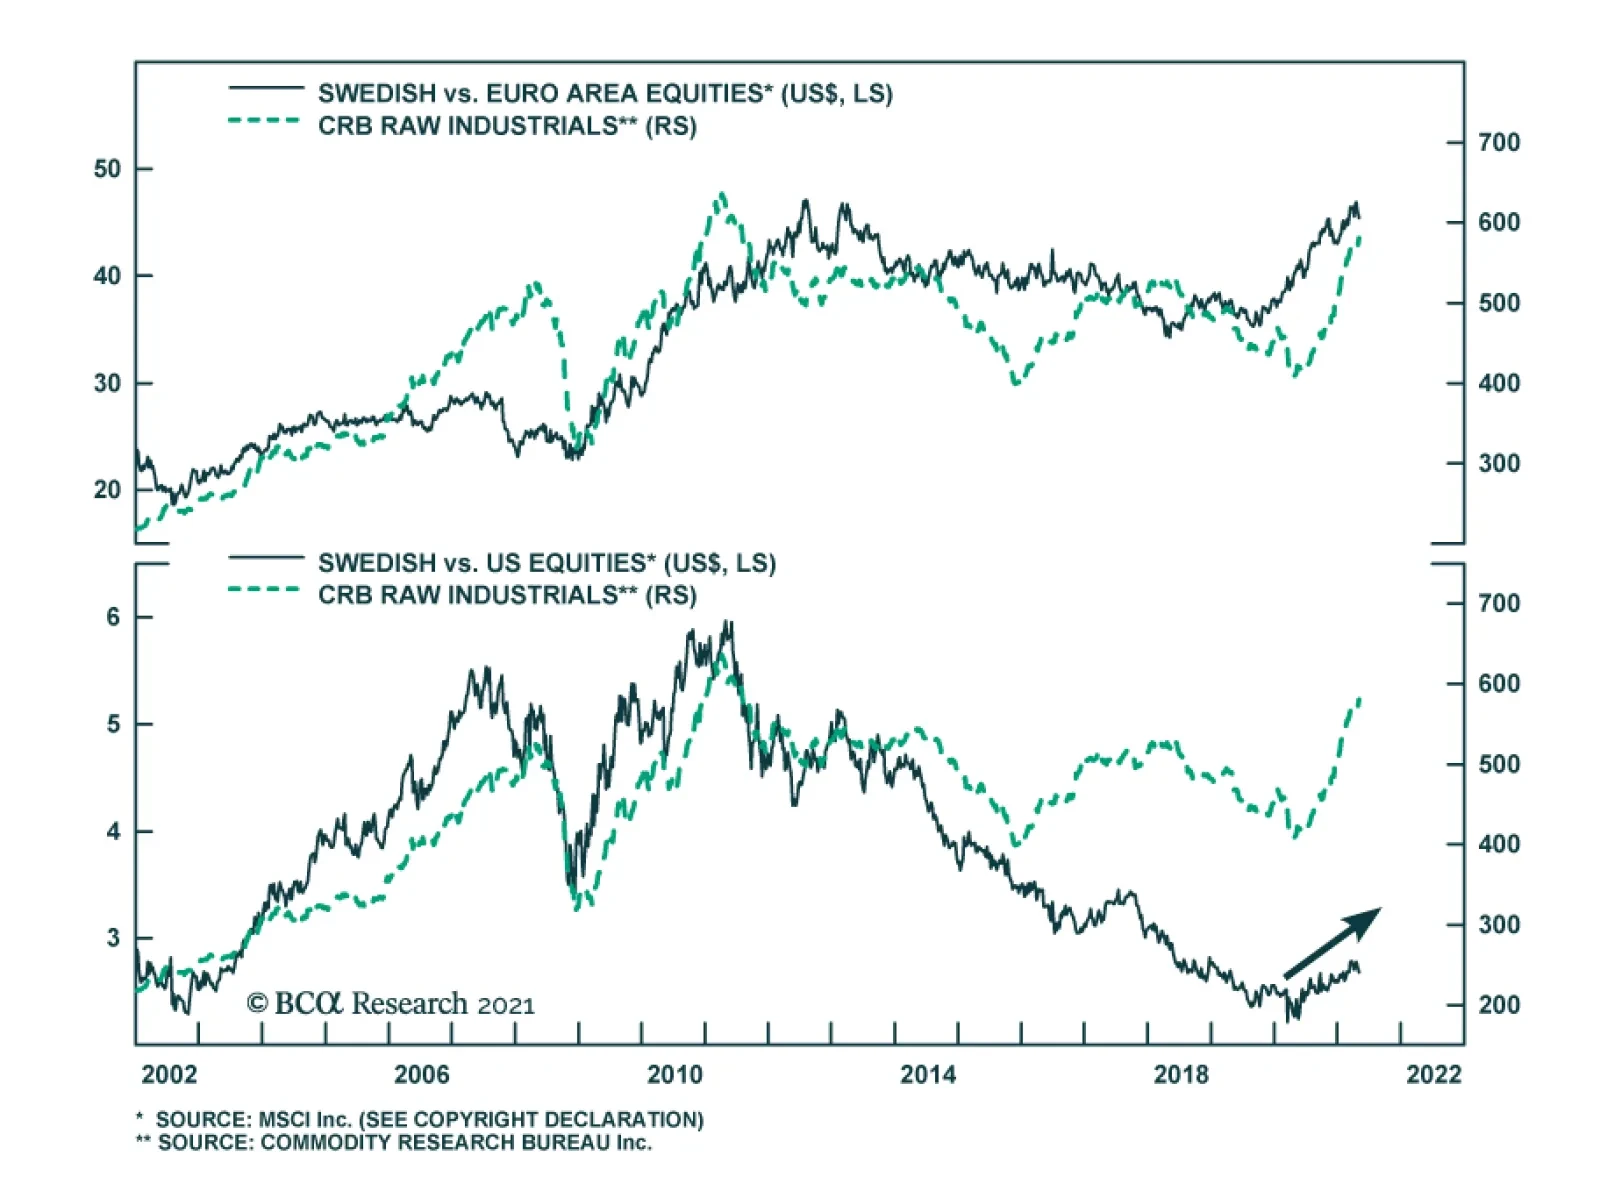
Second, an aggregation of Swedish economic data confirms the KOF indicator’s message and also calls for record economic activity in Europe. Our Swedish Economic Diffusion Index, which incorporates 14 data series from the Nordic country, points toward a further acceleration in the Euro Area PMIs relative to the US (Chart 3). It is also consistent with a pick-up in the performance of European equities relative to the US. These important indicators of the European economy reflect a variety of forces at play that increasingly point toward stronger growth. Among them, the improvement in the pace of vaccination is crucial to lifting the mood across the continent. As the top panel of Chart 4 illustrates, the number of daily vaccine doses administered across major Euro Area economies is accelerating sharply. While it took three months to inoculate 20% of the population, it only took one month to raise the vaccinated population to nearly 40% (Chart 4, bottom panel). Chart 3Sweden Leads The Eurozone
Sweden Leads The Eurozone
Sweden Leads The Eurozone
Chart 4Accelerating Vaccinations
Accelerating Vaccinations
Accelerating Vaccinations
Euro Area fiscal policy is also moving in a more growth-friendly direction. The Italian Budget announced on April 26 will add EUR248 billion in spending over the next six years. For the moment, Germany has abandoned its debt brake, and, as we wrote three weeks ago, the September election is likely to reify this outcome and further ease fiscal policy in Europe’s biggest economy. Spain is the second largest recipient of the NGEU funds, and it is expected to increase fiscal spending by EUR167 billion over the coming six years. In addition, France has yet to give clear hints about its plan, but next year’s elections are likely to result in further stimulus measures as well. Thus, fiscal easing in Europe will only increase from this point on (Chart 5). Chart 5The Expanding European Stimulus
A Surprising Dance
A Surprising Dance
Accumulated pent-up demand remains another potent fuel for growth in the Euro Area. Unlike in the US, spending on durable goods in the Eurozone has not overtaken its pre-pandemic levels (Chart 6). Furthermore, global inventory-to-sales ratio are low, which hints at a coming inventory restocking cycle. These two trends will benefit Euro Area economic activity. The service sector recovery has more to go. Despite some recent improvements, the Eurozone’s Service PMI remains depressed compared to that of the US (Chart 7, top panel). However, the acceleration in the European vaccination campaign and the continued injection of fiscal support at the same time as the lockdowns ebb should result in a significant catch up in service activity in the Euro Area. Thus, the double-dip recession is on the verge of ending and giving way to a robust GDP expansion (Chart 7, bottom panel). Chart 6Ample European Pent-up Demand
Ample European Pent-up Demand
Ample European Pent-up Demand
Chart 7The Service Sector Recovery Is Paramount
The Service Sector Recovery Is Paramount
The Service Sector Recovery Is Paramount
Even though the recovery in GDP growth will lead to strong positive economic surprises for the Euro Area, consensus growth expectations for the region remain conservative. According to Bloomberg, Eurozone annual GDP growth is expected to reach 12.6% in Q2 because of an extremely strong base effect. However, growth will decelerate suddenly and hit 2.3% in Q3 and 4.3% in Q4. Growth is anticipated to be 4.1% in 2022. These are low thresholds to beat, and thus, economic surprises will remain positive. Chart 8Decomposing The Surprises
Decomposing The Surprises
Decomposing The Surprises
The source of positive economic surprises is likely to be broad-based. If the service sector recaptures some of its previous shine, the Surveys and Business Cycle component and the Labor Market component of the Bloomberg surprises index will improve and remain positive for many months (Chart 8). Moreover, the absorption of pent-up demand will allow the Retail and Wholesale as well the Personal/Household components to remain robust or firm up further. Finally, the strength of the global manufacturing sector and the elevated potential for a global inventory restocking will allow the Industrial component to firm up anew. Bottom Line: The European economy is in a good place to validate the upbeat message from the KOF Economic Barometer or the Swedish Economic Diffusion Index. Since expectations for European economic activity are still limited for the second half of 2021, this strong growth performance will result in positive economic surprises. Investment Implications The heightened odds that Europe will generate significant positive economic surprises for the coming quarters means that investors’ perspective of the Euro Area will gradually improve. While this process will ultimately curtail the ability of Europe to beat expectations, it will also lift Eurozone assets. If our forecast is correct that European economic surprises will largely be positive over the coming 6 to 12 months, then European equities are more likely to generate generous returns than otherwise. Table 1 highlights that positive changes in the Economic Surprise Index (ESI) on a 3-month, 6-month, and 12-month horizon coincide with returns of the Euro Area MSCI equity benchmarks that have positive batting averages of 72%, 70%, and 73%, respectively. Moreover, the average and median returns are significantly higher than when the ESI deteriorates. Table 1Forecasting Strong Surprises Means Forecasting Strong Equity Returns
A Surprising Dance
A Surprising Dance
The signal from the ESI is weaker if we do not make forecasts about its direction. The batting averages of subsequent 3-month and 6-month equity returns following an improving ESI are 63% and 69%, respectively, and the median subsequent returns are higher than if today’s ESI is deteriorating, but not to the same extent as when we make a forecast of the ESI. 12-month returns for the Eurozone MSCI index have a 58% chance of being positive, if the ESI increases over a 12-month window, which is lower than the 63% batting average if the ESI worsens. Moreover, average and median 12-month expected returns are somewhat higher if the ESI has been deteriorating rather than improving over the past 12-month period. European small cap equities will be prime beneficiaries of the coming growth outperformance. From an economic perspective, this makes sense because small-cap stocks are geared more toward domestic growth than large-cap equities, which are dominated by multinationals. Table 2 shows that 3-month, 6-month, and 12-month periods of improvement in the surprise index precede an outperformance of small-cap relative to large-cap stocks over similar windows of time. Thus, the current positive level of the European ESI and its ability to rise further should favor small-cap European equities. Table 2Favor Small-Cap Stocks
A Surprising Dance
A Surprising Dance
Table 3A Bullish Backdrop For EUR/USD
A Surprising Dance
A Surprising Dance
The same exercise shows that the outlook also favors the euro. European economic surprises should continue to outpace the US, because Eurozone growth will catch up to the US, but investors already have much loftier expectations for US activity than for the Euro Area. Table 3 illustrates that periods when the Eurozone’s ESI is greater than that of the US, EUR/USD generates a positive 3-month return 65% of the time, with a median gain of 1.3%. When the US ESI is higher, the EUR/USD depreciates 55% of the time, with a median loss of -0.5%. Chart 9Rising German Yields?
Rising German Yields?
Rising German Yields?
Finally, the potential for stronger European ESI is negative for Bunds. Speeches by various members of the European Central Bank Governing Council indicate that the ECB will tolerate higher yields, if they reflect stronger economic activity. As the European vaccination campaign advances and the fiscal stimulus increases, the need to maintain depressed Bunds yields recedes. Hence, a continuation of positive ESI readings is now more likely to boost these yields. Additionally, the gap between the European ESI and the US one will remain positive, thus, a period of rising German yields relative to the US is more likely (Chart 9). Bottom Line: The ability of the European economy to continue to surprise positively should generate attractive equity returns on the continent. Moreover, this economic backdrop is consistent with an outperformance of small-cap equities, as well as an appreciating EUR/USD. Under these circumstances, Bunds yields should experience more upside. Country Focus: The UK’s Outlook Is Brightening, Unsurprisingly Last week, the Bank of England left the total size of its asset purchase program in place at GBP875 billion, even if the weekly pace of purchases was slowed to GBP3.4 billion from GBP4.4 billion. The BoE also raised its 2021 growth forecast to 7.5%, from 5% in February. The BoE is joining the Bank of Canada as one of the first central banks to taper its asset purchase program. It will also be one of the first central banks to increase interest rates, after the Norges Bank, but ahead of the Fed. In a way, the UK shares many similarities with our recent positive depiction of the Swedish economy. Chart 10Support For Household Net Worth
Support For Household Net Worth
Support For Household Net Worth
The rapid pace of vaccination in the UK allows for a vigorous economic recovery. In all likelihood, the UK economy will have contracted in Q1 2021 because of the severe lockdowns that prevailed then; however, these lockdowns are being eased and economic fundamentals point up. Our Global Fixed Income and Foreign Exchange strategists recently demonstrated that house prices are increasing on the back of rising mortgage approvals and falling household debt-servicing obligations (Chart 10). The robust readings of the RICS House Prices survey only confirm the positive outlook for housing prices. Expanding house prices will elevate consumption. An appreciating housing stock boosts the wealth of households and leads to higher UK consumer confidence. Moreover, business confidence is improving; the rise in capex intentions not only indicates that investments will increase, but is also a precursor to climbing job vacancies (Chart 11). Brighter labor market prospects often result in rising consumption, especially if wages firm up, as we argued seven weeks ago. The current bout of economic strength points to some upside in UK inflation as well. The elevated PMI readings and the rapid increase in construction activity are reliable forecasters of higher CPI prints (Chart 12). However, this not a uniquely British phenomenon, and it remains to be seen how durable this rising inflation will be. Chart 11UK Consumption Will Rise More
UK Consumption Will Rise More
UK Consumption Will Rise More
Chart 12Accelerating UK Inflation
Accelerating UK Inflation
Accelerating UK Inflation
Despite this positive economic outlook, investors should adopt a more cautious tactical stance toward UK markets. The problem for British assets is that investors have understood UK’s vaccination strength so well that they embed much optimism in the price of financial instruments levered to domestic economic activity. In contrast to the Eurozone, Bloomberg consensus forecast anticipate Q2 year-on-year GDP growth of 20.7%, 6.1% for Q3 and 6.5% for Q4. Cable is particularly ripe for some near-term profit taking. Our Intermediate-Term Technical Indicator and the 52-week rate of change of GBP/USD, as well as net speculative positions and sentiment, all point to a correction in that pair (Chart 13). Moreover, the 13-week momentum measure for EUR/GBP shows that the rapid decline in this cross is also overdone. As a result, BCA’s Foreign Exchange strategists closed their short EUR/GBP position to book some gains. It is also time to downgrade British mid- and small-cap stocks from our current overweight stance, at least on a tactical basis. Compared to large-cap UK stocks, small-cap names have moved in a parabolic fashion, and the ratio’s elevated 52-week rate-of-change measure warns of a pullback, especially in light of the deterioration in near-term momentum (Chart 14). The message from technical indicators is particularly concerning, because the forward earnings of small-cap stocks are plunging relative to large cap ones (Chart 15). Additionally, valuation multiples on UK small-cap stocks have vastly outpaced those of their larger counterparts, despite a rapid decline in relative RoE (Chart 16). Chart 13Cable Is Ripe For Some Near-Term Profit Taking
Cable Is Ripe For Some Near-Term Profit Taking
Cable Is Ripe For Some Near-Term Profit Taking
Chart 14UK Small-Cap Stocks Are Technically Vulnerable
UK Small-Cap Stocks Are Technically Vulnerable
UK Small-Cap Stocks Are Technically Vulnerable
Chart 15Deteriorating Profit Performance
Deteriorating Profit Performance
Deteriorating Profit Performance
Chart 16Quite The Valuation Premium
Quite The Valuation Premium
Quite The Valuation Premium
Ultimately, these cautious views are of a short-term nature. BCA’s Foreign Exchange strategists remain upbeat on the pound on a 12- to 24-month basis. Cable continues to trade at a deep discount to our purchasing-power parity estimate, which adjusts for the composition of price indexes in the UK and the US (Chart 17). Moreover, real short rate differentials still favor GBP/USD. The pound also trades at a discount to the euro based on long-term valuation metrics. Most importantly, real interest rates differentials at both the short- and long-end of the curve, as well as the outlook for the evolution of monetary policy in the UK relative to the Euro Area, indicate a significantly lower EUR/GBP (Chart 18). Chart 17Despite Nera-term risks, Cable's Cyclical Underpinning Is Strong
Despite Nera-term risks, Cable's Cyclical Underpinning Is Strong
Despite Nera-term risks, Cable's Cyclical Underpinning Is Strong
Chart 18Lower EUR/GBP Ahead
Lower EUR/GBP Ahead
Lower EUR/GBP Ahead
For small-cap equities, the cyclical picture is more complex. On the one hand, their domestic exposure and a higher pound over the coming 12 to 24 months should help them, unlike the large-cap UK stocks, which derive most of their income from abroad and are negatively affected by a higher GBP. On the other hand, UK small-cap stocks have become so expensive that we need to see how an appreciating pound will boost their earnings relative to large-cap stocks before adjusting our neutral stance. Bottom Line: The strong UK economy will allow the BoE to be one of the first major DM central banks to tighten policy. This will support a further appreciation of the pound against both the dollar and the euro over the coming 12 to 24 months. Nonetheless, the GBP has been overbought on a tactical basis and is vulnerable to a near-term pullback. Similarly, compared to large-cap equities, we are downgrading small-cap UK stocks from overweight to neutral on a tactical basis. Mathieu Savary, Chief European Investment Strategist Mathieu@bcaresearch.com Jeremie Peloso, Associate Editor JeremieP@bcaresearch.com Cyclical Recommendations Structural Recommendations Trades Currency Performance
A Surprising Dance
A Surprising Dance
Fixed Income Performance Government Bonds
A Surprising Dance
A Surprising Dance
Corporate Bonds
A Surprising Dance
A Surprising Dance
Equity Performance Major Stock Indices
A Surprising Dance
A Surprising Dance
Geographic Performance
A Surprising Dance
A Surprising Dance
Sector Performance
A Surprising Dance
A Surprising Dance
Closed Trades
Highlights The Scottish parliamentary election does not present a near-term risk of a second referendum on Scottish independence. Independence is possible down the road but very unlikely due to a host of economic and geopolitical challenges still relevant in the twenty-first century. Book gains on long CHF-GBP. Go long FTSE 100 versus developed markets excluding the United States. Feature British equities have underperformed developed markets over the past decade – even if we exclude the market-leading United States (Chart 1). The British equity market is heavily concentrated in cyclical sectors like financials and materials and has a low concentration in information technology and communications services. As such the bourse has sprung to life since the advent of the COVID-19 vaccine and the prospect of a government-stimulated global growth recovery. In keeping with our strategic preference for value over growth we also look constructively at British equities. A potential source of geopolitical and political risk is Britain’s ongoing constitutional crisis, which flared up with the failed Scottish independence referendum in 2014 and the successful referendum to leave the EU in 2016. Tensions within the UK and between the UK and EU are part of the same problem – a loss of popular confidence and trust in the current nation-state and governing institutions in the aftermath of hyper-globalization.1 This constitutional crisis added insult to injury for UK stocks by jacking up policy uncertainty and undermining the attractiveness of domestic-oriented UK companies that suffered from trade disruptions with the European Union. Chart 1UK Referendums Added Insult To Injury
UK Referendums Added Insult To Injury
UK Referendums Added Insult To Injury
Chart 2Post-Brexit Trading Range For GBP-EUR
Post-Brexit Trading Range For GBP-EUR
Post-Brexit Trading Range For GBP-EUR
Now the COVID-19 pandemic and its aftermath have changed the global scene entirely and Brexit is no longer Britain’s chief concern. But there is still a lingering question over Scotland’s status. The Scottish question has recently weighed on the British pound and reinforced the new trading range for the GBP-EUR exchange rate in the aftermath of a “hard” exit from the European Union (Chart 2). Scotland voted for a new parliament on May 6 and the preliminary results are coming in as we go to press. The pro-independence Scottish National Party is still the most popular party and even if it falls short of a majority, as online betting markets expect, it has pro-independence allies with which it could form a coalition (Chart 3). Its leader, Scottish First Minister Nicola Sturgeon, has promised to pursue a second popular referendum on seceding from the United Kingdom by 2023. Chart 3Betting Markets Doubt Single-Party Majority For SNP
United Kingdom Stays United
United Kingdom Stays United
British Prime Minister Boris Johnson, backed by a strong Conservative Party parliamentary majority, has vowed not to allow a second referendum, arguing that the 2014 plebiscite was supposed to lay the question to rest for a while. Scottish opinion in favor of secession stands at 43.6% today, right near the 44.7% that nationalists achieved in 2014 (Chart 4). Chart 4Support For Independence Ticks Down, Still Shy Of Majority
United Kingdom Stays United
United Kingdom Stays United
Our takeaway is to fade the Scottish risk. Book gains on our long CHF-GBP tactical trade. Go long British equities relative to DM-ex-US on the expectation of global economic normalization, which is beneficially for the outwardly oriented British multinationals that dominate the British bourse. Does Scotland Have Grand Strategy? The history of Scotland is marked by internal differences that prevent it from achieving unity and independence. Even in the twenty-first century, when many factors have coalesced to make Scottish independence more likely than at any time since the eighteenth century, the 2014 referendum produced a 10% gap in favor of remaining in the United Kingdom. This majority is all the more compelling when viewed from the perspective of geography because cross-regional support for the union is clear (Map 1). Map 1Scottish Independence Referendum Result, 2014
United Kingdom Stays United
United Kingdom Stays United
Why is Scotland always divided? Because it is trapped by the sea and adjacent to a greater power, England. England is usually strong enough to keep Scotland from consolidating power and asserting control over its maritime and land borders. Specifically, Scotland contains a small population (at 5.5 million today) and small economic base (GBP 155 billion in economic output at the end of 2022) dispersed over an inconvenient geography. The low-lying plains around the Firth of Forth that form the historic core of Scotland share a porous border with England. The highlands provide a retreat for Scottish forces during times of conflict, which makes it extremely difficult for southern forces, whether Roman or Anglo-Saxon, to conquer Scotland. But the highlands are equally hard for any standalone Scottish state to rule. Meanwhile the western isles are even more remote from the seat of Scottish power and vulnerable to foreign maritime powers. Since England could never conquer Scotland, its solution was to coopt the Scottish elite, who reciprocated, culminating in a merger of the two monarchies and then the two states in the seventeenth and eighteenth centuries. The British empire provided Scotland with peace, prosperity, and access to the rest of the world. History and geopolitics do not imply that Scottish independence is impossible, i.e. that union with the rest of Britain is inevitable and permanent. The Anglo-Scots union is only 314 or 418 years old, whereas Scotland existed as a recognizable kingdom for roughly six centuries prior to the joining of the crowns in 1603. It is entirely possible for Scotland to secede and break up the union known as Great Britain. The principle of rule by consent and modern democratic ideology make it difficult for London and Westminster to force Scotland into subjection like in the old days. In particular, American hegemony over Europe since WWII and the rise of the European Union have created a pathway for Scottish independence. England is no longer the indispensable gateway to peace and prosperity. Scotland can exist independently under the EU’s economic umbrella and the American security umbrella. Europe has always played a major role in Scotland’s political fate and has always held the key to independence. Independence usually failed because European powers failed to devote large and steady resources to supporting Scotland militarily and economically. France was Scotland’s greatest patron and would lend its support for Scottish rebellion. But France also consistently failed Scotland (and Ireland) at critical junctures when independence might have been obtained. This is because France’s interests lay in distracting England rather than adopting Scotland. Chart 5Scottish Energy Production In Decline
United Kingdom Stays United
United Kingdom Stays United
Today’s unified European continent could be a much greater patron than France ever was alone. The EU could assure Scotland of investment and access to markets even in the face of British resistance. However, the EU is still not politically unified: some members fear separatism in their own borders and therefore tend to oppose Scottish accession. It is possible that the EU could overcome this difficulty but only after a series of major events (on which more below). It took an American empire to clear the way for Irish independence. But Ireland has the moat of the Irish Sea – and the United Kingdom still retained Northern Ireland. Today the United States can be expected to keep its distance from quarrels within the UK or between the UK and EU. However, it does not have an interest in Scottish secession or any other disintegration of the UK, whether from a global security point of view (the West’s conflict with Russia) or even from the point of view of US grand strategy relative to Europe (prevention of a European empire that could challenge the US). An independent Scotland would struggle economically. Its declining base of fossil fuel reserves illustrates the problem of generating sufficient revenue to maintain the Scandinavian-style social welfare state that Scotland’s nationalists imagine (Chart 5). Scottish nationalists are keen to embrace renewable energy – and the Scottish Greens are pro-independence – yet Scotland is not a manufacturing powerhouse that will produce its own solar panels and windmills. In the face of economic difficulties, Scotland would become politically divided like it was for most of its history prior to union with England. England would revert to an obstructive or sabotaging role. It is telling that the Scottish voter turnout in the 2014 independence referendum was very strong – much stronger than in other recent elections and plebiscites, including the Brexit referendum in Scotland (Table 1). The implication is that it is much harder for Scotland to strike out on its own than it appears. Opinion polling cited above suggests that neither Brexit nor the COVID-19 pandemic has moved the needle decisively in the direction of independence. If anything it is the opposite. The Scottish National Party has lost momentum since 2014 and is losing momentum in advance of today’s local election, which has been pitched as the opportunity to make a second go at independence (Chart 6). Table 1Scotland: High Turnout In 2014 Independence Referendum Implies Firm Conclusion To Stay In UK
United Kingdom Stays United
United Kingdom Stays United
Chart 6Scottish National Party Losing Momentum Just Ahead Of Holyrood Election
Scottish National Party Losing Momentum Just Ahead Of Holyrood Election
Scottish National Party Losing Momentum Just Ahead Of Holyrood Election
Bottom Line: History suggests that the geopolitical and macroeconomic barriers to a unified and independent Scottish state are higher and stronger than they may appear at any given time, including the inevitable periods of tensions with England like today. The UK’s Saving Graces A fair question is whether the UK’s decision to leave the EU since 2016 has changed Scotland’s calculus. Brexit may also have affected the international context, reducing the EU’s willingness to intervene on the UK’s behalf and discourage Scottish ambitions. However, a handful of factors supports the continuation of the union despite Scotland’s grievances. The UK proved a boon amid COVID-19: While 62% of Scots voted against Brexit, the COVID-19 pandemic and recession have supplanted Brexit as the nation’s chief cause of concern. The UK and Scotland saw a higher rate of deaths during the biggest waves of the pandemic but now the pandemic is effectively over in the UK and Scotland, in stark contrast with the European Union (Chart 7). The UK has provided a net benefit to Scotland by inventing the vaccine and distributing it effectively (Chart 8). Scottish voters would have been worse off had they left the UK in 2014. Of course, Scottish nationalism is apparent in the fact that voters give the credit to Edinburgh while blaming London over its handling of the pandemic (Chart 9). But the underlying material reality – that being part of the UK provided a net benefit – will discourage independence sentiment. The Scottish Conservative Party and Labour Party are both in favor of sustaining the union and have benefited in opinion polling since the pandemic peaked. Chart 7COVID Deaths Collapse In ##br##United Kingdom
United Kingdom Stays United
United Kingdom Stays United
Chart 8Scotland Benefited From UK Vaccine And Rollout
United Kingdom Stays United
United Kingdom Stays United
Chart 9Scots Praise Edinburgh, Blame London On COVID Handling
United Kingdom Stays United
United Kingdom Stays United
Brexit is a cautionary economic tale: If Brexit is relevant to Scottish voters, it is not the source of grievance that it could have been. Prime Minister Boris Johnson achieved an exit and trade deal at the end of 2019-20 that largely preserves economic ties with the EU. True, the deal has problems that undermine the UK economy and enhance Scottish grievances. But these also serve as a warning to Scots who would attempt to exit the UK, highlighting the economic pitfalls of raising borders and barriers against one’s chief market. The UK’s trade is far more critical to Scotland’s economy than that of the EU (Chart 10). Chart 10Major Constraint On Scottish Independence
United Kingdom Stays United
United Kingdom Stays United
Unlike in the case of the UK and EU, Scotland shares the same currency and central bank with the UK. Scotland’s large banking sector stands to suffer drastically if the Bank of England ceases to be a lender of last resort. This would become a major problem at least until Scotland could be assured of admission into the EU and Euro Area. Otherwise redenomination into a national currency would deal an even greater financial and economic blow. Scots would face a far more painful economic divorce from the UK than the UK faced with the EU. The UK’s fiscal blowout helped Scotland: Since the bank run at Northern Rock in 2007, the UK and Scotland have suffered a series of crises. This instability should discourage risk appetite today when contrasted with the possibility of stimulus-fueled economic recovery. In particular, the UK government is no longer pursuing fiscal austerity – an economic policy that fanned the flames of Scottish secession back in 2012. Indeed, the UK tops the ranks of global fiscal stimulus, according to the change in government net lending and borrowing as reported by the IMF. The UK’s outlier status ensures that Scotland receives more fiscal support than it otherwise would have (Chart 11). A brief comparison with comparable countries – Ireland, Belgium, France, Norway, Portugal – reinforces the point. Chart 11Scotland Benefited From UK Fiscal Blowout
United Kingdom Stays United
United Kingdom Stays United
The UK’s aggressive policy of monetary and fiscal reflation is not a coincidence. It stems from the past two decades’ constitutional and political struggles – it is an outgrowth of domestic instability and populism. It includes an industrial policy, a green energy policy, and other rebuilding measures to combat the erosion of the state in the wake of hyper-globalization. Essentially the UK, even under a Tory government, is now about debt monetization and nation-building. While Scotland would have trouble bargaining for its share of EU resources, it benefits from the UK’s shift to government largesse and can use the threat of independence to receive greater funds from the United Kingdom. Geopolitics discourages a fledgling Scottish nation. Scotland hosts naval and air bases of considerable value to the UK, US, and broader NATO alliance. Former US President Trump’s punitive measures against the European allies and open doubts about the US’s commitment to NATO’s collective security illustrated the dangers of western divisions in the face of autocratic regimes like Russia and China. The US and EU are now recommitting to their economic and security bonds under the Biden administration. Scottish independence would undermine this recommitment and as such the small country would pit itself against the US, EU, and NATO. While the US and NATO would ultimately admit Scotland into collective security, for fear of cultivating a neutral Scotland that could eventually be exploited by Russia, they would likely discourage independence ahead of time to prevent a historic division within the UK and NATO. Chart 12No Urgency For A Second Referendum
United Kingdom Stays United
United Kingdom Stays United
As for the EU, the Spanish government has indicated that it would be willing to make an exception for Scottish independence if it were negotiated amicably with the United Kingdom.2 Such statements are doubtful, however, as any successful secession would lend ideological credibility to Spanish secessionism – not only in Catalonia but also in the Basque country and elsewhere. And Spain is not the only country that harbors deep hesitations over Scottish accession to the European Union. Belgium, Slovakia, and Cyprus could also oppose it. It only takes a single veto to halt the whole accession process. Ultimately the EU could accept Scotland, just as would NATO, to avoid the dangers of having a neutral state in a strategic location. But the point is that Scottish voters cannot be certain. For example, Scotland cannot secure EU accession prior to leaving the UK and yet to leave the UK and fail to achieve EU accession would render it a fledgling. This explains why Scottish voters are not eager to hold a new independence referendum (Chart 12). Bottom Line: The UK offers medical, economic, fiscal, and geopolitical advantages to Scotland that independence would revoke. The context of Great Power struggle with Russia and China means that an independent Scotland would probably ultimately be admitted into NATO and the EU – but Scottish voters cannot be certain, a factor that discourages independence at least in the short and medium run. Scottish Hurdles Table 2 highlights the historic results of Scottish elections according to political party, popular vote share, and share of seats in parliament. Early, tentative signs suggest that the Scottish National Party maxed out in 2011. The party has suffered from a leadership schism, offshoot parties, and a distraction of its key message since 2014. The implication is not only that Scottish independence is on ice for now but also that the tumultuous constitutional disagreements are subsiding and voters want to focus on economic recovery. Table 2Scottish National Party Hit High-Water Mark In 2011?
United Kingdom Stays United
United Kingdom Stays United
If the Scottish National Party manages to form a majority coalition capable of pushing forward a second referendum, it will face several hurdles. It will need a UK Supreme Court ruling on the legality of a referendum. If a referendum is declared legal (as it very likely will be), Scotland will need to forge an agreement with Prime Minister Boris Johnson to hold a referendum. If a referendum eventually is held and passes, an exit will need to be negotiated. In a post-Brexit world, investors cannot assume that any referendum will fail or that a referendum is a domestic political ploy that the ruling party has no serious intention of following through. Nevertheless it is true that the Scottish National Party could use the threat of a referendum to agree to negotiate a greater devolution of power from Westminster. The party could hold up England’s concessions as a victory while retaining the independence threat as leverage for a later date. Devolution in the past has strengthened the independence cause, as in the creation of the Scottish parliament in 1999. After all, a referendum loss would be devastating for the nationalists, whereas the threat of a referendum could yield victories without depriving the nationalists of their reason for being. It is notable that First Minister Nicola Sturgeon promised not to hold a “wildcat” referendum, in which Scotland holds a referendum regardless of what Westminster or the UK Supreme Court say. The implication is that Scottish nationalism is looking for a stable way to exit. But if stability is the hope then there is dubious support for independence in the first place. A wildcat referendum is theoretically still an option but a formal process with popular support is much more likely to result in a successful referendum than an informal process with dubious popular support. Chart 13Scotland’s Chronic Deficits
Scotland's Chronic Deficits
Scotland's Chronic Deficits
If Scottish independence succeeded in any wildcat referendum, an extreme controversy would follow as Edinburgh tried to translate this result to the formal political and constitutional sphere. If the referendum were not recognized by the UK then Scotland would be forced to secede unilaterally at greater economic cost. Otherwise a third referendum (second formal referendum) would need to be held to confirm the results. Any third referendum would be irrevocable. As with Brexit, the secessionists would have to carry one or more subsequent elections to execute the political will in the event of secession. The point for investors is that volatility would be prolonged as was the case with Brexit. A major complication in Scottish independence remains the problem of public finances. Scotland’s fiscal standing is weak. Scotland ran a 9.4% of GDP budget deficit prior to COVID-19, excluding transfers from the UK, which compensates for a gap of about 6% of GDP (Chart 13).3 The country maintains generous social spending alongside a low-tax regime. There is no sign of correction as all Scottish parties are proposing more expansive social spending in the parliamentary election. The Scottish National Party is even proposing universal basic income. Scotland’s emergency COVID deficits are larger than the UK’s as well and projections over the coming years suggest that they will stay elevated. Historically economic growth keeps closely in line with the rest of the UK and there is no reason to believe independence would boost growth. The implication is that Scotland would have to curtail spending or raise taxes to come into line with UK-sized deficits, which are not small (Chart 14).4 Of course Scotland would not embrace austerity unless financial market pressure forced it to do so. Chart 14Scottish Deficit Projected Larger Than UK
United Kingdom Stays United
United Kingdom Stays United
Scotland would become a high-debt economy. Its public debt-to-GDP ratio would be about 97%, on a back-of-the-envelope calculation. Back in 2013 estimates ranged around 80% of GDP.5 The Scottish National Party’s Sustainable Growth Commission projected in 2018 – before the pandemic blew an even wider hole in the budget deficit – that deficits would nearly have to be cut in half (i.e. capped at 5% of GDP and falling) to achieve a 50% debt-to-GDP ratio over 10 years.6 This is not going to happen. Scotland would also have to take on a portion of the UK’s national debt if it were to have an amicable divorce from the UK and retain the pound sterling. But then much of its newfound independence would be compromised from the beginning by legacy debt and monetary policy shackles. Similar restrictions would come with EU and euro membership. Any accession process after the pandemic would require conformity to the EU’s growth and stability pact, which limits deficits and debt. Redenomination into a national currency, as noted, would dilute domestic wealth, zap the financial industry, and self-impose austerity. Bottom Line: Even if the Scottish nationalists manage to put together a pro-independence majority in Edinburgh, they face a complex process in setting up a referendum. Its passage is doubtful based on the current evidence. But obviously in the wake of Brexit investors should not assume that a referendum attempt will fail or that a successful referendum will be thwarted by parliament after a “leave” vote. The timeline for a second referendum is not imminent – and Scottish independence is highly unlikely, albeit possible at some future date given that middle-aged Scots lean in favor of independence. Investment Takeaways We will conclude with two market takeaways: Chart 15UK Stocks Recovering From Referendum Fever
UK Stocks Recovering From Referendum Fever
UK Stocks Recovering From Referendum Fever
Chart 16Hindsight On How To Play A Constitutional Struggle
Hindsight On How To Play A Constitutional Struggle
Hindsight On How To Play A Constitutional Struggle
The UK’s referendum fever has compounded political uncertainty and contributed to negative factors for the UK equity market over the past decade. A segmentation of the FTSE 100 according to country shows that Scottish-based companies’ share prices rolled over in the aftermath of the 2014 referendum, while the non-Scottish segment performed better (Chart 15). The implication is not that the referendum caused stocks to fall but that the 2014 independence push was the result of national exuberance supercharged by high commodity prices. Enthusiasm for independence has been flat since that time. What is clear is that financial markets look even less favorably upon Scottish equities than other British equities – another sign of the economic problems that will ultimately discourage Scottish voters from going it alone. In advance of the Scottish election, we went tactically long the Swiss franc relative to the British pound to capitalize on jitters that we expected to hit the currency. This trade was in keeping with the long fall of GBP-CHF over the past decade (Chart 16). But the stronger forces of global stimulus, vaccination, economic normalization, and recovery will soon provide a tailwind for sterling yet again. Therefore we are booking 1% gains and shifting to a more optimistic outlook on the pound. With the Brexit saga and the COVID crisis in the rear view mirror, and the tail risk of Scottish independence unlikely, the pound can resume its upward trajectory – at least relative to the Swiss franc. International equities and cyclicals are also poised to continue rising as the world recovers. We recommend investors go long the FTSE 100 relative to developed markets excluding the United States. Matt Gertken Vice President Geopolitical Strategy mattg@bcaresearch.com Footnotes 1 Jeremy Black, “The Legacy of the Scottish Referendum,” Foreign Policy Research Institute E-Notes, September 22, 2014, fpri.org. 2 See Akash Paun et al, "Scottish Independence: EU Membership And The Anglo-Scottish Border," Institute For Government, March 2021, instituteforgovernment.org.uk. 3 See Eve Hepburn, Michael Keating, and Nicola McEwen, "Scotland’s New Choice: Independence After Brexit," Centre on Constitutional Change, 2021, centreonconstitutionalchange.ac.uk. 4 See David Phillips, "Updated projections of Scotland’s fiscal position – and their implications," Institute for Fiscal Studies, April 29, 2021, ifs.org.uk. 5 Granting that the UK’s general government gross debt stood at GBP 1.88 trillion at the end of 2020, and assuming that Scotland takes on a share of this debt equivalent to Scotland’s share of the UK’s total population and output (roughly 8%), the Scottish debt would stand at GBP 150 billion out of a Scottish GDP at current market prices of GBP 156 billion, or 97% of GDP. For the 2013 estimate of at least 80% of GDP, see David Bell, "Scottish Independence: Debt And Assets," Centre on Constitutional Change, December 3, 2013, centreonconstitutionalchange.ac.uk. 6 Scottish National Party, "Part B: The Framework & Strategy for the Sustainable Public Finances of an Independent Scotland," Sustainable Growth Commission, May 2018, sustainablegrowthcommission.scot. The commission’s debt curbs will have to be revised in the wake of COVID-19. For discussion see Chris Giles and Murie Dickie, "Independent Scotland would face a large hole in its public finances," Financial Times, April 2, 2021, ft.com.
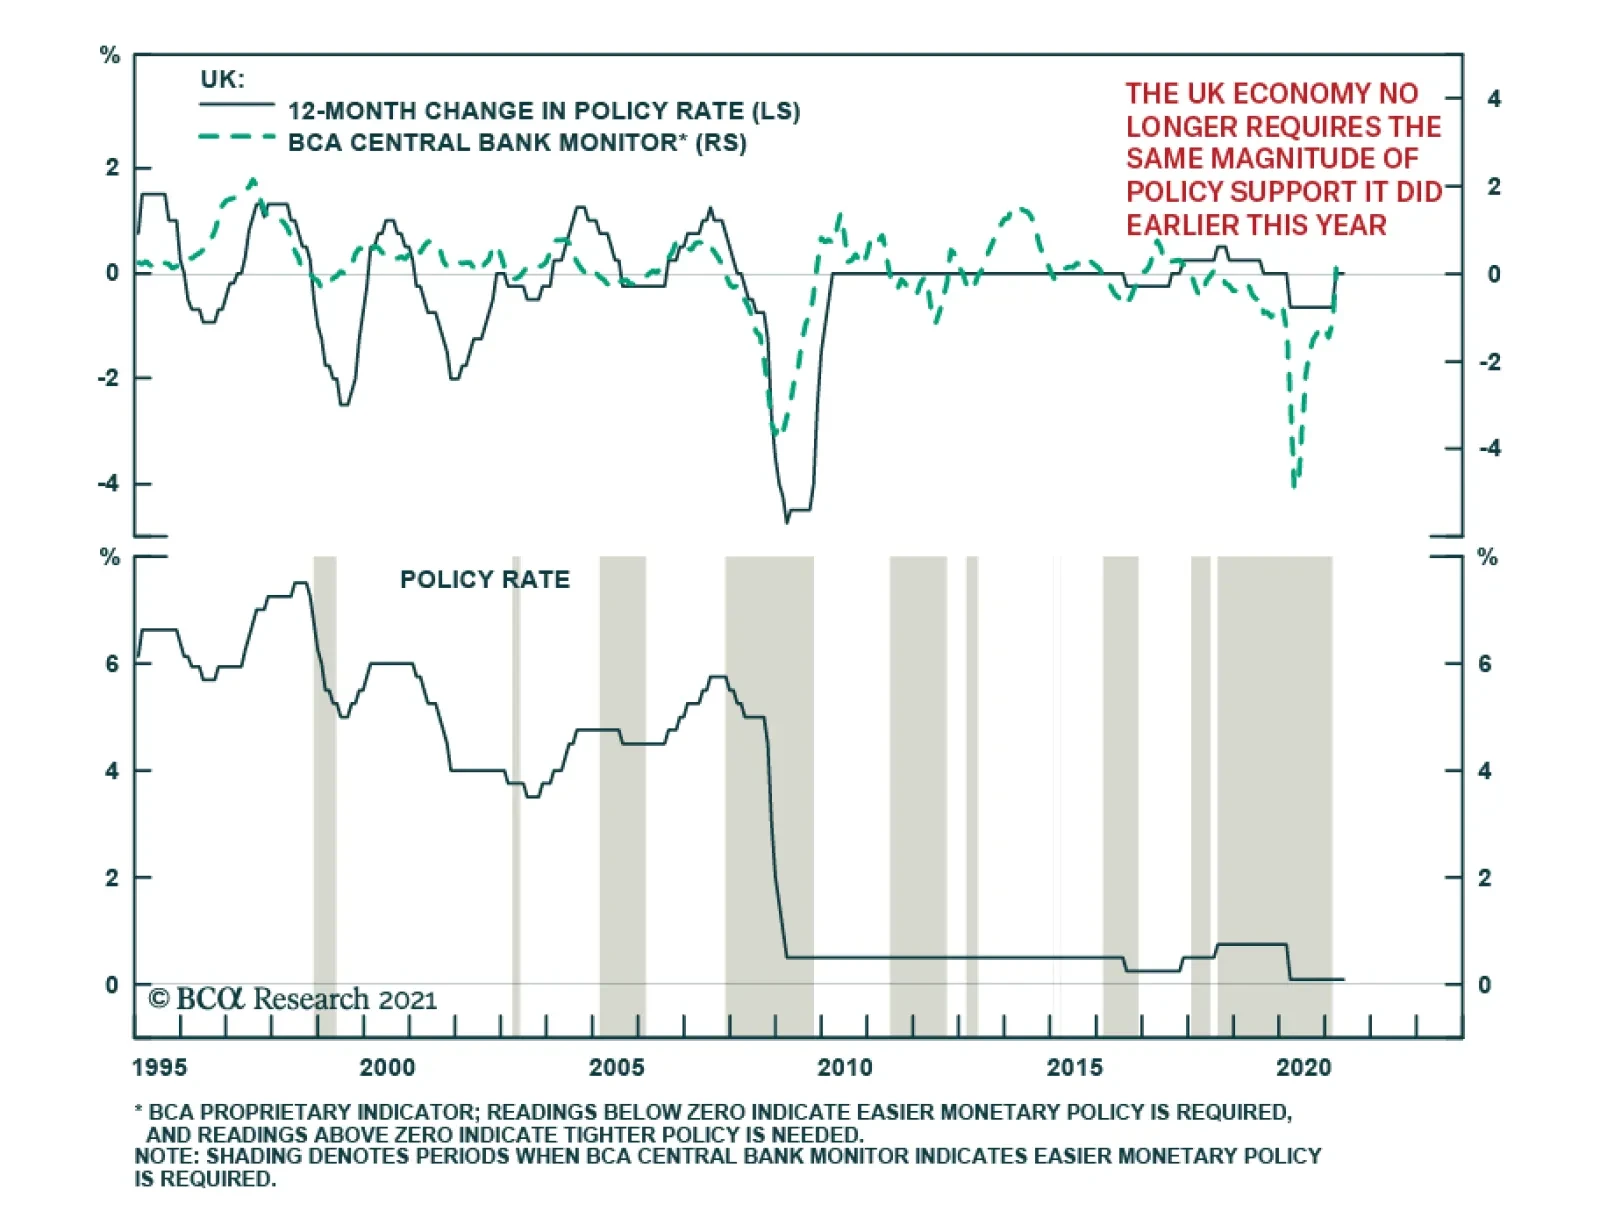
As expected, the Bank of England maintained the bank rate at 0.1% and kept the total target stock of asset purchases unchanged at its Thursday meeting. However, the central bank upgraded its growth outlook and now forecasts GDP to rise 7.25% in 2021 – up from…
Highlights US natural gas prices will remain well supported over the April-October injection season, as the global economic expansion gains traction, particularly in Europe, which also is refilling depleted storage levels. China's natgas demand is expected to rise more than 8% yoy, and EM Asia consumption also will be robust, which will revive US liquified natural gas (LNG) exports. Exports of US light-sweet crude into the North Sea Brent pricing pool – currently accounting for close to half the physical supply underpinning the global oil-price benchmark – also will increase over the course of the year, particularly in the summer, when maintenance will markedly reduce the physical supply of crudes making up the Brent index. At the margin, coal demand will increase in the US, as industrial natgas demand and LNG exports incentivize electric generators to favor coal. Higher-than-expected summer temperatures in the US also would boost coal demand. This will be tempered somewhat in Europe, where carbon-emissions rights traded through €50/MT for the first time this week on the EU's Emission Trading System (ETA). We expect US LNG and oil exports to revive this year (Chart of the Week) and remain long natgas in 1Q22. Feature The importance of US LNG and crude oil exports out of the US Gulf to the global economy is only now becoming apparent. As demand for these fossil fuels grows and the supply side continues to confront a highly uncertain risk-reward tradeoff, their importance will only grow. In natgas markets, US LNG cargoes out of the US Gulf balanced demand coming from Asia and Europe this past winter, which was sharply colder than expected and stretched supply chains globally. As a widening economic recovery from the COVID-19 pandemic spurs industrial, residential and commercial demand, and inventories in Europe and Asia are re-built in preparation for next winter, US LNG exports will be called upon to meet increasing demand, particularly since they are priced attractively vs regional importing benchmarks, with differentials vs the US presently $4+/MMBtu vs Europe and $5+/MMBtu vs Asia (Chart 2).1 Chart of the WeekUS LNG, Oil Export Growth Will Rebound
US LNG, Oil Export Growth Will Rebound
US LNG, Oil Export Growth Will Rebound
Chart 2Lower US Natgas Prices Encourage LNG Exports
Importance Of US Gas, Oil Exports Increases Daily
Importance Of US Gas, Oil Exports Increases Daily
In oil markets, an ongoing kerfuffle in the pricing of Brent Blend brought about by falling North Sea crude oil production makes American light-sweet crude oil exports from the Gulf (i.e., WTI produced mostly in the Permian Basin) account for almost half of the physical supplies in this critical benchmark-pricing market.2 US LNG Exports Will Increase US natural gas prices will remain well supported as the global economic expansion gains traction, and the US and Europe open the April-October injection season well bid (Chart 3). US inventories are expected to end the Apr-Oct injection season at just over 3.7 TCF according to the EIA, very close to where they ended the 2020 injection season. Chart 3US, Europe Rebuild Storage
Importance Of US Gas, Oil Exports Increases Daily
Importance Of US Gas, Oil Exports Increases Daily
Higher US LNG exports, industrial, commercial and residential demand will be offset by lower consumption from electric generators this year, netting to a slight decline in overall demand. The EIA expects generators to take advantage of lower generating costs to be had burning coal to produce electricity, a view we share given the current differentials in the forward curves for each fuel (Chart 4).3 On the supply side, the EIA's expecting output to remain unchanged from last year at just under 91.5 BCF/d in 2021. Higher LNG exports, even as generator demand is falling, pushes prices higher this year – averaging $3.04/MMBtu this year – which leads to a slight increase in output in 2022. For our part, we continue to expect higher prices during the November-March heating season than currently are clearing the market and remain long 1Q22 $3.50/MMBtu calls vs. short $3.75/MMbtu calls. As of Tuesday night, when we mark to market, this position was up 20.8% since inception on 8 April 2021. Chart 4Lower Prices Will Favour Increased Coal Demand
Lower Prices Will Favour Increased Coal Demand
Lower Prices Will Favour Increased Coal Demand
Natgas demand could surprise on the upside during the injection season if air-conditioning demand comes in stronger than expected and production remains essentially unchanged this year. This could reduce LNG exports and slow the rate of inventory refill in the US, which could further advantage coal as a burner fuel for generators in the US. The US National Weather Service's Climate Prediction Center expects above-average temperatures for most of the US population centers this summer (Chart 5). This could become a semi-permanent feature of the market if current temperature trends persist (Chart 6). Based on analyses’ run by the NOAA's National Centers for Environmental Information, 2021 "is very likely to rank among the ten warmest years on record," with lower (6%) odds of ranking in the top five hottest years on record.4 Chart 5Odds Of Hotter Summer Rising
Importance Of US Gas, Oil Exports Increases Daily
Importance Of US Gas, Oil Exports Increases Daily
Chart 6Higher Global Temperatures Could Become A Recurring Phenomenon
Importance Of US Gas, Oil Exports Increases Daily
Importance Of US Gas, Oil Exports Increases Daily
The Crude Kerfuffle As the Chart of the Week shows, US exports of light-sweet crude oil peaked at ~ 3.7mm b/d in February 2020, just before the COVID-19 pandemic hit the world full force. Exports out of the US Gulf – i.e., WTI priced against the Midland, TX, gathering hub – accounted for ~ 95% of these volumes. With exports currently running ~ 2.5mm b/d, more than 1mm b/d of readily available export capacity remains in place. Additional volumes will be developed as dredging of the Corpus Christi, TX, progresses. While the surge in US crude oil production has subsided in the wake of the pandemic, it most likely will revive as the markets return to normal operating procedure, additional dredging operations are completed, and storage facilities are built out.5 Existing and additional export capacity of the US's light-sweet crude could not arrive at a more opportune time for the Brent market, which remains in a state of uncertainty as to whether markets will have to adjust to CIF contracts or a work-around to the existing FOB pricing regime, which can be augmented to accommodate increasing WTI volumes.6 This will have to be sorted, as this is the future of the market's most important pricing index (Chart 7). The buildout in crude-oil exporting capacity – and natgas LNG exporting capacity, for that matter – ideally accommodates shale-oil- and -gas assets, which can be ramped up quickly to meet demand, and ramped down quickly as demand falters. The quick payback – 2 to 3 years – on these investments allow the producers to expand and contract output without the massive risks longer-lived conventional assets impose. As OPEC 2.0's spare capacity is returned to the market, this will be a welcome feature of a market that most likely will require oil and gas supplies for decades, despite the uncertainty attending oil-and-gas capex during the transition to a low-carbon energy future. Chart 7Permian Replaces North Sea Losses
Permian Replaces North Sea Losses
Permian Replaces North Sea Losses
Bottom Line: As the future of hydrocarbons evolves, the LNG and crude oil exported from the US Gulf will occupy an increasingly important role in these markets. Oil and gas producers are making capex decisions under increasingly uncertain conditions, which favor exactly the type of resources that have propelled the US to the position of the world's largest producer of these fuels – i.e., shale-oil and -gas. Production from these resources can be ramped up and down quickly as prices dictate, and have quick paybacks (2-3 years), which means capital is not tied up for decades as a return is earned.7 Robert P. Ryan Chief Commodity & Energy Strategist rryan@bcaresearch.com Ashwin Shyam Research Associate Commodity & Energy Strategy ashwin.shyam@bcaresearch.com Commodities Round-Up Energy: Bullish OPEC 2.0 begins returning 2mm b/d to the market this month, expecting to be done by July. Half of these volumes are accounted for by Saudi Arabia, which voluntarily cut output by 1mm b/d earlier in the year to help balance the market. In line with our maintained hypothesis that OPEC 2.0 prefers prices inside the $60-$70/bbl price band, we expect the return of curtailed production to be front-loaded so as to bring prices down from current levels approaching $70/bbl for Brent (Chart 8). If, as we expect, demand recovers sooner than expected as Europe leans into its vaccination program, additional barrels will be returned to the market to get prices closer to a $60-$65/bbl range. Base Metals: Bullish The International Copper Study Group (ICSG) forecast copper mine production will increase by ~ 3.5% in 2021 and 3.7% in 2022, after adjusting for historical disruption factors. This forecasted increase – after three years of flat mined production growth – is due to a ramp-up of recently commissioned and new copper mines becoming operational in 2021. An improvement in the pandemic situation by 2022 will also boost mined copper production, according to the ICSG. 2020 production remained flat as recoveries in production in some countries due to constrained output in 2019 balanced the negative impacts of the pandemic in others. In Chile, the largest copper producer, state-owned Codelco and Collahuasi reported strong results in March. However, this was countered by a continued downturn at BHP’s Escondida. The world’s largest copper mine saw a drop in production for the eighth consecutive month. This mixed output resulted in a decline in total production of 1.2% year-on-year in March. Precious Metals: Bullish COMEX palladium touched a record high during intraday trading on Tuesday, reaching $3,019/oz due to continued tight market conditions (Chart 9). On the supply side, Nornickel is recovering from flooded mines, which occurred in February. By mid-April, one of the two affected mines was operating at 60% capacity; however, the company's other mine is only expected to come back online by early June. On the demand side, strength in US vehicle sales and a global economic recovery from the pandemic buoyed the metal used in catalytic converters. Palladium prices closed at $2,981.60/oz on Tuesday. Ags/Softs: Neutral Corn again traded above $7/bu earlier in the week on the back of drought-like dry weather conditions in Brazil's principal growing regions and surging US exports, according to Farm Futures. Chart 8
Brent Prices Going Up
Brent Prices Going Up
Chart 9
Palladium Prices Going Up
Palladium Prices Going Up
Footnotes 1 Stronger demand from China – where consumption is expected to rise more than 8% yoy – and EM Asia will continue to support LNG demand through the year. S&P Global Platts Analytics expects Chinese natural gas demand to reach 12,713 Bcf in 2021, up 8.4% from the previous year. Chinese national oil company Sinopec is slightly more conservative in its outlook, expecting gas demand of ~ 12,006-12,184 Bcf in 2021, up 6-8% from 2020. China’s average annual increase in natural gas demand is expected to exceed 716 Bcf in the 14th FYP and reach 15,185 Bcf in 2025. 2 Please see CIF Brent Benchmark? published 3 March 2021 by the Oxford Institute for Energy Studies for a discussion. 3 In Chart 3, we plot a rough measure of coal- vs natgas-fired generation economics for these fuels based on their average operating heat rates published by the EIA. We would note that a carbon tax would erase much of the benefit accruing to coal at this point in time. 4 Please see NOAA's Global Climate Report - March 2021. 5 Please see Low Rider - Corpus Christi's Ship Channel Dredging Will Streamline Crude Oil Exports published by RBN Energy 3 May 2021. 6 The OIES analysis cited above concludes, "… the volumes of the FOB deliverable crudes are diminishing and some change, bolstering the contract is certainly needed. The most likely compromise is to retain the existing FOB Brent with an inclusion of CIF WTI Midland assessment, netted back to an FOB equivalent North Sea value." We agree with this assessment. Please see CIF Brent Benchmark? published 3 March 2021 by the Oxford Institute for Energy Studies, p. 8. 7 Please see Is shale activity actually profitable? Size matters, says Rystad published 7 February 2019. Investment Views and Themes Strategic Recommendations Tactical Trades Commodity Prices and Plays Reference Table Trades Closed in 2021 Summary of Closed Trades
Higher Inflation On The Way
Higher Inflation On The Way
BCA Research’s European Investment Strategy service concludes that Swedish stocks possess significantly more upside against both Eurozone and US equities over the remainder of the cycle. The industrial sector is a particularly bright spot in the Swedish…
Highlights Sweden’s economic recovery is robust and will deepen. Policy is accommodative. Very few advanced economies will benefit as much from the global economic rebound. The labor market will tighten, capacity utilization will increase, and inflation will rise faster than the Riksbank forecasts. On a one- to two-year investment horizon, the SEK is a buy against both the USD and the EUR. Despite their pronounced outperformance, Swedish stocks possess significantly more upside against both Eurozone and US equities over the remainder of the cycle. Swedish industrials will beat their competitors in both these markets. Nonetheless, China’s policy tightening creates a meaningful tactical risk, which selling Norwegian stocks can hedge. Italy’s fiscal plan constitutes a new salvo in Europe’s efforts to avoid last decade’s mistakes. Feature Last week, the Swedish Riksbank did not follow in the footsteps of the Norges Bank. The Swedish central bank acknowledged that the economy is performing better than anticipated and that the housing market is gaining in strength; yet, it refrained from hinting at any forthcoming adjustment to its policy rate or the pace of its asset purchase program. The positive outlook for the Swedish economy will force the Riksbank to tighten policy significantly before the ECB. As a result, we expect the Swedish Krona to outperform the euro and the US dollar. Moreover, investors should continue to overweight Swedish equities due to their large exposure to industrials and financials, even if they have already significantly outperformed the Euro Area. Sweden’s Economic Outlook The Swedish economy will accelerate, which will put pressure on resource utilization and fan inflationary risk in the years ahead. The degree of stimulus supporting Sweden is consequential. Chart 1A Dual Labor Market
A Dual Labor Market
A Dual Labor Market
On the fiscal front, the government support measures that have been announced since the beginning of the COVID-19 crisis currently amount to SEK420bn, or SEK197bn for 2020 (4% of GDP), and SEK223bn for 2021 (4.5% of GDP). Moreover, generous labor market protection and part-time employment schemes meant that the number of employees in permanent employment contracts remained stable during the pandemic (Chart 1). Thus, the bulk of the rise in Swedish unemployment came from workers on fixed-term contracts. Monetary policy remains very accommodative as well. The Riksbank left its repo rate unchanged at 0% through the crisis, but cut its lending rate from 0.75% to 0.1%. More importantly, the Swedish central bank is aggressively injecting liquidity into the economy. It set up a SEK500bn funding-for-lending facility in order to incentivize bank lending to the nonfinancial private sector, and started a SEK700bn QE program, which as of Q1 2021 had purchased SEK380bn securities and which will purchase another SEK120bn in Q2, with covered bonds issued by banks accounting for 70% of it. As a result, the amount of securities held on the Riksbank balance sheet will nearly triple by year end (Chart 2). Chart 2The Riksbank Is Open For Business
Take A Chance On Sweden
Take A Chance On Sweden
Beyond the monetary and fiscal stimulus, many factors point to greater economic strength for Sweden. Despite a slow start to the process, as of last week, nearly 30% of the Swedish population had received at least one vaccine dose, which is broadly in line with vaccination rates prevalent in France or Germany. Crucially, the pace of vaccination is accelerating at a rate of 13% per week. Even if this second derivative slows, more than 70% of the population will have received at least one dose by this summer. Thus, greater mobility is in the cards during the second quarter, which will boost household spending. Chart 3The Wealth Effect
The Wealth Effect
The Wealth Effect
The housing market also favors a pick-up in consumption. The HOX housing price index is growing at a 15% annual rate, its fastest expansion in over 5 years. As a result of the wealth effect, this rapid appreciation is consistent with a swift improvement in the growth rate of household expenditures (Chart 3). Moreover, spending on durable goods now stands 1.3% above its pre-pandemic levels, while spending on non-durables is back to pre-pandemic levels. This context suggests that increased mobility translates into greater spending. The industrial sector remains a particularly bright spot in the Swedish economy. Sweden is extremely sensitive to the global industrial and trade cycle, because exports represent 45% of GDP. Moreover, the highly cyclical intermediate and capital goods comprise 56% of the country’s foreign shipments, which accentuates the beta of the Swedish economy. BCA Research remains optimistic about the global industrial cycle. Sweden will reap a significant dividend. Already the Swedish PMI points to stronger industrial production, and the index’s exports component is roaring ahead (Chart 4). The potential for a greater uptake in consumption, capex, and durable goods spending in the rest of the EU (Sweden’s largest trading partner) bodes well for the Swedish manufacturing sector. Additionally, if the collapse in the US inventory-to-sales ratio is any indication for the rest of the world, a global restocking cycle is forthcoming, which will further boost Swedish industrial activity (Chart 4, bottom panels). Finally, global public infrastructure plans are on the rise, which will also help Sweden. Chart 4Sweden Is well Placed
Sweden Is well Placed
Sweden Is well Placed
Chart 5Brightening Labor Market Prospects
Brightening Labor Market Prospects
Brightening Labor Market Prospects
In this context, the Swedish labor market should tighten significantly in the approaching quarters. Already, job vacancies are rebounding, and redundancy notices have normalized, which matches both the GDP growth surprise in Q1 and the continued rise in the NIER Sweden Economic Tendency Indicator. Furthermore, the employment component of the PMIs stands at 58.9 and is consistent with a sharp improvement in job growth over the coming year (Chart 5). The expected labor market growth will contribute to an increase in capacity utilization, which will place upward pressure on wages and inflation. When the 12-month moving average of US and Eurozone imports rises, so does the Riksbank Resource Utilization Indicator, because global trade has such a pronounced effect on the Swedish economy (Chart 6). Meanwhile, greater resource utilization leads to accelerated inflation, greater labor shortages, and rising unit labor costs (Chart 7). Chart 6CAPU Will Rise
CAPU Will Rise
CAPU Will Rise
Chart 7The Coming Pressure Buildup
The Coming Pressure Buildup
The Coming Pressure Buildup
Bottom Line: As a result of generous stimulus and the global economic recovery, the Swedish economy is set to continue its rebound. Consequently, employment and capacity utilization will improve meaningfully, which will lead to a resurgence of inflation and wages in the coming 24 months. Investment Implications On a 12 to 24 months horizon, we remain positive on the Swedish krona and Swedish equities. Fixed Income And FX Chart 8Three Hikes By 2025
Three Hikes By 2025
Three Hikes By 2025
The backend of the Swedish OIS curve only discounts 75bps of hikes by 2025. This pricing is too modest (Chart 8). The Swedish economy will rebound further as the vaccination campaign advances, and rising house prices and household indebtedness will fan growing long-term risk to financial stability, both of which suggest that the Riksbank will have to change its tack in 2022. The great likelihood that the Fed will start tapering off its asset purchase toward the end this year, that the ECB will follow sometime in 2022, and that the Norges Bank will be increasing interest rates next year will give more leeway to the Swedish central bank. A wider Sweden/Germany 10-year government bond spread is not an appealing vehicle to play a more hawkish Riksbank down the road. This spread hit a 23-year high in March and now rests at 62bps or its 98th percentile since 2000. Moreover, the terminal rate proxy embedded in the German money market curve is currently so low that the spread between Sweden’s and the Eurozone’s terminal rate proxy stands near a record high. Hence, German yields already embed much more pessimism than Swedish ones. Nonetheless, BCA recommends a below benchmark duration exposure within the Swedish fixed-income space, as we do for other government bond markets around the world.1 A bullish bias toward the SEK is a bet on the Riksbank that offers a very appealing risk/reward ratio, according to BCA Research’s Foreign Exchange Strategy strategists.2 The krona is very cheap against both the euro and the US dollar, trading at 9% and 29% discounts to purchasing power parity, respectively. Moreover, the Swedish current account stands at 5.2% of GDP, compared to 2.3% and -3.1% for the Euro Area and the US, creating a natural underpinning under the SEK. Chart 9The SEK Loves Growth
The SEK Loves Growth
The SEK Loves Growth
Over the coming 12 to 24 months, cyclical forces favor selling EUR/SEK and USD/SEK on any strength. The SEK is one of the most cyclical G-10 currencies and has one of the strongest sensitivities to the US dollar. Hence, our positive global economic outlook and our FX strategists negative view on the greenback are synonymous with a weak USD/SEK. These same factors also mean that the krona will appreciate more than the euro, as the negative correlation between EUR/SEK and our Boom/Bust Indicator and global earnings growth illustrate (Chart 9). Equities We also like Swedish equities, but the state of the Swedish economy and the evolution of the Riksbank policy surprise have a limited impact on Swedish equities. The Swedish bourse is mostly about the evolution of the global business cycle. The Swedish benchmark heightened sensitivity to the global business cycle reflects its massive overweight in deep cyclicals, with industrials, financials, consumer discretionary, and materials accounting for 38.4%, 26.1%, 9.7% and 3.7% of the MSCI index respectively, or 78% altogether (Table 1). As a result, BCA’s preference for global cyclicals at the expense of defensives and this publication’s fondness for the recovery laggards like the industrial and financial sectors automatically translate into a favorable bias toward Sweden’s stocks.3 Table 1Mamma Mia! That’s A Lot Of Cyclicals
Take A Chance On Sweden
Take A Chance On Sweden
Valuations offer a more complex picture, but they do not diminish our predilection for Sweden. Swedish equities trade at a discount to US stocks but at a premium to Euro Area ones (Chart 10). However, Swedish stocks offer higher RoEs and profit margins than both the US and the Euro Area, while also sporting lower leverage (Chart 11). Thus, their valuation premium to Euro Area stocks is warranted and their discount to US ones is excessive, especially when rising yields hurt the relative performance of the growth stocks that dominate US indexes. Chart 10Swedish Discounts And Premia
Swedish Discounts And Premia
Swedish Discounts And Premia
Chart 11Profitable Sweden
Profitable Sweden
Profitable Sweden
The outlook for Swedish earnings is appealing, both in absolute and relative terms. The Swedish market’s extreme sensitivity to global economic activity means that Sweden’s EPS increase and beat US profits when the Riksbank Resource Utilization Indicator expands (Chart 12). These relationships are artefacts of the Swedish economy’s pro-cyclicality, which causes capacity utilization to interweave tightly with the global business cycle (Chart 6). Chart 12The Winner Takes It All
The Winner Takes It All
The Winner Takes It All
Chart 13Better Capex Play Than You
Better Capex Play Than You
Better Capex Play Than You
Global capex and infrastructure spending favor Swedish equities compared to Euro Area ones. Over the past thirty years, Sweden’s stocks have outperformed those of the Eurozone when capital goods orders in the advanced economies have expanded (Chart 13). This reflects the Swedish benchmark’s large overweight in industrials, a sector that is the prime beneficiary of global capex. Capital goods orders are recovering well, and their growth rate can climb higher, especially as western multinationals announce capex plans and as governments from the US to Italy intend to ramp up infrastructure spending. Moreover, the large pent-up demand for durable goods in the Eurozone further enhances the potential of industrial firms, and thus, of Swedish equities.4 Chart 14Another Sign Of Pro-Cyclicality
Another Sign Of Pro-Cyclicality
Another Sign Of Pro-Cyclicality
BCA Research’s positive cyclical stance on commodities offers another reason to overweight Sweden’s market relative to that of the US and the Euro Area. Our Commodity and Energy Strategy sister service anticipates significant further upside for natural resources, especially base metals, over the remainder of the business cycle.5 Commodity prices still have room to rally, because demand will grow as the global economy continues to recover and because the supply of natural resources has been constrained by a decade of low investment. As a result, rising metal prices will symptomatize strong economic activity around the world and will incentivize capex in commodity extraction, both of which will boost the revenue of industrial firms. Furthermore, commodity price inflation often corresponds with rising yields, which boosts financials as well. These relationships explain the Swedish stocks’ outperformance of US and Eurozone stocks, when natural resource prices rally, despite the former’s low exposure to materials (Chart 14). At the sector level, the appeal of Swedish industrials relative to those of the Eurozone and the US completes the rationale to favor Swedish equities in a global portfolio. Swedish industrials are just as profitable as US ones and are more so than Euro Area ones, while having significantly lower leverage than either of them (Chart 15). Additionally, for the past two years, the EPS growth of Swedish industrials has bested that of US and Eurozone ones. Yet, their forward P/E ratio trades in line with the US and the Euro Area, while the sell-side’s long-term relative earnings growth estimate is too depressed (Chart 16). The same observations are valid when comparing Swedish industrials to French or German ones. Hence, in the context of a global business cycle upswing, buying Swedish industrials while selling their US and Euro Area competitors is an appealing pair trade, especially since it also involves short USD/SEK and short EUR/SEK bets. Chart 15Attractive Swedish Industrials...
Attractive Swedish Industrials...
Attractive Swedish Industrials...
Chart 16...And Not Expensive
...And Not Expensive
...And Not Expensive
Despite our optimism toward Swedish stocks on a 12 to 24 months basis, investors must hedge a near-term risk. Chinese authorities are aiming to contain financial excesses and trying to restrain credit growth. As we showed four weeks ago, China’s excess reserve ratio is contracting, which points toward a slowdown in the Chinese credit impulse.6 Historically, such a development can hurt global cyclicals, and thus, also Swedish equities. However, BCA Research’s China strategists believe that Beijing will not kill off the Chinese business cycle; thus, the recent disappointment in the Chinese PMI is transitory.7 Chart 17Industrials vs Materials: Europe vs China
Industrials vs Materials: Europe vs China
Industrials vs Materials: Europe vs China
Materials more than industrials will suffer the brunt of a China slowdown, as the re-opening trade and capex cycle among advanced economies will create a buffer for the latter. Indeed, the performance of global industrials relative to materials stocks correlates with the evolution of the spread between the Euro Area and Chinese PMI (Chart 17). Thus, we recommend selling Norwegian equities to hedge the tactical risk inherent in an overweight on Sweden. As Table 1 above shows, Norway overweighs materials and energy (two sectors greatly exposed to China), hence, a temporary pullback in commodity prices should hurt Norwegian stocks more than Swedish ones. Bottom Line: The SEK is an inexpensive and attractive vehicle to bet on both the global business cycle strength and the Swedish economic recovery. Thus, investors should use any rebound in EUR/SEK and USD/SEK to sell these pairs. Moreover, Swedish stocks greatly overweight cyclical sectors, particularly industrials and materials. This sectoral profile renders Swedish equities as attractive bets on the global economy. Additionally, Swedish shares display alluring operating metrics. As a result, we recommend investors go long Swedish industrials relative to those of the US and Euro Area. They should also overweight Swedish equities against the US and the Eurozone. Consequent to some China-related tactical risks, an underweight stance on Norwegian stocks constitutes an attractive hedge to this Swedish exposure. A Few Words On Italy’s National Recovery And Resilience Plan Mario Draghi’s plan to revive the Italian economy, announced last week, is an important marker of Europe’s changing relationship with fiscal policy. Last decade, excessive austerity contributed to subpar growth, ultimately firing up concerns about debt sustainability in many peripheral economies, and fueled risk premia in Italy and Spain. Under the cover of the current crisis, and in the face of the changing political winds in Brussel and Berlin where fiscal rectitude is not the mantra it once was, national European governments are beginning to propose ambitious fiscal stimulus plans. The National Recovery and Resilience program illustrates these dynamics. The EUR248bn plan is a testament to the importance of the NGEU recovery program as well as the REACT EU recovery fund. Through these facilities, the EU will contribute EUR191.5bn to the fiscal plan via grants and loans. Italy will contribute the remainder of the funds. While the total amount disbursed over the next six years corresponds to 14% of Italy’s 2019 GDP, the Draghi government estimates that the program will add 3.2 percentage points to GDP between 2024 and 2026. Importantly, markets are not rebelling. Despite expectations that Italy would continue to run an accommodative fiscal policy, the BTP/Bund spreads remain stable. We can expect this trend of greater stimulus to be mimicked around the EU. Spain is another large recipient of the NGEU program, and it too is likely to increase stimulus beyond what the EU will fund. France will hold an election in May 2022, and President Macron has all the incentives to stimulate the economy between now and then. If, as we wrote last week, Germany shifts to the left in September, then this outcome will be guaranteed. Bottom Line: The Draghi plan is the first salvo of greater fiscal stimulus in the EU. This trend will help Eurozone growth improve relative to the US over the coming few years. Despite a loose fiscal policy, BTPs and other peripheral bonds will continue to outperform on the back of declining risk premia. Mathieu Savary, Chief European Investment Strategist Mathieu@bcaresearch.com Footnotes 1Please see Global Fixed Income Strategy “GFIS Model Bond Portfolio Q1/2021 Performance Review & Current Allocations: Grand Reopening,” dated April 6, 2021, available at gfis.bcaresearch.com 2Please see Foreign Exchange Strategy “2021 Key Views: Tradeable Themes,” dated December 4, 2020, available at fes.bcaresearch.com 3Please see European Investment Strategy “Summer Of ‘21,” dated March 22, 2021, available at eis.bcaresearch.com 4Please see European Investment Strategy “Winds Of Change: Germany Goes Green,” dated April 23, 2021, available at eis.bcaresearch.com 5Please see Commodity & Energy Strategy “Industrial Commodities Super-Cycle Or Bull Market?” dated March 4, 2021, available at ces.bcaresearch.com 6Please see European Investment Strategy “The Euro Dance: One Step Back, Two Steps Forward,” dated March 29, 2021, available at eis.bcaresearch.com 7Please see China Investment Strategy “National People’s Congress Sets Tone For 2021 Growth,” dated March 17, 2021, available at cis.bcaresearch.com Cyclical Recommendations Structural Recommendations Currency Performance
Take A Chance On Sweden
Take A Chance On Sweden
Fixed Income Performance Government Bonds
Take A Chance On Sweden
Take A Chance On Sweden
Corporate Bonds
Take A Chance On Sweden
Take A Chance On Sweden
Equity Performance Major Stock Indices
Take A Chance On Sweden
Take A Chance On Sweden
Geographic Performance
Take A Chance On Sweden
Take A Chance On Sweden
Sector Performance
Take A Chance On Sweden
Take A Chance On Sweden
Closed Trades
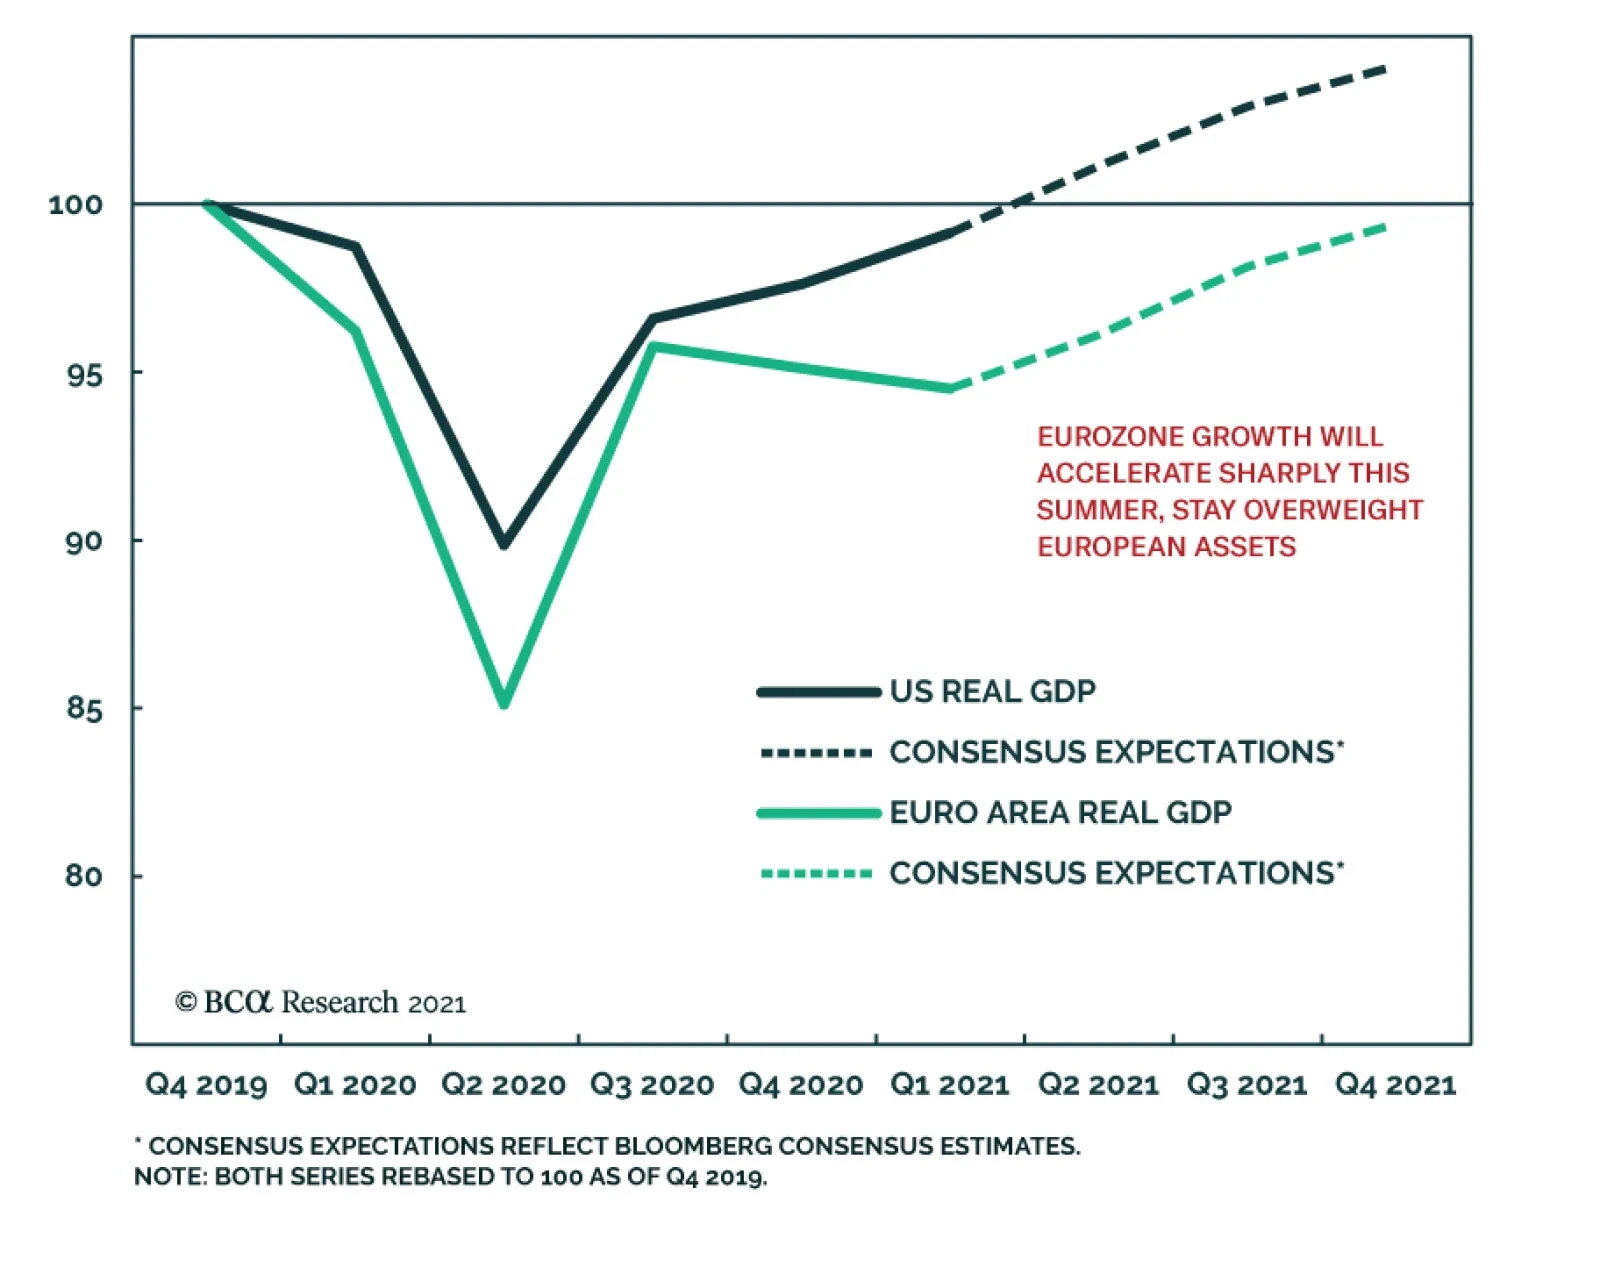
As expected, the pandemic pushed the Eurozone economy into a double-dip recession. The bloc’s GDP contracted 0.6% in Q1 following a 0.7% decline in Q4. However, the aggregate number masks some differences beneath the surface. The German and Spanish economies…