Europe

Highlights The Swiss economy will benefit from the pickup in global growth. The recent weakness in the franc has been a welcome development for the Swiss National Bank, but technicals suggest a coiled spring rally in CHF is likely. However, as a low-beta currency, the Swiss franc will lag the upturn in other pro-cyclical currencies over the longer term. We remain long EUR/CHF as a tactical trade but maintain tight stops at 1.095. Long CHF/NZD and CHF/GBP positions look attractive at current levels. Similar to our short EUR/JPY position, this is an excellent portfolio hedge. Feature Chart I-1The Swiss Economy Is On The Mend
The Swiss Economy Is On The Mend
The Swiss Economy Is On The Mend
The Swiss economy has recovered smartly. As of March, the manufacturing PMI was at 66.3, the highest since 2006. If past manufacturing sentiment is prologue, the Swiss economy is about to experience its biggest rebound in decades (Chart I-1). This will quell any deflationary fears about domestic conditions in Switzerland and begin to re-anchor inflation expectations upwards. This will also be a very welcome development for the SNB. The Swiss franc has been one of the worst performing currencies this year, but that might be about to change. For one, dollar sentiment has been reset with the rise in the DXY index this year. Second, the global economy is transitioning from disinflationary to a gentle tilt towards inflation. This will lift global prices, including import prices into Switzerland. Rising import prices will ease the need for the SNB to maintain emergency monetary settings. Finally, the weakness in the currency has eased financial conditions for Swiss concerns. The Reopening Trade Most economies are entering into a third wave of the Covid-19 pandemic and the Swiss economy is no exception. However, the Swiss authorities have been able to bring the number of new infections down to levels below the euro area in general and Sweden in particular. Vaccinations are progressing smoothly with almost 20% of the population inoculated as of today. This provides a coiled springboard to lift the Swiss economy into robust growth later this year. Switzerland is one of the most open economies in the G10. Exports of goods and services account for over 65% of Swiss GDP, much higher than the euro area (Chart I-2). The constituent of Swiss exports tends to be defensive (medical goods, gold, watches, jewelry) so the franc does not necessarily outperform in a global growth upswing, but definitely does better than the dollar which anchors a more closed economy. Inflation dynamics in Switzerland will be particularly beholden to improvement in the private sector. As we show in Chart I-1, employment should remain robust in the months ahead, which will support wages. Import prices in Switzerland are also about to catapult upwards, which will help lift the consumer price basket (Chart I-3). For a small, open economy like Switzerland, the exchange rate often dictates the trend in domestic inflation, and the weakness in the franc has been a beneficial cushion for good prices. The rise in global tradeable prices is also acting as a catalyst. For the first time in many years, the pendulum might be swinging towards a worry about inflation in SNB corridors. Chart I-2Switzerland Has A Huge Exposure To Trade
Switzerland Has A Huge Exposure To Trade
Switzerland Has A Huge Exposure To Trade
Chart I-3Swiss Inflation Will Rise
Swiss Inflation Will Rise
Swiss Inflation Will Rise
Particularly, a rise in Swiss inflation will lessen the need for the SNB to keep rates at the -0.75 level in place for over half a decade. It will also lessen to need for the SNB to fight against franc strength. Global Developments In A CHF Context There are some additional tailwinds to a strong CHF in today’s context. Volatility has collapsed, with the VIX index well below 20. If one could predict with absolute certainty what will happen with global growth, equity prices, bond yields, or even Covid-19, then low volatility makes sense. However, in the current context of elevated valuations, high uncertainty and a precarious health landscape, it almost makes perfect sense that volatility should rise. The franc tends to do well in an environment where volatility is rising (Chart I-4). Chart I-4The Swiss Franc Tracks The VIX
The Swiss Franc Tracks The VIX
The Swiss Franc Tracks The VIX
Chart I-5Long-Term Support On CHF/NZD Has Held
Long-Term Support On CHF/NZD Has Held
Long-Term Support On CHF/NZD Has Held
In fact, from a broad picture perspective, a rotation from US growth outperformance to other parts of the globe that are also stimulating their domestic economies could be met with higher dollar volatility. This has historically been beneficial for the Swiss franc (Chart I-6). Ergo, being long the franc could constitute a “heads, I win; tails I do not lose too much” proposition. Rising global growth and a lower dollar will help the franc, but so will a rise in volatility. Chart I-6CHF/NZD Tracks Dollar Volatility
CHF/NZD Tracks Dollar Volatility
CHF/NZD Tracks Dollar Volatility
Our Geopolitical Strategy team has also been recommending long Swiss franc positions since February as they believe the Biden administration faces several imminent and serious foreign policy tests, namely over Russia’s military buildup on the Ukraine border, China’s military pressure tactics against Taiwan, and Middle East tensions ahead of any revived US-Iran nuclear deal. They see a 60% chance of some kind of crisis – if not war – over the Taiwan Strait and any of these other issues could also motivate safe haven demand for the rest of this year. With regard to CHF/GBP, an upside surprise for the Scottish National Party in the May 6 parliamentary election could also hurt the pound since it would herald a second Scots independence referendum in the not-too-distant future. Trading Dynamics As A Safe Haven Chart I-7CHF And The Copper/Gold Ratio
CHF AND THE COPPER/GOLD RATIO
CHF AND THE COPPER/GOLD RATIO
Switzerland ticks off all the characteristics of a safe-haven currency. Its large net international investment position of over 100% of GDP generates huge income inflows. Meanwhile, rising productivity over the years has led to a structural surplus in its trading balance and a rising fair value for the currency. Consequently, the franc has tended to have an upward bias over the years, supercharged during periods of risk aversion. This makes the franc a useful constituent of any currency portfolio. More specifically, the franc has tracked the gold-to-copper ratio in recent years. Copper is a good barometer for global economic health while gold is a good proxy for the demand for safety. If the overarching theme is that complacency reigns across markets, a nudge towards safety will benefit flows into the franc (Chart I-7). The current interest-rate regime could also affect the franc-dollar relationship. Global yields have risen. To the extent that we are due for some reprieve, the franc will benefit, given its “low beta” status. Meanwhile, net portfolio flows into Switzerland suffered from the Trump tax cuts that pushed US affiliates in Switzerland to repatriate investments. President Biden’s tax reform will halt and/or reverse this process. SNB Action And Market Implications The past weakness in the franc has been a welcome development for the SNB. In fact, since the start of this year, Swiss central bankers have not had to ramp up asset purchases. Both the dollar and the euro have been relatively strong (Chart I-8). In other words, global dynamics have eased monetary conditions for the Swiss authorities. The latest Article IV report from the IMF also justifies the SNB’s monetary stance. Currency intervention was cited as a viable tool should the SNB do a policy review, especially given the potential inefficacies from QE due to the small bond market in Switzerland. Herein lies the key takeaway for the franc – while it could appreciate in an environment where the dollar resumes its downtrend, it will likely lag other pro cyclical currencies over the longer term. This is because the SNB will be loath to see the franc unanchor inflation expectations. We are long EUR/CHF on this basis, but are keeping tight stops at 1.095. Three key factors suggest this trade could still work well in the coming 12-18 months. Rising interest rates benefit EUR/CHF (Chart I-9). With interest rates in Switzerland well below other countries, the Swiss franc rapidly becomes a funding currency for carry trades. Carry trades, especially towards peripheral bonds in Europe hurt the franc. Chart I-8A Weaker Franc Is Doing The Heavy Lifting For The SNB
A Weaker Franc Is Doing The Heavy Lifting For The SNB
A Weaker Franc Is Doing The Heavy Lifting For The SNB
Chart I-9EUR/CHF Tracks German ##br## Yields
EUR/CHF Tracks German Yields
EUR/CHF Tracks German Yields
The Swiss trade balance has suffered in the face of a global slowdown. It will also lag the European rebound (Chart I-10). In a downturn, commoditized goods prices are the first to drop and recover, while more specialized goods prices eventually gain ground later. Swiss goods are not easily substitutable which is a benefit, but prices are also slower to adjust. Our models suggest the franc is still about 5% overvalued versus the euro. Over the history of the model, this has been a modest premium, but allows the euro to outperform the Swiss franc (Chart I-11). Chart I-10Structural Appreciation In The Swiss Franc
Structural Appreciation In The Swiss Franc
Structural Appreciation In The Swiss Franc
Chart I-11EUR/CHF Is Still Cheap
EUR/CHF Is Still Cheap
EUR/CHF Is Still Cheap
Economically, the SNB has to walk a fine line between a predominantly deflationary backdrop in Switzerland and a rising debt-to-GDP ratio that pins it among the highest in the G10 (Chart I-12). Too little stimulus and the economy runs the risk of entering a debt-deflation spiral, as inflation expectations are revised downwards. Too much stimulus and the result will be a build-up of imbalances, leading to an eventual bust. Chart I-12Lots Of Private Debt In Switzerland
Lots Of Private Debt In Switzerland
Lots Of Private Debt In Switzerland
Today, the SNB is in a sweet spot. Almost every other G10 country is providing the fiscal and monetary stimulus necessary to lift Switzerland from its deflationary paradigm. Investment Conclusions Chart I-13Structural Appreciation In The Franc Still Possible
Structural Appreciation In The Franc Still Possible
Structural Appreciation In The Franc Still Possible
Our long-term fair value models suggest the Swiss franc is currently cheap versus the dollar (Chart I-13). This makes it attractive from a strategic perspective. Usually, the Swiss franc tends to be more of a dormant currency, gently appreciating towards fair value but periodically interspersed with bouts of intense volatility. Interestingly, we may be entering such a riot point. The VIX is low and countries are reintroducing lockdowns, yet overall sentiment remains unequivocally bullish. Finally, Switzerland ticks off all the characteristics of a safe-haven currency. As such, while the dollar has benefited from its reserve status, the franc remains an appropriate hedge in any currency portfolio. In a nutshell, our recommendations are as follows: USD/CHF will stay under parity. EUR/CHF can hit 1.2. NZD/CHF is a sell in the short-term. So is GBP/CHF. The Scandinavian currencies will outperform the franc on a 12-18 month horizon. Chester Ntonifor Foreign Exchange Strategist chestern@bcaresearch.com Currencies U.S. Dollar Chart II-1USD Technicals 1
USD Technicals 1
USD Technicals 1
Chart II-2USD Technicals 2
USD Technicals 2
USD Technicals 2
US economic data has been spectacular this week: Starting with the jobs report, the US added 916K jobs in March versus a consensus of 660K jobs. The unemployment rate fell from 6.2% to 6% and wages increased by 4.2% year-on-year. The boost to domestic demand dented the trade balance. The deficit widened from $68.2bn to $71.1bn in February. The FOMC minutes were a non event for markets. The DXY index is giving back some of the gains it accumulated this year, rising over 1% this week. With the US 10-year yield now facing strong resistance near the 1.7% level, the case for a stronger USD is fading. As consensus forecasts coagulate towards a stronger USD, positioning has also been reset towards USD long positions auguring for some volatility in the months ahead. Report Links: Arbitrating Between Dollar Bulls And Bears - March 19, 2021 The Dollar Bull Case Will Soon Fade - March 5, 2021 Are Rising Bond Yields Bullish For The Dollar? - February 19, 2021 The Euro Chart II-3EUR Technicals 1
EUR Technicals 1
EUR Technicals 1
Chart II-4EUR Technicals 2
EUR Technicals 2
EUR Technicals 2
Recent data from the euro area are mending: The Sentix investor index catapulted from 5 to 13.1 in April. The Eurozone remains the unsung hero in this recovery. PPI increased to 1.5% year-on-year in February from 0% last month. The euro rose by 1.2% against the dollar this week. To be clear, there are still stale euro longs among more fundamental holders of the currency. This suggests the flushing out of weak hands has more to go. However, the balance of evidence suggests euro area data could reward long positions later this year. Report Links: Portfolio And Model Review - February 5, 2021 On Japanese Inflation And The Yen - January 29, 2021 The Dollar Conundrum And Protection - November 6, 2020 Japanese Yen Chart II-5JPY Technicals 1
JPY Technicals 1
JPY Technicals 1
Chart II-6JPY Technicals 2
JPY Technicals 2
JPY Technicals 2
Recent data from Japan has been improving: PMI indices remain under 50, but reflect a possible coiled-spring rebound underway. Consumer confidence rebounded from 33.8 to 36.1 in March. The Eco Watchers survey was also encouraging. Sentiment rebounded from 41.3 to 49 in March. The Japanese yen rose by 1.24% against the US dollar this week, and remains the strongest G10 currency in recent trading days. Falling yields have seen Japanese investors retreat from overseas markets such as the UK, pushing up the yen. Speculative positioning is also net yen bearish, which is constructive from a contrarian standpoint. Report Links: The Dollar Bull Case Will Soon Fade - March 5, 2021 On Japanese Inflation And The Yen - January 29, 2021 The Dollar Conundrum And Protection - November 6, 2020 British Pound Chart II-7GBP Technicals 1
GBP Technicals 1
GBP Technicals 1
Chart II-8GBP Technicals 2
GBP Technicals 2
GBP Technicals 2
Recent data out of the UK have been positive: Car registrations are picking up smartly, suggesting durable demand might be returning to the UK. Registrations rose 11.5% year-on-year in March versus -35.5% the year before. The UK construction PMI hit a high of 61.7, the highest since 2014. The pound fell by almost 2% versus the euro this week. The violent correction in EURGBP might be a harbinger of the rotation brewing for both UK and US assets versus their global counterparts. Stay tuned. Report Links: Portfolio And Model Review - February 5, 2021 The Dollar Conundrum And Protection - November 6, 2020 Revisiting Our High-Conviction Trades - September 11, 2020 Australian Dollar Chart II-9AUD Technicals 1
AUD Technicals 1
AUD Technicals 1
Chart II-10AUD Technicals 2
AUD Technicals 2
AUD Technicals 2
Recent data in Australia was robust: The RBA kept rates unchanged at 0.1%. Both the services and manufacturing PMIs remained at an expansionary 55.5 level. The Aussie rose by 0.4% this week. We like the AUD, and are long AUD/NZD as a trade. However, the outperformance of the US economy is also handsomely rewarding AUD/MXN shorts. Mexico benefits a lot more from a pick-up in the US economy than Australia. Report Links: The Dollar Bull Case Will Soon Fade - March 5, 2021 Portfolio And Model Review - February 5, 2021 Australia: Regime Change For Bond Yields & The Currency? - January 20, 2021 New Zealand Dollar Chart II-11NZD Technicals 1
NZD Technicals 1
NZD Technicals 1
Chart II-12NZD Technicals 2
NZD Technicals 2
NZD Technicals 2
Recent data out of New Zealand have been positive: The ANZ commodity price index ticked up by 6.1% in March. ANZ Business confidence deteriorated in March. The activity outlook fell from 16.6 to 16.4 and confidence fell from -4.1 to -8.4. The New Zealand dollar rose by 60bps against the US dollar this week. New Zealand will start taking the back seat in the coming economic rotation as other economies play catch up. The improvement in kiwi terms of trade has been a boon for the currency, and will limit downside on NZD. However, shorting the NZD at the crosses remains an attractive proposition. Report Links: Portfolio And Model Review - February 5, 2021 Currencies And The Value-Versus-Growth Debate - July 10, 2020 Updating Our Balance Of Payments Monitor - November 29, 2019 Canadian Dollar Chart II-13CAD Technicals 1
CAD Technicals 1
CAD Technicals 1
Chart II-14CAD Technicals 2
CAD Technicals 2
CAD Technicals 2
There was scant data out of Canada this week: The Bloomberg Nanos confidence index continues to suggest that Canadian GDP will surprise to the upside. The index rose from 63.7 to 64.1 last week. Demand for Canadian goods remains robust. The trade surplus came in at C$1.04bn in February. The Ivey purchasing managers’ index catapulted to 72.9 from 60 in March. The Canadian dollar was flat against the US dollar this week. While this might come as a surprise, three reasons explain this performance. First, the loonie is one of the best-performing G10 currencies this year and some specter of rotation was in play this week. Second, the correction in oil prices hurt the loonie. Finally, should US economic optimism become more widespread, other currencies could benefit. Report Links: Will The Canadian Recovery Lead Or Lag The Global Cycle? - February 12, 2021 Currencies And The Value-Versus-Growth Debate - July 10, 2020 More On Competitive Devaluations, The CAD And The SEK - May 1, 2020 Swiss Franc Chart II-15CHF Technicals 1
CHF Technicals 1
CHF Technicals 1
Chart II-16CHF Technicals 2
CHF Technicals 2
CHF Technicals 2
There was scant data out of Switzerland this week: Sight deposits were relatively flat at CHF700bn last week. The Swiss Franc rose by 2% against the US dollar this week. This week’s piece is dedicated to the possibility that the franc has a coiled-spring rebound in the near term. Safe-haven currencies are now benefitting from the drop in yields, while the franc has underperformed other currencies this year. This is welcome news for the SNB. We have been long EUR/CHF on this expectation, and recommend investors stick with this trade. Report Links: Portfolio And Model Review - February 5, 2021 The Dollar Conundrum And Protection - November 6, 2020 On The DXY Breakout, Euro, And Swiss Franc - February 21, 2020 Norwegian Krone Chart II-17NOK Technicals 1
NOK Technicals 1
NOK Technicals 1
Chart II-18NOK Technicals 2
NOK Technicals 2
NOK Technicals 2
There was scant data out of Norway this week: The March DNB manufacturing PMI came in at 56.1 from 57.5. Industrial production rose by 5.9% year-on-year versus expectations of a 1.5% increase. The NOK rose by 0.75% against the dollar this week. Norway has handled the Covid-19 crisis admirably and it is an added boon that oil prices, a key export and income valve for Norway, are rising smartly. This has prompted the Norges bank to rapidly bring forward rate hike expectations. This leaves little scope for the NOK to fall durably. We are long the Norwegian krone as a high-conviction bet against both the dollar and the euro. Report Links: Portfolio And Model Review - February 5, 2021 Revisiting Our High-Conviction Trades - September 11, 2020 A New Paradigm For Petrocurrencies - April 10, 2020 Swedish Krona Chart II-19SEK Technicals 1
SEK Technicals 1
SEK Technicals 1
Chart II-20SEK Technicals 2
SEK Technicals 2
SEK Technicals 2
Swedish data releases were above expectations: The Swedbank manufacturing PMI came in at 63.7 in March versus expectations of 62.5. Industrial orders came in at 8.5% year-on-year versus expectations of 5.3% in February. The Swedish krona rose by 2% this week ranking it as the best performing G10 currency. Sweden needs to do a better job at containing the Covid-19 crisis, which will unlock tremendous value in the krona. As a positive, the global manufacturing cycle continues humming and will buffeting Swedish industrial production. Report Links: Revisiting Our High-Conviction Trades - September 11, 2020 Updating Our Balance Of Payments Monitor - November 29, 2019 Where To Next For The US Dollar? - June 7, 2019 Trades & Forecasts Forecast Summary Core Portfolio Tactical Trades Limit Orders Closed Trades
Highlights Continued upgrades to global economic growth – most recently by the IMF this week –will support higher natgas prices. In our estimation, gas for delivery at Henry Hub, LA, in the coming withdrawal season (November – March) is undervalued at current levels at ~ $2.90/MMBtu. Inventory demand will remain strong during the current April-October injection season, following the blast of colder-than-normal weather in 1Q21 that pulled inventories lower in the US, Europe and Northeast Asia. The odds the US will succeed in halting completion of the final leg of the Russian Nord Stream 2 natural gas pipeline into Germany are higher than the consensus expectation. Our odds the pipeline will not be completed this year stand at 50%, which translates into higher upside risk for natural gas prices. We are getting long 1Q22 calls on CME/NYMEX Henry Hub-delivered natgas futures struck at $3.50/MMBtu vs. short 1Q22 $3.75/MMBtu calls at tonight's close. The probability of Nord Stream 2 cancellation is underpriced, which means European TTF and Asian JKM prices will have to move higher to attract LNG cargoes next winter from the US, if the pipeline is cancelled (Chart of the Week). Feature As major forecasting agencies continue to upgrade global growth prospects, expectations for industrial-commodity demand – energy, bulks, and base metals – also are moving higher. This week, the IMF raised its growth expectations for this year and next to 6% and 4.4%, respectively, nearly a full percentage-point increase versus its January forecast update for 2021.1 This upgrade follows a similar move by the OECD last month.2 In the US, the EIA is expecting industrial demand for natural gas to rise 1.35 Bcf/d this year to 23.9 Bcf/d; versus 2019 levels, industrial demand will be 0.84 Bcf/d higher in 2021. For 2022, industrial demand is expected to be 24.2 Bcf/d. US industrial demand likely will recover faster than the EU's, given the expectation of a stronger recovery on the back of massive fiscal and monetary stimulus. Overall natgas demand in the US likely will move lower this year, given higher natgas prices expected this year and next will incentivize electricity generators to switch to coal at the margin, according to the EIA. Total demand is expected to be 82.9 Bcf/d in the US this year vs. 83.3 Bcf/d last year, owing to lower generator demand. Pipeline-quality gas output in the US – known as dry gas, since its liquids have been removed for other uses – is expected to average 91.4 Bcf/d this year, essentially unchanged. Lower consumption by the generators and flat production will allow US gas inventories to return to their five-year average levels of 3.7 Tcf by the end of October, in the EIA's estimation (Chart 2). Chart of the WeekUS-Russia Geopolitical Risk Underpriced
US-Russia Pipeline Standoff Could Push LNG Prices Higher
US-Russia Pipeline Standoff Could Push LNG Prices Higher
Chart 2US Natgas Inventories Return To Five-Year Average
US-Russia Pipeline Standoff Could Push LNG Prices Higher
US-Russia Pipeline Standoff Could Push LNG Prices Higher
US Liquified Natural Gas (LNG) exports are likely to expand, as Asian and European demand grows (Chart 3). Prior to the boost in US LNG demand from colder weather, exports set monthly records of 9.4 Bcf/d and 9.8 Bcf/d in November and December of last year, respectively, with Asia accounting for the largest share of exports (Chart 4). This also marked the first time LNG exports exceeded US pipeline exports to Mexico and Canada. The EIA is forecasting US LNG exports will be 8.5 bcf/d and 9.2 Bcf/d this year and next, versus pipeline exports of 8.8 Bcf/d and 8.9 Bcf/d in 2021 and 2022, respectively. Chart 3US LNG Exports Continue Growing
US-Russia Pipeline Standoff Could Push LNG Prices Higher
US-Russia Pipeline Standoff Could Push LNG Prices Higher
Chart 4US LNG Exports Set Records In November And December 2020
US-Russia Pipeline Standoff Could Push LNG Prices Higher
US-Russia Pipeline Standoff Could Push LNG Prices Higher
US LNG exports – and export potential given the size of the resource base at just over 500 Tcf – now are of a sufficient magnitude to be a formidable force in global markets, particularly in Europe. This puts it in direct conflict with Russia, which has targeted Europe as a key market for its pipeline natural gas exports. US-Russia Standoff Looming Over Nord Stream 2 Given the size and distribution of global oil and gas production and consumption, it comes as no surprise national interests can, at times, become as important to pricing these commodities as supply-demand fundamentals. This is particularly true in oil, and increasingly is becoming the case in natural gas. That the same dramatis personae – the US and Russia – should feature in geopolitical contests in oil and gas markets also should not come as a surprise. In an attempt to circumvent transporting its natural gas through Ukraine, Russia is building a 1,230 km underwater pipeline from Narva Bay in the Kingisepp district of the Leningrad region of Russia to Lubmin, near Greifswald, in Germany (Map 1). The Biden administration, like the Trump administration and US Congress, is officially attempting to halt the final leg of the pipeline from being built, although Biden has not yet put America’s full weight into stopping it. Biden claims it will be up to the Europeans to decide what to do. At the same time, any major Russian or Russian-backed military operation in Ukraine could trigger an American action to halt the pipeline in retaliation. Map 1Nord Stream 2 Route
US-Russia Pipeline Standoff Could Push LNG Prices Higher
US-Russia Pipeline Standoff Could Push LNG Prices Higher
In our estimation, there is a 50% chance that the Nord Stream 2 natural gas pipeline will not be completed this year or go into operation as planned given substantial geopolitical risks. The $11 billion pipeline would connect Russia directly to Germany with a capacity of about 55 billion cubic meters, which, combined with the existing Nord Stream One pipeline, would equal 110 BCM in offshore capacity, or 55% of Russia's natural gas exports to Europe in 2019. The pipeline’s construction is 94% complete, with the Russian ship Akademik Cherskiy entering Danish waters in late March to begin laying pipes to finish the final 138-kilometer stretch, according to Reuters. The pipeline could be finished in early August at the pace of 1 kilometer per day.3 The Russian and German governments are speeding up the project to finish it before US-Russia tensions, or the German elections in September, interrupt the construction process again. It is not too late for the US to try to halt the pipeline through sanctions. But for the Americans to succeed, the Biden administration would have to make an aggressive effort. Notably the Biden administration took office with a desire to sharpen US policy toward Russia.4 While Biden seeks Russian engagement on arms reduction treaties and the Iranian nuclear negotiations, he mainly aims to counter Russia, expand sanctions, provide weapons to Ukraine, and promote democracy in Russia’s sphere of influence. The result will almost inevitably be a new US-Russia confrontation, which is already taking shape over Russia’s buildup of troops on the border with Ukraine, where US and Russian meddling could cause civil war to reignite (Map 2). Map 2Russia’s Military Tensions With The West Escalate In Wake Of Biden’s Election And Ukraine’s Renewed Bid To Join NATO
US-Russia Pipeline Standoff Could Push LNG Prices Higher
US-Russia Pipeline Standoff Could Push LNG Prices Higher
Tensions in Ukraine are directly tied to US military cooperation with Ukraine and any possibility that Ukraine will join the NATO military alliance, a red line for Putin. Nord Stream 2 is Russia’s way of bypassing Ukraine but a new US-Russia conflict, especially a Russian attack on Ukraine, would halt the pipeline. The pipeline’s completion would improve Russo-German strategic relations, undercut US liquefied natural gas exports to Germany and the EU, and reduce the US’s and eastern Europe’s leverage over Russia (and Germany). Biden says his administration is planning to impose new sanctions on firms that oversee, construct, or insure the pipeline, and such sanctions are required under American law.5 Yet Biden also wants a strong alliance with Germany, which favors the pipeline and does not want to escalate the conflict with Russia. The American laws against Nord Stream have big loopholes and give the president discretion regarding the use of sanctions, which means Biden would have to make a deliberate decision to override Germany and impose maximum sanctions if he truly wanted to halt construction.6 This would most likely occur if Russia committed a major new act of aggression in Ukraine or against other European democracies. The German policy, under the current ruling coalition led by Chancellor Angela Merkel’s Christian Democratic Union, is to finish the pipeline despite Russia’s conflicts with the West and political repression at home. Russia provides more than a third of Germany’s natural gas imports and this pipeline would bypass eastern Europe’s pipeline network and thus secure Germany’s (and Austria’s and the EU’s) natural gas supply whenever Russia cuts off the flow to Ukraine (through which roughly 40% of Russian natural gas still must pass to reach Europe). Germany's Election And Natgas Politics Germany wants to use natural gas as a bridge while it phases out nuclear energy and coal. Natural gas has grown 2.2 percentage points as a share of Germany’s total energy mix since the Fukushima disaster of 2011, and renewable energy has grown 7.7ppt, while coal has fallen 7.3ppt and nuclear has fallen 2.5ppt (Chart 5). The German federal election on September 26 complicates matters because Merkel and the Christian Democrats are likely to underperform their opinion polls and could even fall from power. They do not want to suffer a major foreign policy humiliation at the hands of the Americans or a strategic crisis with Russia right before the election. They will insist that Biden leave the pipeline alone and will offer other forms of cooperation against Russia in compensation. Therefore, the current German government could push through the pipeline and complete the project even in the face of US objections. But this outcome is not guaranteed. The German Greens are likely to gain influence in the Bundestag after the elections and could even lead the German government for the first time – and they are opposed to a new fossil fuel pipeline that increases Russia’s influence. Chart 5Germany Sees Nord Stream 2 Gas As Bridge To Low-Carbon Economy
US-Russia Pipeline Standoff Could Push LNG Prices Higher
US-Russia Pipeline Standoff Could Push LNG Prices Higher
Hence there is a fair chance that the pipeline does not become operational: either Americans halt it out of strategic interest, or the German Greens halt it out of environmental and strategic interest, or both. True, there is a roughly equal chance that Merkel’s policy status quo survives in Germany, which would result in an operational pipeline. The best case for Germany might be that the current government completes the pipeline physically but the next government has optionality on whether to make it operational. But 50/50 odds of cancellation is a much higher risk than the consensus holds. The Russian policy is to finish Nord Stream 2 while also making an aggressive military stance against the West’s and NATO’s influence in Ukraine. This would expand Russian commodity and energy exports and undercut Ukraine’s natgas transit income. It would also increase Russian leverage over Germany – and it would divide Germany from the eastern Europeans and Americans. A preemptive American intervention would elicit Russian retaliation. The Russians could respond in the strategic sphere or the economic sphere. Economically they could react by cutting off natural gas to Europe, but that would undermine their diplomatic goals, so they would more likely respond by increasing production of natural gas or crude oil to steal American market share. In any scenario Russian retaliation would likely cause global price volatility in one or more energy markets, in addition to whatever volatility is induced by the cancellation of Nord Stream 2 itself. US-Russia tensions are likely to escalate but only Ukraine and Nord Stream 2, or the separate Iranian negotiations, have a direct impact on global energy supply. If Germany goes forward with the pipeline, then Russia would need to be countered by other means. The Americans, not the Germans, would provide these “other means,” such as military support to ensure the integrity of Ukraine and other nations’ borders. The Russians may gain a victory for their energy export strategy but they will never compromise on Ukraine and they will still need to focus on the broader global shift to renewable energy, which threatens their economic model and hence ultimately their regime stability. So, the risk of a market-moving US-Russia conflict can be delayed but probably not prevented (Chart 6). Chart 6US-Russia Conflit Likely
US-Russia Conflit Likely
US-Russia Conflit Likely
Bottom Line: The Nord Stream 2 pipeline is not guaranteed to be completed this year as planned. The US is more likely to force a halt to the Nord Stream 2 pipeline than the consensus holds, especially if Russia attacks Ukraine. If the US fails to do so, then the German election will become the next signpost for whether the pipeline will become operational. If the Americans halt the pipeline, then US-Russian conflict either already erupted or will occur sooner rather than later and will likely impact global oil or natural gas prices. Investment Implications Our subjective assessment of 50% odds the US will succeed in halting completion of the final leg of Nord Stream 2 are higher than the consensus expectation. This translates directly into higher upside risk for natural gas prices in the US and Europe later this year and next. Given our view, we are getting long 1Q22 calls on CME/NYMEX Henry Hub-delivered natgas futures struck at $3.50/MMBtu vs. short 1Q22 $3.75/MMBtu calls at tonight's close. The probability of Nord Stream 2 cancellation is underpriced, which means the odds of higher prices in the LNG market are underpriced (Chart 7). The immediate implication of our view is European TTF prices will have to move higher to attract LNG cargoes next winter from the US, if the Nord Stream 2 pipeline's final leg is cancelled. This also would tighten the Asian markets, causing the JKM to move higher as well (Chart 8). Any indication of colder-than-normal weather in the US, Europe or Asian markets would mean a sharper move higher. Chart 7Natgas Tails Are Too Narrow For Next Winter
US-Russia Pipeline Standoff Could Push LNG Prices Higher
US-Russia Pipeline Standoff Could Push LNG Prices Higher
Chart 8Nord Stream 2 Cancellation Would Boost JKM Prices
Nord Stream 2 Cancellation Would Boost JKM Prices
Nord Stream 2 Cancellation Would Boost JKM Prices
Robert P. Ryan Chief Commodity & Energy Strategist rryan@bcaresearch.com Matt Gertken Vice President Geopolitical Strategy mattg@bcaresearch.com Commodities Round-Up Energy: Bullish The US and Iran began indirect talks earlier this week in Vienna aimed at restoring the Joint Comprehensive Plan of Action (JCPOA), otherwise known as the "Iran nuclear deal." All of the other parties of the deal – Britain, China, France, Germany and Russia – are in favor of restoring the deal. BCA Research believes this is most likely to occur prior to the inauguration of a new president who is expected to be a hardliner willing to escalate Iran’s demands. US President Biden can unilaterally ease sanctions and bring the US into compliance with the deal, and Iran could then reciprocate. If a deal is not reached by August it could take years to resolve US-Iran tensions. China could offer to cooperate on sanctions and help to broker negotiations following the signing of its 25-year trade deal with Iran last week. Russia likely would demand the US not pressure its allies to cancel the Nord Stream 2 deal, in return for its assistance in brokering a deal. Base Metals: Bullish Iron ore prices continue to be supported by record steel prices in China, trading at more than $173/MT earlier this week. Even though steel production reportedly is falling in the top steel-producer in China, Tangshan, as a result of anti-pollution measures, for iron ore remains stout. As we have previously noted, we use steel prices as a leading indicator for copper prices. We remain long Dec21 copper and will be looking for a sell-off to get long Sep21 copper vs. short Sep21 copper if the market trades below $4/lb on the CME/COMEX futures market (Chart 9). Precious Metals: Bullish Gold held support ~ $1,680/oz at the end of March, following an earlier test in the month. We remain long the yellow metal, despite coming close to being stopped out last week (Chart 10). The earlier sell-off appeared to be caused by a need to raise liquidity to us. We continue to expect the Fed to hold firm to its stated intent to wait for actual inflation to become manifest before raising rates, and, therefore, continue to expect real rates to weaken. This will be supportive of gold and commodities generally (Chart 10). Ags/Softs: Neutral Corn continues to be well supported above $5.50/bu, following last week's USDA report showing farmers intend to increase acreage planted to just over 91mm acres, which is less than 1% above last year's level. Chart 9
Copper Prices Surge As Global Storage Draws
Copper Prices Surge As Global Storage Draws
Chart 10
Gold Disconnected From US Dollar And Rates
Gold Disconnected From US Dollar And Rates
Footnotes 1 Please see the Fund's April 2021 forecast Managing Divergent Recoveries. 2 We noted last week these higher growth expectations generally are bullish for industrial commodities – energy, metals, and bulks. Please see Fundamentals Support Oil, Bulks, And Metals, which we published 1 April 2021. It is available at ces.bcaresearch.com. 3 For the rate of construction see Margarita Assenova, “Clouds Darkening Over Nord Stream Two Pipeline,” Eurasia Daily Monitor 18: 17 (February 1, 2021), Jamestown Foundation, jamestown.org. For the current status, see Robin Emmott, “At NATO, Blinken warns Germany over Nord Stream 2 pipeline,” Reuters, March 23, 2021, reuters.com. 4 The Democratic Party blames Russia for what it sees as a campaign to undermine the democratic West and recreate the Soviet sphere of influence. See for example the 2008 invasion of Georgia, the failure of the Obama administration’s 2009-11 diplomatic “reset,” the Edward Snowden affair, the seizure of Crimea and civil war in Ukraine, the survival of Syria’s dictator, and Russian interference in US elections in 2016 and 2020. 5 The Countering Russian Influence in Europe and Eurasia Act of 2017, and the Protecting Europe’s Energy Security Act of 2019/2020, contain provisions requiring sanctions on firms that have contributed in any way a minimum of $1 million to the project, or provide pipe-laying services or insurance. There are exceptions for services provided by the governments of the EU member states, Norway, Switzerland, or the UK. The president has discretion over the implementation of sanctions as usual. 6 The German state of Mecklenburg-Vorpommern is creating a shell foundation to enable the completion of the pipeline. It can shield companies from American sanctions aimed at private companies, not sovereigns. Investment Views and Themes Recommendations Strategic Recommendations Tactical Trades Commodity Prices and Plays Reference Table Summary of Closed Trades
Higher Inflation On The Way
Higher Inflation On The Way
German factory orders accelerated 1.2% m/m in February from 0.8% m/m in January, indicating that the manufacturing recovery is intact. On an annual basis, factory orders jumped 5.6% y/y from 2.5% y/y. The monthly improvement reflects ameliorations in both…
The global economy has been characterized by divergent recoveries. For example, the IMF’s April World Economic Outlook upgraded its 2021 US growth forecast by 1.3pp to 6.4%, versus the much more muted 0.2pp upgrade to the Euro Area growth forecast of 4.4%.…
The Sentix Economic Index for the Eurozone positively surprised by showing a strong rebound in investor confidence. The overall index jumped from 5.0 to 13.1 in April, beating expectations of a more muted rise to 6.7 and marking the highest level since August…
Highlights Q1/2021 Performance Breakdown: Our recommended model bond portfolio outperformed the custom benchmark index by +55bps during the first quarter of the year. Winners & Losers: The government bond side of the portfolio outperformed by +68bps, led overwhelmingly by our underweight to US Treasuries (+63bps). Spread product allocations underperformed by -11bps, primarily due to an overweight on UK corporates (-8bps). Portfolio Positioning For The Next Six Months: We are sticking with an overall below-benchmark portfolio duration stance, given accelerating global growth momentum, expanding vaccinations and a highly stimulative fiscal/monetary policy mix. We are maintaining a moderate overweight to global spread product versus government debt, concentrated on an overweight to US high-yield given more stretched valuations in other credit sectors. On the margin, we are making the following changes to the portfolio allocations: downgrading both UK Gilts and UK investment grade corporates to neutral, while cutting the overall allocation to EM USD credit to neutral. Feature The first quarter of 2021 saw a sharp sell-off in global bond markets on the back of rising growth expectations, fueled by US fiscal stimulus and vaccine optimism. The US was near the front of the pack, with 10-year Treasuries having their biggest first quarter sell-off since 1994. Accommodative financial conditions, fueled by a highly stimulative mix of monetary and fiscal policies and improving sentiment, have lit a fire under a global economy set to reopen from pandemic lockdowns. Going forward, we expect US growth to continue leading the way, with implications for the dollar, commodity prices, and the expected path of policy rates. With that in mind, this week we are reviewing the performance of the BCA Research Global Fixed Income Strategy (GFIS) model bond portfolio during the first quarter of 2021. We also present our recommended positioning for the portfolio for the next six months (Table 1), as well as portfolio return expectations for our base case and alternative investment scenarios. Table 1GFIS Model Bond Portfolio Recommended Positioning For The Next Six Months
GFIS Model Bond Portfolio Q1/2021 Performance Review & Current Allocations: Grand Reopening
GFIS Model Bond Portfolio Q1/2021 Performance Review & Current Allocations: Grand Reopening
As a reminder to existing readers (and to new clients), the model portfolio is a part of our service that complements the usual macro analysis of global fixed income markets. The portfolio is how we communicate our opinion on the relative attractiveness between government bond and spread product sectors. We do this by applying actual percentage weightings to each of our recommendations within a fully invested hypothetical bond portfolio. Q1/2021 Model Portfolio Performance Breakdown: Steering Clear Of Duration Chart 1Q1/2021 Performance: Bearish UST Bets Pay Off
Q1/2021 Performance: Bearish UST Bets Pay Off
Q1/2021 Performance: Bearish UST Bets Pay Off
The total return for the GFIS model portfolio (hedged into US dollars) in the first quarter was -1.83%, dramatically outperforming the custom benchmark index by +55bps (Chart 1).1 This follows modest outperformance in 2020 which was driven largely by overweights on spread product initiated after the pandemic shock to markets. In terms of the specific breakdown between the government bond and spread product allocations in our model portfolio, the former generated +68bps of outperformance versus our custom benchmark index while the latter underperformed by -11bps. Our allocations to inflation-linked bonds in the US, Canada and Europe - which were a source of outperformance in 2020 - modestly underperformed this quarter (-2bps) as global real yields finally began to pick up. Our outperformance this quarter was driven overwhelmingly by our decision to go significantly underweight US Treasuries, and to position for a bearish steepening of the Treasury curve, ahead of last November’s US presidential election (Table 2). That resulted in the US Treasury allocation generating a massive +63bps of excess return in Q1/2022 as longer-term US yields surged higher. Table 2GFIS Model Bond Portfolio Q1/2021 Overall Return Attribution
GFIS Model Bond Portfolio Q1/2021 Performance Review & Current Allocations: Grand Reopening
GFIS Model Bond Portfolio Q1/2021 Performance Review & Current Allocations: Grand Reopening
The size of the US underweight was unusually large as we maintained only a neutral exposure to the other “high beta” markets that are typically positively correlated to US yield moves, Canada and Australia. Although the returns for those two government bond markets were very similar to that of US Treasuries in Q1, so the choice to stay neutral even with a bearish directional view on US yields did not impact the overall portfolio performance. Overweights to the more defensive “low beta” markets of Germany, France and Japan contributed a combined +4bps. We did see some losses on nominal government bonds in peripheral Europe (Italy: -0.6bps; Spain: -1.9bps), however, with the narrowing in spreads thrown off by a botched vaccine rollout. In spread product, underperformance came from overweights to UK investment grade corporates (-8bps), US CMBS (-4bps), and EM USD-denominated corporates (-2bps). This was despite the fact that spreads for UK corporates remained flat while US CMBS spreads actually narrowed. These losses were slightly offset by the overweight to lower-rated US high-yield (+3bps) and underweight to US agency MBS (+2bps). Our spread product losses, in total return terms, highlight the importance of considering duration risk when making a call on spread product, especially at a time when sovereign yields are rising and spreads offer little “cushion”. Duration also played a big part in nominal government bond outperformance, with a whopping +43bps of our total +55bps outperformance concentrated in just US Treasuries with a maturity greater than 10 years. In other words, overweighting overall global spread product and underweighting government bonds still generated major portfolio outperformance, even if there was a more mixed bag of returns within that credit overweight. The bar charts showing the total and relative returns for each individual government bond market and spread product sector are presented in Charts 2 & 3. Chart 2GFIS Model Bond Portfolio Q1/2021 Government Bond Performance Attribution
GFIS Model Bond Portfolio Q1/2021 Performance Review & Current Allocations: Grand Reopening
GFIS Model Bond Portfolio Q1/2021 Performance Review & Current Allocations: Grand Reopening
Chart 3GFIS Model Bond Portfolio Q1/2021 Spread Product Performance Attribution By Sector
GFIS Model Bond Portfolio Q1/2021 Performance Review & Current Allocations: Grand Reopening
GFIS Model Bond Portfolio Q1/2021 Performance Review & Current Allocations: Grand Reopening
Biggest Outperformers: Underweight US Treasuries with a maturity greater than 10 years (+43bps), maturity between 7 and 10 years (+11bps), and with a maturity between 5 and 7 years (+7bps) Overweight US high-yield (+3bps) Underweight US agency MBS (+2bps) Overweight Italian inflation-indexed BTPs (+2bps) Biggest Underperformers: Overweight UK investment grade corporates (-8bps) Overweight US agency CMBS (-4bps) Overweight Spanish government bonds (-2bps) Chart 4 presents the ranked benchmark index returns of the individual countries and spread product sectors in the GFIS model bond portfolio for Q1/2021. Returns are hedged into US dollars (we do not take active currency risk in this portfolio) and adjusted to reflect duration differences between each country/sector and the overall custom benchmark index for the model portfolio. We have also color coded the bars in each chart to reflect our recommended investment stance for each market during Q1 (red for underweight, dark green for overweight, gray for neutral). Chart 4Ranking The Winners & Losers From The GFIS Model Bond Portfolio Universe In Q1/2021
GFIS Model Bond Portfolio Q1/2021 Performance Review & Current Allocations: Grand Reopening
GFIS Model Bond Portfolio Q1/2021 Performance Review & Current Allocations: Grand Reopening
Ideally, we would look to see more green bars on the left side of the chart where market returns are highest, and more red bars on the right side of the chart were returns are lowest. On that front, our portfolio allocations performed exceptionally well in Q1. In total return terms, the global bond market sell-off was a disaster for both government bonds and spread product. US high-yield, one of our longer-standing overweights, was the only sector to emerge unscathed, delivering a positive return of +42bps. Within our government bond allocation, the “defensive” markets—Japan (-44bps), Germany, (-261bps) and France (-371bps)—were nevertheless shaken by rising yields. On the other hand, we limited our downside by maintaining a neutral stance on the higher beta markets such as Canada (-406bps), New Zealand (-415bps), and the UK (-1389bps). Gilts sold off especially sharply as the UK outperformed global peers on COVID-19 vaccinations while inflation expectations continued to pick up. Our two underweights, US Treasuries (-426bps) and European high-yield (-426bps), were prescient. The latter market was one we chose to underweight given that spreads didn’t offer nearly enough compensation on a default-adjusted and breakeven basis. Bottom Line: Our model bond portfolio outperformed its benchmark index in the first quarter of the year by +55bps – a positive result driven by our underweight allocation to the US Treasury market and overall below-benchmark global duration stance. Future Drivers Of Portfolio Returns & Scenario Analysis Chart 5More Growth-Driven Upside For Global Yields Ahead
More Growth-Driven Upside For Global Yields Ahead
More Growth-Driven Upside For Global Yields Ahead
Looking ahead, the performance of the model bond portfolio will continue to be driven predominantly by the future moves of global government bond yields, most notably US Treasuries. Our most favored leading indicators for global bond yields continue to signal more upside over at least the next six months (Chart 5). Our Global Duration Indicator, comprised of measures of future economic sentiment and momentum, remains at an elevated level. The ongoing climb in the global manufacturing PMI, which typically leads global real bond yields by around six months, suggests that the recent uptick in real yields can continue into the second half of 2021. We are still maintaining a bias towards bearish yield curve steepening across all the countries in the model bond portfolio. It is still far too soon to see bearish flattening of yield curves given the dovish bias of global central banks, many of which are actively targeting an overshoot of their own inflation targets. The US will be the first central bank to see any bearish flattening pressure, as the market more aggressively pulls forward the liftoff date of the next Fed tightening cycle in response to strong US growth, but that is an outcome we do not expect until well into the second half of 2021. With regards to country allocations within the government bond segment of the model bond portfolio, we continue to focus our maximum underweight on the US, while limiting exposure to the markets that are more sensitive to changes in US interest rates (Chart 6). Those “lower yield beta” markets (Germany, France and Japan) will continue to outperform the higher beta markets (Canada, Australia) over the latter half of 2021. We currently have Canada on “downgrade watch”, as economic momentum is accelerating and the housing bubble looks to be reflating, both of which will make the Bank of Canada turn more hawkish shortly after the Fed does. We are more comfortable keeping Australia at neutral, as Australian inflation is likely to remain too underwhelming for the Reserve Bank of Australia to turn less dovish and risk a surge in the Australian dollar. UK Gilts are a more difficult case, atypically acting like a lower beta market over the past few years. As we discussed in a Special Report published last month, we attribute the declining Gilt yield beta to the rolling shocks the UK has suffered over the past thirteen years – the 2008 global financial crisis, the 2012 euro area debt crisis, Brexit and, now, COVID-19 – that have hamstrung the Bank of England’s ability to try even modest interest rate hikes.2 With the impact of those shocks on UK growth now diminishing, we see the central bank under greater pressure to begin normalizing UK monetary policy over the couple of years. We downgraded our cyclical stance on UK Gilts and UK investment grade corporates to neutral from overweight in that Special Report and, this week, we are making the same reduction in UK weightings in our model bond portfolio (see the portfolio tables on pages 20-21). After that change, the overall duration of the model bond portfolio remains below that of the custom benchmark index, now by -0.75 years (Chart 7). Chart 6Low-Beta Markets Will Continue To Outperform USTs
Low-Beta Markets Will Continue To Outperform USTs
Low-Beta Markets Will Continue To Outperform USTs
Chart 7Overall Portfolio Duration: Stay Below Benchmark
Overall Portfolio Duration: Stay Below Benchmark
Overall Portfolio Duration: Stay Below Benchmark
We continue to see the dovish bias of global central bankers as being conducive to the outperformance of inflation-linked bonds versus nominal government debt (Chart 8). Yes, the “easy money” has been made betting on a recovery of inflation expectations from the bombed-out levels seen after the COVID-19 recession in 2020. However, within the major developed economies with inflation-linked bond markets, 10-year breakevens have already climbed beyond the pre-pandemic levels of early 2020 (Chart 9). The next targets are the previous cyclical highs seen in 2018 (and 2019 for the UK). Chart 8Dovish Central Banks Still Positive For Inflation-Linked Bonds
Dovish Central Banks Still Positive For Inflation-Linked Bonds
Dovish Central Banks Still Positive For Inflation-Linked Bonds
Chart 9Inflation Breakevens Returning To Past Cyclical Peaks
Inflation Breakevens Returning To Past Cyclical Peaks
Inflation Breakevens Returning To Past Cyclical Peaks
Chart 10Still A Supportive Backdrop For Global Corporates
Still A Supportive Backdrop For Global Corporates
Still A Supportive Backdrop For Global Corporates
The 10-year US TIPS breakeven is already past that 2018 peak of 2.18%, and with the Fed showing no sign of concern about US growth and inflation accelerating, the 10-year US breakeven should end up moving into the high end of our expected 2.3-2.5% target range before the Fed begins to turn less dovish. Thus, we are maintaining a core allocation to linkers in the portfolio, focused on US TIPS and inflation-linked bonds in Italy, France and Canada. The same aggressive easing of global monetary policy that has been good for relative inflation-linked bond performance continues to benefit global corporate bonds. The annual rate of growth of the combined balance sheets of the Fed, ECB, Bank of Japan and Bank of England remains an excellent leading indicator of the excess returns of both global investment grade and high-yield corporates over the past decade (Chart 10). With the combined balance sheet now expanding at a 55% pace, corporate bonds are still likely to continue to outperform government debt over the remainder of 2021. Much of that expected return outperformance of corporates will come via carry rather than spread compression, though. Our preferred measure of the attractiveness of credit spreads, the historical percentile ranking of 12-month breakeven spreads, shows that only US high-yield spreads are above the bottom quartile of their history among the credit sectors in our model portfolio (Chart 11). Given the absence of spread cushion in those other markets, we are maintaining an overweight stance on US high-yield in the model bond portfolio – especially versus euro area high-yield where we are underweight - while staying neutral investment grade credit in the US and Europe. Chart 11US High-Yield: The Last Bastion Of Attractive Spreads
GFIS Model Bond Portfolio Q1/2021 Performance Review & Current Allocations: Grand Reopening
GFIS Model Bond Portfolio Q1/2021 Performance Review & Current Allocations: Grand Reopening
Within the euro area, we continue to prefer owning Italian government bonds over investment grade corporates, given the European Central Bank’s more explicit support for the former through quantitative easing (Chart 12). We expect Italian yields and spreads to converge down to Spanish levels, likely within the next 6-12 months, while there is limited downside for euro area investment grade spreads given tight valuations. Chart 12Favor Italian BTPs Over Euro Area IG
Favor Italian BTPs Over Euro Area IG
Favor Italian BTPs Over Euro Area IG
We are not only looking at relative valuation considerations in developed market credit. Emerging market (EM) USD-denominated credit has benefited from a bullish combination of global policy stimulus, a weakening US dollar and rising commodity prices. We have positioned for that in our model portfolio through an overall overweight stance on EM USD credit, but one that favors investment grade corporates over sovereigns. Now, with the Chinese credit impulse likely to slow in the latter half of 2021 as Chinese policymakers look to rein in stimulus, a slower pace of Chinese economic growth represents a risk to EM credit (Chart 13). The same can be said for the US dollar, which is no longer depreciating with US bond yields rising and the markets questioning the Fed’s dovish forward guidance on future rate hikes (Chart 14). A strong US dollar would also be a risk to the commodity price rally that has supported EM financial assets. Chart 13Global Policy Mix Becoming Less Supportive For EM
Global Policy Mix Becoming Less Supportive For EM
Global Policy Mix Becoming Less Supportive For EM
Chart 14A Stronger USD Is A Risk For EM Corporates Vs Sovereigns
A Stronger USD Is A Risk For EM Corporates Vs Sovereigns
A Stronger USD Is A Risk For EM Corporates Vs Sovereigns
Chart 15A Moderate Overweight To Spread Product Vs Government Debt
GFIS Model Bond Portfolio Q1/2021 Performance Review & Current Allocations: Grand Reopening
GFIS Model Bond Portfolio Q1/2021 Performance Review & Current Allocations: Grand Reopening
In response to these growing risks to the bullish EM backdrop, we are downgrading our overall EM USD credit exposure in the model bond portfolio to neutral from overweight. We are maintaining our relative preference for EM investment grade corporates over sovereigns, however, within that overall neutral allocation. Summing it all up, we are sticking with a moderately overweight stance on global spread product versus government debt in the model portfolio, equal to four percentage points (Chart 15). That overweight comes entirely from the US high-yield allocation. After the changes made to our UK and EM positions, the tracking error of the portfolio, or its expected volatility versus that of the benchmark index, is quite low at 41bps (Chart 16). This is an unsurprising outcome given that the current positioning is focused so heavily on the US (Treasury underweight, high-yield overweight), with much of the other positioning close to neutral. That will change as 2021 progresses but, for now, our highest conviction views are in US fixed income. One final point – the relatively concentrated positioning leaves the portfolio “flat carry”, with a yield roughly equal to that of the benchmark index (Chart 17). Chart 16Limited Use Of Portfolio 'Tracking Error'
Limited Use Of Portfolio 'Tracking Error'
Limited Use Of Portfolio 'Tracking Error'
Chart 17Model Portfolio Yield Close To Benchmark
Model Portfolio Yield Close To Benchmark
Model Portfolio Yield Close To Benchmark
Scenario Analysis & Return Forecasts After making the shifts to our model bond portfolio allocations in the UK and EM, we now turn to scenario analysis to determine the return expectations for the portfolio for the next six months. On the credit side of the portfolio, we use risk-factor-based regression models to forecast future yield changes for global spread product sectors as a function of four major factors - the VIX, oil prices, the US dollar and the fed funds rate (Table 2A). For the government bond side of the portfolio, we avoid using regression models and instead use a yield-beta driven framework, taking forecasts for changes in US Treasury yields and translating those in changes in non-US bond yields by applying a historical yield beta (Table 2B). For our scenario analysis over the next six months, we use a base case scenario plus two alternate “tail risk” scenarios, based on the following descriptions and inputs: Table 2AFactor Regressions Used To Estimate Spread Product Yield Changes
GFIS Model Bond Portfolio Q1/2021 Performance Review & Current Allocations: Grand Reopening
GFIS Model Bond Portfolio Q1/2021 Performance Review & Current Allocations: Grand Reopening
Table 2BEstimated Government Bond Yield Betas To US Treasuries
GFIS Model Bond Portfolio Q1/2021 Performance Review & Current Allocations: Grand Reopening
GFIS Model Bond Portfolio Q1/2021 Performance Review & Current Allocations: Grand Reopening
Base case: Ongoing global vaccinations lead to more of the global economy reopening over the summer, with excess savings built up during the pandemic – augmented by ongoing fiscal support – starting to be spent. US economic growth will be most robust out of the major economies, given the additional boost from fiscal stimulus, while China implements actions to slow credit growth and the euro area lags on vaccinations. The Fed stands its ground and maintains no rate hikes until at least 2023, and US TIPS breakevens climb to levels consistent with the Fed’s 2% inflation mandate (2.3-2.5%). The US Treasury curve continues to bear-steepen, with the 10-year US yield rising to 2%. The VIX falls to 15, the US dollar is flat, the Brent oil price rises +5%, and the fed funds rate is unchanged at 0%. Optimistic case: A rapid pace of global vaccinations leads to booming growth led by the US but including a reopening euro area. Chinese policymakers tighten credit by less than expected. Markets begin to pull forward the timing and pace of future central bank interest rate hikes, most notably in the US but also in the other countries like Canada and the UK. Real bond yields continue to climb globally, but inflation breakevens stay elevated. The steepening trend of the US Treasury curve ends, and mild bear flattening begins with the 10-year reaching 2.2% and the 2-year yield climbing to 0.4%. The VIX stays unchanged at 18, the US dollar rises +5%, the Brent oil price climbs +2.5% and the fed funds rate stays unchanged. Pessimistic case: Setbacks on the pandemic, either from struggles with vaccine distribution or a surge in variant cases, lead to a slower pace of global growth momentum. Europe cannot reopen, China tightens credit policy faster than expected, and US households hold onto to excess savings amid lingering virus uncertainty. Diminished economic optimism leads to a pullback in global equity values and wider global credit spreads. The US Treasury curve bull flattens as longer-maturity yields fall in a risk-off move, with the 10-year yield moving back down to 1.5%. The VIX rises to 25, the US dollar falls -2.5% and the fed funds rate stays at 0%. The inputs into the scenario analysis are shown in Chart 18 (for the USD, VIX, oil and the fed funds rate), while the US Treasury yield scenarios are in Chart 19. The excess return scenarios for the model bond portfolio, using the above inputs in our simple quantitative return forecast framework, are shown in Table 3A (the scenarios for the changes in US Treasury yields are shown in Table 3B). Chart 18Risk Factor Assumptions For The Scenario Analysis
Risk Factor Assumptions For The Scenario Analysis
Risk Factor Assumptions For The Scenario Analysis
Chart 19US Treasury Yield Assumptions For The Scenario Analysis
US Treasury Yield Assumptions For The Scenario Analysis
US Treasury Yield Assumptions For The Scenario Analysis
Table 3AGFIS Model Bond Portfolio Scenario Analysis For The Next Six Months
GFIS Model Bond Portfolio Q1/2021 Performance Review & Current Allocations: Grand Reopening
GFIS Model Bond Portfolio Q1/2021 Performance Review & Current Allocations: Grand Reopening
Table 3BUS Treasury Yield Assumptions For The 6-Month Forward Scenario Analysis
GFIS Model Bond Portfolio Q1/2021 Performance Review & Current Allocations: Grand Reopening
GFIS Model Bond Portfolio Q1/2021 Performance Review & Current Allocations: Grand Reopening
The model bond portfolio is expected to deliver an excess return over the next six months of +46bps in the base case and +54bps in the optimistic scenario, but is only projected to underperform by -27bps in the pessimistic scenario. Bottom Line: We are sticking with an overall below-benchmark portfolio duration stance, given accelerating global growth momentum, expanding vaccinations and a highly stimulative fiscal/monetary policy mix. We are maintaining a moderate overweight to global spread product versus government debt, concentrated on an overweight to US high-yield given more stretched valuations in other credit sectors. On the margin, we are making the following changes to the portfolio allocations: downgrading both UK Gilts and UK investment grade corporates to neutral, while cutting the overall allocation to EM USD credit to neutral. Robert Robis, CFA Chief Fixed Income Strategist rrobis@bcaresearch.com Shakti Sharma Research Associate ShaktiS@bcaresearch.com Footnotes 1 The GFIS model bond portfolio custom benchmark index is the Bloomberg Barclays Global Aggregate Index, but with allocations to global high-yield corporate debt replacing very high quality spread product (i.e. AA-rated). We believe this to be more indicative of the typical internal benchmark used by global multi-sector fixed income managers. 2 Please see BCA Research Global Fixed Income Strategy/Foreign Exchange Strategy Special Report, "Why Are UK Interest Rates Still So Low?", dated March 10, 2021, available at gfis.bcaresearch.com. Recommendations The GFIS Recommended Portfolio Vs. The Custom Benchmark Index
GFIS Model Bond Portfolio Q1/2021 Performance Review & Current Allocations: Grand Reopening
GFIS Model Bond Portfolio Q1/2021 Performance Review & Current Allocations: Grand Reopening
Duration Regional Allocation Spread Product Tactical Trades Yields & Returns Global Bond Yields Historical Returns
Please note that there was an error in computing Europe’s relative performance in the original text of this Insight. The revised version below corrects this error. We apologize for any inconvenience this may have caused. In local currency terms, the Dow…
BCA Research’s European Investment Strategy service concludes that European economic activity remains a high beta play on global and Chinese growth. Despite the euro area debt crisis and the slow health and fiscal policy response of European authorities to…
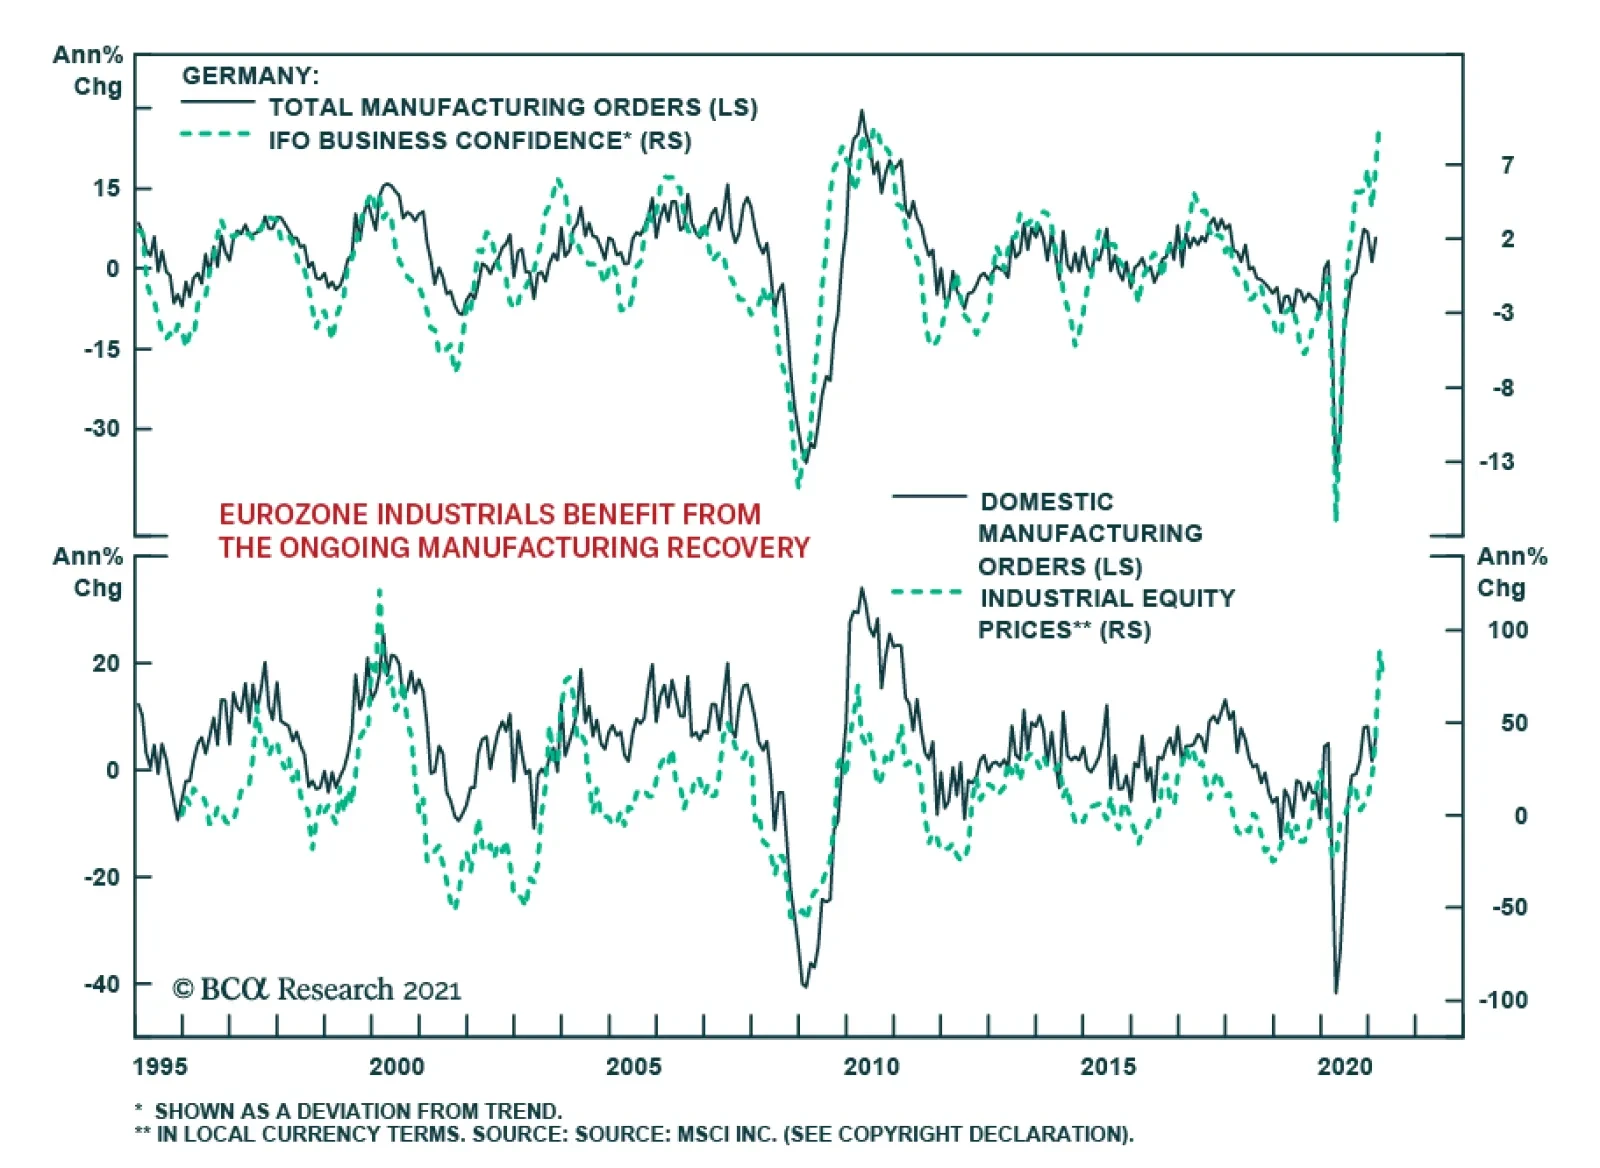
Highlights The Eurozone economy and assets remain beholden to the global manufacturing cycle. This sensitivity reflects the large share of output generated by capex and exports. Yet, the second half of 2021 and first half of 2022 could see euro area growth follow the beat of its own drum. This is a consequence of the unique role of consumption in the COVID-19 recession. European growth will therefore outperform expectations, even if economic momentum slows outside of Europe. Consequently, the euro and Eurozone equities will outperform for the coming 12 to 18 months. Feature For the past 20 years, investors have used a simple rule of thumb to understand European growth and markets. Europe is a derivative of global growth because of its large manufacturing sector and torpid domestic economy. A reductionist approach would even argue that China’s economy is what matters most for Europe. Is this model still valid to analyze Europe? In general, this approach still holds up well. However, the nature of the 2020 COVID-19 recession suggests that the European economy could still accelerate in the second half of the year, despite a small slowdown in the Chinese economy and global manufacturing sector. The Origin Of The Pro-Cyclicality Narrative Investors in European markets have long understood that Eurozone equities outperform when the global manufacturing cycle accelerates. This pro-cyclicality of European stocks is a consequence of their heavy weighting toward cyclical and value stocks, such as industrials, consumer discretionary and financials. Chart 1German/US Spreads: Global Manufacturing Cycle
German/US Spreads: Global Manufacturing Cycle
German/US Spreads: Global Manufacturing Cycle
Historically, European yields have also moved in a very pro-cyclical fashion. Over the past 30 years, periods when German 10-year yields rose relative to that of US Treasury Notes have coincided with an improvement in the global manufacturing sector as approximated by the ISM Manufacturing survey (Chart 1). Investors also understand that the euro is a pro-cyclical currency. Some of this behavior reflects the counter-cyclicality of the US dollar. However, if German yields rise more than US ones when global growth improves and European equities outperform under similar conditions, the euro naturally attracts inflows when the global manufacturing sector strengthens. Chart 2China Is A Key Determinant Of European Activity
China Is A Key Determinant Of European Activity
China Is A Key Determinant Of European Activity
Ultimately, the responsiveness of the euro and European assets to global growth is rooted in the nature of the European economy. Trade and manufacturing account for nearly 40% and 14% of GDP, respectively, compared to 26% and 11% for the US. This economic specialization has made Europe extremely sensitive to the gyrations of the Chinese economy, the largest contributor to fluctuation in the global demand for capital goods. As Chart 2 highlights, European IP and PMI outperform the US when China’s marginal propensity to consume (as approximated by the growth in M1 relative to M2) picks up. Is The Pro-Cyclical Narrative Still Valid? Despite the euro area debt crisis and the slow health and fiscal policy response of European authorities to COVID-19, evidence suggests that the Eurozone’s pro-cyclicality is only increasing. Chart 3Europe Is Becoming More Sensitive To The Rest Of The World Europe Is Becoming More Sensitive To The Rest Of The World
Europe Is Becoming More Sensitive To The Rest Of The World Europe Is Becoming More Sensitive To The Rest Of The World
Europe Is Becoming More Sensitive To The Rest Of The World Europe Is Becoming More Sensitive To The Rest Of The World
A simple statistical analysis confirms this hypothesis. A look at the beta of European GDP growth against the Global PMI reveals that the sensitivity of Eurozone growth and German growth to the Global PMI has steadily increased over the past 20 years (Chart 3, top panel). Moreover, the beta of euro area growth to the global PMI is now higher than that of the US, despite a considerably lower potential GDP growth, which means that a greater proportion of the Eurozone’s GDP growth is affected by globally-driven fluctuations. The bottom panel of Chart 3 shows a more volatile but similar relationship with Chinese economic activity. Correlation analysis confirms that Europe remains very sensitive to global factors. Currently, the rolling correlation of a regression of Eurozone GDP growth versus that of China stands near 0.7, which is comparable to levels that prevailed between 2005 and 2012. The correlation between German and Chinese GDP growth is now higher than at any point during the past two decades. Chart 4The Declining Role Of Consumption
The Declining Role Of Consumption
The Declining Role Of Consumption
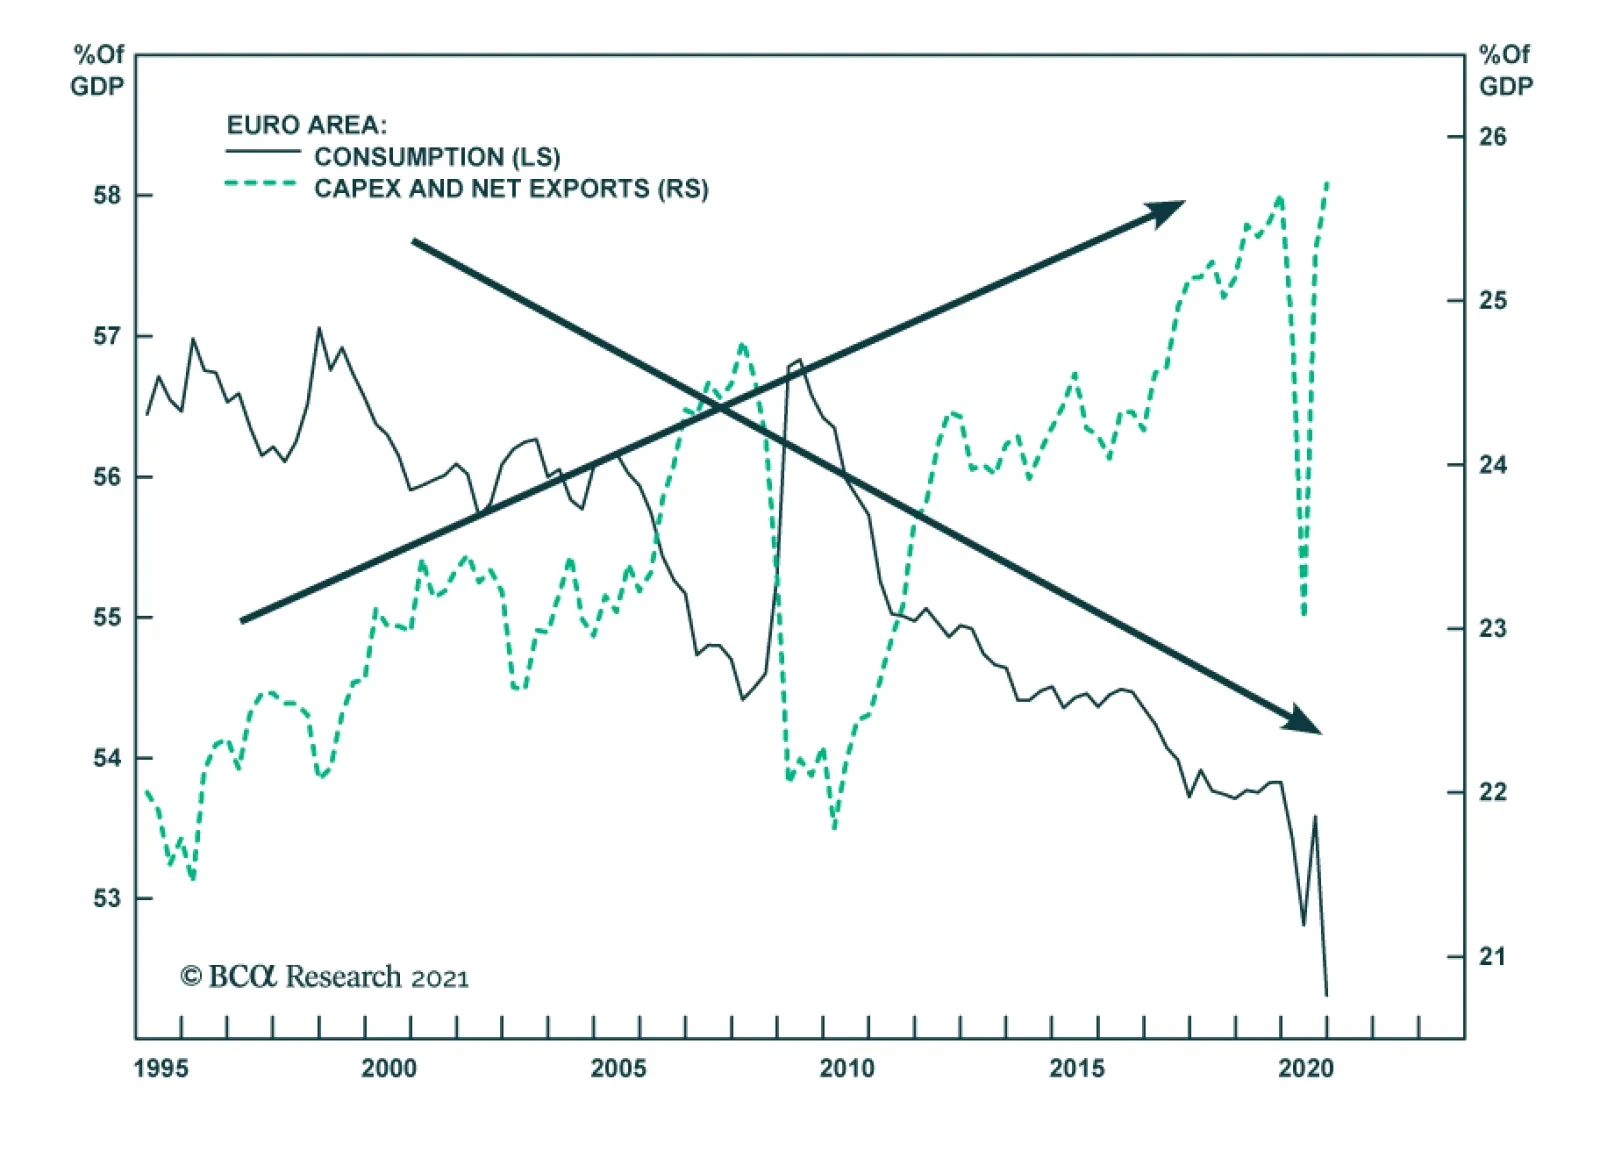
The increasing influence of global economic variables on the European economy reflects the evolution of the composition of the Eurozone’s GDP. Over the past 11 years, the share of consumption within GDP has decreased from 57% to 52%. For comparison’s sake, consumption accounts for 71% of US GDP. The two sectors that have taken the primacy away from consumption are capex and net exports, whose combined share has grown from 22% to 26% of GDP (Chart 4). This shift in the composition of GDP echoes the structural forces facing the Eurozone. An ageing population, a banking system focused on rebuilding its balance sheet, and the tackling of the competitiveness problems of peripheral economies have hurt wage growth, consumption and imports. Meanwhile, exports have remained on a stable trend, thanks to both the comparative vigor of the euro area’s trading partners and a cheap euro. Therefore, net exports expanded. Capex benefited from the strength in European exports. A Granger causality test reveals that consumption has little impact on fixed-capital formation in the euro area. However, the same method shows that fluctuations in export growth cause changes in investment. This makes sense. The variance in exports is an important contributor to the variability of Eurozone profits (Chart 5). Thus, rising exports incentivize the European corporate sector to expand its capital stock to fulfill foreign demand. The expanding share of output created by exports and capex along with the role of exports as a driver of capex explains why Europe economic activity is bound to remain so sensitive to the fluctuations in global trade and manufacturing activity. Moreover, the capex/exports interplay even affects consumption. As Chart 6 shows, the growth of euro area personal expenditures often bottoms after the annual rate of change of the new orders of capital goods has troughed, which reflects the role of exports as a driver of European income. Chart 5Profits And Exports
Profits And Exports
Profits And Exports
Chart 6Consumption Doesn't Move In A Vacuum
Consumption Doesn't Move In A Vacuum
Consumption Doesn't Move In A Vacuum
Bottom Line: European economic activity remains a high beta play on global and Chinese growth. The decrease in consumption to the benefit of exports and capex explains why this reality will not change anytime soon. 2021, An Idiosyncratic Year? In 2021, consumption will be the key input to the European economic performance, despite the long-term relationship between European GDP and foreign economic activity. This will allow European growth to narrow some of its gap with the US and the rest of the world in the second half of this year and the first half of 2022, even if the global manufacturing sector comes off its boil soon. The 2020 recession was unique. In a normal recession, capex, real estate investment, spending on durable goods and the manufacturing sector are the main contributors to the decline in GDP. This time, consumption and the service sector generated most of the contraction in output. These two sectors also caused the second dip in GDP following the tightening of lockdown measures across Europe last winter. Once the more recent wave of lockdowns is behind us, consumption will most likely slingshot to higher levels. More than the US, where the economy has been partially open for months now, Europe remains replete with significant pent-up demand. Obviously, fulfilling this demand will require further progress in the European vaccination campaign, something we recently discussed. Chart 7The Money Supply Forecasts A Rapid Recovery
The Money Supply Forecasts A Rapid Recovery
The Money Supply Forecasts A Rapid Recovery
The surge in M1 also points to a sharp rebound in consumption once governments lift the current lockdowns (Chart 7). M1 is a much more reliable predictor of economic activity in Europe than in the US, because disintermediation is not as prevalent in the Eurozone, where banks account for 72% and 88% of corporate and household credit, respectively, compared to 32% and 29% in the US. We cannot dismiss the explosion in the money supply as only a function of the ECB’s actions. European banks are in much better shape today than they were 10 years ago. Non-performing loans have been steadily decreasing. A rise in delinquencies is likely in the coming quarters due to the pandemic; however, the EUR3 trillion in credit guarantees by governments will limit the damages to the private sector’s and banking system’s balance sheets. Moreover, the Tier-1 capital ratio of the banking system ranges between 14% for Spain and 17% for Germany, well above the 10.5% threshold set by Basel-III (Chart 8). In this context, the pick-up in money supply mirrored credit flows. Thus, even if some of that credit reflects precautionary demand, the likelihood is high that a significant proportion of the built-up cash balances will find its way into the economy. Another positive sign for consumption comes from European confidence surveys. Despite tighter lockdown measures, consumer confidence has sharply rebounded, which historically heralds stronger consumption. Moreover, according to the ECB’s loan survey, stronger consumer confidence is causing an improvement in credit demand, which foreshadows a decline in savings intentions, especially now that wage growth is stabilizing (Chart 9). Nonetheless, there is still a risk that the advance in wages peters off. The recent wage agreement reached by Germany’s IG Metall union in North Rhine Westphalia was a paltry 1.3% annual pay raise, and once the Kurzarbeit programs end, the true level of labor market slack will become evident. However, for consumption to grow, all that we need to see now is stable wage growth, even if at a low rate. Chart 8European Banks Are Feeling Better
European Banks Are Feeling Better
European Banks Are Feeling Better
Chart 9Confidence Points To Stronger Consumption
Confidence Points To Stronger Consumption
Confidence Points To Stronger Consumption
Beyond consumption, Europe’s fiscal policy will be positive compared to the US next year. The NGEU plan will add roughly 1% to GDP in both 2021 and 2022. As a result, the Eurozone’s net fiscal drag should be no greater than 1% of GDP next year. This compares to a fiscal thrust of -7% in the US in 2022, even after factoring in the new “American Jobs Act” proposed by the Biden Administration last week, according to our US Political Strategy team. Bottom Line: The revival in European consumption in the second half of 2021 and the first half of 2022 will allow the gap between European and global growth to narrow. This dynamic will be reinforced next year, when the fiscal drag will be lower in Europe than in the US. These forces will create a rare occasion when European growth will improve despite a deceleration (albeit a modest one) in global manufacturing activity. Investment Conclusions The continued sensitivity of the euro area economy to the global industrial and trade cycle indicates that over the long-term, European assets will remain beholden to the gyrations of global growth. In other words, the euro and European stocks will outperform in periods of accelerating global manufacturing activity, as they have done over the past 30 years. The next 12 to 18 month may nonetheless defy this bigger picture, allowing European assets to generate alpha for global investors. Chart 10The Euro Will Like Idiosyncratic European Growth
The Euro Will Like Idiosyncratic European Growth
The Euro Will Like Idiosyncratic European Growth
First, the gap between US and euro area growth will narrow over the coming 12 to 18 months, thus the euro will remain well bid, even if the maximum acceleration in global industrial activity lies behind. As investors re-assess their view of European economic activity and the current period of maximum relative pessimism passes, inflows into the euro area will accelerate and the euro will appreciate (Chart 10). Hence, we continue to see the recent phase of weakness in EUR/USD as transitory. Second, European equities have scope to outperform US ones over that window. Some of that anticipated outperformance reflects our positive stance on the euro. However, a consumption-driven economic bounce will be positive for European financials as well. Such a recovery will let investors ratchet down their estimates of credit losses in the financial system. Moreover, banks are well capitalized, thus the ECB will permit the resumption of dividend payments. Under these circumstances, European banks have scope to outperform US ones temporarily, especially since Eurozone banks trade at a 56% discount to their transatlantic rivals on a price-to-book basis. An outperformance of financials will be key for Europe’s performance. Chart 11German/US Spreads Near Equilibrium?
German/US Spreads Near Equilibrium?
German/US Spreads Near Equilibrium?
Finally, we could enter a period of stability in US/German yield spreads over the coming months. The ECB remains steadfast at limiting the upside in European risk-free rates, as Christine Lagarde reiterated last week. However, BCA’s US bond strategist, Ryan Swift, believes US yields will enter a temporary plateau, as the Federal Reserve will not adjust rates until well after the US economy has reached full employment. Hence, the Fed is unlikely to let the OIS curve bring forward the date of the first hike currently priced in for August 2022 on a durable basis, which also limits the upside to US yields. Thus, looking at core CPI and policy rate differences, US yields have reached a temporary equilibrium relative to Germany (Chart 11). Mathieu Savary, Chief European Investment Strategist Mathieu@bcaresearch.com
Dear client, In addition to this abbreviated weekly report, we are also sending you an in-depth report on the euro, written by my colleague Mathieu Savary. Mathieu argues that the euro could continue to face some downside in the near-term, creating perfect conditions for a buying opportunity below 1.15. We agree with Mathieu’s assessment and are shorting EUR/JPY this week as a tactical trade. Finally, last week, we held a webcast during which I discussed the key themes that will shape the dollar landscape in the coming months. In case you missed it, you can listen to the replay here. Kind regards, Chester Highlights Being long the dollar is now a consensus trade. A new US infrastructure bill will be positive for US growth. However, the new package also increases the probability that inflation will be higher in the US, which will depress relative real rates. Go short EUR/JPY as a tactical trade. Feature Chart I-1Dollar Sentiment Has Been Reset
Dollar Sentiment Has Been Reset
Dollar Sentiment Has Been Reset
The DXY index is fast approaching our 94-95 target and it is an open question whether the rally will stall at these levels, or punch through for new highs this year. Historically, the dollar has tended to move in long cycles, with the latest bull and bear markets lasting about a decade or so. If, as we believe, a dollar bear market did indeed commence in 2020, then the historical evidence is that any bounce will be capped around 4-6%. This was the experience of the 2000s. The defining landscape during the latter stages of the dollar bull market in 2018 and 2019 was deteriorating global growth, with financial conditions which remained relatively too tight. The situation today is extremely easy financial conditions and improving global growth. As such, our bias remains that the landscape is more characteristic of a dollar bear market. Speculators are now long the dollar and our capitulation index is approaching overbought levels (Chart I-1). So while there is scope for the dollar to continue to rise in the near term, the big gains are behind us. US Infrastructure Spending And Bond Yields President Joe Biden’s American Jobs Plan did little to lift US long bond yields. This suggests that most of the improvement to aggregate demand may have already been priced in. The big driver of the US dollar this year has been the improvement in yields, particularly at the long end of the curve. Short yields have remained anchored near zero (Chart I-2). If this improvement in long rates is torpedoed by lack of bi-partisan support for a larger fiscal package, then this will provide less scope for the US dollar to rise. Economically, a large infrastructure package makes sense. The neutral rate of interest in the US is well above the Fed funds target rate. A widening gap suggests underlying financing conditions (short rates) are low relative to the potential growth rate of the economy (long rates). Not surprisingly, this also tends to track the yield curve pretty closely (Chart I-3). This incentivizes banks to lend, and fund these projects. Chart I-2The Move In Rates Has Been On The Long End
The Move In Rates Has Been On The Long End
The Move In Rates Has Been On The Long End
Chart I-3A Steeping Curve Usually Encourages Lending
A Steeping Curve Usually Encourages Lending
A Steeping Curve Usually Encourages Lending
The feedback loop with the dollar could however be negative. First, while the boost to aggregate demand supports US growth in the short term, there will be spillovers to other countries. The net beneficiaries might also be the countries that have the raw materials needed to realize this infrastructure plan. The proposal has a largely “buy American” tilt, but this will also create sharp domestic shortages as the US is not a manufacturing-based economy. An increase in imports will widen the US trade deficit. Second, the returns on infrastructure investments tend to be large in lower-productivity countries. Meanwhile, the increase in US taxes to fund these deficits will lower the return on capital for US assets. This might limit foreign inflows into US capital markets. Third, the US output gap is slated to close faster than in other economies, meaning the increase in aggregate demand will soon become inflationary. This could further depress real rates in the US. There is a longstanding correlation between US relative real rates and the dollar (Chart I-4). Chart I-4The Dollar Moves With Relative Real Rates
The Dollar Moves With Relative Real Rates
The Dollar Moves With Relative Real Rates
Chart I-5The Dollar Is Overvalued
The Dollar Is Overvalued
The Dollar Is Overvalued
Finally, it is important to remember that the starting point for the US dollar is as an expensive currency. According to our PPP models, the dollar is overvalued by over 10% (Chart I-5). This is already manifesting itself in a deteriorating trade balance. It also suggests that should the dollar continue to rise significantly, it will negatively impact US growth. Trading Strategy Amidst Market Uncertainty The near term outlook for the dollar remains bullish. Vaccinations are progressing at the fastest pace in the US and in the UK while the euro area, Canada and Japan are seeing a third wave of infections underway (Chart I-6). New lockdown measures have been implemented in these latter countries, which will further dent their Q2 outlook. While our bias is that these economies eventually benefit as their vaccination program progresses, the dollar remains in a sweet spot for now. Chart I-6AA Third Wave Is Underway
A Third Wave Is Underway
A Third Wave Is Underway
Chart I-6BA Third Wave Is Underway
A Third Wave Is Underway
A Third Wave Is Underway
Chart I-6CA Third Wave Is Underway
A Third Wave Is Underway
A Third Wave Is Underway
One hedge to this scenario is to go short the EUR/JPY cross. First, our Chief European Investment Strategist Mathieu Savary argues that the euro could undershoot to 1.12 in the near term. This suggests that EUR/JPY which faces critical resistance a nudge above 130, will stage a countertrend reversal (Chart I-7). Both EUR/USD and EUR/JPY tend to be positively correlated. Second, European bourses are underperforming those in Japan in common-currency terms. The relative performance of the equity markets have usually moved in lockstep with the currency, but a divergence has opened up (Chart I-8). In fact, given very similar sector compositions across both bourses, this divergence might be down to competitiveness, given the rally in EUR/JPY. Should profits in Europe suffer relative to those in Japan, this will cap EUR/JPY gains (Chart I-9) Chart I-7EUR/JPY Faces Strong Resistance At 130
EUR/JPY Faces Strong Resistance At 130
EUR/JPY Faces Strong Resistance At 130
Chart I-8EUR/JPY Moves With Relative Share Prices
EUR/JPY Moves With Relative Share Prices
EUR/JPY Moves With Relative Share Prices
Chart I-9EUR/JPY And Relative Profits
EUR/JPY And Relative Profits
EUR/JPY And Relative Profits
Finally, monetary policy is more accommodative in Europe than in Japan. Interest rates are lower, and the ECB’s balance sheet is rising more aggressively. This has historically been accompanied by a lower EUR/JPY exchange rate (Chart I-10). Chart I-10EUR/JPY And Relative Monetary Policy
EUR/JPY And Relative Monetary Policy
EUR/JPY And Relative Monetary Policy
We eventually expect EUR/JPY to break higher, but for now, we are opening a short position in this cross as a portfolio hedge. In line with this view, we are tightening stops on all of our trades this week. The dollar could be set for violent moves in the coming weeks. Stay tuned. Chester Ntonifor Foreign Exchange Strategist chestern@bcaresearch.com Trades & Forecasts Forecast Summary Core Portfolio Tactical Trades Limit Orders Closed Trades