Europe

Highlights Global Duration: Markets are correctly interpreting the $1.9 trillion US fiscal stimulus package as a factor justifying higher global growth expectations and bond yields. Maintain a below-benchmark stance on overall global duration. Yield Betas & Country Allocation: Within government bond portfolios, overweighting the “lower-beta” countries that have bond yields less sensitive to changes in US yields (Germany, France, Japan) versus the higher-beta markets (Canada, Australia, UK) remains the appropriate strategy during the current bond bear market. Underweights should remain concentrated in the US, though, as it is highly unlikely that any central bank will begin to tighten policy before the Fed. UK Follow-Up: The conclusions from our UK Special Report published last week do not change after adjusting for the difference in the inflation indices used to calculate UK inflation-linked bond yields compared to those of other countries. UK real interest rates are the lowest in the developed economies, while inflation breakevens are the highest. NOTE: There will be no Global Fixed Income Strategy report published next week. Instead, BCA Chief Global Fixed Income Strategist Rob Robis will do a webcast discussing his latest thoughts on global bond markets. Yields Rising Around The World Chart of the WeekPolicy Mix Is Bond-Bearish
Policy Mix Is Bond-Bearish
Policy Mix Is Bond-Bearish
The path of least resistance for global bond yields remains biased upward. Optimism on future economic growth remains ebullient with consumer and business confidence indices surging in much of the developed world. The epicenter of the global bond bear market remains the US, where pandemic related economic restrictions are being unwound with 21.4% of the US population now having received at least one dose of a vaccine. Fiscal policy in the US is also supporting the positive vibes on future growth after the $1.9 trillion stimulus package was signed into law by President Biden last week. The 10-year US Treasury yield climbed back to the 2021 high of 1.63% on the back of that announcement. The US stimulus package changes the trajectory of the 2021 US fiscal impulse from a $0.8 trillion contraction to a $0.3 trillion expansion, according to estimates from the US Committee for a Responsible Federal Budget (Chart of the Week). This, combined with ongoing quantitative easing from global central banks eager to keep bond yields as low as possible until inflation expectations sustainably return to policymaker targets, is providing a bond-bearish lift to both inflation expectations and real yields – most notably in the US. Central bankers can try to fight back against the speed of the increase in bond yields by maintaining their commitment to current policy settings, as the European Central Bank (ECB) and Bank of Canada (BoC) did last week. The Fed, Bank of England (BoE) and Bank of Japan (BoJ) will all get the chance to do the same this at this week’s policy meetings. The likely message from all will be one of staying the course and not reflexively responding to higher bond yields, which have not triggered a broad-based selloff in global risk assets that would pre-emptively tighten financial conditions. The S&P 500 index hit an all-time high last week, while equity markets in Europe and Japan have returned to pre-pandemic levels (Chart 2). Global corporate credit spreads have remained calm, consistent with a positive growth backdrop that diminishes the potential for credit downgrades and defaults. The US dollar has gotten a lift from improving US growth expectations and relatively higher US Treasury yields, which has had some negative spillover effect into emerging market equities and currencies. The dollar rebound has been relatively modest to date, however, with the DXY index up only 3% from the early 2021 lows. A major reason why global equity and credit markets have absorbed higher bond yields so well is because the sheer scope of the new US fiscal stimulus will have a major impact on growth momentum both in the US and outside the US. This comes on top of the boost to optimism from the speed of the US and UK vaccine rollouts. In an update to its December 2020 economic outlook published last week, the OECD estimated that the $1.9 trillion US stimulus will boost US real GDP growth by 3.8 percentage points versus its original forecast over the next year (Chart 3). Other countries will also benefit from the implied surge in US demand spilling over from that stimulus package, with the OECD projecting a 1.1 percentage point increase to world real GDP growth. Chart 2Risk Assets Ignoring Rising Global Bond Yields
Risk Assets Ignoring Rising Global Bond Yields
Risk Assets Ignoring Rising Global Bond Yields
Chart 3Big Growth Spillovers From US Fiscal Stimulus
Harder, Better, Faster, Stronger
Harder, Better, Faster, Stronger
Countries that have the greater exposure to US demand, like Canada and Mexico, are expected to benefit a bit more than the rest of the world, but the expected boost to growth is consistent (around one half of a percentage point) from China to Europe to Japan to major emerging market countries like Brazil. That US-fueled pickup in global economic activity will help absorb some of the spare capacity that opened up during the COVID-19 pandemic. In Chart 4 and Chart 5, we show the estimates taken from the December 2020 OECD Economic Outlook for the output gaps in the US, euro area, UK, Japan, Canada and Australia for 2021 and 2022. We adjust those projections by the OECD’s estimate of the impact of the US fiscal stimulus in 2021, as well as by the additional upward revisions to the OECD growth projections in 2021 and 2022 that were published last week. Chart 4The $1.9 Trillion Stimulus Will Close The US Output Gap …
Harder, Better, Faster, Stronger
Harder, Better, Faster, Stronger
Chart 5… And Help Narrow Output Gaps Elsewhere
Harder, Better, Faster, Stronger
Harder, Better, Faster, Stronger
Chart 6Maintain Below-Benchmark Duration
Maintain Below-Benchmark Duration
Maintain Below-Benchmark Duration
The conclusion is that the US output gap will be eliminated in 2022, while output gaps will still be negative, but diminished, in the other countries after factoring in the impact of the latest US fiscal package. This suggests that the maximum upward pressure on global bond yields should still be centered in the US, where inflation pressures will be more evident and the Fed will likely begin signaling a shift to a less dovish stance sooner than other central banks (although not likely until much later in 2021). Our Global Duration Indicator continues to flag pressure for higher bond yields ahead for the major developed economies (Chart 6). The improving growth momentum means that rising real yields should increasingly become the more important driver of higher nominal bond yields. Persistent central bank dovishness in the face of that growth surge, however, means that it is still too soon to position for narrowing global inflation expectations or any bearish flattening of government bond yield curves - even in the US. Bottom Line: Markets are correctly interpreting the $1.9 trillion US fiscal stimulus package as a factor justifying higher global growth expectations and bond yields. Maintain a below-benchmark stance on overall global duration. Using Yield Betas For Bond Country Allocation, One More Time Over the past two months, we have published Special Reports that delved into the outlook for bond yields and currencies in Australia, Canada and the UK. We selected those three countries as they represented the most likely downgrade candidates within our recommended government bond country allocation given their status as “higher beta” bond markets that are more correlated to US Treasury yields. We estimate US Treasury yield betas from a rolling regression (over a three-year window) of changes in 10-year non-US government bond yields to changes in 10-year US Treasury yields (Chart 7). This allows us to assess which markets are more or less sensitive to the ups and downs of US bond yields. We have used this framework to help guide our country allocation strategy during the pandemic and, for the most part, it has been successful. Chart 7Government Bond Yield Sensitivities To USTs Are Shifting Fast
Government Bond Yield Sensitivities To USTs Are Shifting Fast
Government Bond Yield Sensitivities To USTs Are Shifting Fast
So far in 2021, the markets with higher US Treasury yield betas (Canada, Australia and New Zealand) have underperformed the lower beta markets (Germany, France and Japan). We show that in the top panel of Chart 8, which plots the yield betas at the start of the year versus the year-to-date relative return of each country’s government bond market to that of the overall Bloomberg Barclays Global Treasury index. The returns are adjusted to reflect any differences in the durations of each country versus that of the overall index, and are shown in USD-hedged terms to allow for a common currency comparison. The bottom panel of Chart 8 shows the same relationship for the all of 2020. This is a mirror image of what has occurred so far in 2021, with the countries with higher yield betas outperforming the lower beta markets. The obvious difference between the two years is the direction of Treasury yields, which fell in 2020 and have been rising this year. So far in 2020, the differences between the returns of the higher beta markets have been quite similar. New Zealand has had the biggest negative performance (-2.8% versus the global benchmark), but this has only been moderately worse than Australia (-2.6%) and Canada (-2.4%). These are all just slightly worse than the return of US Treasuries relative to the Global Treasury index (-2.3%). Our estimated yield betas have changed rapidly over the past few months. For example, the rolling three-year yield beta of Australia has shot up from 0.61 at the beginning of the year to 0.78, while Canada has seen a similar move (0.81 to 0.88). This reflects the rapid repricing of interest rate expectations in both countries as current growth momentum and growth expectations improve. While not a perfect relationship, yield betas do show some correlation to our Central Bank Monitors – designed to measure the pressure on central banks to tighten of ease monetary policy (Chart 9). The latest increases in the yield betas of Australia, New Zealand and Canada have occurred alongside a rising trend in our Central Bank Monitors for each nation. The implication is that the relative underperformance of government bonds in those countries is related to the cyclical pressure for the RBA, RBNZ and BoC to tighten monetary policy. Chart 8An Intuitive Link Between Yield Betas & Bond Market Performance
Harder, Better, Faster, Stronger
Harder, Better, Faster, Stronger
Chart 9Cyclical Pressures & Yield Betas Are Linked
Cyclical Pressures & Yield Betas Are Linked
Cyclical Pressures & Yield Betas Are Linked
At the same time, the yield betas of government bonds in Germany and the UK have remained low despite the cyclical upturn in our ECB and BoE Monitors. The lingering impact of COVID-19 lockdowns on economic growth and inflation in the euro area and UK is likely weighing on bond yields in both regions. This limits any challenge to the dovish forward guidance of the ECB and BoE, in contrast to the repricing of interest rate expectations seen in other countries. The market-implied path of policy interest rates extracted from OIS forward curves does show a much more aggressive expected path of policy rates in the higher beta markets versus the lower beta markets (Chart 10). Chart 10More Rate Hikes Expected In The Higher Yield Beta Countries
Harder, Better, Faster, Stronger
Harder, Better, Faster, Stronger
The “liftoff” date for each central bank shown, representing when the first full interest rate hike is priced into the OIS forwards, is shown in Table 1. We rank the countries in the table by the amount of time until the discounted liftoff date, from shortest to longest. The first rate hike is expected in New Zealand in June 2022, with the BoC expected to lift rates in Canada two months later. The market is not pricing a full rate hike by the Fed until January 2023, while liftoff in the UK and Australia are expected during the summer of 2023. Table 1The "Pecking Order" Of Global Liftoff
Harder, Better, Faster, Stronger
Harder, Better, Faster, Stronger
We treat the countries with perpetually low interest rates, the euro area and Japan, differently in Table 1, as both the ECB and BoJ would most likely move slowly if and when they ever decided to raise rates again. Thus, we define liftoff as only a 10bp increase in policy interest rates for those two regions, while for all the other central banks we assume the size of the first rate hike will be 25bps. On that reduced basis, the market is priced for “liftoff” by the ECB and BoJ in September 2023 and February 2025, respectively. In terms of that “order of liftoff” shown in Table 1, we generally agree with current market pricing except for New Zealand and Canada. We fully expect the Fed to be the first central bank to begin signaling the path towards monetary policy normalization, largely due to the impact of the fiscal stimulus, starting with a move to begin tapering the Fed’s asset purchases at the start of 2022. The Fed will also be the first to begin rate hikes after tapering. We do not anticipate the BoC or Reserve Bank of New Zealand (RBNZ) to make any hawkish moves (reduced asset purchases or rate hikes) before the Fed does the same, as this would put unwanted appreciation pressures on the New Zealand and Canadian dollars. We expect the BoC and RBNZ to move soon after the Fed begins to shift, followed by the BoE and RBA a bit later after that in line with the current liftoff ordering. The pace of rate hikes after liftoff also appears to be a bit too aggressively priced in the countries with higher yield betas. The cumulative amount of interest rate increases to the end of 2024 currently priced in OIS curves is larger in Canada (175bps) and Australia (156bps) than the US (139bps) and New Zealand (140bps). The relative differences are not huge, however, but we think the odds favor the Fed delivering the greater amount of rate hikes over the next three years. More generally, when looking at what is more important for each central bank in determining the timing of liftoff, we can boil it down to a couple of the most important measures for the higher beta countries (Chart 11): US: The Fed will continue to focus on both inflation expectations and broad measures of labor market utilization before signaling any policy shift. On that basis, there is still some way to go before TIPS breakevens return to the 2.3-2.5% level we believe to be consistent with the Fed sustainably hitting its 2% inflation goal on the PCE deflator. Also, there is still a lot of ground to cover before the US labor market fully returns to pre-pandemic health, as the employment/population ratio is four percentage points below the pre-COVID peak. New Zealand: The RBNZ is now under a lot more pressure to tighten policy after the New Zealand government changed the central bank’s remit to include stabilizing house prices, which have soured to unaffordable levels that have exacerbated income inequality. With house prices now rising at a 19% annual rate, the highest since 2004, the RBNZ will be under pressure to hike sooner, although any associated rise in the New Zealand dollar will likely be of equal concern. Canada: The BoC has been very candid that its current policy mix of aggressive asset purchases and 0% policy rates will be altered if the Canadian economy improves. We believe that the current trends of booming house price inflation, recovering business investment prospects and a rapidly recovering labor market will all make the BoC more willing to signal tighter monetary policy fairly soon after the Fed does the same. Australia: The RBA is likely to continue surprising bond markets with its dovishness in the face of a rapidly recovering economy, given underwhelming inflation. In a recent speech, RBA Governor Philip Lowe noted that Australian inflation will not return to the RBA’s 2-3% target band without wage growth rising from the current 1.4% pace up to 3%. The RBA does not expect the labor market to tighten enough to generate that kind of wage growth until at least 2024, suggesting no eagerness to begin normalizing monetary policy. Among the lower-beta markets, the most important things that will dictate future policy moves are the following (Chart 12): Chart 11What To Watch In The Higher Yield Beta Countries
What To Watch In The Higher Yield Beta Countries
What To Watch In The Higher Yield Beta Countries
Chart 12What To Watch In The Lower Yield Beta Countries
What To Watch In The Lower Yield Beta Countries
What To Watch In The Lower Yield Beta Countries
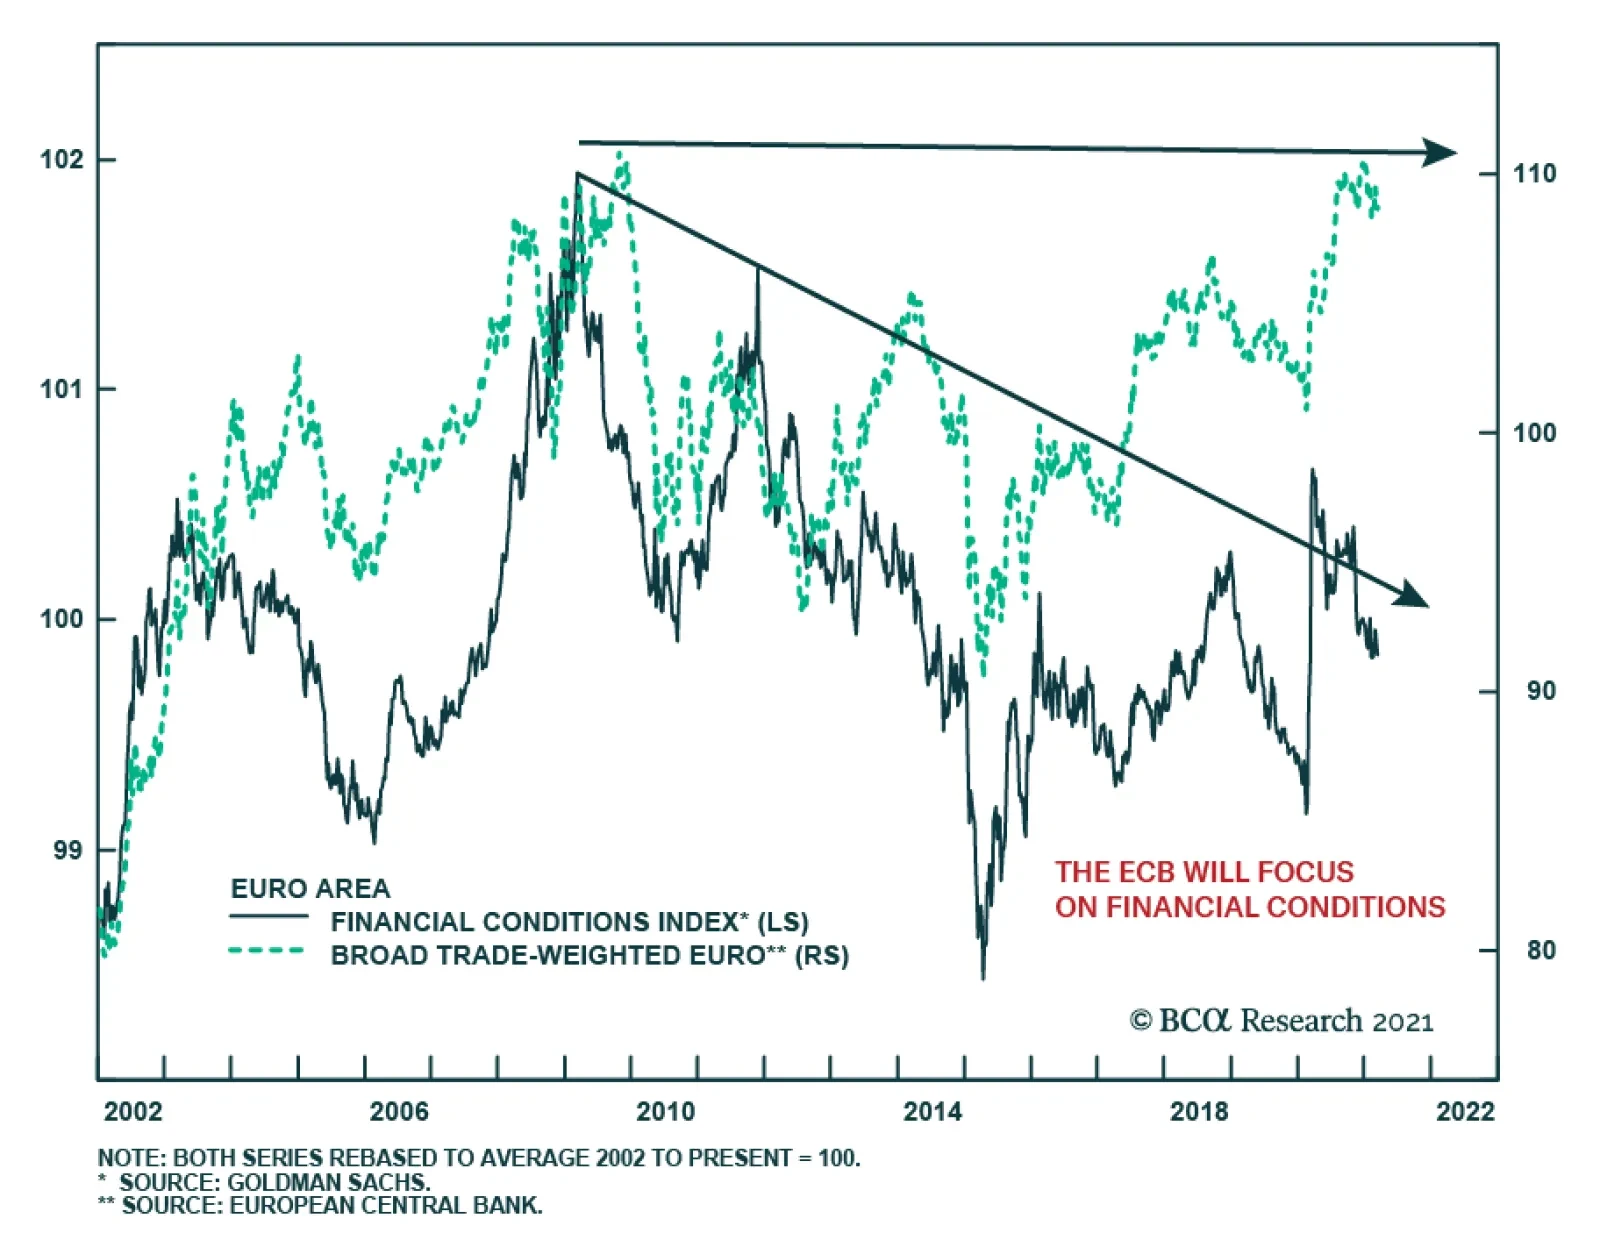
UK: The BoE’s current focus is on how fast the UK economy recovers from the pandemic shock, with inflation expectations remaining elevated (see the next section of this report). The degree of strength in business investment and consumer spending will thus dictate the timing of any BoE shift to a less accommodative policy stance. Euro Area: The latest set of ECB projections call for inflation to only reach 1.4% by 2023. As long as inflation (both realized and expected) stays well below the 2% ECB target, the central bank will focus more on supporting easy financial conditions (lower corporate bond yields, tighter Italy-Germany yield spreads and resisting euro currency strength). Japan: Inflation continues to underwhelm in Japan, and the BoJ is a long way from contemplating any tightening measures. Summing it all up, we still see value in using yield betas to dictate our recommended fixed income country allocations. Although these should be complemented with assessments of the relative likelihood of central banks moving before others to further refine country allocations. Bottom Line: Within government bond portfolios, overweighting the “lower-beta” countries that have bond yields less sensitive to changes in US yields (Germany, France, Japan) versus the higher-beta markets (Canada, Australia, UK) remains the appropriate strategy during the current bond bear market. Underweights should remain concentrated in the US, though, as it is highly unlikely that any central bank will begin to tighten policy before the Fed. A Brief Follow-Up To Our UK Special Report In our Special Report on the UK published last week, we noted that the UK had the lowest real bond yields and highest inflation expectations among the developed market countries with inflation-linked bonds.1 Some astute clients pointed out that we neglected to discuss how the UK inflation-linked bonds are priced off the UK Retail Price Index (RPI) which typically runs with a faster inflation rate than the UK Consumer Price Index (CPI). This creates a downward bias to UK real yields in comparison to other countries that use domestic CPI indices in inflation-linked bond pricing. We did not ignore the RPI-CPI differential in our report, we just did not think it to be relevant to the conclusions of our report. The UK still has the lowest real rates and highest inflation expectations even after adjusting both by the RPI-CPI gap (Chart 13). Furthermore, survey-based measures of UK inflation expectations are broadly in line with the RPI-based inflation breakevens, confirming the message from the RPI-based real yields and inflation expectations. Chart 13UK Real Yields Are Too Low, Using RPI Or CPI
UK Real Yields Are Too Low, Using RPI Or CPI
UK Real Yields Are Too Low, Using RPI Or CPI
Looking ahead, the RPI-CPI gap is likely to stay in a much narrower range compared to its longer run history. Chart 14A Less Active BoE Has Narrowed The RPI-CPI Gap
A Less Active BoE Has Narrowed The RPI-CPI Gap
A Less Active BoE Has Narrowed The RPI-CPI Gap
For example, between 2000 and 2007, the RPI-CPI gap averaged a full percentage point but with very large fluctuations (Chart 14). This is because mortgage interest costs are included in the RPI but are not part of the CPI. Thus, RPI inflation tends to be more volatile when the BoE is more active in adjusting interest rates. After the 2008 financial crisis, the BoE has kept policy rates at very low levels with very few changes. The RPI-CPI gap has narrowed as a result, averaging only one-half of a percentage point between 2009 to today. Thus, our conclusion on UK bond yields remains the same – Gilt yields are too low and are likely to rise further over the next 6-12 months. Robert Robis, CFA Chief Fixed Income Strategist rrobis@bcaresearch.com Footnotes 1 Please see BCA Research Global Fixed Income Strategy/Foreign Exchange Strategy Special Report, "Why Are UK Interest Rates Still So Low?",dated March 10, 2021, available at gfis.bcaresearch.com and fes.bcaresearch.com. Recommendations The GFIS Recommended Portfolio Vs. The Custom Benchmark Index
Harder, Better, Faster, Stronger
Harder, Better, Faster, Stronger
Duration Regional Allocation Spread Product Tactical Trades Yields & Returns Global Bond Yields Historical Returns
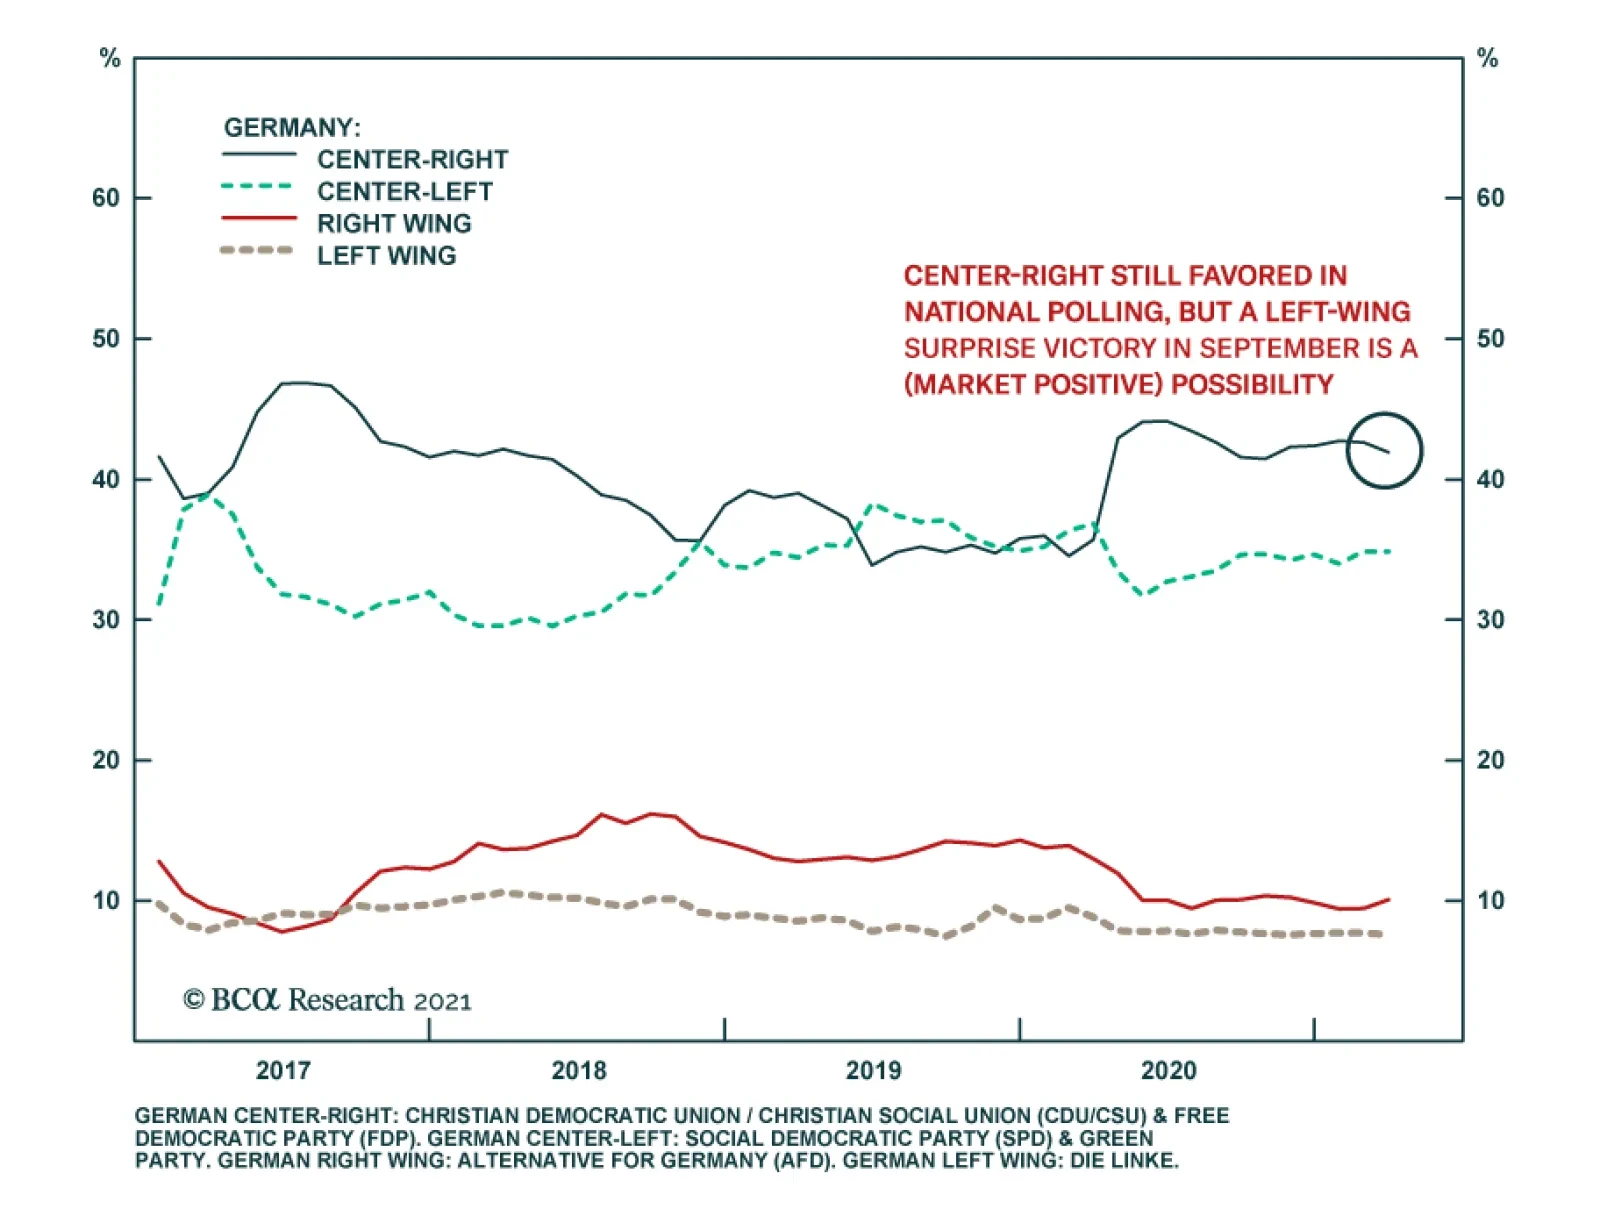
The CDU’s historic defeats in Baden-Wurttemberg and Rhineland-Palatinate regional elections over the weekend highlight the risk of a change in government in Germany later this year. Our Geopolitical Strategists previously highlighted that the market had…

The UK’s RICS House Price Balance Indicator increased to 52% in February from a revised 49%, beating expectations it would dip to 45%. While the headline number remains below October’s 66%, it is nevertheless a strong figure and the uptick suggests that…
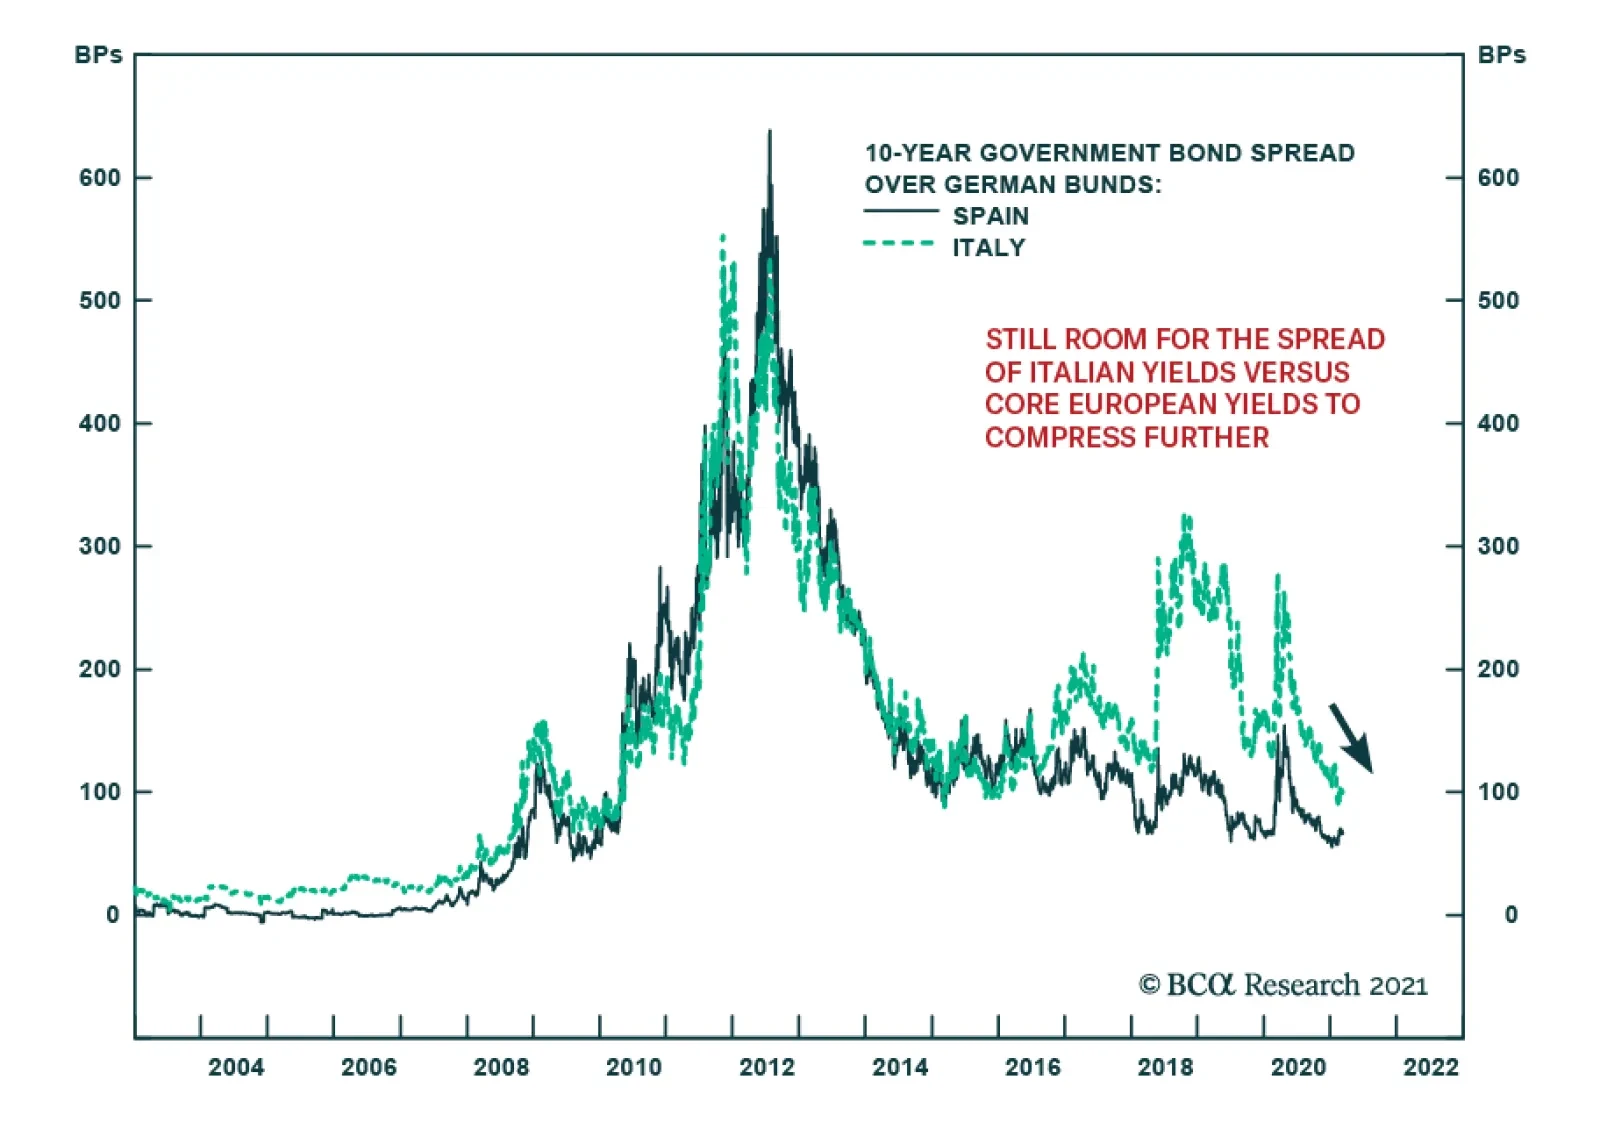
European assets rallied and peripheral spreads narrowed on Thursday on the ECB’s announcement it would keep the size of its PEPP envelop unchanged but would accelerate the pace of asset purchases next quarter. The ECB’s communication reassured markets that an…
Recent messages from the ECB’s Governing Council have been dissonant. GC member Panetta recently hinted that the backup in yields justified an expansion of the ECB’s PEPP program. Meanwhile, Chief economist Philippe Lane highlighted that too rapid a move in…
Highlights UK Interest Rates: A series of rolling shocks dating back to the 2008 financial crisis has prevented the Bank of England (BoE) from normalizing crisis-era levels of interest rates, even during years when inflation was overshooting the BoE 2% target. Brexit and COVID-19 were the last of those two shocks, but the growth- and inflation-dampening effects of both are fading fast. Implications for Gilts & GBP: The BoE’s dovish rhetoric, including hints that negative policy rates are still a viable option, looks increasingly inappropriate. The surge in real UK bond yields seen over the past month is just the beginning of a medium-term process of interest rate normalization. Maintain below-benchmark duration on Gilts, while downgrading UK allocations within dedicated global fixed income portfolios to neutral. The pound has upside in this environment, especially if depressed UK productivity starts to recover. Feature Chart 1UK Real Yields: Deeply Negative
Why Are UK Interest Rates Still So Low?
Why Are UK Interest Rates Still So Low?
The UK has become one of the more peculiar corners of the global fixed income universe. The outright level of longer-term Gilt yields is in the middle of the pack among the major advanced economies. The story is much different, however, when breaking those nominal UK yields into the real and inflation expectations components. The deeply negative real yields on UK inflation-linked Gilts are the lowest among the majors, even in a world where sub-0% real yields are prevalent in most countries (Chart 1). The flipside of that deeply negative real yield is a high level of inflation expectations. The breakeven inflation rate derived from the difference between the nominal and real 10-year Gilt yields is 3.3%, the highest in the developed “linkers” universe. Inflation expectations in UK consumer surveys are at similar levels, well above the 2% inflation target of the Bank of England (BoE), suggesting little confidence in the central bank’s ability or willingness to hit its own inflation goals. In this Special Report, jointly published by BCA Research Global Fixed Income Strategy and Foreign Exchange Strategy, we investigate why UK real interest rates have remained so persistently negative and assess the possibility of a shift in the low interest rate regime in a post-Brexit, post-pandemic UK – a move that could be quite bearish for UK fixed income markets and bullish for the British pound. Can The BoE Ignore Cyclical Upward Pressure On UK Bond Yields? The UK has suffered from a series of shocks, starting with the 2008 crisis, that have limited the ability of the BoE to attempt to tighten monetary policy. The 2011/12 European debt crisis hurt the UK’s most important trading partners, while the 2016 Brexit vote began a multi-year process of uncertainty over the future of those trading relationships. The COVID-19 pandemic is the latest shock, triggering a recession of historic proportions. The UK economy contracted by -10% in 2020, the largest decline since “The Great Frost” downturn of 1709. UK bond yields collapsed in response as the BoE cut rates to near-0% and reinforced that easy stance with aggressive quantitative easing and promises to keep rates unchanged over at the next few years. Today, UK financial markets are waking up to a world beyond the current COVID-19 lockdowns. The UK is running one of the world’s most successful vaccination rollouts, with 23 million jabs, or 35 per 100 people, already having been administered. UK Prime Minister Boris Johnson recently unveiled a bold plan to fully reopen the UK economy from the current severe lockdowns by mid-year. The UK government’s latest budget called for additional spending measures over the next year, including maintaining the work furlough scheme that has supported household incomes during the pandemic. As a result, UK growth expectations have exploded higher. According to the Bloomberg consensus economics survey, UK nominal GDP growth is expected to surge to 8.4% over calendar year 2021, an annual pace not seen since 1990 (Chart 2). Nominal Gilt yields have begun to reprice higher to reflect those surging growth expectations, with the 5-year/5-year forward Gilt yield climbing 67bps so far in 2021. Real Gilt yields are also moving higher with the 10-year inflation-linked Gilt climbing 38bps year to date, providing additional interest rate support that has fueled a surge in the pound versus the dollar (bottom panel). Our own BoE Monitor - containing growth, inflation and financial variables that typically lead to pressure on the central bank to adjust monetary policy – is signaling a reduced need for additional policy easing (Chart 3). The momentum of changes in longer-maturity UK Gilts and the trade-weighted UK currency index are usually correlated to the ebbs and flows of the BoE Monitor. The latest surge higher in yields and the currency suggests that the markets are anticipating the type of recovery that will put pressure on the BoE to tighten. Chart 2A Growth-Driven Repricing Of Gilts & GBP
A Growth-Driven Repricing Of Gilts & GBP
A Growth-Driven Repricing Of Gilts & GBP
Chart 3Gilts & GBP Sniffing Out A Less Dovish BoE?
Gilts & GBP Sniffing Out A Less Dovish BoE?
Gilts & GBP Sniffing Out A Less Dovish BoE?
It may take a while to see the BoE turn more hawkish, however. The BoE has become one of least active central banks in the world over the past decade. After the BoE cut its official policy interest rate, the Bank Rate, by 500bps during the 2008 financial crisis and 2009 recession, rates were kept in a range between 0.25% and 0.75% for ten consecutive years. The BoE cut rates aggressively in response to the COVID-19 pandemic, lowering the Bank Rate in March 2020 from 0.75% to 0.1%, where it still stands. The BoE has used quantitative easing (QE) and forward guidance to try and limit movements in bond yields whenever cyclical surges in inflation could have justified tighter monetary policy. That has led to an extended period of a negative BoE Bank Rate, something not seen since the inflationary 1970s (Chart 4). Back then, the BoE was lagging the surge in UK inflation, but still hiking nominal interest rates. Today, the central bank is keeping nominal rates near 0% with much lower levels of inflation. Chart 4Over A Decade Of Negative Real UK Interest Rates
Over A Decade Of Negative Real UK Interest Rates
Over A Decade Of Negative Real UK Interest Rates
Short-term interest rate markets are still pricing in a very slow response from the BoE to the current growth optimism. Only 36bps of rate hikes over the next two years are discounted in the UK overnight index swap (OIS) curve. This go-slow response is in line with the BoE’s guidance on future rate hikes which, similar to the language used by other central banks like the Fed, calls for no pre-emptive rate hikes before inflation has sustainably returned to the BoE target. That combination would be consistent with current forward market pricing on both short-term interest rates and inflation. Chart 5BoE Keeping Real Rates Well Below R*
BoE Keeping Real Rates Well Below R*
BoE Keeping Real Rates Well Below R*
In Chart 5, we show the real BoE Bank Rate, constructed by subtracting UK core CPI inflation from the Bank Rate. We also show a forward real rate calculated using the forward UK OIS and CPI swap curves. The market-implied path of the real Bank Rate shows very little change over the next decade, with the real Bank Rate expected to average around -2.5%. This is far below the estimates of a neutral UK real rate (or “r-star”) of just under 2%, as calculated by the New York Fed or recent academic studies. The neutral UK real rate has likely dipped because of the pandemic. The UK Office For Budget Responsibility (OBR) estimates that there has been a long-term “scarring” of the UK economy from COVID-19 through supply-side factors like weaker investment spending, lower productivity growth and diminished labor force participation – equal to three percentage points of the level of potential GDP.1 The BoE estimates a smaller “scarring” of 1.75 percentage points of potential output, but coming with a 6.5% reduction in the size of the UK capital stock. While these are significant reductions in the supply-side of the UK economy, they are not enough to account for the 4.5 percentage point difference between pre-pandemic estimates of the UK r-star and the market-implied path of the real BoE Bank Rate over the next decade. The implication is that the markets are not expecting the BoE to deviate from its strategy of doing very little with interest rates, even as growth recovers from the pandemic shock. That can be seen in the recent upturn in UK inflation expectations that is evident in both market-implied and survey-based measures. Chart 6UK Inflation Expectations Reflect BoE Policy, Not Actual Inflation
UK Inflation Expectations Reflect BoE Policy, Not Actual Inflation
UK Inflation Expectations Reflect BoE Policy, Not Actual Inflation
The 5-year/5-year forward UK CPI swap rate now sits at 3.6%, not far off the 3.3% level of 5-10 year consumer inflation expectations from the latest YouGov/Citigroup survey (Chart 6). The fact that inflation expectations can remain so elevated at a time when headline CPI inflation is struggling to avoid deflation is striking. This indicates a belief that the BoE will do very little in the future to stop a booming UK economy that is expected to put sustained downward pressure on the UK unemployment rate over the next few years (bottom panel). This is from a relatively low starting point of the unemployment rate given the massive government support programs that have limited the amount of pandemic-related layoffs over the past year. The BoE should have reasons to be more concerned about a resurgence of UK inflation. In its latest Monetary Policy Report, the BoE published estimates showing that the entire collapse in UK inflation in 2020 was attributable to weaker demand for goods and services – especially the latter (Chart 7). This suggests that UK inflation could rebound by a similar amount as the UK economy reopens from pandemic lockdowns. According to the UK OBR, 21% of UK household spending is on items described as “social consumption”, like restaurants and hotels (Chart 8). This is a much larger proportion than seen in other major developed economies (excluding Spain) and explains why consumer spending plunged so much more dramatically in the UK during 2020 than in other countries. Chart 7Only A Temporary Drag On UK Inflation From COVID-19
Why Are UK Interest Rates Still So Low?
Why Are UK Interest Rates Still So Low?
Chart 8UK Households More Focused On “Social Consumption”
Why Are UK Interest Rates Still So Low?
Why Are UK Interest Rates Still So Low?
If the UK pandemic-related restrictions are eased as planned over the next few months, the potential for a sharp snapback in UK consumer spending is significant. The BoE estimates that UK households now have £125bn of “excess” savings thanks to government income support and reduced spending on discretionary items like dining out and vacations. This is the fuel to support a rapid recovery in consumption over the next 6-12 months, especially as personal income growth will get a boost as furloughed workers begin returning to work (Chart 9). Chart 9UK Economy On The Mend
UK Economy On The Mend
UK Economy On The Mend
Chart 10Big Boost To UK Growth From Housing & Government Spending
Big Boost To UK Growth From Housing & Government Spending
Big Boost To UK Growth From Housing & Government Spending
A similar argument can be made for investment spending – the BoE estimates that UK businesses have amassed £100bn pounds of excess cash, and the latest reading on the BoE’s Agents' Survey of UK firms shows a slight increase after months of decline (bottom panel). With a Brexit deal with the EU finally reached at the start of 2021, UK businesses can also look to increase investment spending that had been delayed because of the years of Brexit uncertainty. The UK economy is already getting a boost from a recovery in the housing market fueled by low interest rates, high household savings and improving consumer confidence. Mortgage approvals have soared to the highest level since 2007, while house prices are now expanding at a 6.4% annual rate (Chart 10). Add it all up, and the economic momentum in the UK is positive and likely to accelerate further in the coming months as a greater share of the population becomes vaccinated. The BoE’s dovish policy stance is likely to appear increasingly inappropriate relative to accelerating UK growth and inflation trends over the next several months. Thus, on a cyclical basis, UK bond yields, both nominal and real, have more upside potential even after the recent increase. Bottom Line: A series of rolling shocks dating back to the 2008 financial crisis has prevented the Bank of England (BoE) from normalizing crisis-era levels of interest rates, even during years when inflation was overshooting the BoE 2% target. Brexit and COVID-19 were the last of those two shocks, but the growth- and inflation-dampening effects of both are fading fast. Structural Forces Keeping UK Interest Rates Low Are Fading Looking beyond the cyclical drivers, the structural factors that have held down UK interest rates in recent years are also starting to fade. The supply side of the UK economy has suffered because of Brexit uncertainty. The OECD’s estimate of potential UK GDP growth fell from 1.75% in 2015 to 1.0% in 2020 (Chart 11). This was mostly due to declining productivity growth – a consequence of years of very weak business investment. The 5-year annualized growth rate of real UK investment spending fell to -3% in 2020, a contraction only matched during the past 30 years after the 1992 ERM crisis and 2008 financial crisis. That plunge in investment coincided with almost no growth in UK labor productivity over that same 5-year window. Chart 11The Road To Faster Potential UK Growth Starts With Investment
The Road To Faster Potential UK Growth Starts With Investment
The Road To Faster Potential UK Growth Starts With Investment
Slowing population growth also weighed on UK potential growth, slowing to the lowest level in 15 years in 2019 as immigration from EU countries to the UK fell sharply. COVID-19 also hurt immigration flows into the UK last year. The UK Office for National Statistics estimated that the non-UK born population in the UK fell by 2.7% between June 2019 and June 2020. Diminished potential GDP growth is a factor that would structurally reduce the equilibrium real UK interest rate. We are likely past the worst for that downward pressure on potential growth and real rates. Population growth should also stabilize as the UK borders open up again and pandemic travel restrictions are loosened. Measured productivity is already starting to see a cyclical recovery, while investment spending is likely to improve as cash-rich UK companies began to ramp up capital spending plans deferred by Brexit and COVID-19. While the process leading from faster investment spending into speedier productivity growth is typically slow, the key point is that the worst of downtrend is likely over. This is an important development that has implications for UK fixed income markets. When looking at an international comparison of real central bank policy rates within the developed economies, the UK has fallen into the grouping of countries with persistently negative policy rates, namely Japan, the euro area, Switzerland, Sweden and Norway (Chart 12). We have dubbed that group the “Secular Stagnation 5”, after the term made famous by former US Treasury Secretary Lawrence Summers describing a state where the “natural” real rate of interest (r-star) that equates savings with investment is structurally negative. Chart 12Does The UK Belong In The 'Secular Stagnation 5'?
Does The UK Belong In The 'Secular Stagnation 5'?
Does The UK Belong In The 'Secular Stagnation 5'?
Does the UK belong in the “Secular Stagnation 5”? As a way to assess this, we made some comparisons of selected UK data with the same data for those five countries. When looking at potential GDP growth and population growth, the UK sits right in the middle of the range of those growth rates for the five countries (Chart 13). UK productivity growth has underperformed the others recently but, prior to the 2016 Brexit shock, UK productivity was also in the middle of the Secular Stagnation 5 range. Chart 13Brexit Became A Major Hit To UK Potential Growth
Brexit Became A Major Hit To UK Potential Growth
Brexit Became A Major Hit To UK Potential Growth
Chart 14UK Economy Less Focused On Investment & Exports
UK Economy Less Focused On Investment & Exports
UK Economy Less Focused On Investment & Exports
On other measures, the UK is nothing like those other countries. The UK’s economy is far less geared towards exports and investment (Chart 14) and is more tilted towards consumer spending. That can be seen most clearly when looking at the data on savings/investment balances. The UK continuously runs a current account deficit, as opposed to the persistent surpluses seen in the Secular Stagnation 5 (Chart 15). Put another way, the UK is not a “surplus” country that saves more than it invests on a structural basis, a condition that typically depresses real interest rates. Chart 15The UK Is Not A Surplus Country
The UK Is Not A Surplus Country
The UK Is Not A Surplus Country
Chart 16Gilts Will Not Become A Low-Beta Market
Gilts Will Not Become A Low-Beta Market
Gilts Will Not Become A Low-Beta Market
Based on these cross-country comparisons, it is unusual for the UK to have such persistently low real interest rates. This has implications for UK bond yields. Over the past few years, Gilts have been transitioning from a status as a “high yield beta” market – whose yield movements are more correlated to swings in the overall level of global bond yields. The lower beta markets are in countries like Germany, France and Japan – all members of the Secular Stagnation club (Chart 16). The UK does not appear to warrant a permanent membership in that low-yielding group, based on structural factors. That is evident when looking at how Gilt yields are rising even with the BoE absorbing an increasing share of the stock of outstanding Gilts (bottom panel). We conclude that the transition of the UK to a low-beta market is related to the Brexit uncertainty post 2016 and the pandemic shock that has hit the consumer-focused UK economy exceptionally hard – both factors that are set to fade over the next year. Bottom Line: The BoE’s dovish rhetoric, including hints that negative policy rates are still a viable option, looks increasingly inappropriate. The surge in real UK bond yields seen over the past month is just the beginning of a medium-term process of interest rate normalization. Investment Conclusions Chart 17Downgrade Gilts To Underweight
Downgrade Gilts To Underweight
Downgrade Gilts To Underweight
Our assessment of the cyclical and structural drivers of UK interest rates leads us to the following conclusions on UK fixed income and currency strategy: Duration: Maintain a below-benchmark exposure to UK interest rate movements. Gilt yields will rise by more than is discounted in the forwards over the next 6-12 months (Chart 17), coming more through rising real yields as the UK economy continues its post-Brexit, post-pandemic recovery. Country Allocation: Downgrade strategic allocations to UK Gilts to neutral from overweight in dedicated fixed income portfolios. Our long-standing view that Brexit uncertainty would lead to the outperformance of Gilts versus other developed bond markets is no longer valid. It is still too soon to move to a full underweight stance on Gilts – a better opportunity will develop by mid-year once it is more evident that the current success on UK vaccinations leads to a faster reopening of the UK economy. Yield Curve: Maintain positioning for a bearish steepening of the UK Gilt yield curve. While there is limited scope for more steepening through an even larger increase in inflation breakevens from current elevated levels, the long end of the Gilt curve can move higher by more than the front end as the market re-rates Gilts to a higher-beta status with a higher future trajectory for UK interest rates. Corporate Credit: Downgrade UK investment grade corporate bond exposure to neutral from overweight in dedicated fixed income portfolios. UK corporate spreads have returned to the 2017 lows and, while an improving growth dynamic is not overly bearish for credit, there is no longer a compelling valuation-based case for staying overweight UK investment grade corporates. This move brings our recommended UK allocation in line with our neutral stance on US and euro area investment grade corporates. Chart 18GBP/USD Appears Cheap On A PPP Basis
GBP/USD Appears Cheap On A PPP Basis
GBP/USD Appears Cheap On A PPP Basis
Chart 19Low Productivity Is Weighing On The Pound
Low Productivity Is Weighing On The Pound
Low Productivity Is Weighing On The Pound
Currency: A growth-driven path towards interest rate normalization should be positive for the British pound, which remains undervalued versus the US dollar on a purchasing power parity basis (Chart 18).2 A move to 1.45 on GBP/USD is possible within the next six months. A broader move towards pound strength will require an improvement in business investment, as the trade-weighted pound looks fairly valued on our productivity-based model (Chart 19). We do maintain our view that EUR/GBP can approach 0.80 by year-end based on a relatively stronger cyclical improvement in UK growth versus the euro area. Robert Robis, CFA Chief Fixed Income Strategist rrobis@bcaresearch.com Footnotes 1 For further details on the OBR estimates of UK growth, inflation and fiscal policy, please see the March 2021 OBR Economic & Financial Outlook, which can be found here: https://obr.uk/ 2 Please see BCA Research Foreign Exchange Strategy Report, "Thoughts On The British Pound", dated December 18, 2020, available at fes.bcaresearch.com.
In the US, the inflation breakeven curve has inverted, with the 5-year breakeven rates standing at their highest levels relative to the 5-year/5-year forward rates since the pre-GFC days. In Europe, the CPI swap curve has greatly flattened but has yet to…
Dear client, In addition to this week’s abbreviated report, we are also sending you a Special Report on currency hedging, authored by my colleague Xiaoli Tang. Xiaoli’s previous work mapped out a dynamic hedging strategy for developed market equity investors in various home currencies. In this report, she extends the work to emerging market exposure. I hope you will find the report insightful. Next week, in lieu of our weekly report on Friday, we will be sending you a joint Special Report on the UK on Tuesday, together with our Global Fixed Income colleagues. Kind regards, Chester Highlights The DXY index is up for the year, but further gains will be capped at 2-3% from current levels. Long yen positions are offside amid the dollar rally. This should wash out stale longs, and underpin the bull case. Lower the limit-sell on the gold/silver ratio to 68. We were stopped out of our short AUD/MXN position amidst a broad-based selloff in EM currencies. We are reinitiating the trade this week. Feature Chart I-1The Dollar Has Been Strong In 2021
The Dollar Has Been Strong In 2021
The Dollar Has Been Strong In 2021
The DXY index has once again kissed off the 90 level and is gaining momentum in March. Year-to-date, the DXY index is up 1.1%. This performance has been particularly pronounced against other safe haven currencies, such as the Swiss franc and the Japanese yen. GBP and AUD have fared rather well in this environment (Chart I-1). As the “anti-dollar,” the euro has also suffered. Our technical indicators continue to warn that the dollar still has upside. Net speculative positions are at very depressed levels, consistent with many sentiment indicators that are bearish USD. However, this time around, any dollar rally could be capped at 2-3%, in sharp contrast to the bounce we witnessed in March 2020. The Message From Dollar Technical Indicators Our dollar capitulation index has bounced from very oversold levels, and is now sitting above neutral territory (Chart I-2). The index comprises a standardized measure of sentiment, net speculative positioning and momentum. It is very rare that a drop in this index below the -1.5 level does not trigger a rebound in the dollar. This time around, the bounce has been rather muted. Chart I-2BCA Dollar Capitulation Index Suggests Some Upside
BCA Dollar Capitulation Index Suggests Some Upside
BCA Dollar Capitulation Index Suggests Some Upside
Part of the reason has been concentration around dollar short positions. Investors throughout most of the pandemic executed their bearish dollar bets through the euro, yen and the Swiss franc (countries that already had negative interest rates). Positioning on risk on currencies such as the Australian dollar and the Mexican peso were neutral. This also explains the underperformance of the yen, as the dollar rises. From a sizing standpoint, ever since the dollar peaked in March 2020, counter-trend moves have been in the order of 2-3%. We expect this time to be no different. What To Do About The Yen The yen has been one of our core holdings on three fundamental pillars: it is cheap, it tends to rise during dollar bear markets and the economy in Japan is more hostage to deflation than the US. This bodes well for real rates in Japan, relative to the US. Over the last month, our long yen position has been put offside. First, demand for safe havens has ebbed as US interest rates have gapped higher (Chart I-3, panel 1). King dollar has once again become the safe haven of choice. As Chart I-1 illustrates, low beta currencies such as the Swiss franc and yen, that tend to do relatively well when the dollar is rallying, have underperformed. Yield curve control (YCC) in Japan is also negative for the yen as interest rates rise (panel 2). Economic momentum in Japan is also rolling over (panel 3). Prime Minister Yoshihide Suga’s mulling to extend the state of emergency in the Tokyo region could further cripple any Japanese economic recovery. Chart I-3A Healthy Reset In The Yen
A Healthy Reset In The Yen
A Healthy Reset In The Yen
Chart I-4USD/JPY Support Should Hold
USD/JPY Support Should Hold
USD/JPY Support Should Hold
For short-term investors, USD/JPY is very overbought and is approaching strong resistance (Chart I-4). In our view, a washing out of stale shorts would provide a healthy reset for the bear market to resume. Meanwhile, USD/JPY and the DXY change correlations during risk-off periods, where the yen appreciates versus the dollar. Therefore, a market reset is also positive for the yen. Housekeeping Chart I-5Remain Short AUD/MXN
Remain Short AUD/MXN
Remain Short AUD/MXN
We were stopped out of our short AUD/MXN trade last week for a loss of 6.1%. We are reinitiating the trade this week. The case for the trade, made a month ago, remains intact. A short-term recovery in the US economy, relative to the rest of the world, argues for an AUD/MXN short. In fact, a divergence has occurred between the BRL/MXN and the AUD/MXN exchange rate (Chart I-5). Domestic factors have certainly tempered the Brazilian real, but the underperformance of metal prices relative to oil in recent months is also a factor. We expect some convergence to occur, with MXN appreciating much faster than the AUD. Chester Ntonifor Foreign Exchange Strategist chestern@bcaresearch.com Currencies U.S. Dollar Chart II-1USD Technicals 1
USD Technicals 1
USD Technicals 1
Chart II-2USD Technicals 2
USD Technicals 2
USD Technicals 2
Recent data in the US have stepped up: Personal income rose by 10% in January, while personal spending rose by 2.4% month-on-month. The ISM report was stellar. The manufacturing PMI improved from 58.7 to 60.8 in February. Prices paid rose to 86. Factory orders were slightly above expectations at 2.6% month-on-month in January. The DXY index rose by 165 bps this week. The narrative of a counter-trend reversal in the DXY index isn playing out. As the story unfolds, it will be important to establish targets. Our bias is that the DXY stalls before 93-94 is reached. Report Links: Are Rising Bond Yields Bullish For The Dollar? - February 19, 2021 Portfolio And Model Review - February 5, 2021 Sizing A Potential Dollar Bounce - January 15, 2021 The Euro Chart II-3EUR Technicals 1
EUR Technicals 1
EUR Technicals 1
Chart II-4EUR Technicals 2
EUR Technicals 2
EUR Technicals 2
Recent data from the euro area remain weak: Core CPI in the Eurozone came in at 1.1%, in line with expectations. The unemployment rate declined from 8.3% to 8.1% in January. January retail sales were weak at -6.4% year-on-year. The euro fell by 1.7%% against the US dollar this week. It will be almost impossible for the euro to rise in an environment where the dollar is in a broad-based decline. Given elevated sentiment on the euro, a healthy reset is necessary for the bull market to resume. Report Links: Portfolio And Model Review - February 5, 2021 On Japanese Inflation And The Yen - January 29, 2021 The Dollar Conundrum And Protection - November 6, 2020 The Japanese Yen Chart II-5JPY Technicals 1
JPY Technicals 1
JPY Technicals 1
Chart II-6JPY Technicals 2
JPY Technicals 2
JPY Technicals 2
Recent data from Japan has been marginally positive: The employment report was positive, with the unemployment rate dipping to 2.9% and an improvement in the jobs-to-applicants ratio in January. Consumer confidence in February is rebounding from very low levels. The Japanese yen fell by 1.5% against the US dollar this week. The recovery in the Japanese economy is fragile, and tentative signs of a renewed lockdown will knock down confidence. In this transition phase, yen long positions could be hostage to losses. Longer-term, the yen is cheap and will benefit from a broad-based dollar decline. Report Links: On Japanese Inflation And The Yen - January 29, 2021 The Dollar Conundrum And Protection - November 6, 2020 The Near-Term Bull Case For The Dollar - February 28, 2020 British Pound Chart II-7GBP Technicals 1
GBP Technicals 1
GBP Technicals 1
Chart II-8GBP Technicals 2
GBP Technicals 2
GBP Technicals 2
Recent data out of the UK have been in line: Mortgage approvals rose 99K in January, in line with expectations. The construction PMI rose from 49.2 to 53.3 in February. Nationwide house prices are soaring, rising 6.9% in February on a year-on-year basis. The pound fell by 0.8% against the dollar this week. It is however the best performing currency this year. Our short EUR/GBP trade has benefited from faster vaccination in the UK (that could give way to a faster reopening of the economy) and a nice valuation starting point. Report Links: Portfolio And Model Review - February 5, 2021 The Dollar Conundrum And Protection - November 6, 2020 Revisiting Our High-Conviction Trades - September 11, 2020 Australian Dollar Chart II-9AUD Technicals 1
AUD Technicals 1
AUD Technicals 1
Chart II-10AUD Technicals 2
AUD Technicals 2
AUD Technicals 2
Recent data in Australia was robust: Home lending remained in an uptrend. Owner-occupied loans increased by 11% in January, while investor loans increased by 9.4%. Terms of trade are soaring, rising 24% year-on-year in February. The current account surplus came in near a record A$14.5 billion in Q4. GDP grew by 3.1% QoQ in Q4. The Aussie fell by 1.8% his week. Terms of trade will continue being a tailwind for the AUD/USD. We also like the AUD/NZD cross, as a valuation and terms-of-trade bet. However, we expect that any positive surprises in the US will hurt AUD relative to the Americas. One way to play this is by shorting AUD/MXN. Report Links: Portfolio And Model Review - February 5, 2021 Australia: Regime Change For Bond Yields & The Currency? - January 20, 2021 An Update On The Australian Dollar - September 18, 2020 New Zealand Dollar Chart II-11NZD Technicals 1
NZD Technicals 1
NZD Technicals 1
Chart II-12NZD Technicals 2
NZD Technicals 2
NZD Technicals 2
There was scant data out of New Zealand this week: Terms of trade rose by 1.3% in Q4. CoreLogic home prices rose 14.5% in February. The New Zealand dollar fell by 2.4% against the US dollar this week. The kiwi ranks as the most unattractive currency in our FX framework. For one, it has catapulted itself to the most expensive currency in our PPP models. Report Links: Portfolio And Model Review - February 5, 2021 Currencies And The Value-Versus-Growth Debate - July 10, 2020 Updating Our Balance Of Payments Monitor - November 29, 2019 Canadian Dollar Chart II-13CAD Technicals 1
CAD Technicals 1
CAD Technicals 1
Chart II-14CAD Technicals 2
CAD Technicals 2
CAD Technicals 2
Recent data from Canada was positive: The Nanos confidence index rose from 58.2 to 59.4 in February. Annualized 4Q GDP came in at 9.6%, above expectations. Building permits rose 8.2% month-on-month in January. The Canadian dollar fell 0.4% against the US dollar this week. Oil prices remain very much in an uptrend, which is underpinning the loonie. Better US economic performance in the near term should also help the CAD. Report Links: Will The Canadian Recovery Lead Or Lag The Global Cycle? - February 12, 2021 Currencies And The Value-Versus-Growth Debate - July 10, 2020 More On Competitive Devaluations, The CAD And The SEK - May 1, 2020 Swiss Franc Chart II-15CHF Technicals 1
CHF Technicals 1
CHF Technicals 1
Chart II-16CHF Technicals 2
CHF Technicals 2
CHF Technicals 2
Recent data out of Switzerland have been improving: Swiss GDP rose by 0.3% quarter-on-quarter in 4Q. The KOF leading indicator rose from 96.5 to 102.7 in February. The February manufacturing PMI rose from 59.4 to 61.3. Switzerland remains in deflation, with the core CPI that came in at -0.3% year-on-year in February. The Swiss franc fell by 2.6% against the US dollar this week. Safe -haven currencies continue to be laggards, as rates rise and gold falls to the wayside. This is bullish on procyclical currencies, and negative the Swiss franc. We are long EUR/CHF on this basis, but short USD/JPY purely as portfolio insurance. Report Links: Portfolio And Model Review - February 5, 2021 The Dollar Conundrum And Protection - November 6, 2020 On The DXY Breakout, Euro, And Swiss Franc - February 21, 2020 Norwegian Krone Chart II-17NOK Technicals 1
NOK Technicals 1
NOK Technicals 1
Chart II-18NOK Technicals 2
NOK Technicals 2
NOK Technicals 2
The data out of Norway has been robust: The unemployment rate fell from 4.4% to 4.3% The manufacturing PMI increased from 51.8 to 56.1 in February. The current account balance was robust in Q4. It should increase significantly in Q1 this year given the large trade balance in January. Being long the Norwegian krone is one of our high-conviction bets in the FX portfolio. The Norwegian krone fell by 1% against the US dollar this week, but outperformed the euro, amongst other currencies. The NOK ticks all the boxes of an attractive currency – cheap valuations, a liquidity discount, and primed to benefit from a global growth rebound. Report Links: Portfolio And Model Review - February 5, 2021 Revisiting Our High-Conviction Trades - September 11, 2020 A New Paradigm For Petrocurrencies - April 10, 2020 Swedish Krona Chart II-19SEK Technicals 1
SEK Technicals 1
SEK Technicals 1
Chart II-20SEK Technicals 2
SEK Technicals 2
SEK Technicals 2
Most Swedish data releases were in line with expectations: GDP came in at -0.2% quarter-on-quarter, below expectations. Retail sales rose 3.1% year-on-year, above expectations. The trade balance came in at a surplus of SEK 5.2 billion in January. The manufacturing PMI remained elevated at 61.6 in February. The Swedish krona fell by 2.4% against the US dollar this week. Manufacturing data is improving in Sweden but the economy remains hostage to COVID-19, compared to Norway. That is weighing on the krona. That said, Sweden is a highly levered play on the global cycle. Therefore, once the pandemic is behind us, the SEK will outperform. Report Links: Revisiting Our High-Conviction Trades - September 11, 2020 Updating Our Balance Of Payments Monitor - November 29, 2019 Where To Next For The US Dollar? - June 7, 2019 Trades & Forecasts Forecast Summary Core Portfolio Tactical Trades Limit Orders Closed Trades
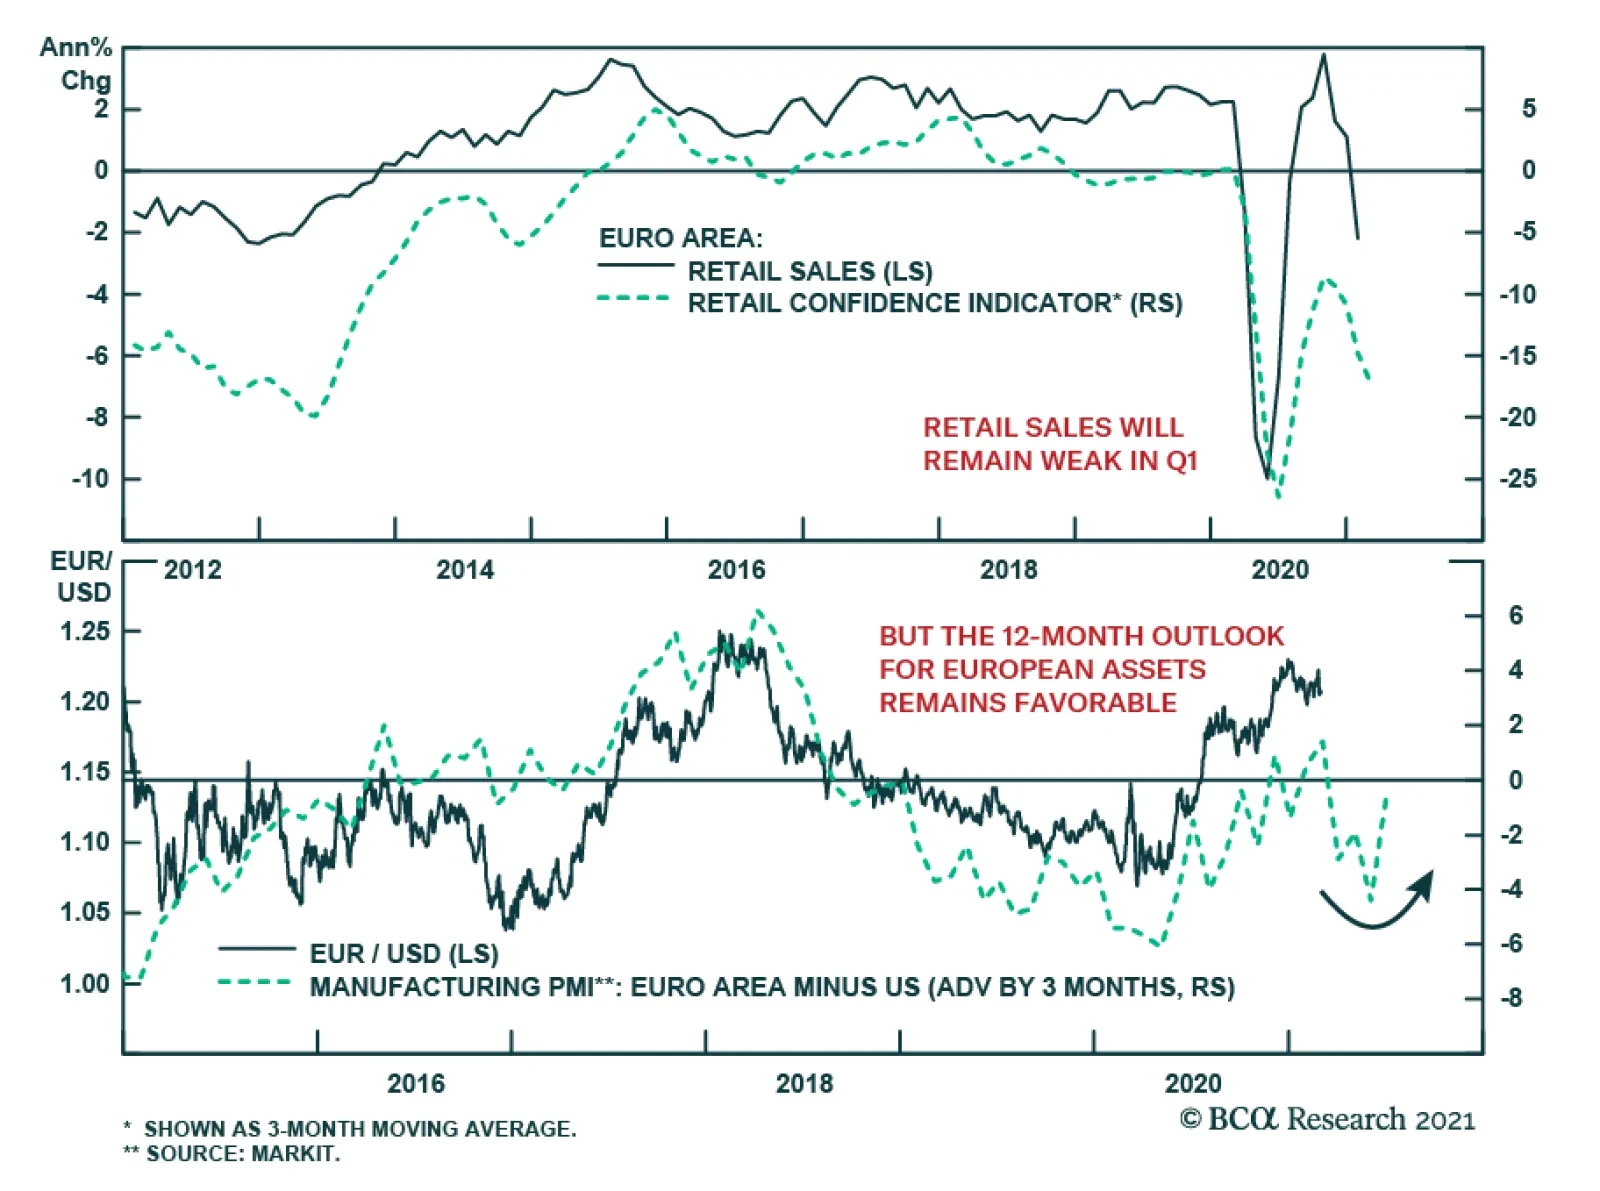
Euro Area retail sales collapsed in January, falling 5.9% m/m, disappointing expectations of a much more muted 1.4% m/m decline following a revised 1.8% m/m increase in December. Details from the report show a sharp 12% m/m drop in non-food products retail…
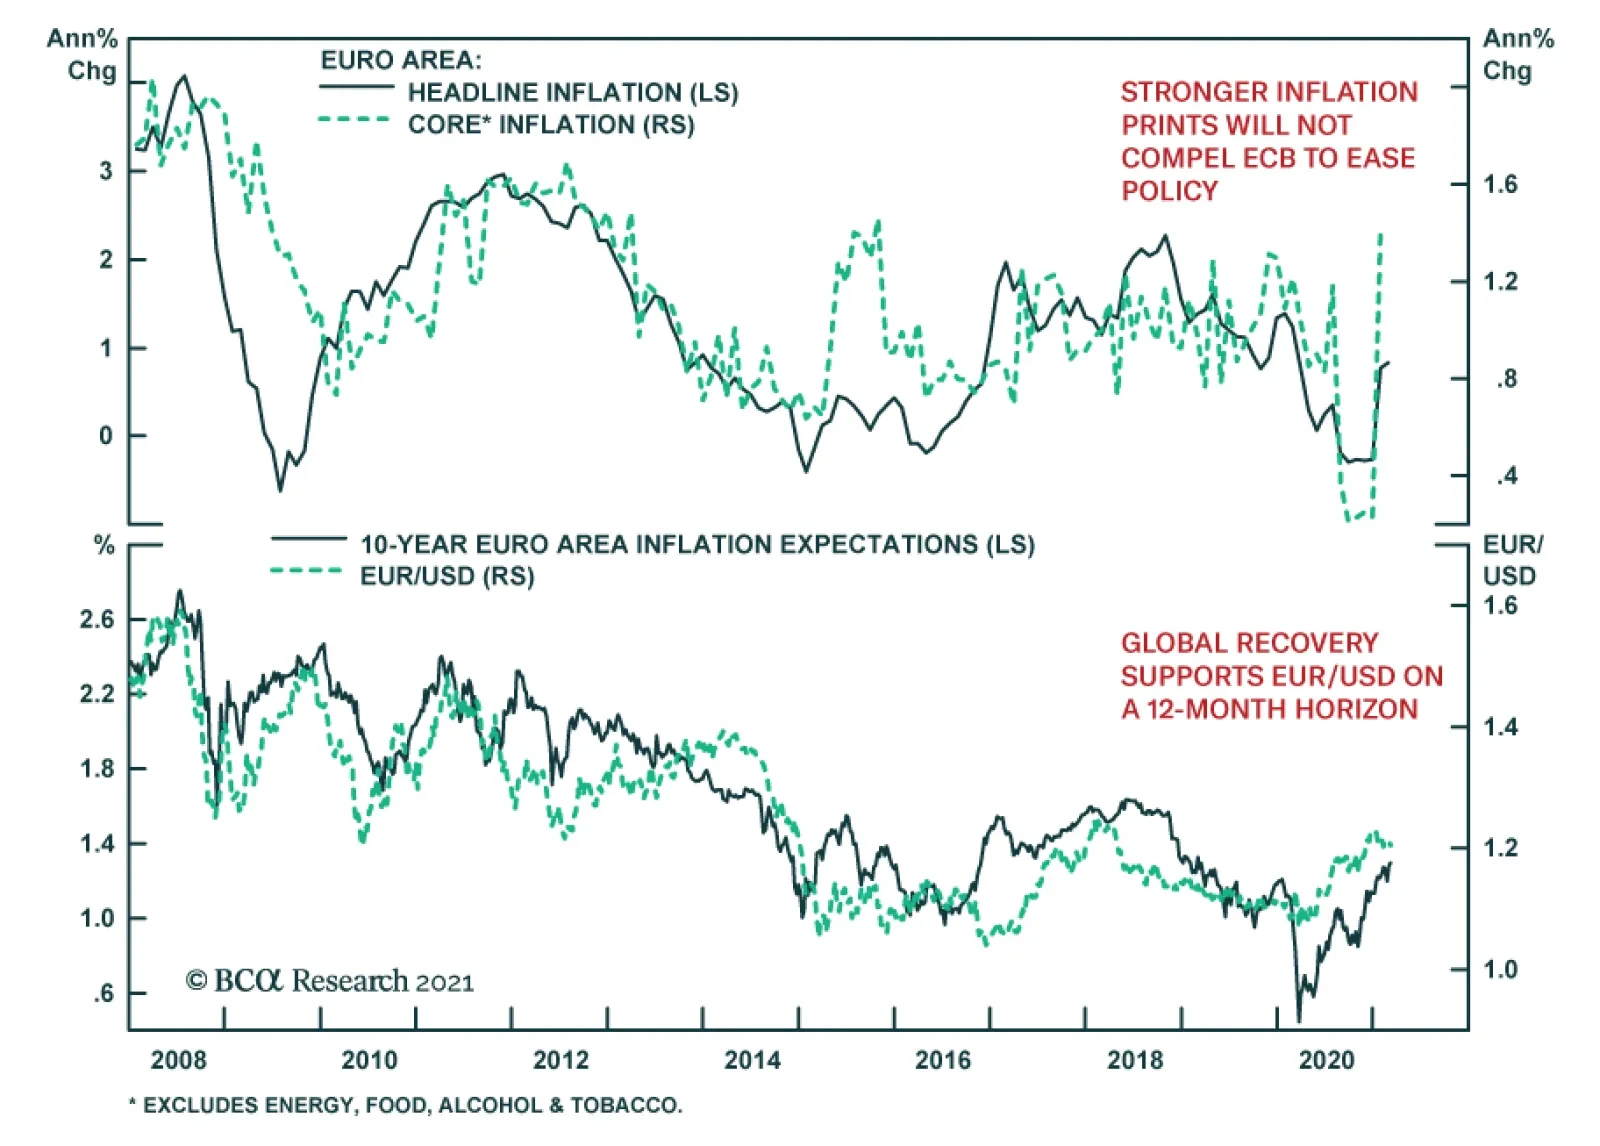
Preliminary figures show euro area inflation steady in February, marking the second consecutive monthly foray above zero after prices declined in the prior five months. The headline figure was unchanged at 0.9% y/y, while core CPI decelerated to 1.1% y/y from…