Europe
According to BCA Research's Foreign Exchange Strategy service, there is some evidence that the euro could gravitate to 1.50 over the next few years. The key assumption is that the equilibrium rate of interest will rise in the euro area relative to that in…

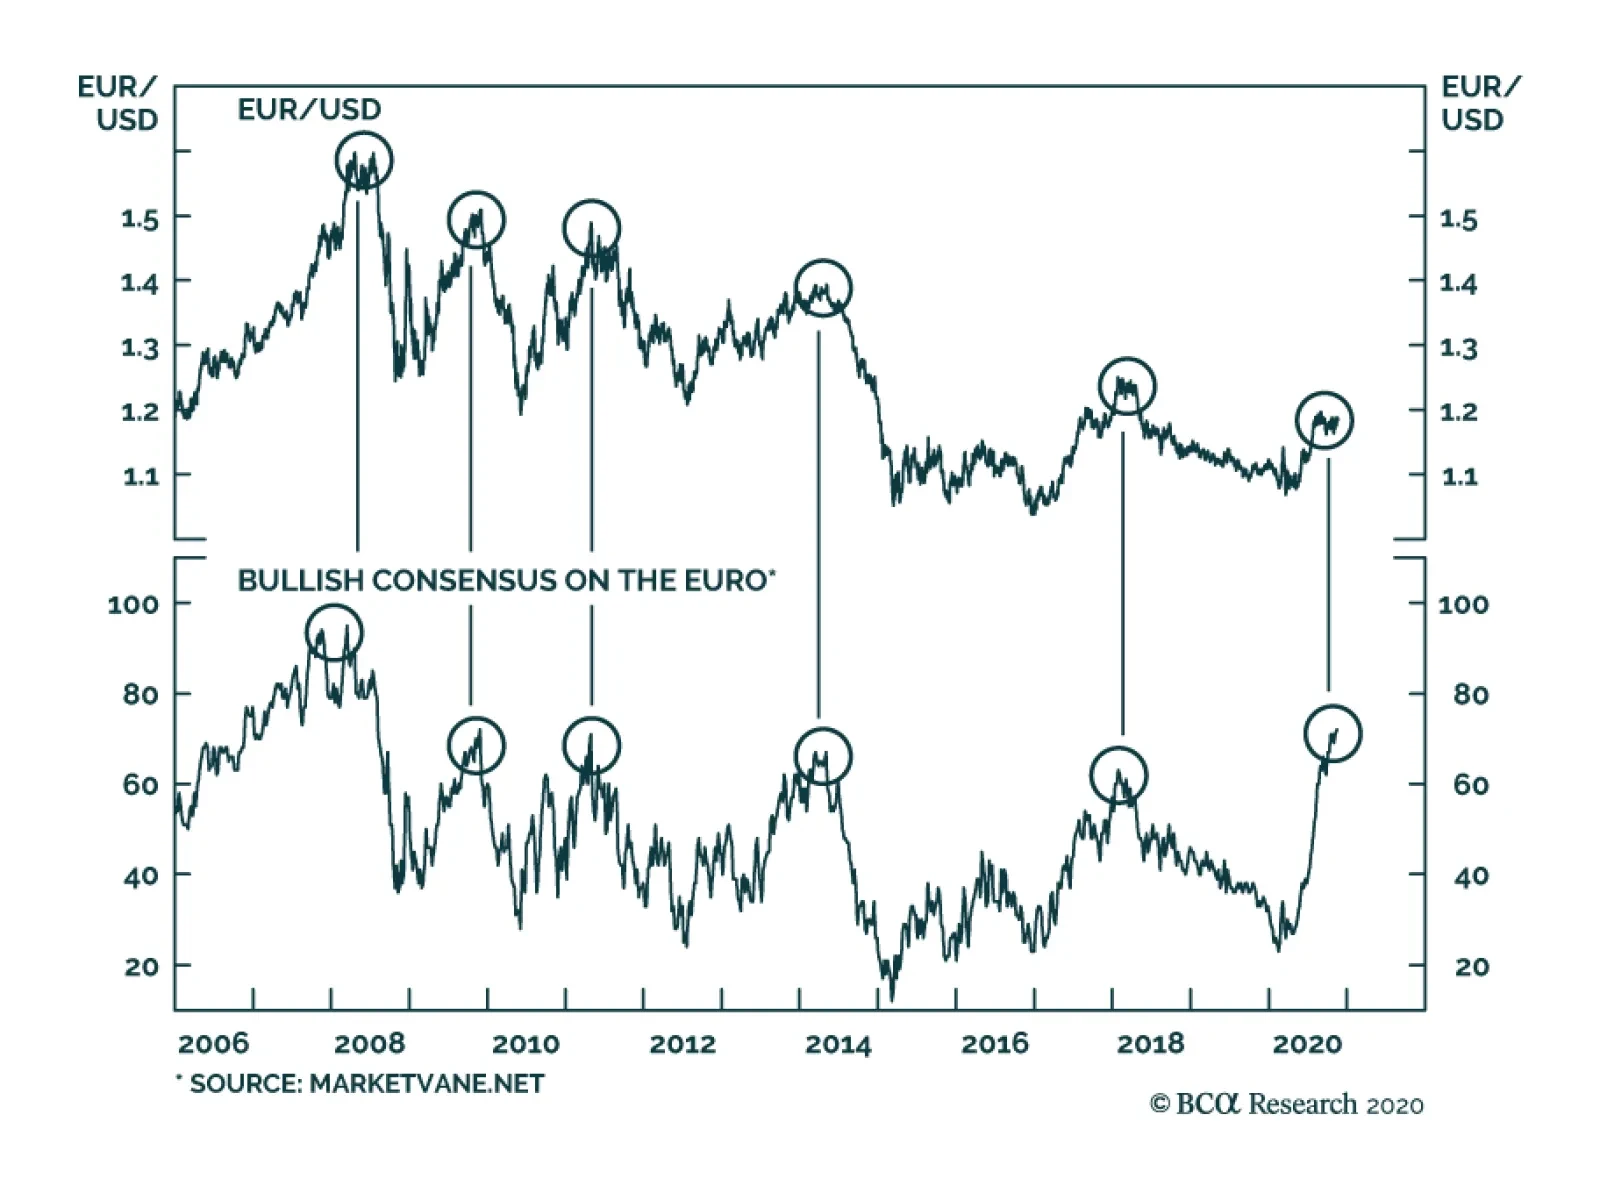
Highlights There is some evidence that the euro could gravitate to 1.50 over the next few years. The key assumption is that the equilibrium rate of interest will rise in the euro area relative to that in the US. Our bias is that fair value for the euro is closer to 1.35, or 15% above current levels. Over the very near term, the risks are tilted towards the downside. But while EUR/USD could punch below 1.15, an undershoot towards parity is highly unlikely. In our FX portfolio, we are long EUR/CHF and short EUR/GBP. We would buy the euro outright below 1.15. Feature The markets have rejoiced at the success of a few vaccine trials and are looking forward to a return to normalcy in 2021. Around the world, equity markets have rallied in symphony. Even secular dogs such as the Japanese Nikkei, which has been in a relative bear market for many decades, broke to fresh 21-year highs. Copper prices are rising fervently, and measures of risk, such as the VIX index or high-yield corporate spreads, are collapsing to pre-pandemic levels both in the US and Europe. As a procyclical currency, the euro has also been quite cheerful. Bullish sentiment on the euro is at a decade high and the currency has rallied 11% from the lows, commensurate with the drop in the DXY index (Chart 1). As a share of total open interest, 80% of speculators are bullish on the euro. Historically, sentiment at this level has been usually associated with the euro being closer to 1.50. Chart 1Sentiment On The Euro Is Elevated
Sentiment On The Euro Is Elevated
Sentiment On The Euro Is Elevated
Chart 2The Euro Is Lagging Copper Prices
The Euro Is Lagging Copper Prices
The Euro Is Lagging Copper Prices
The juxtaposition of much welcomed good news and elevated sentiment sets the euro in a very precarious tug of war. Standard theory suggests that the post-pandemic trade may already be priced into the common currency, given bullish sentiment. This augurs for a reversal. On the other hand, other measures also suggest that the rally in the euro has more room to run. For example, copper prices and the euro have tended to move together, and the red metal suggests EUR/USD should be above 1.20 (Chart 2). Similarly, EUR/JPY has lagged the stellar performance of global equity prices. Is the lagging performance of EUR/USD sending the right signal, suggesting caution? Or is the common-currency a coiled spring ready to head much higher in 2021? How To Forecast The Euro According to Bloomberg forecasts, the euro will be at 1.25 by the end of 2022 (Chart 3). By our reckoning, these forecasts are much too pessimistic. The key driver of the EUR/USD exchange rate is the relative growth profile between the euro area and the US, how that profile is likely to evolve in the future, and the implication for relative monetary policies. Anything else that tries to predict the euro is a subset of this much bigger question. How is growth in the euro area likely to evolve compared to the US? There are many ways to approach this issue, with surprisingly similar results. The key driver of the EUR/USD exchange rate is the relative growth profile between the euro area and the US. The first is just to take the IMF growth estimates at face value. According to the Fund, the euro area economy is projected to contract by 8.3% this year, almost double that of the US, which is 4.3%. But by next year, the economy is expected to bounce back more fervently. Euro area growth is expected to advance by 5.2% compared to 3.1% in the US. Much of the rise will be due to a surge in investment within the euro area, especially driven by pent-up demand in the peripheral countries. This growth acceleration is projected to continue well into 2023. Back-of-the envelope calculations suggest that this will pin EUR/USD around 1.35 (Chart 4) Chart 3Few Expect The Euro Above 1.25
Few Expect The Euro Above 1.25
Few Expect The Euro Above 1.25
Chart 4EUR/USD And Relative Growth
EUR/USD And Relative Growth
EUR/USD And Relative Growth
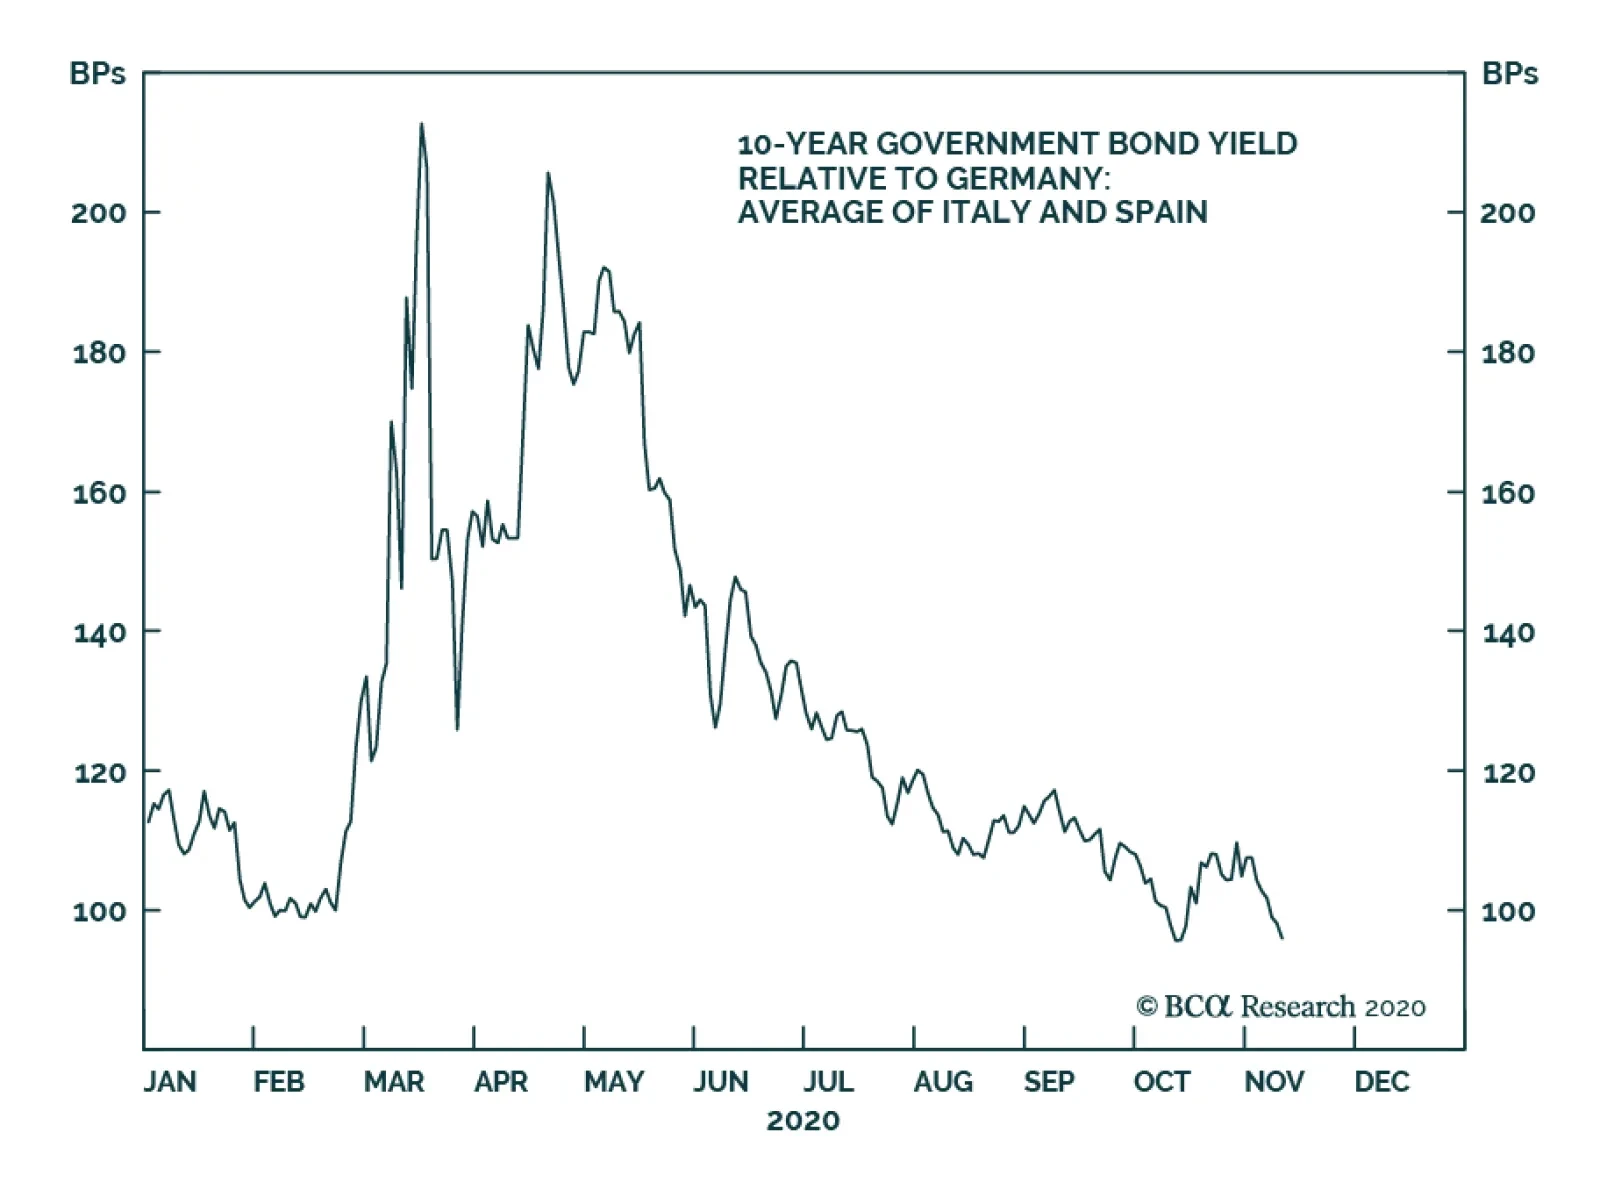
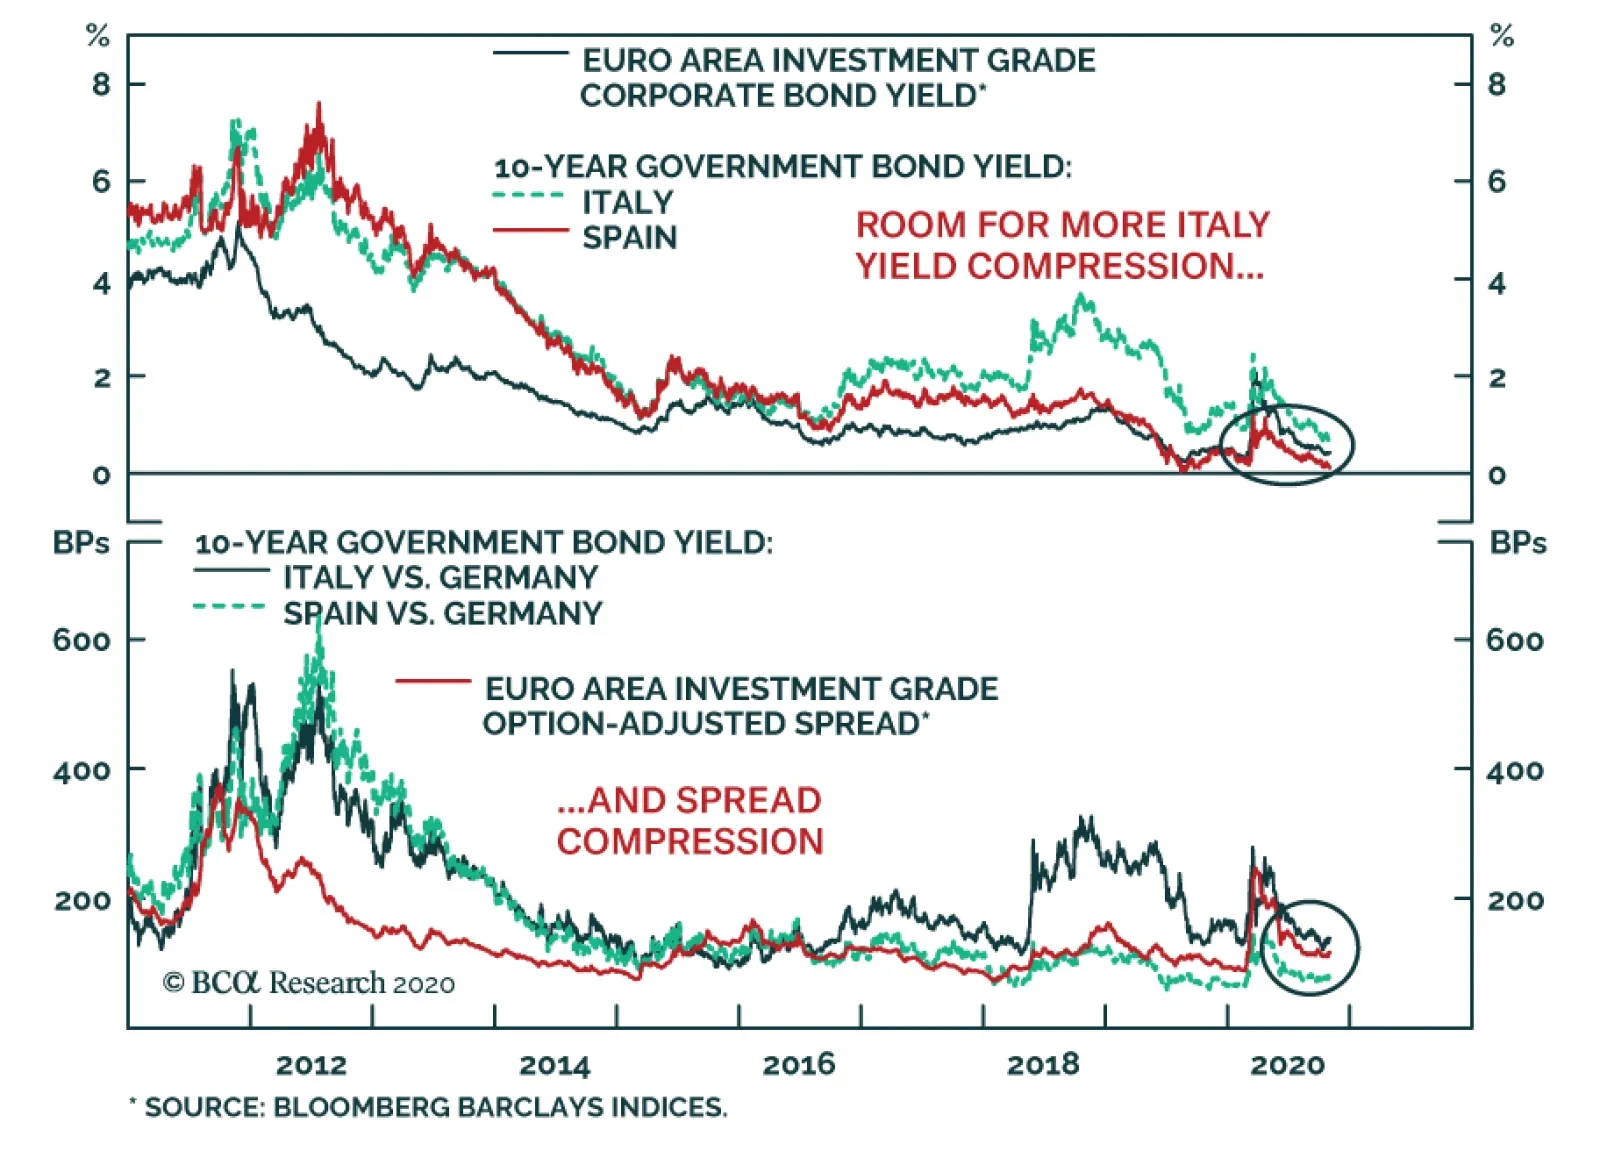
The Case For European Growth We tend to side with the IMF’s forecasts and even argue that this might actually be on the conservative side for the euro area. There are two major reasons for this, both of which are bilaterally important. First, the neutral rate of interest in the euro area may have moved a step function higher relative to the US. The standard dilemma for the euro zone is that interest rates have always been too low for the most productive nation, Germany, but too expensive for others, such as Spain and Italy. The silver lining is that the European Central Bank (ECB) has now lowered domestic interest rates and eased policy to the point where they are accommodative for all euro zone countries.1 Bond yields in peripheral Europe are collapsing relative to those in Germany and France (Chart 5). This makes it much easier for the less-productive, peripheral countries to borrow and invest. This will boost productivity, lifting the neutral rate. Chart 5The Neutral Rate In The Euro Area
The Neutral Rate In The Euro Area
The Neutral Rate In The Euro Area
Second and equally important, the periphery has become as competitive as the core. Through labor market reforms, internal devaluation, and recurring recessions throughout the last decade, unit labor costs in Greece, Ireland, Portugal, and Spain have converged with that in Germany and France. This has effectively eliminated the competitiveness gap that had accumulated over the past two decades (Chart 6). Even Italy, which remained saddled with a rigid and less productive workforce, has seen unit labor costs begin to crest. Chart 6Southern Europe Is Competitive Again
Southern Europe Is Competitive Again
Southern Europe Is Competitive Again
According to the Holston-Laubach-Williams estimates at the NY Fed, the natural rate of interest in the euro area is now higher than in the US, something that has rarely occurred over the 20-year history of the common currency. Based on these estimates, the euro could gravitate towards 1.50 (Chart 7). Chart 7EUR/USD And The Neutral Rate
EUR/USD And The Neutral Rate
EUR/USD And The Neutral Rate
US Versus Europe Chart 8Productivity In Europe Has Lagged
Productivity In Europe Has Lagged
Productivity In Europe Has Lagged
In today’s world, 1.50 for the euro is certainly very high and will surely stir up some action from the ECB well before we approach these levels. As most of my colleagues would argue, no central bank wants a strong currency.2 But how can we gauge the above premise that the neutral rate of interest should be higher in the euro area due to the tectonic shifts over the last few years? One way is to look at trend productivity growth. Since the 1960s, up until the Great Financial Crisis, trend productivity growth was around 2.2% in the US and 2.8% in the euro area. However, since 2009, productivity growth has been 0.6% per year in the euro area and 1.1% in the US (Chart 8). In other words, the European debt crisis has substantially subdued productivity growth in the euro area. If indeed the crisis is behind us, and we assume European productivity growth returns back to trend over the next 10 years, while making up for the shortfall relative to the US, this will pin it at roughly 1.6% higher in Europe relative to the US. Cumulatively, that is a rise of around 20%. Meanwhile, we highlighted last week that the euro was undervalued by over 10%.3 This pins the euro above 1.50. The Euro At Parity And Inflation Chart 9US Versus Euro Area Inflation
US Versus Euro Area Inflation
US Versus Euro Area Inflation
While the euro might gravitate higher in the next few years, it is unlikely to do so in a straight line. Meanwhile, deflation is a key near-term threat for the euro (Chart 9). With the ECB clearly telegraphing that it will do more easing in December, the relative monetary policy stance is not favorable. That said, there are three key points to consider about inflation. First, most G10 central banks were unable to meet their inflation mandate when output gaps were closing and the economy was at full employment. This makes it less likely they will meet their mandate anytime soon. This is not just an ECB problem, but one for the Fed, BoJ, and even the RBA. Second, inflation tends to be a global phenomenon in the developed world, meaning desynchronized cycles in inflation dynamics are quite rare. Finally, with balance sheets expanding everywhere in the G10, the potential for higher inflation once output gaps close will be universal. European productivity growth will have to outpace that in the US by roughly 1.6%, to play catch up. Going forward, an agreement on the mutualization of European debt means we can begin to expect more synchronized business cycles as fiscal stabilizers kick in. The reason is that both fiscal and monetary policy can now be synchronized across member states. This makes shortfalls in inflation less likely. Finally, while deflation can be a sign of an expensive currency, there is little evidence that this is the case for the euro. The euro area continues to sport very healthy trade and current account surpluses, a sign that the euro remains very competitive among its trading partners. Intra-European trade represents a large share of cross-border transactions in Europe, meaning currency considerations are less important. In 2019, most member states had a share of intra-EU exports of between 50% and 75%. The bottom line is that disappointing inflation dynamics could lead to a knee-jerk selloff in the euro, but this should be an opportunity to accumulate long positions. The Cyclical Catalyst Ultimately, European growth is cyclically tied to export growth. And with a huge concentration of cyclical sectors, such as financials, industrials, materials and energy, in European bourses, the euro tends to be largely driven by pro-cyclical flows. Earnings revisions between the euro area and the US have generally led the EUR/USD exchange rate by about 9-12 months (Chart 10). Chart 10EUR/USD Tracks Relative Profits
EUR/USD Tracks Relative Profits
EUR/USD Tracks Relative Profits
So far, the signs are positive. The impulse from Chinese credit is providing a release valve for European exports (Chart 11). So even if social distancing remains in place for longer than people expect, it still allows economies that are geared more towards manufacturing such as Europe, Japan, and China to keep churning higher. This could boost European earnings in a meaningful way. Chart 11Chinese Demand For European Goods
Chinese Demand For European Goods
Chinese Demand For European Goods
Fortunately for investors, European equities, especially those in the periphery, remain unloved, given that they are trading at some of the cheapest cyclically adjusted price-to-earnings multiples in the developed world (Chart 12A). Over the next decade, it would be surprising if some of these “old economy” stocks did not unwind their discount via both rising earnings and multiples. Many emerging markets, including China, still depend on “old-economy” materials such as oil, and industrial machinery, that Europe sells. The impulse from Chinese credit is providing a release valve for European exports. Even in the commodity space, cyclical metals like copper are still massively underperforming safe havens like gold. This has largely tracked the discount between European stocks and US stocks. A bet on a reversal could prove very profitable (Chart 12B). Chart 12AEuro Stocks Are Cheap
Euro Stocks Are Cheap
Euro Stocks Are Cheap
Chart 12BEuro Stocks Could Rerate
Euro Stocks Could Rerate
Euro Stocks Could Rerate
Chester Ntonifor Foreign Exchange Strategist chestern@bcaresearch.com Footnotes 1 Please see Foreign Exchange Strategy Weekly Report, "EUR/USD And The Neutral Rate Of Interest," dated June 14, 2019, available at fes.bcaresearch.com 2 Please see Global Fixed Income Strategy Weekly Report, "Nobody Wants A Strong Currency," dated November 17, 2020, gfis.bcaresearch.com 3 Please see Foreign Exchange Strategy Weekly Report, "Updating Our PPP Models," dated November 13, 2020. fes.bcaresearch.com Trades & Forecasts Forecast Summary Core Portfolio Tactical Trades Limit Orders Closed Trades
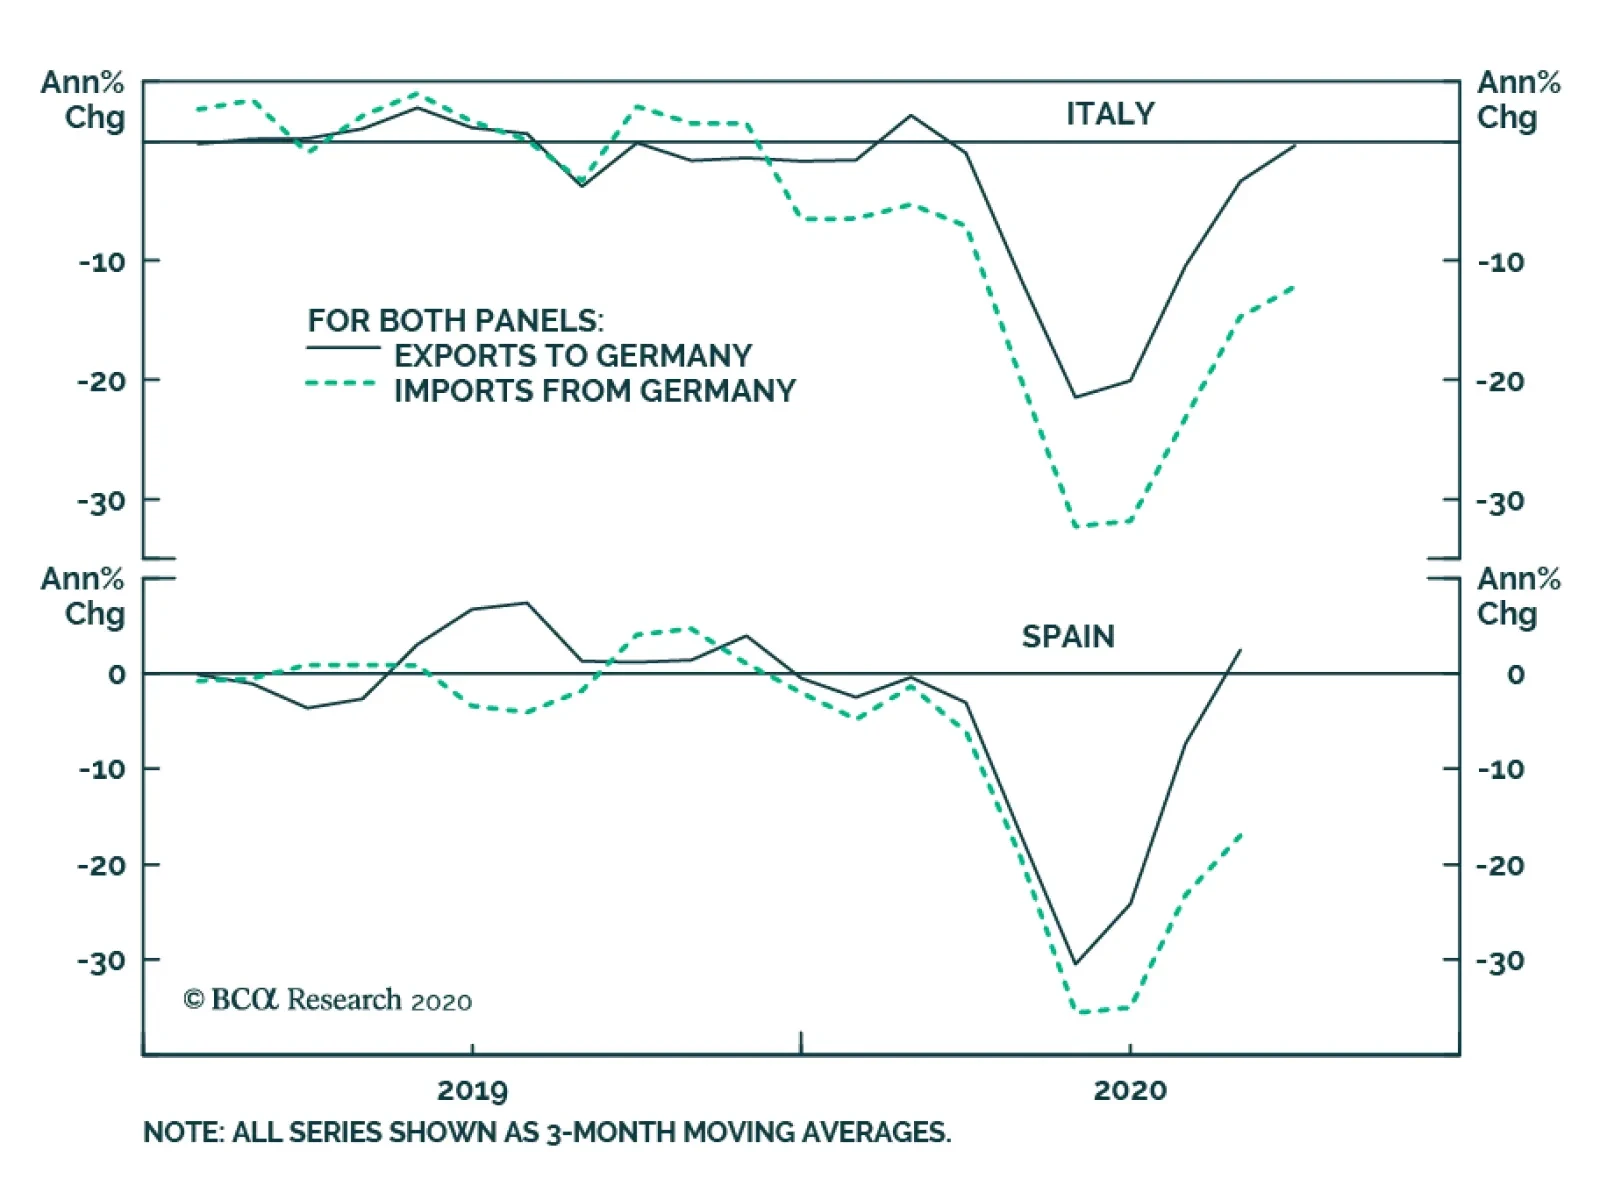
In an Insight published yesterday, we noted that the euro area is now projected to contract in Q4, as a result of the recent second wave in COVID-19 cases and the associated lockdown measures to suppress its spread. We also noted that France, Italy, and Spain…
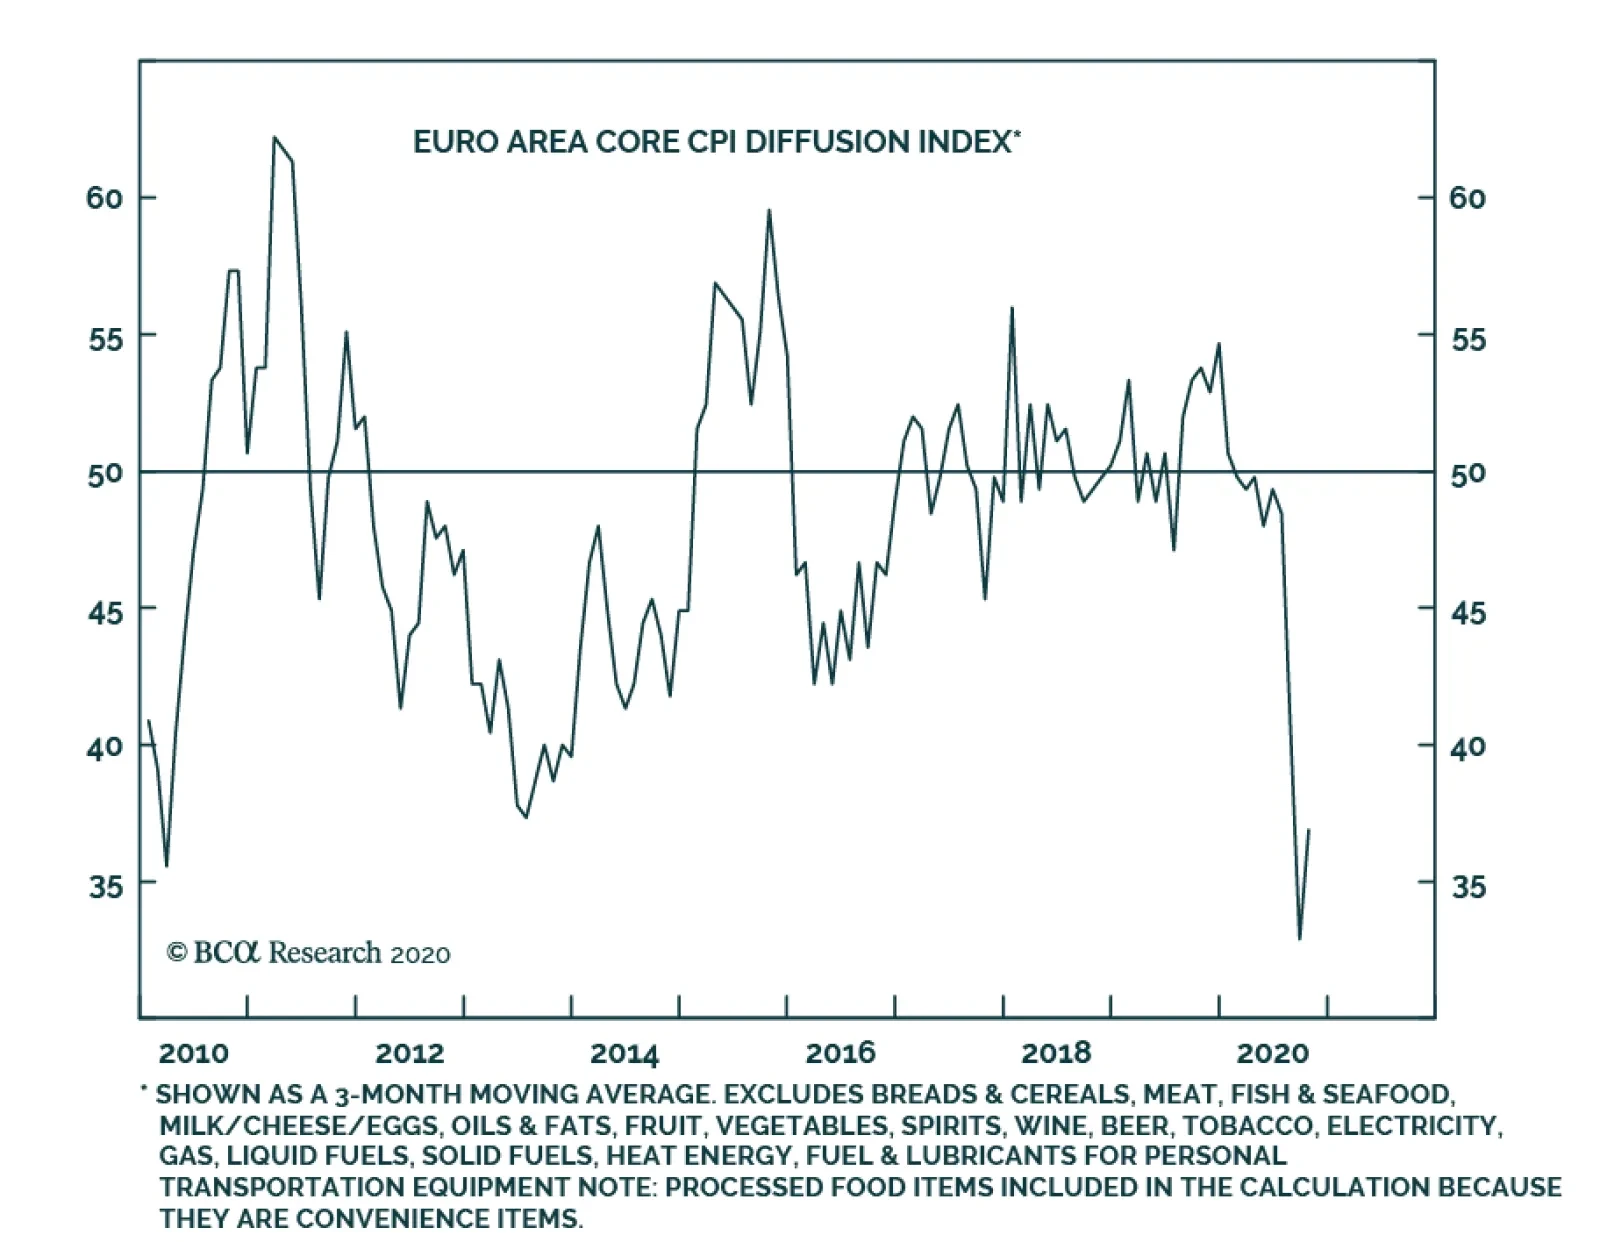
The chart above presents a diffusion index for euro area core inflation. The index is calculated based on the number of CPI subcomponents whose inflation rates are accelerating (i.e. a rising year-over-year growth rate), and includes a total of 75…
Yesterday, Christine Lagarde provided a clear signal that vaccine optimism would not prevent the ECB from easing further in December, reinforcing the message that she gave at the last ECB meeting: that the central bank would “recalibrate its instruments”…
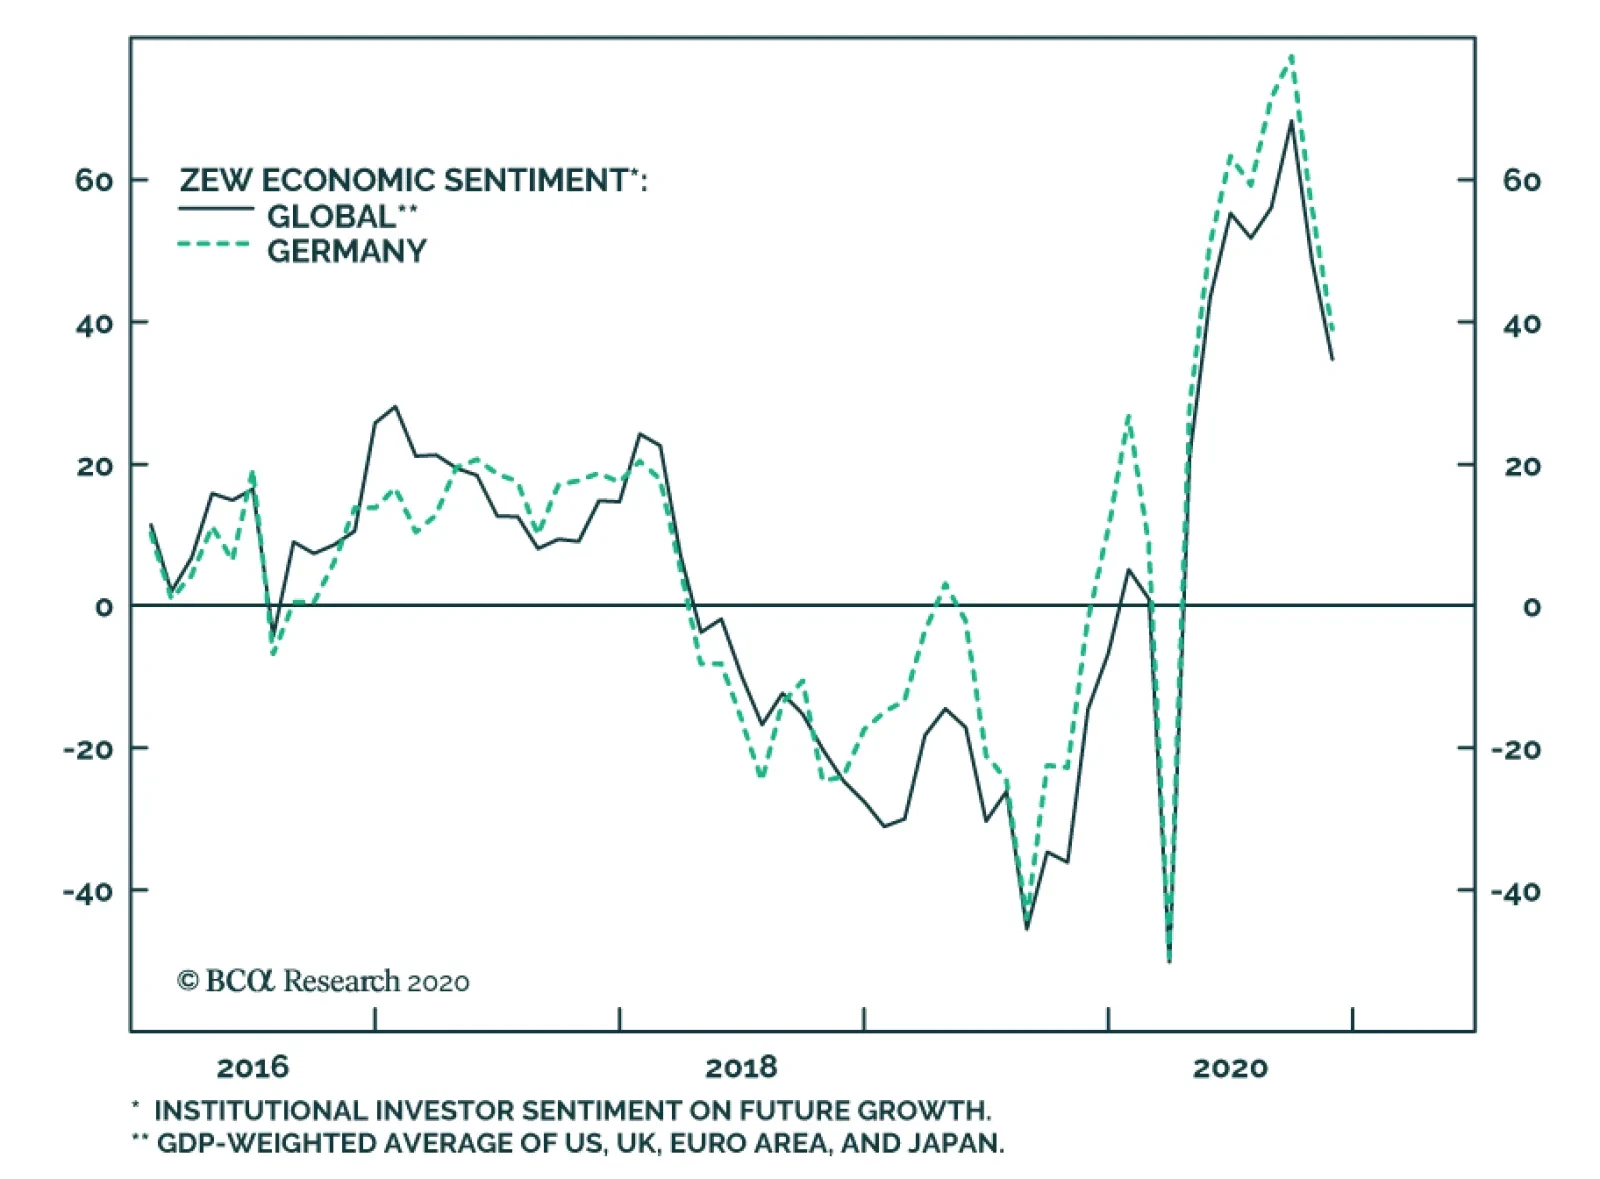
The ZEW survey of German investor sentiment plunged in November, declining to 39 from 56.1 in October. It fell short of expectations and marks the second consecutive monthly decline. The weak print confirms the somber outlook implied by the Euro Area’s…
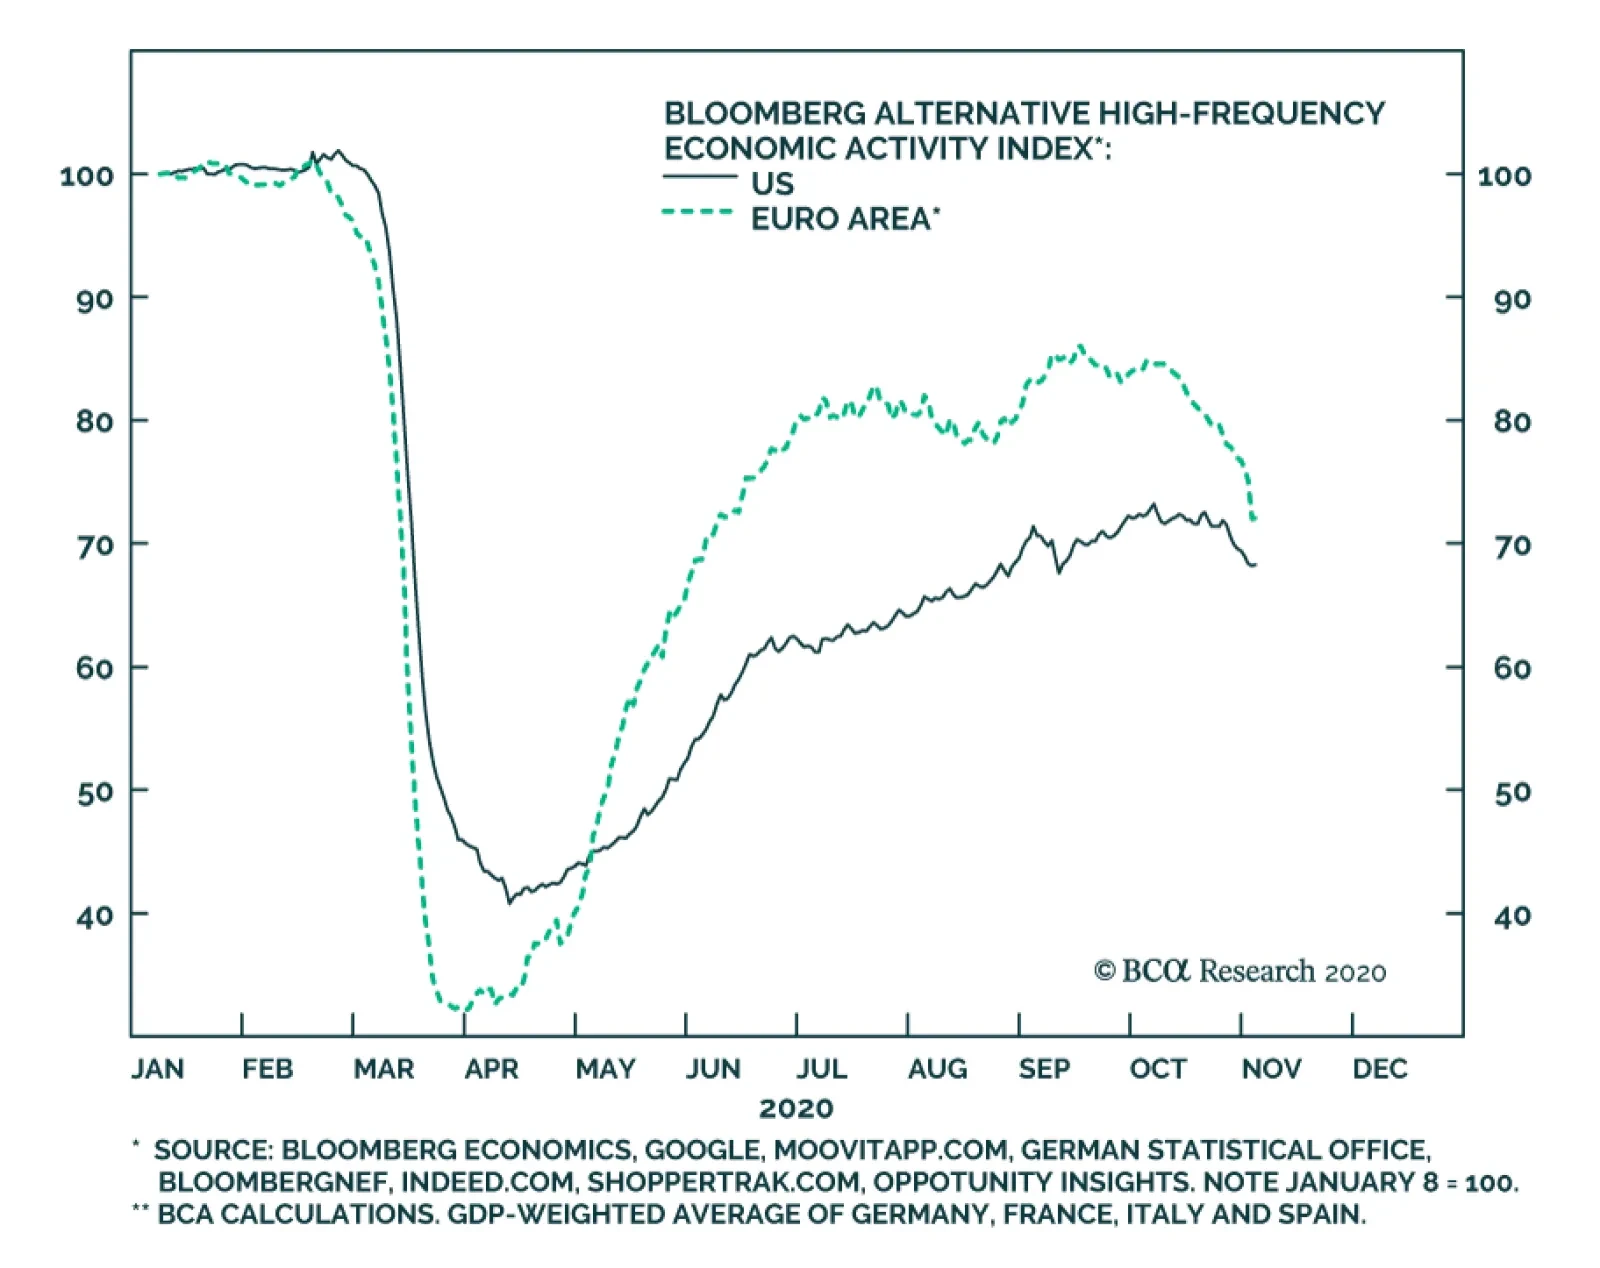
Alternative, high-frequency indicators of economic activity highlight that the US and euro area economies are already slowing in response to a new wave of COVID-19 infections. The chart above highlights Bloomberg's economic activity indexes for the US and…
According to BCA Research's Foreign Exchange Strategy service, currency markets also continue to ignore the risks of a no-deal Brexit and the significant acceleration in the pace of COVID-19 infections. The Bank of England decided to front-run the…
Europe & COVID-19's Engulfing Second Wave
…
In a previous Insight, we noted that the October euro area services PMI showed the region was at risk of a relative growth disappointment. The October survey was taken before the region re-imposed COVID-19 suppression measures of various intensity, from…