Europe

Highlights COVID-19 In Europe: The latest surge in COVID-19 cases in Europe has unnerved investors who now see renewed national lockdowns increasing the risk of a double-dip European recession and continued deflationary pressures. ECB: The signals from last week’s ECB policy meeting could not be more clear – the central bank will deliver new stimulus measures in December in response to the second wave of coronavirus sweeping through the euro area. This will be a combination of policies focused on expanding and extending the existing bond-buying vehicles and TLTROs, rather than cutting policy rates deeper into negative territory. European Bond Strategy: Stay overweight core European government debt, particularly versus US Treasuries. Remain overweight Italian and Spanish government bonds, as well, which remain supported by both ECB asset purchases and perceptions of increases European fiscal integration. Stay cautious on euro area corporate debt, however, as the renewed recession risk comes at a time when yields and spreads offer poor protection from future credit downgrades and defaults. Feature Chart of the WeekA Bad Time For A Second Wave
A Bad Time For A Second Wave
A Bad Time For A Second Wave
Today’s long anticipated US election will be the focus for investors in the coming days (and, potentially, weeks) as all votes are counted. We have discussed our views on the potential bond market impact of the election - bearish for US Treasuries with both Joe Biden and Donald Trump promising big fiscal stimulus in 2021 – in our previous two reports. We will provide an update of those views as soon as we get clarity on the election result. This week, we discuss a new concern for jittery markets - the explosion of new COVID-19 cases in Europe that has already led to governments imposing aggressive lockdown measures. The timing of the new viral surge could not be worse for the euro area economy, which had recovered smartly from the massive lockdown-related demand shock this past spring. Real GDP for the entire euro area exploded higher at a 12.7% rate in Q3/2020, a big rebound from the 11.8% drop in Q2. Yet the second wave of coronavirus is starting to weigh on the more domestically focused service sectors most vulnerable to lockdowns and declining consumer confidence (Chart of the Week). From the perspective of European fixed income strategy, the imposition of lockdowns will only force the ECB to turn more dovish at a time when Europe is already in deflation, as was strongly signaled at last week’s ECB policy meeting. This will support the performance of euro area government bond markets, both in absolute terms and especially versus US Treasuries where yields are drifting higher and should continue to do so after the US election. Another Deflationary Shock To Europe From The Virus The surge in COVID-19 cases has hit the euro area hard and fast. France has seen the most stunning increase, with a population-adjusted daily increase of 596 new cases per million, a nearly six-fold increase in just two months (Chart 2). Importantly, this second wave has so far been nowhere near as lethal as the first wave. The “case fatality ratio” – confirmed deaths as a percentage of confirmed cases – is down in the low single digits for the largest euro area countries (bottom panel). The imposition of lockdowns will only force the ECB to turn more dovish at a time when Europe is already in deflation, as was strongly signaled at last week’s ECB policy meeting. Even with this second wave being less deadly, governments are taking no chances. France and Germany announced national lockdowns last week for at least the month of November, and Italy and Spain have put new restrictions on activity as well. The new lockdowns are already denting consumer confidence across the euro area and this trend will continue as people choose to spend less time outside of their homes to avoid infection. If the case numbers do not begin to stabilize and the lockdown measures extend into December or beyond, governments will likely be forced to consider new fiscal stimulus measures. According to the latest IMF Fiscal Monitor, the largest euro area economies are projected to have a negative “fiscal thrust” – the change in the cyclically-adjusted primary budget balance as a share of potential GDP – in 2021 of at least -3% of GDP (Chart 3). Chart 22nd Wave Of European Coronavirus Is Far Less Lethal
2nd Wave Of European Coronavirus Is Far Less Lethal
2nd Wave Of European Coronavirus Is Far Less Lethal
Chart 3A Big European Fiscal Drag Coming Next Year
The Implications Of Europe's Second Wave Of Coronavirus
The Implications Of Europe's Second Wave Of Coronavirus
In the case of Italy, the fiscal thrust is expected to be a whopping -6.6% of GDP. The main cause is reduced government spending as the massive temporary stimulus measures to fight the 2020 COVID-19 recessions roll off. Chart 4The ECB Has A Deflation Problem
The ECB Has A Deflation Problem
The ECB Has A Deflation Problem
A fresh set of lockdowns will result in a need for more government support measures for unemployed workers, especially those in service-related industries like hospitality and tourism most exposed to lost business as consumers stay home. This poses a serious problem in countries like Spain and Italy that saw a rise in unemployment during the first lockdown but have seen no reversal since (Chart 4). More elevated unemployment rates suggest a lack of inflationary pressure, a point confirmed by recent inflation data. Overall headline HICP inflation fell to -0.3% in September, while core inflation is now a mere +0.4%. Headline HICP inflation rates are now below 0% in the largest euro area economies (Germany, France, Italy and Spain), while core HICP inflation in Italy fell to -0.3% in September. The collapse in oil prices earlier in 2020 has been the main cause of the negative headline inflation prints in the euro area, but is not the only source of weak inflation. According to a decomposition of inflation presented in the Bank of Italy’s October 2020 Economic Bulletin, a falling contribution from services inflation was responsible for about one-third of the entire decline in euro area headline HICP inflation since January (Chart 5). This comes from the part of the euro area economy most exposed to COVID-19 restrictions, highlighting the deflationary risk of the second wave. Chart 5Euro Area Deflation Is Mostly, But Not Only, Driven By Oil
The Implications Of Europe's Second Wave Of Coronavirus
The Implications Of Europe's Second Wave Of Coronavirus
Simply put, the second wave of COVID-19 could not have come at a worse time. The euro area economy is still dealing with excess capacity and deflation, made worse by previous appreciation of the euro, with a looming fiscal tightening next year. Policymakers need to spring into action to help provide support for the euro area economy during this time, starting with the ECB. The second wave of COVID-19 could not have come at a worse time. The euro area economy is still dealing with excess capacity and deflation, made worse by previous appreciation of the euro, with a looming fiscal tightening next year. Bottom Line: The latest surge in COVID-19 cases in Europe has unnerved investors who now see renewed national lockdowns increasing the risk of a double-dip European recession and continued deflationary pressures. The ECB Will Deliver New Stimulus In December At last week’s policy meeting, ECB President Christine Lagarde announced that the Governing Council would reassess its monetary policy stance at the December meeting, when a new set of economic projections would be presented that factored in the negative impact of the second COVID-19 wave. Lagarde was very candid about the expected outcome of that next meeting, when she stated that the ECB would “recalibrate its instruments” based on the new economic forecasts. Chart 6European Banks Are Tigthening Lending Standards
European Banks Are Tigthening Lending Standards
European Banks Are Tigthening Lending Standards
In our view, the ECB’s next policy options can only realistically focus on three options: Cutting policy rates deeper into negative territory Increasing the size, or altering the composition of its bond-buying programs Altering the terms of its current Targeted Long-Term Refinancing Operations (TLTROs) We view a rate cut as a low probability outcome. Not only are policy rates at or below 0%, but it is not clear that a cut would even help boost the demand or supply of new loans. According to the ECB’s latest Bank Lending Survey, euro area banks tightened credit conditions in Q3/2020 (Chart 6). Worsening perceptions of risk and a deteriorating economic outlook were cited as the main reasons for tightening lending standards. The tightening was most severe in Spain, but Italy also saw a big swing away from the easing standards seen in the Q2/2020 survey. Within the details of the Q3/2020 survey, the demand for loans from companies was expected to improve in Q4/2020. The demand for housing and consumer credit increased due to favorable borrowing conditions and a softening in negative contribution from consumer sentiment. Not only are policy rates at or below 0%, but it is not clear that a cut would even help boost the demand or supply of new loans. The ECB’s bond buying programs – the Asset Purchase Program (APP) and the Pandemic Emergency Purchase Program (PEPP) – were deemed to have a positive impact on bank liquidity and financing but a negative impact on profitability. Chart 7Low Interest Rates Are Crushing European Bank Stocks
Low Interest Rates Are Crushing European Bank Stocks
Low Interest Rates Are Crushing European Bank Stocks
Therein lies the problem of the ECB’s negative interest rate policy and large-scale bond buying – it has lowered borrowing costs for euro area governments, consumers and businesses, but has crushed the profits of Europe’s banks. That can be seen when looking at the ongoing miserable performance of euro area bank stocks, which continue to plumb new lows. The relative performance of euro area banks versus the broad equity market benchmark index tracks the slope of government bond yield curves quite closely in the major euro area economies (Chart 7), highlighting the link between the level of euro area interest rates and bank profits. In Chart 8A, we show the Tier 1 capital ratio, as well as the non-performing loan (NPL) ratio for the five largest banks in Germany, France, Italy, Spain and the Netherlands. The message from the chart is clear – European banks remain well capitalized, with double-digit Tier 1 capital ratios well in excess of regulatory minimums, and have a relatively low share of assets that are non-performing. This is especially true in Italy, where the NPL ratio has collapsed from a high of 20% to 7% over the past five years. In Chart 8B, we present the return on equity and return on asset ratios for the same banks presented in the previous chart. Most large euro area banks suffer from a very low return on assets, not materially above 0%, reflecting the non-existent interest rates banks earn on their government bond holdings as well as the low rates on their loan books. Chart 8AEuropean Banks: The Good News
European Banks: The Good News
European Banks: The Good News
Chart 8BEuropean Banks: The Bad News
European Banks: The Bad News
European Banks: The Bad News
So given the fragile state of euro area bank health, and with banks already tightening lending standards in anticipation of slower economic activity because of second wave lockdowns, we can rule out a policy interest rate cut as an option to ease policy in December. This leaves only two other easing options, both associated with an expansion of the ECB’s balance sheet – more asset purchases of sovereign bonds and encouraging bank lending through cheap funding via TLTROs (Chart 9). The impact of either policy in offsetting slowing growth is debatable. Government bond yields are already miniscule, if not outright negative, across the euro area and do not represent a hindrance to increased government spending. The ECB can tweak some of the terms of the existing TLTRO programs, like maturity or the price of funding, but that may not encourage new lending if both borrowers and lenders fear a double-dip recession because of the second wave. The pressure is on the ECB to do something to stem the decline in euro area inflation. Nonetheless, the pressure is on the ECB to do something to stem the decline in euro area inflation. While real interest rates are still negative, they are increasingly becoming less so as inflation expectations continue to drift lower. The 5-year/5-year forward EUR CPI swap rate is now down to 1.1%, and was last trading near the ECB’s inflation target of just under 2% in 2013-14 (Chart 10). Unsurprisingly, the rising real rate backdrop has helped boost the value of the euro, especially versus the US dollar, which has suffered under the weight of falling real US interest rates this year. Chart 9The ECB Can Only Expand Its Balance Sheet
The ECB Can Only Expand Its Balance Sheet
The ECB Can Only Expand Its Balance Sheet
In the end, greater fiscal stimulus will be the only option available to get Europe through the second wave. All the ECB can do is provide a backdrop of loose monetary policy that supports easy financial conditions, so that any stimulus will have the maximum effect on growth. Chart 10Deflation Is Pushing Up Real Rates In Europe
Deflation Is Pushing Up Real Rates In Europe
Deflation Is Pushing Up Real Rates In Europe
Bottom Line: The signals from last week’s ECB policy meeting could not be more clear – the central bank will deliver new stimulus measures in December in response to the second wave of coronavirus sweeping through the euro area. This will be a combination of policies focused on expanding and extending the existing bond-buying vehicles and TLTROs, rather than cutting policy rates deeper into negative territory. Stay Overweight European Government Bonds, But Stay Cautious On Euro Area Credit With the ECB set to deliver some form of easing in December, core European bond yields are likely to remain stable over at least the next six months. The ECB has shown no reservations about expanding its balance sheet via bond purchases when needed. A surge of buying similar in size to that of the first COVID-19 wave is not out of the question if Europe faces a double-dip second wave recession (Chart 11). Chart 11Stay Overweight Core European Government Bonds
Stay Overweight Core European Government Bonds
Stay Overweight Core European Government Bonds
Chart 12Italian BTPs Are Preferable To Euro Area Corporate Credit
Italian BTPs Are Preferable To Euro Area Corporate Credit
Italian BTPs Are Preferable To Euro Area Corporate Credit
In an environment where we see US Treasury yields having more upside on the back of post-election fiscal stimulus, this makes the likes of German bunds and French OATs good “defensive” lower-beta plays to replace high-beta US Treasury exposure in global USD-hedged bond portfolios. We also like core Europe as a pure spread trade versus Treasuries, as we see scope for the UST-Bund spread to widen further – a tactical trade we initiated last week (see our Tactical Overlay table on page 15). We continue to recommend overweighting Italian government bonds as the preferred way to add scarce yield to a European bond portfolio with an asset that will directly benefit from more ECB buying. We continue to recommend overweighting Italian government bonds as the preferred way to add scarce yield to a European bond portfolio with an asset that will directly benefit from more ECB buying (Chart 12). The ECB has already been purchasing a greater share of Italy in the PEPP, allowing significant deviations from the Capital Key weights that limit purchases in the older APP. ECB President Lagarde noted last week that those deviations will continue over the life of the PEPP, which should help support further declines in Italian bond yields over at least the next six months. We are maintaining a relatively cautious stance on European credit, however, even with the ECB likely to make a move in December. The renewed recession risk from the second wave comes at a time when low yields and spreads for euro area corporate bonds offer poor protection from future credit downgrades and defaults. We continue to prefer owning US corporate credit, both investment grade and high-yield, versus US equivalents in USD-hedged bond portfolios. Robert Robis, CFA Chief Fixed Income Strategist rrobis@bcaresearch.com Recommendations The GFIS Recommended Portfolio Vs. The Custom Benchmark Index
The Implications Of Europe's Second Wave Of Coronavirus
The Implications Of Europe's Second Wave Of Coronavirus
Duration Regional Allocation Spread Product Tactical Trades Yields & Returns Global Bond Yields Historical Returns
Highlights A Biden victory with a Republican Senate (28% odds) poses the greatest risk to the global reflation trade. The US is the most susceptible to social unrest of all the developed markets. Europe is stable relative to the US, but political risks are rising as new lockdowns go into effect. Emerging markets are also susceptible to social unrest – even those that look best on paper. Chile and Thailand have more downside due to politics, despite underlying advantages. Turkey and Nigeria are among those at risk of major unrest in a post-COVID world. Book gains on EUR-GBP volatility, Indian pharma, and rare earths. Cut losses. Feature This week saw a long-awaited risk-off move in global financial markets. A new wave of COVID lockdowns plus the US failure to pass a fiscal package finally registered with investors. Over the past two months we have argued that rising COVID cases without stimulus would produce a pre-election selloff that would drive the final nail in President Trump’s re-election bid. That should still be the case (Chart 1). While we are sticking with our view that Biden will win, we have upgraded Trump’s odds from 35% to 45%. We are focused on Trump’s momentum – not alleged polling errors – in Florida and Pennsylvania, and Biden’s loss of altitude in Arizona, as these trends open a clear Electoral College path to another Trump victory (Chart 2). Nevertheless Biden is tied with Trump among men and leads by 17 percentage points among women. He is also in a statistical tie among the elderly. Chart 1COVID Rising + Stimulus Falling = Red Ink
COVID Rising + Stimulus Falling = Red Ink
COVID Rising + Stimulus Falling = Red Ink
Chart 2Trump's Momentum In Swing States
Trump's Momentum In Swing States
Trump's Momentum In Swing States
Even assuming Trump’s comeback proves too little, too late, it could produce a contested election in which Trump has constitutional advantages, or a Republican Senate. Either of these two scenarios would extend the election season volatility for one-to-three months. Our updated US election probabilities are shown in Table 1 alongside the odds from the popular online betting site PredictIt.org. Table 1There Is A 72% Chance The Post-Election Policy Setting Will Favor Reflation
Election Trades And Global Social Unrest: A GeoRisk Update
Election Trades And Global Social Unrest: A GeoRisk Update
A Biden victory with a Republican Senate (28% odds) is the only deflationary scenario in the near term, since fiscal stimulus will be reduced in size and uncertain in timing. However, assuming financial market pressure forces senators to agree, this is actually the best outcome over the full two-year Senate election period, since neither tariffs nor corporate taxes would rise. Notably Treasury yields have risen regardless of election scenario, but there is little doubt that this scenario poses the greatest risk to the global reflation trade (Chart 3). Why does this election matter? Trump’s re-election would prolong US political polarization and “maximum pressure” foreign and trade policy. Trump must win through the constitutional system, not the popular vote, so a win would push polarization up. Polarization at home, including Democratic opposition in the House of Representatives, would drive him abroad. By contrast, a Biden win would include a popular majority and might include a united Democratic Congress, which would result in a clear popular mandate and would concentrate Biden's administration on an ambitious domestic agenda. A Biden victory with a Republican Senate (28% odds) poses the greatest risk to the global reflation trade. Hence Trump’s election would bolster the USD and US equity outperformance, along with global policy uncertainty relative to the United States (Chart 4). Whereas Biden’s election, if it also brings a Democratic Senate, would bolster global equity outperformance, cyclical equities, and US policy uncertainty relative to global. Chart 3Republican Senate Less Reflationary
Republican Senate Less Reflationary
Republican Senate Less Reflationary
Chart 4Trump Would Boost US Equity Outperformance
Trump Would Boost US Equity Outperformance
Trump Would Boost US Equity Outperformance
The election will have a geopolitical fallout. First, Trump is still president through January 20 regardless of outcome and could take aggressive actions to seal his legacy and lock the Biden administration into conflict with China or Iran. Second, a contested election would create a power vacuum in which other nations could seek to take advantage of American distraction. Third, a Trump victory spells strategic conflict with Iran and China, and either could try to seize the advantage by acting first. Fourth, a Biden win spells confrontation with Russia and ultimately China, and both countries would test his resolve early in his administration. Diagram 1 summarizes these key market takeaways of the US election scenarios. This week we provide our monthly GeoRisk Update with a special focus on our COVID-19 Social Unrest Index and implications for select developed, emerging, and frontier markets. Diagram 1Scenarios For US Election Outcomes And Market Impacts
Election Trades And Global Social Unrest: A GeoRisk Update
Election Trades And Global Social Unrest: A GeoRisk Update
The United States The market can get hit by negative surprises after the US election just as easily as before.1 The US is a powder keg of social and political angst, ranking the worst among developed markets in our COVID-19 Social Unrest Index (Table 2). The lower a country ranks on the list, the less stable it is and the more susceptible to unrest. Social unrest becomes market-relevant if it weighs on consumer or business sentiment, or if it causes a major change in government or policy. Table 2The US Is The Developed Market Most Susceptible To Social Unrest
Election Trades And Global Social Unrest: A GeoRisk Update
Election Trades And Global Social Unrest: A GeoRisk Update
The first US risk is a contested election. By rallying in the swing states in the final weeks of the election, Trump has increased the likelihood of a disputed outcome. Armies of lawyers will descend upon the swing state election boards. The Supreme Court’s intervention in Florida in 2000 has incentivized political parties to seek a judicial intervention, especially if they think they are losing the popular vote narrowly. Mail-in counts, recounts, and other disputes could push up against the December 14 Electoral College voting date. Worse, if the Electoral College is hung, the House of Representatives would have to decide the outcome in January. Volatility and risk-off sentiment would predominate. Emerging markets are showing the first signs of upheaval in the wake of this year’s crisis. The second risk is resistance to the election results. If Trump wins on a constitutional technicality, the country faces widespread unrest. This would be relevant to investors if it paralyzes major cities, exacerbates the COVID outbreak, or snowballs into something big enough to suppress consumer confidence. If Biden wins on a technicality, the country faces not widespread unrest but isolated pockets of potentially armed resistance or domestic terrorist attacks. The FBI, DHS, and recent news events have confirmed the presence of armed or violent extremist groups of various ideological stripes that pose a rising threat in the current climate of pandemic, unemployment, and polarization.2 They could strike any time after the election. Europe And Brexit Chart 5European Lockdowns Push Up Political Risk
European Lockdowns Push Up Political Risk
European Lockdowns Push Up Political Risk
Europe and Canada have reinstated lockdowns in response to their rise in COVID-19 cases. The surge in political risk is evident from our GeoRisk Indicators (Chart 5). These lockdowns will not be as draconian as earlier this year as the death rate has been found to be lower than once feared. While most governments have time on the political clock to take a hardline approach today, at the start of what could be a nasty winter season, they do not have so much leeway in 2021. Greece, Spain, Italy, the UK, and France are next in line for social unrest, after the US, in our index, Table 2 above. These countries are also vulnerable because fiscal support is not as robust as elsewhere, as can be seen by our global fiscal stimulus tracker (Chart 6). France is in better shape than the others and marks the dividing line – the 2017 election was a turning point in which the political establishment unified to defeat a right-wing populist challenge. President Emmanuel Macron’s popularity is holding up decently and it will now be buttressed by his tough stance against a spate of radical Islamist terrorist attacks. Extremist incidents will continue to be a problem, given the lockdowns and economic slump. Macron will focus on economic reflation in 2021 leading up to an election for which he is clearly favored in spring of 2022. Anything that derails his political trajectory before that time is of great importance for Europe’s political future, since Macron will be the de facto leader once Angela Merkel steps down in October 2022. Italy and Spain will be ongoing sources of political risk. Italy was the first major European hotspot of the pandemic, and euroskeptic attitudes are quietly ticking back up, but the ruling coalition and especially Prime Minister Giuseppe Conte have received popular backing for their handling of the crisis. Spain, on the other hand, has seen Prime Minister Pedro Sánchez lose support, while conservative parties tick up in popular opinion. These two countries are candidates for early elections when the hens come home to roost for the pandemic and recession (Chart 7). Chart 6More Stimulus Needed In Europe
Election Trades And Global Social Unrest: A GeoRisk Update
Election Trades And Global Social Unrest: A GeoRisk Update
Chart 7Europe’s Leaders Fare Better Than Others
Election Trades And Global Social Unrest: A GeoRisk Update
Election Trades And Global Social Unrest: A GeoRisk Update
The other major countries with looming elections in 2021-22 are seeing relatively positive outcomes in popular opinion (e.g. the Netherlands, Germany). The exception is the UK, which is on the lower end of the social unrest index and is in the midst of internal disruption due to Brexit. Our assessment remains that Prime Minister Boris Johnson and the Tories will have to accept a trade deal with the EU over the next month (Chart 8). They can afford to leave on paper, but the economy would suffer and Scotland’s nationalists would be empowered to attempt secession. Our European Strategist Dhaval Joshi believes a Biden win in the US will hasten Johnson’s capitulation. We don’t expect much more upside in our GBP-EUR volatility trade after the US election result is known (Chart 9). Chart 8Go Long Sterling
Go Long Sterling
Go Long Sterling
Chart 9Close EUR-GBP Volatility Trade
Close EUR-GBP Volatility Trade
Close EUR-GBP Volatility Trade
Chart 10Trump Would Weigh On Euro
Trump Would Weigh On Euro
Trump Would Weigh On Euro
Trump’s re-election would be negative for the European Union’s economic and political stability (Chart 10). It would portend a greater trade war, Middle Eastern instability and refugees, Russian aggression, or European populism. By contrast, Biden will not use sweeping tariffs to resolve trade tensions, will seek to restore the 2015 nuclear deal with Iran, will suppress anti-establishment politics, will seek a multilateral approach to China trade tensions, and will only substantially aggravate the Europeans by being too aggressive on Russia. EM: Chile And Thailand Emerging markets are showing the first inevitable signs of upheaval in the wake of this year’s global crisis. What is critical to note about our Social Unrest Index for EM is that even if a country ranks high on the list overall, it could still face significant sociopolitical upheaval. This is manifest in the top-ranked countries of our list – Chile, Malaysia, Thailand, Russia, Indonesia – all of which have already seen some degree of social and/or political unrest in this crisis year (Table 3). Table 3Even Emerging Markets That Look Good On Paper Are Susceptible To Unrest
Election Trades And Global Social Unrest: A GeoRisk Update
Election Trades And Global Social Unrest: A GeoRisk Update
The best example is Chile, which is top-ranked in the index but ranks ninth in the “Household Grievances” column, which measures inequality, inflation, and unemployment. The latter measure helps explain how Chile erupted last fall and again this fall in mass protests. Chart 11Political Risk Weighs On Chile
Political Risk Weighs On Chile
Political Risk Weighs On Chile
Over the past week Chileans voted overwhelmingly in a referendum to revise their constitution with a constitutional convention that will be elected, i.e. not overdetermined by current members of the National Congress. The constitutional revision process is ultimately a positive way for a country with good governance to assuage its household grievances. But the process will continue through a revision process in April 2021, the November 2021 general election, and a final referendum in 2022, ensuring that political risk persists. Chilean assets have fallen short of their expected performance based on global copper prices, suggesting that they have upside in the near term (Chart 11). Positive news is driven by macro fundamentals, including Chinese stimulus, but political risk will periodically put a cap on rallies by highlighting Chile’s transition to expansive social spending, higher debts, and hence future currency risk. Thailand’s case is different, as it is not household grievances per se but rather the ongoing governance problem that is triggering mass protests. The governance problem stems from regional disparities in wealth and representative government. Modern society and pro-growth populism have repeatedly clashed with the royalist political establishment and its military backers over the past 20 years and that process is set to continue. Chart 12Thailand Not Fully Pricing New Instability Cycle
Thailand Not Fully Pricing New Instability Cycle
Thailand Not Fully Pricing New Instability Cycle
The newest round of the crisis will build for some years and ultimately culminate in some degree of bloodshed before a new political settlement is achieved. Typically, over the past 20 years, Thai political unrest creates a buying opportunity for investors. But the previous major wave of unrest, from 2006-14, occurred during the lead-up to the all-important royal succession. Now the succession is “over” and it is not clear that the new king, Vajiralongkorn, will live up to his father’s legacy as a successful arbiter of society’s conflicts. It is possible that he will overreact to domestic opposition and abuse his powers. Our Emerging Markets Strategy has downgraded Thailand in its portfolio, showing that the economy is suffering from insufficient stimulus as a negative credit impulse offsets public spending during the crisis. Thai equities do not offer relative value within the emerging market space at present (Chart 12). Most likely Thai political troubles will continue to provide a buying opportunity, but at the moment the risks are not sufficiently priced. If Chile, Malaysia, and Thailand are already experiencing significant political risk despite their high rankings on our index, then Brazil, South Africa, Turkey, and the Philippines face even greater challenges going forward. We have written about Brazil recently – we continue to see a rising political risk premium there (Chart 13). We will update our views on South Africa and the Philippines in forthcoming special reports. For now we turn to Turkey. Turkey: One Step Forward, Two Steps Back Turkey scores near the bottom of our Social Unrest Index. The regime of President Recep Tayyip Erdogan has been in power for nearly two decades, is suffering cracks in public support, is continuing to suffer the inflationary consequences of populist monetary and fiscal policy, and is embroiled in a range of international adventures and conflicts, now including Nagorno-Karabakh. After a brief pause of tensions in September, we argued that President Recep Tayyip Erdogan’s retreat would be temporary and that geopolitical tensions would re-escalate. They have done so even sooner than we thought. The lira is collapsing, as registered by our GeoRisk Indicator, which is once again on the rise (Chart 14). Chart 13Brazilian Political Risk Nearing 2018 Levels
Brazilian Political Risk Nearing 2018 Levels
Brazilian Political Risk Nearing 2018 Levels
Chart 14Turkish Political Risk Spikes Anew
Turkish Political Risk Spikes Anew
Turkish Political Risk Spikes Anew
Relations with Europe have worsened significantly. Aggressive rhetoric between Erdogan and Macron in response to France’s treatment of French Muslims and handling of recent terrorist incidents has led to a diplomatic crisis: Paris recalled its ambassador. The episode highlights both Erdogan’s increased assertiveness vis-à-vis the EU as well as his Neo-Ottoman bid to become the leader of the Muslim world. Erdogan has called for a boycott of French goods (alongside similar popular calls in various Muslim countries). The European Commission warned Turkey could face punitive action at its December summit. The feud in the eastern Mediterranean is also escalating. Turkey’s Oruc Reis seismic research vessel was once again sent out on an exploratory mission in contested waters on October 12. The mission’s duration was extended multiple times. The EU may impose sanctions as early as December. Brussels' response to Turkish provocations may include targeted anti-dumping measures, likely on steel and fish. There have also been calls to suspend the customs union, but this would require the conflict to rise above rhetoric as it would harm EU investments in Turkey. Turkey is growing even more assertive in its neighborhood with its support for Azerbaijan in the conflict with Armenia. Tensions with Russia are rising yet again. Erdogan is already overextended in Syria and Libya, and recently threatened to launch a new military operation in northern Syria if Kurdish militants do not relocate from along Turkey’s border. The warning follows a Russian airstrike on Turkey-backed Syrian rebels in Idlib earlier this week – the deadliest strike in Idlib since March. Provoking the United States, Turkey also tested its newly purchased Russian S400 missile defense system on October 16. This was swiftly followed by US warnings that Turkey faces US sanctions under the Countering America’s Adversaries Through Sanctions Act if it operationalizes the system. The risk of punitive action would rise under a Biden presidency as he is more likely to adopt a tougher stance on Erdogan than President Trump. Chart 15More Downside For Turkish Lira
More Downside For Turkish Lira
More Downside For Turkish Lira
These developments all point to a continuation in geopolitical tensions, as Erdogan flouts various risks and constraints. Turkey’s relationship with NATO allies is continuing to deteriorate meaningfully. The lira’s collapse is also in response to economic developments. After a surprise 200 basis points rate hike in September, the CBRT disappointed markets by keeping the benchmark 1 week repo rate on hold at its October 22 meeting. Investors had hoped that the September hike marked a reversal of Erdogan’s unorthodox policies. However, the October decision disconfirms this hope, as the central bank is instead opting for stealth measures to raise the cost of funding (e.g. limiting funding at the benchmark rate and thus forcing banks to borrow at higher costs; widening the interest rate corridor to give itself more room to raise the weighted average cost of funding). These decisions come amid rising inflation, debt monetization, a loss in foreign interest in Turkish equities and bonds, and deteriorating budget and current account balances. All point to further lira weakness (Chart 15). Bottom Line: The TRY faces downside pressure from the deteriorating geopolitical and economic backdrop. Although the EU has so far shown restraint in penalizing Ankara, its stance has not dissuaded Erdogan from adopting a provocative foreign policy stance. Moreover tensions with the US are at risk of escalating due to the possibility of a Biden presidency. Economic factors also point to continued weakness as monetary policy is too loose and the CBRT has not abandoned Erdoganomics. Nigeria: No Political Change Waves of protests have erupted across Nigeria in recent weeks, largely driven by the country’s youth. Protests center on calls to end the special anti-robbery squad (SARS), an arm of the national police service, which has long been accused of extrajudicial killings, torture, extortion, and corruption. Most recently, dozens of soldiers and police officers approached the scene of a major protest site in Lekki, a large district in Lagos, and opened fire, killing 12 people. The violence fueled outrage toward the government and security forces. To quell unrest, the government announced that SARS would be disbanded and promised a host of reforms. Demonstrators are skeptical of government promises without clearly specified timeframes. After all, previous incumbents have suggested police reform would be expedited. This has yet to happen, so we do not expect national policy to meet public demand. Moreover, President Buhari is a former military dictator who has maintained a hard line on security matters. He is in his final term in office and not legally required to step down until 2023. While discontent grows toward the government for social injustices, the Nigerian economy remains vulnerable and imbalanced. The local currency is facing considerable risk of major devaluation stemming from strains on its balance of payments, as BCA’s Emerging Markets Strategy pointed out in a recent report. Low oil prices and weak FDI inflows will foster various imbalances impeding the nation’s structural adjustments and its potential growth rate. The US election will act as a positive catalyst for markets in the short run as long as it produces a clear result and resolves the US fiscal stalemate. Nigeria’s current account excluding oil has been structurally wide, a sign of weak domestic productivity and an uncompetitive currency (Chart 16). Foreign currency reserves stand at $36bn, barely above foreign debt obligations at $28bn. FDI inflows have reached their second lowest point over the past decade, weighing on productivity growth, which is near 0%. A positive for Nigeria’s macro fundamentals is that public debt is low, at 23% of GDP, decreasing the likelihood of a sovereign default in the near term. Government officials refrained from large COVID fiscal relief, keeping spending in check. Coupled with low debt servicing costs, of which the foreign share only represents 2% of government revenues, a currency depreciation to improve competitiveness would not make public debt dynamics a concern. Nominal GDP is above short-term rates (Chart 17). Hence there is room for the currency to fall and government spending to pick up into next year to support the economy. Chart 16Nigeria Struggles With Economic Rebalance
Nigeria Struggles With Economic Rebalance
Nigeria Struggles With Economic Rebalance
Chart 17Nigeria Has Fiscal Firepower
Nigeria Has Fiscal Firepower
Nigeria Has Fiscal Firepower
In the post-dictatorship era, oil revenues knit the country’s predominantly Muslim north with its oil-rich and predominantly Christian south. The country has struggled to rebalance the economy in the wake of the 2014 oil shock. Crude production has fallen from over 2 million barrels per day to around 1.6 million bpd since 2010, and Nigeria struggles to meet its modest OPEC quotas. The current global crisis could have a negative long-term impact as rig counts have fallen again. We expect global oil demand to be supported in 2021, as lockdowns will be less stringent the second time and global fiscal stimulus will keep coming. And while Buhari’s age and poor health make him vulnerable, he is not without reserves of political strength. He is seen as someone who has kept up a good fight against the Islamist militant group Boko Haram. Considering that he is a northerner and a Muslim by faith, this strategy has helped ease sectarian tensions across the country, strengthening his grip. The problem is that the size of the global crisis could upset even the most stable of petro-states. Like most of sub-Saharan Africa, the youth population is large – the median age is around 18. If global oil demand relapses amid the second wave of the pandemic and a lack of domestic and global stimulus, the country will suffer yet another wave of unemployment. And if policy remains hawkish, sociopolitical troubles will be amplified. Nigeria’s impact on global oil prices is limited – it only provides 2% of global oil supply – but it could become a contributor to rising unplanned outages if instability gets out of hand. Bottom Line: The SARS protests are not likely to threaten overall government stability, but mounting economic pressures could exacerbate social unrest, and the negative feedback with security forces. This could deliver a significant blow to the aging Buhari’s government if he does not enact expansionary fiscal policy to smooth out the external shocks. Investment Takeaways Chart 18Biden Good For Global Trade Rebound
Biden Good For Global Trade Rebound
Biden Good For Global Trade Rebound
The US election will act as a positive catalyst for markets in the short run as long as it produces a clear result and resolves the US fiscal stalemate. But a contested election is not unlikely and a deflationary risk arises in the 28% chance that Biden wins while Republicans retain the Senate. Stimulus would still be agreed but its size and timing would be uncertain, prolonging the selloff. Therefore we are updating our portfolio to book some gains and cut some losses. We are booking gains on our EUR-GBP volatility trade for a return of 13%. We are closing our long Indian pharmaceuticals trade for a gain of 12%. We are throwing in the towel on our long defense and aerospace trade for a loss of 21%. And we are closing our rare earths basket trade for a gain of 5%. We are closing two pair trades and re-initiating them as absolute longs: long China Play Index relative to MSCI global stocks (0.1% return) and long ISE Cyber Security Index relative to the NASDAQ (-6.8%). Chinese reflation and global cyber-attacks will remain relevant themes. The inverse of Trump, Biden is positive for the euro, negative for the dollar, and supportive of global trade. However, a range of higher taxes and levies on corporations suggests that his administration will ultimately weigh on S&P global stocks relative to those at home. And while Biden appears softer on China, we consider this a mispricing, as he has largely coopted Trump’s and Sanders’s trade agenda (Chart 18). Matt Gertken Vice President Geopolitical Strategy mattg@bcaresearch.com Roukaya Ibrahim Editor/Strategist Geopolitical Strategy RoukayaI@bcaresearch.com Guy Russell Research Analyst GuyR@bcaresearch.com Chart 19China: GeoRisk Indicator
China: GeoRisk Indicator
China: GeoRisk Indicator
Chart 20Russia: GeoRisk Indicator
Russia: GeoRisk Indicator
Russia: GeoRisk Indicator
Chart 21UK: GeoRisk Indicator
UK: GeoRisk Indicator
UK: GeoRisk Indicator
Chart 22Germany: GeoRisk Indicator
Germany: GeoRisk Indicator
Germany: GeoRisk Indicator
Chart 23France: GeoRisk Indicator
France: GeoRisk Indicator
France: GeoRisk Indicator
Chart 24Italy: GeoRisk Indicator
Italy: GeoRisk Indicator
Italy: GeoRisk Indicator
Chart 25Canada: GeoRisk Indicator
Canada: GeoRisk Indicator
Canada: GeoRisk Indicator
Chart 26Spain: GeoRisk Indicator
Spain: GeoRisk Indicator
Spain: GeoRisk Indicator
Chart 27Taiwan: GeoRisk Indicator
Taiwan: GeoRisk Indicator
Taiwan: GeoRisk Indicator
Chart 28Korea: GeoRisk Indicator
Korea: GeoRisk Indicator
Korea: GeoRisk Indicator
Chart 29Turkey: GeoRisk Indicator
Turkey: GeoRisk Indicator
Turkey: GeoRisk Indicator
Chart 30Brazil: GeoRisk Indicator
Brazil: GeoRisk Indicator
Brazil: GeoRisk Indicator
Geopolitical Calendar Footnotes 1 There have been strange warnings in recent days – an unidentified aircraft intercepted over a Trump rally in Arizona, a Saudi warning of a potential Houthi attack on Americans, and a Chinese warning of a potential US drone attack against Chinese assets in the South China Sea. None of these have amounted to anything, and the idea of a US drone attack on China is absurd, but investors should be cautious nonetheless, particularly because a range of state and non-state actors will have an incentive to take actions once the US outcome is known. 2 Please see FBI Director Christopher Wray, “Statement Before The House Homeland Security Committee,” Washington DC, September 17, 2020, fbi.gov; Department of Homeland Security, “Homeland Threat Assessment,” October 2020, dhs.gov; Tresa Baldas and Paul Egan, “More details emerge in plot to kidnap Michigan Gov. Whitmer as suspects appear in court,” USA Today, October 13, 2020, usatoday.com.
Your feedback is important to us. Please take our client survey today. Highlights US Election & Duration: We estimate that there is an 80% probability of a US election result that will give a lift to US Treasury yields via increased fiscal stimulus. Those are strong enough odds to justify a move to a below-benchmark cyclical US duration stance on a 6-12 month horizon. US Treasuries: We anticipate a moderate bear market in US Treasuries to unfold during the next 6-12 months. In addition to below-benchmark portfolio duration, investors should overweight TIPS versus nominal Treasuries, hold nominal and real yield curve steepeners, and hold inflation curve flatteners. Non-US Country Allocation: Within global government bond portfolios, downgrade the US to underweight. Favor countries that have lower sensitivity to rising US Treasury yields with central banks that are likely to be more dovish than the Fed in the next few years. That means increasing allocations to core Europe and Japan, while reducing exposure to Canada and Australia. Stay neutral on the UK given the near-term uncertainties over the final Brexit outcome. Feature With the US presidential election just two weeks away, public opinion polls continue to show that Joe Biden is the favorite to win the White House. However, the odds of a “Blue Sweep” - combining a Biden victory with the Democratic Party winning control of both the US Senate and House of Representatives - have increased since the end of September according to online prediction markets. US Treasury yields have also moved higher over that same period (Chart II-1), which we interpret as the bond market becoming more sensitive to the likelihood of a major increase in US government spending under single-party Democratic control. Chart II-1A Blue Sweep Is Bond Bearish
A Blue Sweep Is Bond Bearish
A Blue Sweep Is Bond Bearish
Table II-1A Comparison Of The Candidates' Budget Proposals
November 2020
November 2020
According to a recent analysis done by the Committee for a Responsible Federal Budget, President Trump’s formal policy proposals would increase US federal debt by $4.95 trillion between 2021 and 2030, while Biden’s plan would increase the debt by $5.60 trillion (Table II-1).1 While those are both massive fiscal stimulus plans, there is a stark difference in the policy mix of their proposals that matters for the future path of US bond yields. Under Biden, spending is projected to increase by a cumulative $11.1 trillion, partially offset by $5.8 trillion in revenue increases and savings with the former vice-president calling for tax hikes on corporations and high-income earners. On the other hand, Trump’s plan includes $5.45 trillion of spending increases and tax cuts over the next decade, offset by $0.75 trillion in savings. Conclusion: Biden would increase spending by over twice that of a re-elected Trump, with much of that spending expected to be front-loaded in the early part of his first term. Outright spending is more reflationary than tax cuts because it puts more money in the pockets of consumers (spenders) relative to producers (savers). The Biden plan would be more stimulating for overall activity even if the increase in debt is about the same. Chart II-2The Biden Platform Is Highly Stimulative
The Biden Platform Is Highly Stimulative
The Biden Platform Is Highly Stimulative
Another analysis of the Biden and Trump platforms was conducted by Moody’s in September, based on estimates of how much of each candidate’s promises could be successfully implemented under different combinations of White House and Congressional control.2 The stimulus figures were run through the Moody’s US economic model, which is similar to the budget scoring model of the US Congressional Budget Office, to produce a year-by-year path for the US economy over the next decade (Chart II-2). Moody’s concluded that the US economy would return to full employment in the second half of 2022 under a President Biden – especially if the Democrats win the Senate - compared to the first half of 2024 under a re-elected President Trump. Such a rapid closing of the deep US output gap that opened up because of the COVID-19 recession would likely trigger a reassessment of the Fed’s current highly dovish policy stance. At the moment, the US overnight index swap (OIS) curve discounts one full 25bp Fed hike by late 2023/early 2024, and two full hikes by late 2024/early 2025 (Chart II-3). This pricing of the future path of interest rates has occurred even with the Fed promising to keep the funds rate anchored near 0% until at least the end of 2023. The likelihood of some form of increased fiscal spending after the election will cause the bond market to challenge the Fed’s current forward guidance even more, putting upward pressure on Treasury yields. Chart II-3US Fiscal Stimulus Will Pull Forward Fed Liftoff
US Fiscal Stimulus Will Pull Forward Fed Liftoff
US Fiscal Stimulus Will Pull Forward Fed Liftoff
Our colleagues at BCA Geopolitical Strategy see a Blue Sweep as the most likely outcome of the US election, although their forecasting models suggest that the race for control of the Senate will be much closer than the Biden vs Trump battle (there is little chance that control of the House of Representatives would switch back to the Republicans).3 Their scenarios for each of the White House/Senate combinations, along with their own estimated probability for each, are the following: Biden wins in a Democratic sweep: BCA probability = 27%. The US economy will benefit from higher odds of unfettered fiscal stimulus in 2021, although financial markets will simultaneously have to adjust for the negative shock to US corporate earnings from higher taxes and regulation. Government bond yields should rise on the generally reflationary agenda. Trump wins with a Republican Senate: BCA probability = 23%. In this status quo scenario, a re-elected President Trump would still face opposition from House Democrats on most domestic economic issues, forcing him to tilt towards more protectionist foreign and trade policies in his second term. Fiscal stimulus would be easy to agree, though not as large as under a Democratic sweep. US Treasury yields would rise, but would later prove volatile due to the risk to the cyclical recovery from a global trade war, as Trump’s tariffs will not be limited to China and could even affect the European Union. Biden wins with the Senate staying Republican: BCA probability = 28%. This is ultimately the most positive outcome for financial markets - reduced odds of a full-blown trade war with China, combined with no new tax hikes. Bond yields would drift upward over time, but not during the occasional fiscal battles that would ensue between the Democratic president and Republican senators. The first such battle would start right after the election. Treasuries would remain well bid until financial market pressures forced a Senate compromise with the new president sometime in H1 2021. Trump wins with a Democratic Senate: BCA probability = 22%. This is the least likely scenario but one that could produce a big positive fiscal impulse. Trump is a big spender and will veto tax hikes, but will approve populist spending on areas where he agrees. The Democratic Senate would not resist Trump’s tough stance on China, however, thus keeping the risk of US-China trade skirmishes elevated. This is neutral-to-bearish for US Treasuries, depending on the size of any bipartisan stimulus measures and Trump’s trade actions. The key takeaway is that the combined probability of scenarios that will put upward pressure on US Treasury yields is 72%, versus a 28% probability of a more bond-neutral outcome. That is a bond-bearish skew worth positioning for by reducing US duration exposure now, ahead of the November 3 election. Of this 72%, 45 percentage points come from scenarios in which President Trump would remain in power. Hence his trade wars would eventually undercut his reflationary fiscal policy. This would become the key risk to the short duration view after the initial market response. Bottom Line: The most likely scenarios for the US election will give a cyclical lift to US Treasury yields via increased fiscal stimulus. This justifies a move to a below-benchmark US duration stance on a 6-12 month horizon. If Trump is re-elected, the timing of Trump’s likely return to using broad-based tariffs will have to be monitored closely. A Moderate Bear Market While our anticipated Blue Sweep election outcome will lead to a large amount of fiscal spending in 2021 and beyond, we anticipate only a modest increase in bond yields during the next 6-12 months. In terms of strategy, our recommended reduction in portfolio duration reflects the fact that fiscal largesse meaningfully reduces the risk of another significant downleg in bond yields and strengthens our conviction in a moderate bear market scenario for bonds. This does raise the question of how large an increase in US Treasury yields we expect during the next 6-12 months. We turn to this question now. Chart II-4Less Election-Day Upside Than In 2016
Less Election-Day Upside Than In 2016
Less Election-Day Upside Than In 2016
Not Like 2016 First, we do not expect a massive election night bond rout like we saw in 2016 (Chart II-4). For one thing, the Fed was much more eager to tighten policy in 2016 than it is today, and it did deliver a rate hike one month after the Republicans won the House, Senate and White House (Chart II-4, bottom panel). This time around, the Fed has made it clear that it will wait until inflation is running above its 2% target before lifting rates off the zero bound and will not respond directly to expectations for greater fiscal stimulus. Second, 2016’s election result was mostly unanticipated. This led to a dramatic adjustment in market prices once the results came in. The PredictIt betting market odds of a “Red Sweep” by the Republicans in 2016 were only 16% the night before the election. As of today, the betting markets are priced for a 58% chance of a Blue Sweep in 2020. Unlike in 2016, bonds are presumably already partially priced for the most bond-bearish election outcome. A Slow Return To Equilibrium To more directly answer the question of how high bond yields can rise, survey estimates of the long-run (or equilibrium) federal funds rate provide a useful starting point. In a world where the economy is growing at an above-trend pace and inflation is expected to move towards the Fed’s target, it is logical for long-maturity Treasury yields to settle near estimates of the long-run fed funds rate. Indeed, this theory is borne out empirically. During the last two periods of robust global economic growth (2017/18 & 2013/14), the 5-year/5-year forward Treasury yield peaked around levels consistent with long-run fed funds rate estimates (Chart II-5). As of today, the median estimates of the long-run fed funds rate from the New York Fed’s Survey of Market Participants and Survey of Primary Dealers are 2% and 2.25%, respectively. In other words, a complete re-convergence to these equilibrium levels would impart 80 – 100 bps of upward pressure to the 5-year/5-year forward Treasury yield. We expect this re-convergence to play out eventually, but probably not within the next 6-12 months. In both prior periods when the 5-year/5-year forward Treasury yield reached these equilibrium levels, the Fed’s reaction function was much more hawkish. The Fed was hiking rates throughout 2017 & 2018 (Chart II-5, panel 4), and the market moved quickly to price in rate hikes in 2013 (Chart II-5, bottom panel). The Fed’s new dovish messaging will ensure that the market reacts less quickly this time around. Also, continued curve steepening will mean that the 5-year/5-year forward yield’s 80 – 100 bps of upside will translate into significantly less upside for the benchmark 10-year yield. The 10-year yield and 5-year/5-year forward yield peaked at similar levels in 2017/18 when the Fed was lifting rates and the yield curve was flat (Chart II-6). But, the 10-year peaked far below the 5-year/5-year yield in 2013/14 when the Fed stayed on hold and the curve steepened. Chart II-5How High For Treasury Yields?
How High For Treasury Yields?
How High For Treasury Yields?
Chart II-6Less Upside In 10yr Than In 5y5y
Less Upside In 10yr Than In 5y5y
Less Upside In 10yr Than In 5y5y
The next bear move in bonds will look much more like 2013/14. The Fed will keep a firm grip over the front-end of the curve, leading to curve steepening and less upside in the 10-year Treasury yield than in the 5-year/5-year forward. In addition to shifting to a below-benchmark duration stance, investors should maintain exposure to nominal yield curve steepeners. Specifically, we recommend buying the 5-year note versus a duration-matched barbell consisting of the 2-year and 10-year notes (Chart II-6, bottom panel).4 TIPS Versus Nominals We have seen that a full re-convergence to “equilibrium” implies 80 – 100 bps of upside in the 5-year/5-year forward nominal Treasury yield. Bringing TIPS into the equation, we have also observed that long-maturity (5-year/5-year forward and 10-year) TIPS breakeven inflation rates tend to settle into a range of 2.3 – 2.5 percent when inflation is well-anchored and close to the Fed’s target (Chart II-7). The additional fiscal stimulus that will follow a Blue Sweep election makes it much more likely that the economic recovery will stay on course, leading to an eventual return of inflation to target and of long-maturity TIPS breakeven inflation rates to a 2.3 – 2.5 percent range. However, as with nominal yields, this re-convergence will be a long process whose pace will be dictated by the actual inflation data. To underscore that point, consider that our Adaptive Expectations Model of the 10-year TIPS breakeven inflation rate – a model that is driven by trends in the actual inflation data – has the 10-year breakeven rate as close to fair value (Chart II-8).5 This fair value will rise only slowly over time, alongside increases in actual inflation. Chart II-7Overweight TIPS Versus Nominals
Overweight TIPS Versus Nominals
Overweight TIPS Versus Nominals
Chart II-8Real Yields Have Likely Bottomed
Real Yields Have Likely Bottomed
Real Yields Have Likely Bottomed
All in all, we continue to recommend an overweight allocation to TIPS versus nominal Treasuries. TIPS breakeven inflation rates will move higher during the next 6-12 months, but are unlikely to reach our 2.3 – 2.5 percent target range within that timeframe. TIPS In Absolute Terms As stated above, we expect nominal yields to increase more than real yields during the next 6-12 months, but what about the absolute direction of real (aka TIPS) yields? Here, our sense is that real yields have also bottomed. If we consider the extreme scenario where the 5-year/5-year forward nominal yield returns to its equilibrium level and where long-maturity TIPS breakeven inflation rates return to our target range, it implies about 80 bps of upside in the nominal yield and 40 bps of upside in the breakeven. This means that the 5-year/5-year real yield has about 40 bps of upside in a complete “return to equilibrium” scenario. While we don’t expect this “return to equilibrium” to be completed within the next 6-12 months, the process is probably underway. The only way for real yields to keep falling in this reflationary world is for the Fed to become increasingly dovish, even as growth improves and inflation rises. After its recent shift to an average inflation target, our best guess is that Fed rate guidance won’t get any more dovish from here. Real yields fell sharply this year as the market priced in this change in the Fed’s reaction function, but the late-August announcement of the Fed’s new framework will probably mark the bottom in real yields (Chart II-8, bottom panel).6 Chart II-9Own Inflation Curve Flatteners And Real Curve Steepeners
Own Inflation Curve Flatteners And Real Curve Steepeners
Own Inflation Curve Flatteners And Real Curve Steepeners
Two More Curve Trades In addition to moving to below-benchmark duration, maintaining nominal yield curve steepeners and staying overweight TIPS versus nominal Treasuries, there are two additional trades that investors should consider in order to profit from the reflationary economic environment. The first is inflation curve flatteners. The cost of short-maturity inflation protection is below the cost of long-maturity inflation protection, meaning that it has further to run as inflation returns to the Fed’s target (Chart II-9). In addition, if the Fed eventually succeeds in achieving a temporary overshoot of its inflation target, then we should expect the inflation curve to invert. Real yield curve steepeners are in some ways the mirror image of inflation curve flatteners. Assuming no change in nominal yields, the real yield curve will steepen as the inflation curve flattens. But what makes real yield curve steepeners look even more attractive is that increases in nominal yields during the next 6-12 months will be concentrated in long-maturities. This will impart even more steepening pressure to the real yield curve. Investors should continue to hold inflation curve flatteners and real yield curve steepeners. Bottom Line: We anticipate a moderate bear market in US Treasuries to unfold during the next 6-12 months. In addition to below-benchmark portfolio duration, investors should overweight TIPS versus nominal Treasuries, hold nominal and real yield curve steepeners, and hold inflation curve flatteners. Non-US Government Bonds: Reduce Exposure To US Treasuries The mildly bearish case for US Treasuries that we have laid out above not only matters for our recommended duration stance, but also for our suggested country allocation within global government bond portfolios. Simply put, the risk of rising bond yields is much higher in the US than elsewhere, both for the immediate post-election period but also over the medium-term. Thus, the immediate obvious portfolio decision is to downgrade US Treasuries to underweight. The move higher in US Treasury yields that we expect is strictly related to spillovers from likely US fiscal stimulus. While other countries in the developed world are contemplating the need for additional fiscal measures, particularly in Europe where there is a renewed surge in coronavirus infections and growing economic restrictions, no country is facing as sharp a policy choice as the US with its upcoming election. We can say with a fair degree of certainty that the US will have a relatively more stimulative fiscal policy stance than other developed economies over at least the next couple of years. This implies a higher relative growth trajectory for the US that hurts Treasuries more on the margin than non-US government debt. In addition, the likely path of relative monetary policy responses are more bearish for US Treasuries. As described above, the scope of the US stimulus will cause bond investors to further question the Fed’s commitment to keeping the funds rate unchanged for the next few years. That also applies to the Fed’s other policy tools, like asset purchases. The Fed is far less likely to continue buying US Treasuries at the same aggressive pace it has for the past eight months if there is less need for monetary stimulus because of more fiscal stimulus. Chart II-10The Fed Will Gladly Trade Less QE For More Fiscal Stimulus
November 2020
November 2020
According to the IMF, the Fed has purchased 57% of all US Treasuries issued since late February of this year, in sharp contrast to the ECB and Bank of Japan that have purchased over 70% of euro area government bonds and JGBs issued (Chart II-10). If US Treasury yields are rising because of improving US growth expectations, fueled by fiscal stimulus, the Fed will likely tolerate such a move and buy an even lower share of Treasuries issued – particularly if the higher bond yields do not cause a selloff in US equity markets that can tighten financial conditions and threaten the growth outlook. The fact that US equities have ignored the rise in Treasury yields seen since the end of September may be a sign that both bond and stock investors are starting to focus on a faster trajectory for US growth. In terms of country allocation, beyond downgrading US Treasuries to underweight, we recommend upgrading exposure to countries that are less sensitive to changes in US Treasury yields (i.e. countries with a lower yield beta to changes in US yields). In Chart II-11, we show the rolling beta of changes in 10-year government bond yields outside the US to changes in 10-year US Treasury yields. This is a variation of the “global yield beta” concept that we have discussed in the BCA Research bond publications in recent years. Here, we modify the idea to look at which countries are more or less correlated to US yields, specifically. A few points stand out from the chart: Chart II-11Reduce Exposure To Bond Markets More Correlated To UST Yields
Reduce Exposure To Bond Markets More Correlated To UST Yields
Reduce Exposure To Bond Markets More Correlated To UST Yields
All countries have a “US yield beta” of less than 1, suggesting that Treasuries are a consistent outperformer when US yields fall and vice versa. This suggests moving to underweight the US when US yields are rising is typically a winning strategy in a portfolio context. The list of higher beta countries includes Canada, Australia, New Zealand, the UK and Germany; although Canada stands out as having the highest yield beta in this group. The list of lower beta countries includes France, Italy, Spain, and Japan. In Chart II-12, we show what we call the “upside yield beta” that is estimated only using data for periods when Treasury yields are rising. This gives a sense of which countries are more likely to outperform or underperform during a period of rising Treasury yields, as we expect to unfold after the election. From this perspective, the “safer” lower US upside yield beta group includes the UK, France, Germany and Japan. The riskier higher US upside yield beta group includes Canada, Australia, New Zealand, Italy and Spain. Chart II-12Favor Bond Markets Less Correlated to RISING UST Yields
Favor Bond Markets Less Correlated to RISING UST Yields
Favor Bond Markets Less Correlated to RISING UST Yields
Spain and Italy are less likely to behave like typical high-beta countries as US yields rise, however, because the ECB is likely to remain an aggressive buyer of their government bonds as part of their asset purchase programs over the next 6-12 months. We also do not recommend trading UK Gilts off their yield beta to US Treasuries in the immediate future, given the uncertainties over the negotiations over a final Brexit deal. Both sets of US yield betas suggest higher-beta Canada, Australia and New Zealand are more at risk of relative underperformance versus lower-beta France, Germany and Japan. In terms of government bond country allocation, we recommend reducing exposure to the former group and increasing allocations to the latter group. Bottom Line: Within global government bond portfolios, downgrade the US to underweight. Favor countries that have lower sensitivity to rising US Treasury yields, especially those with central banks that are likely to be more dovish than the Fed in the next few years. That means increasing allocations to core Europe and Japan, while reducing exposure to “higher-beta” Canada and Australia. Robert Robis, CFA Chief Fixed Income Strategist rrobis@bcaresearch.com Ryan Swift US Bond Strategist rswift@bcaresearch.com Footnotes 1 http://www.crfb.org/papers/cost-trump-and-biden-campaign-plans 2 https://www.moodysanalytics.com/-/media/article/2020/the-macroeconomic-consequences-trump-vs-biden.pdf 3 Please see BCA Research Geopolitical Strategy Special Report, “Introducing Our Quantitative US Senate Election Model”, dated October 16, 2020, available at gps.bcaresearch.com 4 For more details on this recommended steepener trade please see US Bond Strategy Weekly Report, “Positioning For Reflation And Avoiding Deflation”, dated August 11, 2020, available at usbs.bcaresearch.com 5 For more details on our Adaptive Expectations Model please see US Bond Strategy Weekly Report, “How Are Inflation Expectations Adapting?”, dated February 11, 2020, available at usbs.bcaresearch.com 6 For a detailed look at the implications of the Fed’s policy shift please see US Bond Strategy / Global Fixed Income Strategy Special Report, “A New Dawn For US Monetary Policy”, dated September 1, 2020, available at usbs.bcaresearch.com
Highlights Global Duration: US Treasury yields have started to creep higher and the move is likely to continue in the coming months regardless of who wins the White House. Reduce overall global duration exposure to below-benchmark, focused on the US. Country Allocation: Based on our view that US Treasury yields have more upside, we are making the following changes to our recommended country allocations in the government bond portion of our model bond portfolio: downgrading the US to underweight, downgrading higher-beta Canada and Australia to neutral, and raising lower-beta Germany, France, Japan and the UK to overweight. Treasury-Bund Spread: We introduce a new trade in our Tactical Overlay to capitalize on our expectation of higher US bond yields and a wider Treasury-Bund spread: selling 10-year Treasury futures versus buying 10-year German bund futures. Feature In a Special Report jointly published last week with our colleagues at BCA Research US Bond Strategy, we laid out the case for why US Treasury yields have bottomed and should now begin to drift higher.1 We reached that conclusion for two reasons: 1) there will be a major US fiscal stimulus after the upcoming US election, especially so if Joe Biden becomes president and the Democrats take the Senate; and 2) the Fed’s shift to Average Inflation Targeting in late August represented the point of maximum Fed dovishness. The investment conclusions were to reduce duration exposure, while also downgrading our recommended allocation to US government bonds to underweight. We also advised cutting exposure to non-US government bond markets with relatively higher sensitivity to changes in US bond yields, while increasing allocations to countries with a lower “yield beta” to US Treasuries (Table 1). Table 1Updated GFIS Model Bond Portfolio Recommended Positioning
The Global Bond Implications Of Rising Treasury Yields
The Global Bond Implications Of Rising Treasury Yields
In this follow-up report, we will further discuss the implications of our changed view on US yields for non-US developed market government bonds. This includes specific adjustments to the recommended country allocations in our model bond portfolio, as well as a new tactical trade to profit from a move higher in US yields that will not to be matched in Europe. Our Recommended Overall Duration Stance: Now Below-Benchmark The case for a future cyclical bottoming of global yields has been building for the past few months, even as yields have remained range-bound at very low levels across the developed economies. Our Global Duration Indicator, comprised of economic sentiment measures and leading economic indicators, bottomed back in March and has soared sharply since then (Chart of the Week). Given the usual lead time between peaks and troughs of the Indicator and global bond yields - around nine months, on average – that suggests yields should bottom out sometime before year-end. Chart of the WeekA Cyclical, US-Led Bottoming Of Global Bond Yields
A Cyclical, US-Led Bottoming Of Global Bond Yields
A Cyclical, US-Led Bottoming Of Global Bond Yields
Chart 2UST Yields About To Break Out?
UST Yields About To Break Out?
UST Yields About To Break Out?
In the US, we now think we are past that point, as we discussed last week. The 10-year US Treasury yield has been drifting higher during the month of October and is now bumping up against its 200-day moving average of 0.83% (Chart 2). This is only the first such attempt at a trend breakout in yields, and such a move is unlikely prior to US Election Day - or, more accurately, “US Election Is Decided Day” which may not be November 3! The case for a future cyclical bottoming of global yields has been building for the past few months, even as yields have remained range-bound. Outside the US, however, momentum of bond yields and potential trend breakouts paint a more mixed picture. German and French bond yields remain stable and generally trendless, with Italian and Spanish yields continuing to grind lower. At the same time, yields in the UK, Canada and Australia have started to perk up but remain just below their 200-day moving averages. Bond yields have not responded to the sharp cyclical rebound across the developed world, with large gaps between elevated manufacturing PMIs and stagnant bond yields (Chart 3). Low inflation, ample spare economic capacity and dovish monetary policies are all playing a role, with bond markets not expecting an imminent inflation surge that could drive up yields and fuel expectations of tighter monetary policy. By way of contrast, China - where domestic services sectors have improved at a rapid pace from the COVID-19 recession and where the central bank is not running an overly accommodative monetary policy – has seen a more typical positive correlation between government bond yields and the rising manufacturing PMI over the past several months (Chart 4). This suggests that developed market bond yields can begin to normalize if the domestic services side of those economies emerges more forcefully from the lockdown-induced downturn. Chart 3A Wide Gap Between Growth & Yields
A Wide Gap Between Growth & Yields
A Wide Gap Between Growth & Yields
Chart 4Are Chinese Yields Sending A Message?
Are Chinese Yields Sending A Message?
Are Chinese Yields Sending A Message?
The news on that front is more optimistic in the US compared in Europe. The Markit services PMIs for the euro area and UK have all weakened over the past few months, with headline inflation rates flirting with deflation (Chart 5). Similar data in the US has trended in the opposite direction, with stronger US services activity with rising inflation. Chart 5Deflation Risks In Europe, Not The US
Deflation Risks In Europe, Not The US
Deflation Risks In Europe, Not The US
The pickup in new COVID-19 cases, and the degree of the response by governments to contain it, has been far stronger in Europe and the UK than in the US on a population-adjusted basis (Chart 6). Lockdowns have become more widespread across Europe to contain the second larger wave of the virus. The recent softer services PMI data in the euro area and UK are a reflection of those greater economic restrictions and weaker confidence. This gap between the US economy and non-US economies is only magnified by the fiscal stimulus measures proposed by both US presidential candidates. In the US, governments have been far less willing to implement politically unpopular restrictions in an election year, while lockdown-weary consumers have been more willing to go about their lives rather than stay sheltered at home. The result is a healthier tone to the US data compared to other countries, even with the number of new US cases on the rise again. This gap between the US economy and non-US economies is only magnified by the fiscal stimulus measures proposed by both US presidential candidates. As we discussed in last week’s Special Report, both the Biden and Trump platforms are calling for major fiscal stimulus – between $5-6 trillion over the next decade, including tax changes – although the Biden plan has much more front-loaded direct government spending, only partially offset by tax increases, if fully implemented. This is the “Blue Sweep” scenario, with a Biden victory and Democratic Party control of the US Congress, that is most bearish for US Treasuries, as the outcome would eventually help reduce the expected 2021 US fiscal drag of -7.2% of GDP as estimated by the latest IMF Fiscal Monitor (Chart 7). Even a re-elected Trump, however, would also mean more US fiscal stimulus, although with a mix of tax cuts and spending increases. Chart 6The Latest COVID-19 Wave Is Hitting Europe Harder
The Latest COVID-19 Wave Is Hitting Europe Harder
The Latest COVID-19 Wave Is Hitting Europe Harder
Combined with an improving services sector and rising inflation, this puts the US in a much different economic position than the major economies of Europe. Chart 7Post-Election US Stimulus Will Offset Fiscal Drag
Post-Election US Stimulus Will Offset Fiscal Drag
Post-Election US Stimulus Will Offset Fiscal Drag
There, the IMF is also projecting some fiscal drag in 2021, but now with a much less healthy domestic economy due to the COVID-19 surge and where inflation is already near 0%. Our decision to reduce our recommended overall global duration stance to below-benchmark is largely driven by trends in the US that are more bond-bearish than in the rest of the developed world. There will likely be another round of fiscal measures to help combat virus-stricken economies in Europe and elsewhere, but the US election is bringing the issue to the forefront more quickly. In other words, the US will get a more bond-bearish fiscal stimulus before Europe does. Bottom Line: US Treasury yields have started to creep higher and the move is likely to continue in the coming months regardless of who wins the White House. Reduce overall global duration exposure to below-benchmark, focused on the US. Our Recommended Country Allocation: Downgrade US, Upgrade Lower-Beta Countries Net-net, our decision to reduce our recommended overall global duration stance to below-benchmark is largely driven by trends in the US that are more bond-bearish than in the rest of the developed world. This also has implications for our recommend country allocation in our model bond portfolio. First, are downgrading our recommended US Treasury allocation to underweight. We are also increasing our desired weighting in countries where government bond yields are less sensitive to changes in US Treasury yields – especially during periods when the latter are rising. We call this “upside yield beta”. The countries that have the highest such beta to US Treasuries are Canada, Australia and New Zealand, making them downgrade candidates (Chart 8). Similarly, lower upside beta countries like Germany, France, Japan and the UK are upgrade possibilities. Chart 8Favor Countries With Lower Yield Betas To USTs
Favor Countries With Lower Yield Betas To USTs
Favor Countries With Lower Yield Betas To USTs
Already, we are seeing the widening of yield spreads between US Treasuries and non-US government markets – with more to come as US Treasuries grind higher over the next 6-12 months. We see the greatest upside for spreads between the US and the low upside yield beta countries – that means wider spreads for US-Germany, US-France, US-Japan and US-UK (Chart 9). Chart 9Expect More Underperformance From USTs
Expect More Underperformance From USTs
Expect More Underperformance From USTs
Chart 10Fed QE Momentum Peaking, Unlike Other CBs
Fed QE Momentum Peaking, Unlike Other CBs
Fed QE Momentum Peaking, Unlike Other CBs
Thus, this week are making significant changes to our strategic government bond country allocations (see page 15), as well as the country weightings in our model bond portfolio (see pages 13-14), based on our new view on US bond yields and non-US yield betas. Specifically, we are not only cutting our recommended US weighting to underweight, but we are also downgrading Canada and Australia from overweight to neutral. On the other side, we are upgrading UK Gilts to overweight from neutral, while also upgrading Germany, France and Japan to overweight. Importantly, we are maintaining our overweight stance on Italian and Spanish sovereign debt, as those markets are supported by greater European fiscal policy integration in the world of COVID-19 and, just as importantly, large-scale ECB asset purchases. More generally, the relative “aggressiveness” of central bank quantitative easing (QE) does play a role in our recommended country allocation. We expect the Fed to be more tolerant of higher Treasury yields if the move is driven by improving US growth and/or greater US fiscal stimulus – as long as the higher yields were not having a negative impact on equity or credit markets. We expect the Fed to be more tolerant of higher Treasury yields if the move is driven by improving US growth and/or greater US fiscal stimulus – as long as the higher yields were not having a negative impact on equity or credit markets. This means less expected QE buying of Treasuries by the Fed. Conversely, given how aggressive the Reserve Bank of Australia and Bank of Canada have been with expanding their balance sheet via QE (Chart 10), this makes us reluctant to shift to the underweight stance on those countries implied by their high beta to rising US Treasury yields. Therefore, we are only downgrading those two countries to neutral. Bottom Line: Based on our view that US Treasury yields have more upside, we are making the following changes to our recommended country allocations in the government bond portion of our model bond portfolio: downgrading the US to underweight, downgrading higher-beta Canada and Australia to neutral, and raising lower-beta Germany, France, Japan and the UK to overweight. A New Tactical Trade: A UST-Bund Spread Widener Using Futures This week, we are also introducing a new recommended trade in our Tactical Overlay portfolio on page 16 to take advantage of our view on US bond yields: a 10-year US-Germany spread widening trade using government bond futures. Chart 11A Tactical Opportunity For A Wider UST-Bund Spread
A Tactical Opportunity For A Wider UST-Bund Spread
A Tactical Opportunity For A Wider UST-Bund Spread
This trade makes sense for several reasons: Germany has one of the lowest yield betas to US Treasuries during periods when the latter is rising, as shown earlier. Our US Treasury-German Bund fundamental fair value spread model – which uses relative policy interest rates, unemployment and inflation between the US and the euro area as inputs - suggests that the spread is now far too tight after the massive rally in US Treasuries in 2020 (Chart 11). The main reason why the spread looks so “expensive” is that the underlying fair value has risen with US inflation rising and euro area inflation falling (Chart 12, bottom panel). The UST-Bund yield differential is not stretched from a technical perspective, when looking at deviations of the spread from its 200-day moving average or the 26-week change in the spread; both measures suggest room for additional spread widening before reaching historical extremes (Chart 13). Also, duration positioning by US fixed income investors is only around neutral, according to the JP Morgan duration survey, suggesting scope to push yields higher if bond investors become more defensive. Chart 12Inflation Differentials Justify A Wider UST-Bund Spread
Inflation Differentials Justify A Wider UST-Bund Spread
Inflation Differentials Justify A Wider UST-Bund Spread
Chart 13Technical Trends Favor A Wider UST-Bund Spread
Technical Trends Favor A Wider UST-Bund Spread
Technical Trends Favor A Wider UST-Bund Spread
As a reference, we are initiating this trade with the cash bond 10-year US-Germany spread at +138bps, with a target range of +170-190bps over the 0-6 month horizon we maintain for our Tactical Overlay positions. Bottom Line: We introduce a new trade in our Tactical Overlay to capitalize on our expectation of higher US bond yields and a wider Treasury-Bund spread: selling 10-year Treasury futures versus buying 10-year German bund futures. Robert Robis, CFA Chief Fixed Income Strategist rrobis@bcaresearch.com Footnotes 1 Please see BCA Research US Bond Strategy Special Report, "Beware The Bond-Bearish Blue Sweep", dated October 20, 2020, available at usbs.bcaresearch.com and gfis.bcaresearch.com. Recommendations The GFIS Recommended Portfolio Vs. The Custom Benchmark Index
The Global Bond Implications Of Rising Treasury Yields
The Global Bond Implications Of Rising Treasury Yields
Duration Regional Allocation Spread Product Tactical Trades Yields & Returns Global Bond Yields Historical Returns
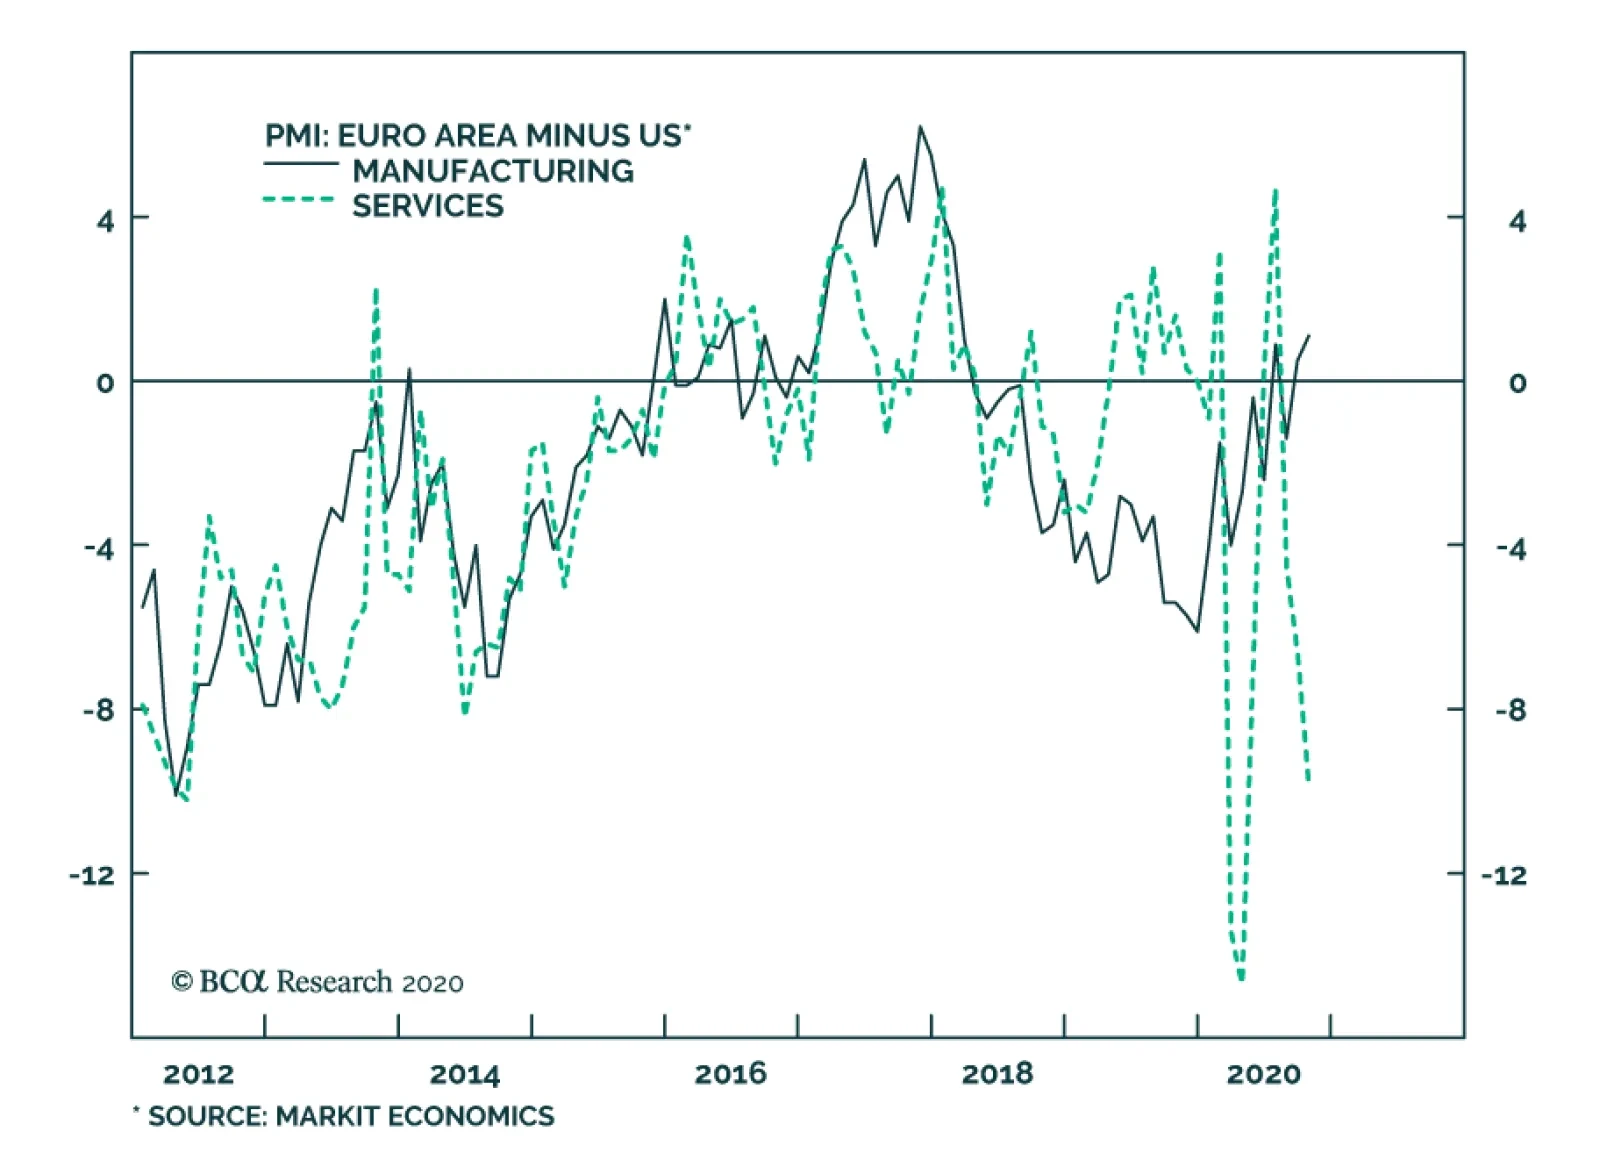
In yesterday’s Insight, we highlighted the resilience of the euro area’s manufacturing PMI and noted that a robust industrial sector is consistent with a continued recovery – even in the face of the negative impact that renewed lockdown measures will have on…
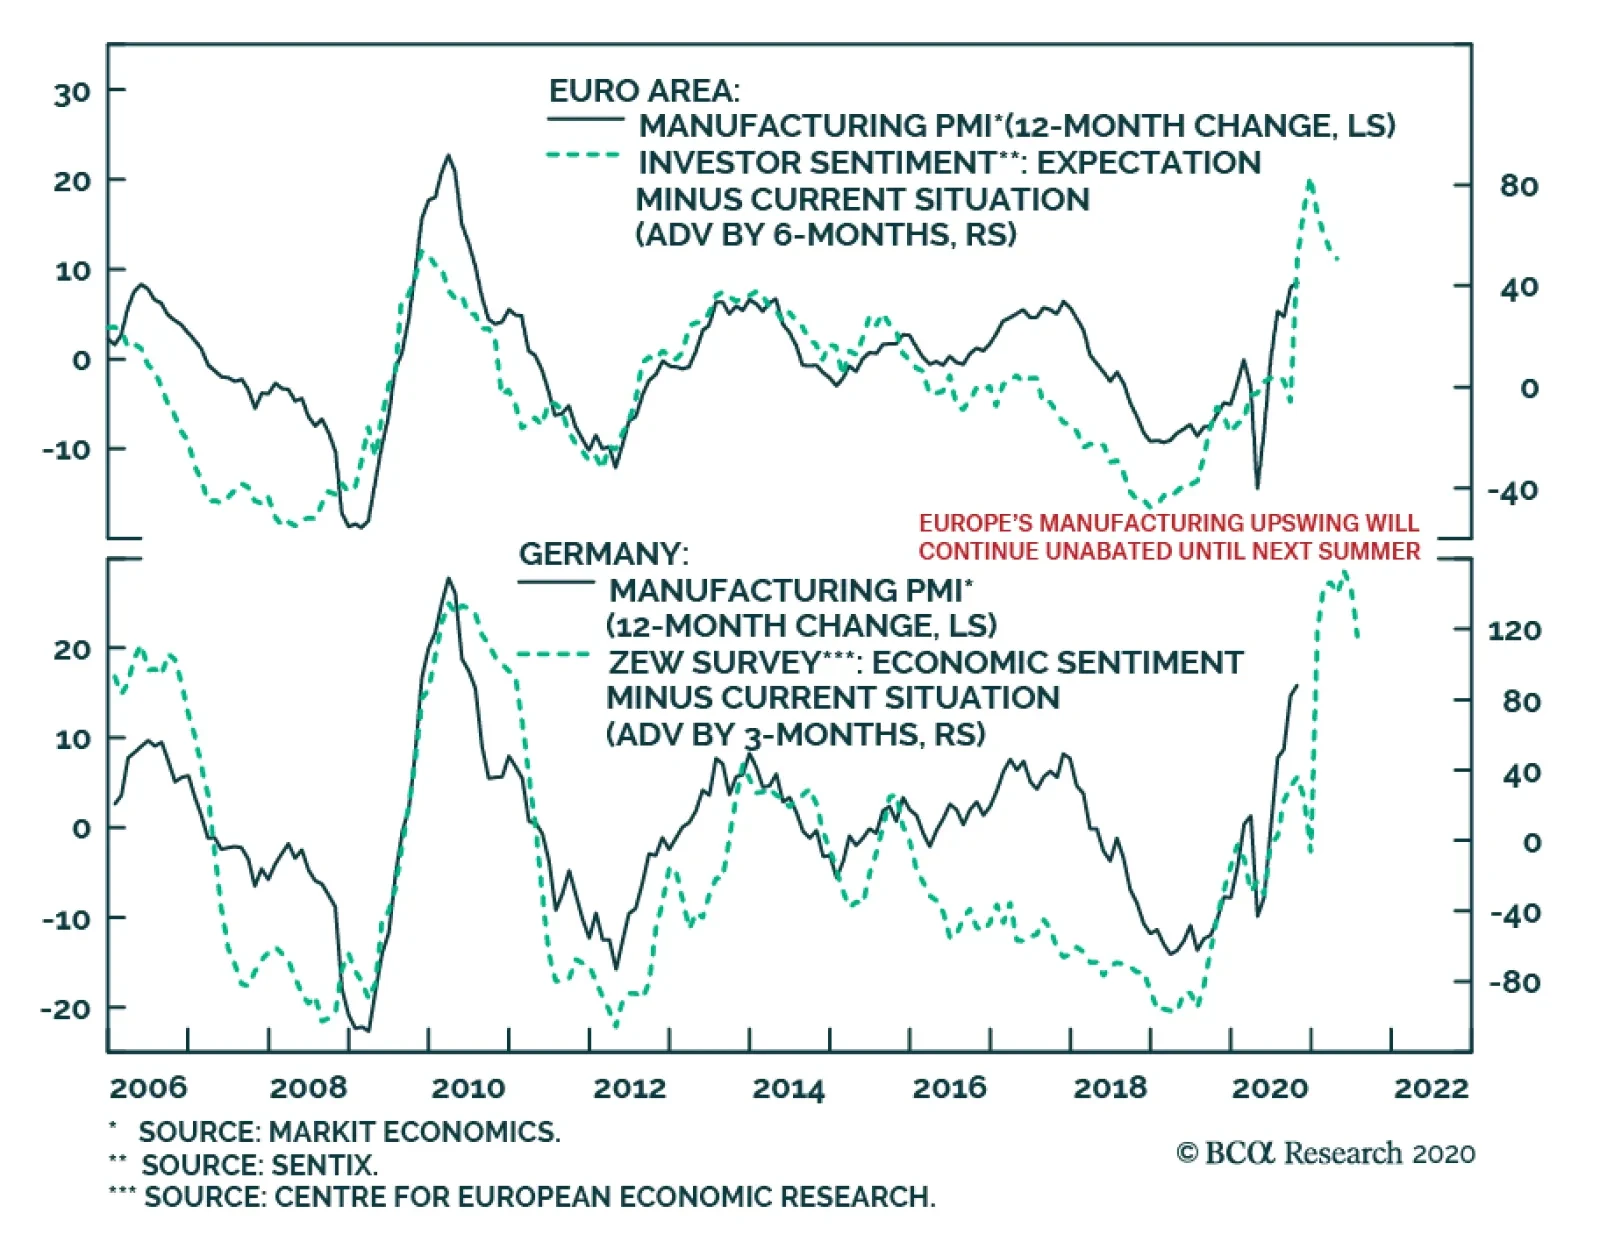
The Eurozone Flash Composite PMI declined one point to 49.4 in September, but nonetheless managed to outperform expectations marginally. The outperformance of the Composite index reflected the 0.7-point increase in the Manufacturing PMI to 54.4, when it was…
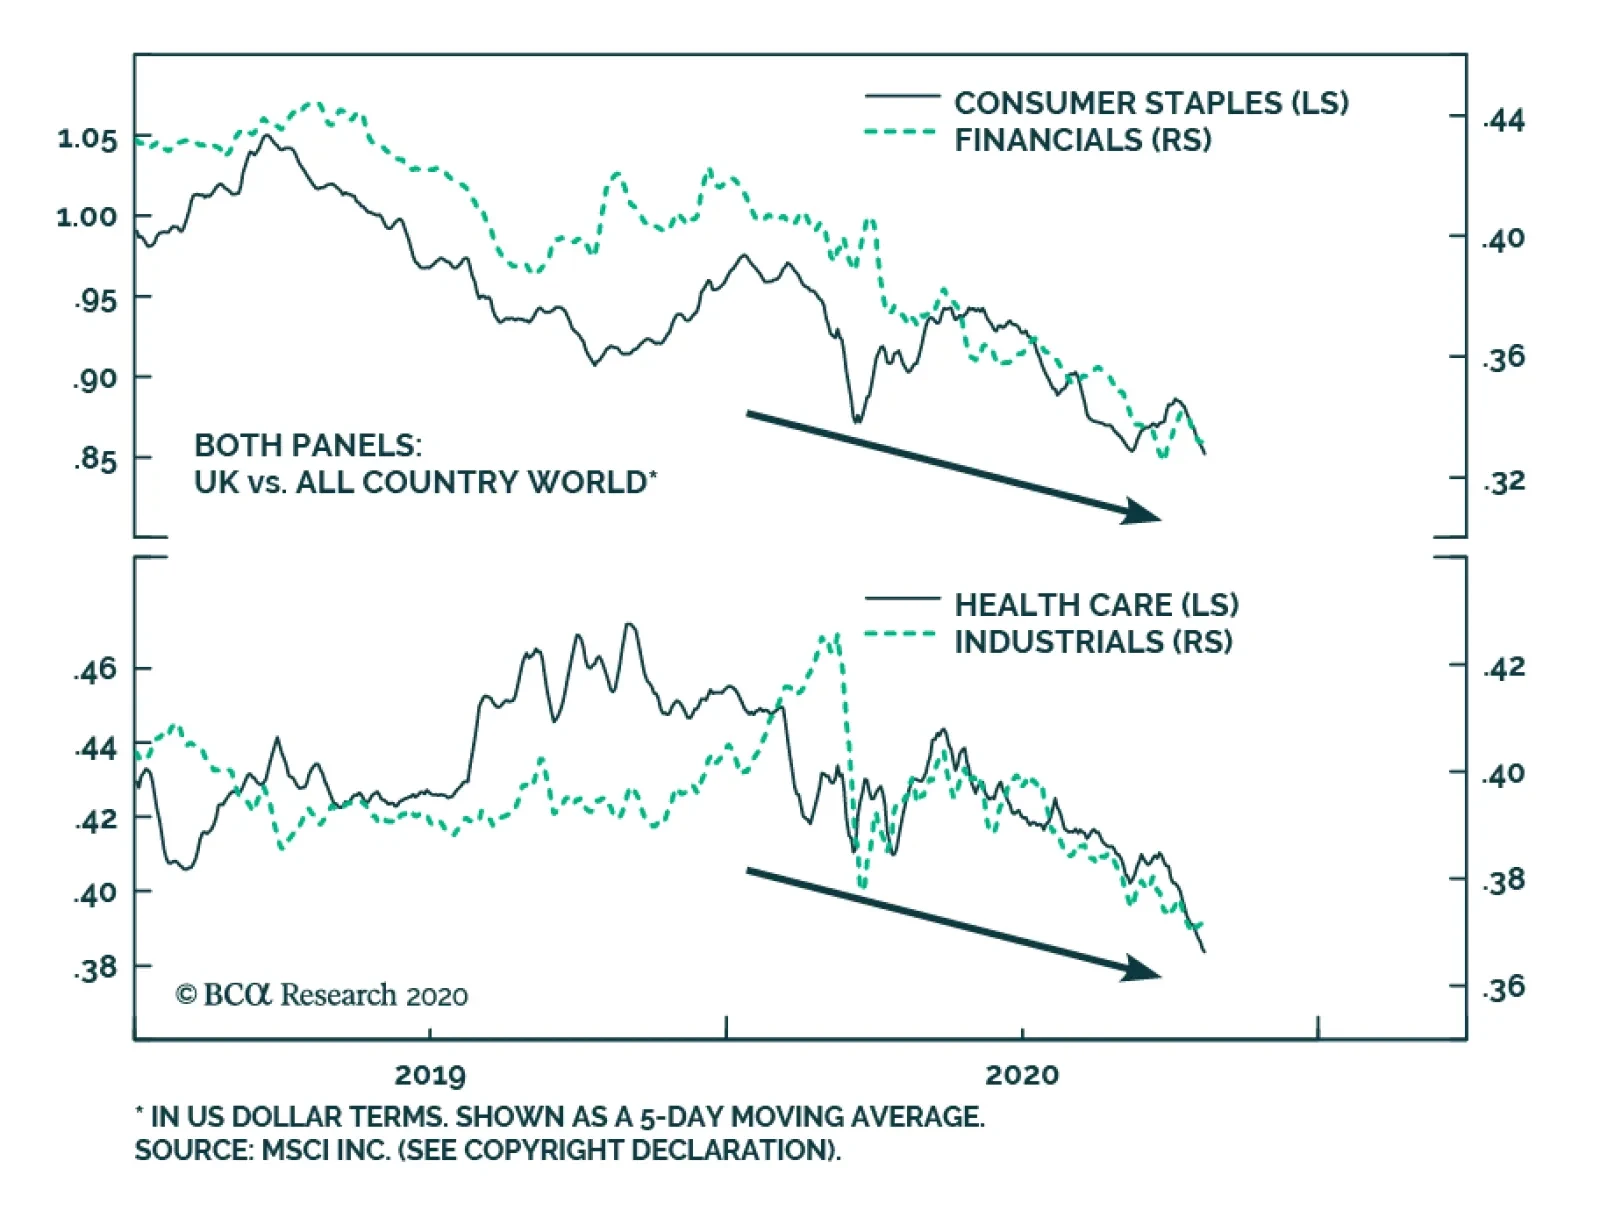
We noted in an Insight earlier this week that the performance of UK equities this year has been especially bad, in part due to the heavy tech underweight of the UK equity market. When analyzing regional equity performance, there are several approaches that…
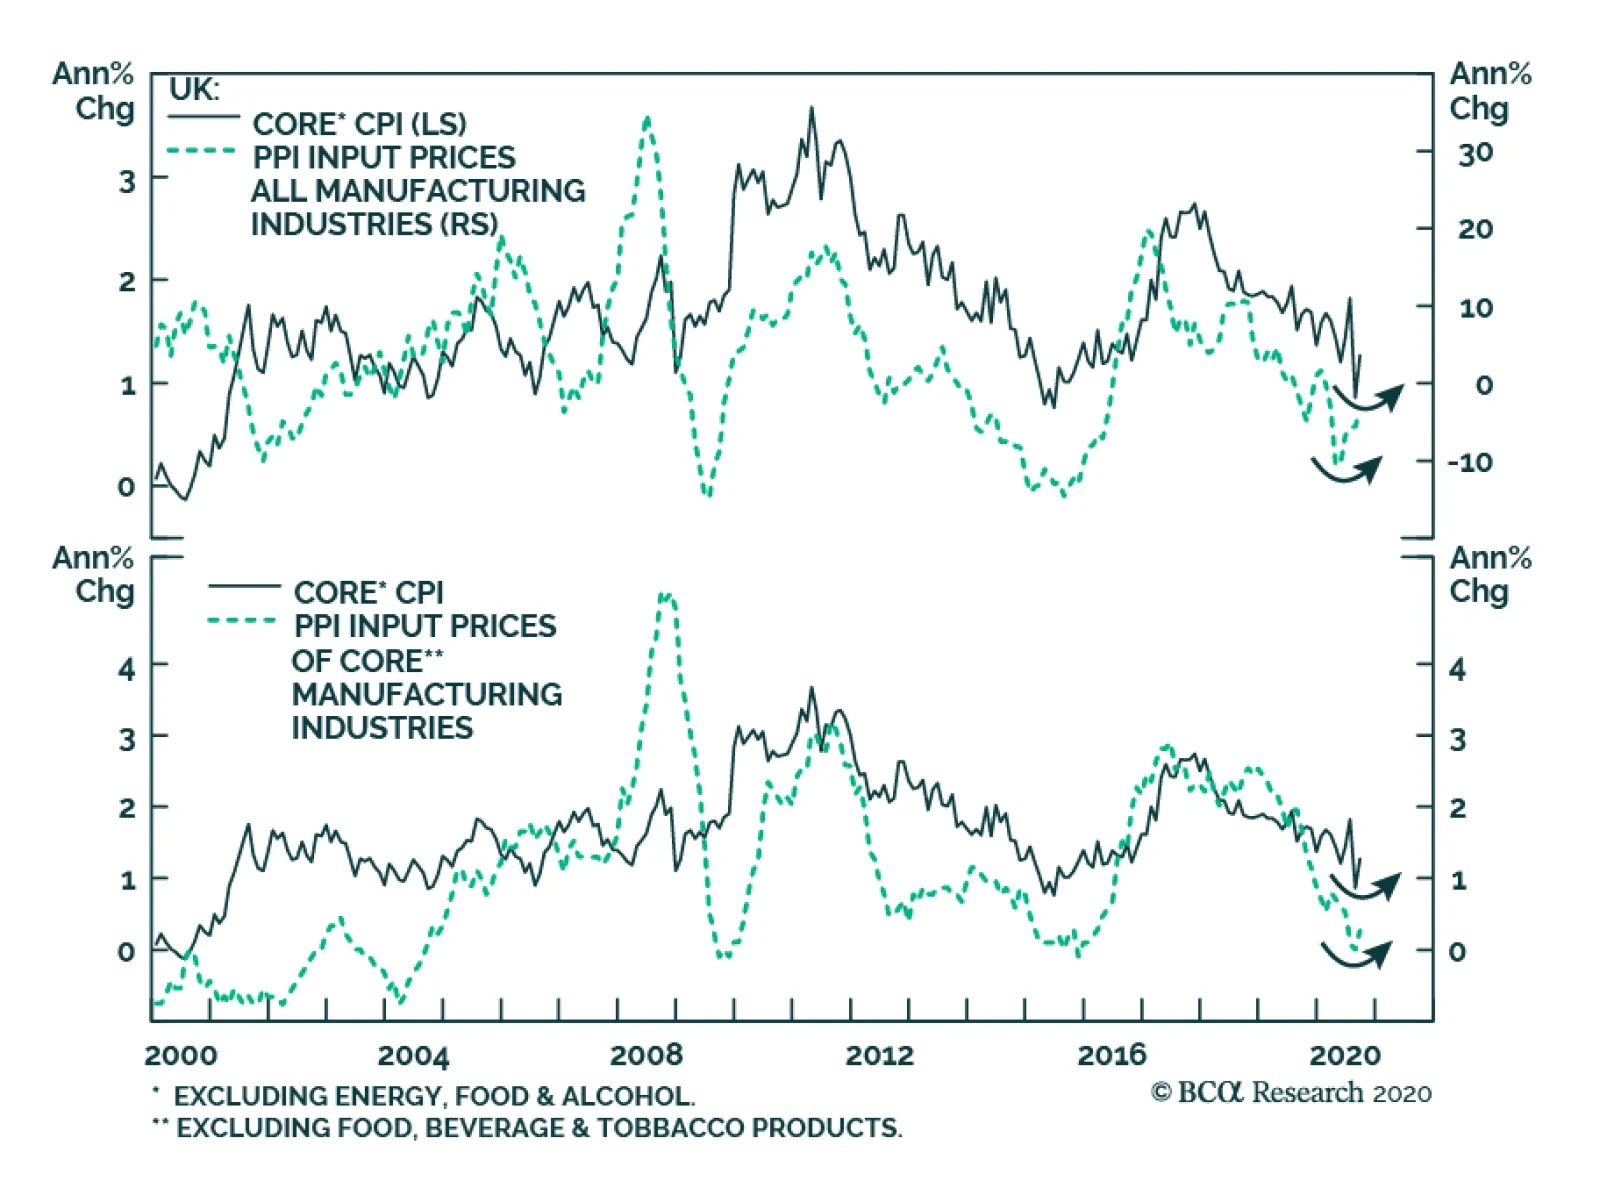
The various inflation indicators for the UK in September were a mixed bag. While Core CPI inflation hit expectations of 1.3% annually, the monthly headline CPI print hit 0.4%, below expectations of 0.5%. The most positive element came from the PPI release.…
Highlights US Election & Duration: We estimate that there is an 80% probability of a US election result that will give a lift to US Treasury yields via increased fiscal stimulus. Those are strong enough odds to justify a move to a below-benchmark cyclical US duration stance on a 6-12 month horizon. US Treasuries: We anticipate a moderate bear market in US Treasuries to unfold during the next 6-12 months. In addition to below-benchmark portfolio duration, investors should overweight TIPS versus nominal Treasuries, hold nominal and real yield curve steepeners, and hold inflation curve flatteners. Non-US Country Allocation: Within global government bond portfolios, downgrade the US to underweight. Favor countries that have lower sensitivity to rising US Treasury yields with central banks that are likely to be more dovish than the Fed in the next few years. That means increasing allocations to core Europe and Japan, while reducing exposure to Canada and Australia. Stay neutral on the UK given the near-term uncertainties over the final Brexit outcome. Feature With the US presidential election just two weeks away, public opinion polls continue to show that Joe Biden is the favorite to win the White House. However, the odds of a “Blue Sweep” - combining a Biden victory with the Democratic Party winning control of both the US Senate and House of Representatives - have increased since the end of September according to online prediction markets. US Treasury yields have also moved higher over that same period (Chart 1), which we interpret as the bond market becoming more sensitive to the likelihood of a major increase in US government spending under single-party Democratic control. Chart 1A Blue Sweep Is Bond Bearish
A Blue Sweep Is Bond Bearish
A Blue Sweep Is Bond Bearish
According to a recent analysis done by the Committee for a Responsible Federal Budget, President Trump’s formal policy proposals would increase US federal debt by $4.95 trillion between 2021 and 2030, while Biden’s plan would increase the debt by $5.60 trillion (Table 1).1 While those are both massive fiscal stimulus plans, there is a stark difference in the policy mix of their proposals that matters for the future path of US bond yields. Table 1A Comparison Of The Candidates' Budget Proposals
Beware The Bond-Bearish Blue Sweep
Beware The Bond-Bearish Blue Sweep
Under Biden, spending is projected to increase by a cumulative $11.1 trillion, partially offset by $5.8 trillion in revenue increases and savings with the former vice-president calling for tax hikes on corporations and high-income earners. On the other hand, Trump’s plan includes $5.45 trillion of spending increases and tax cuts over the next decade, offset by $0.75 trillion in savings. Conclusion: Biden would increase spending by over twice that of a re-elected Trump, with much of that spending expected to be front-loaded in the early part of his first term. Outright spending is more reflationary than tax cuts because it puts more money in the pockets of consumers (spenders) relative to producers (savers). The Biden plan would be more stimulating for overall activity even if the increase in debt is about the same. Another analysis of the Biden and Trump platforms was conducted by Moody’s in September, based on estimates of how much of each candidate’s promises could be successfully implemented under different combinations of White House and Congressional control.2 The stimulus figures were run through the Moody’s US economic model, which is similar to the budget scoring model of the US Congressional Budget Office, to produce a year-by-year path for the US economy over the next decade (Chart 2). Chart 2The Biden Platform Is Highly Stimulative
The Biden Platform Is Highly Stimulative
The Biden Platform Is Highly Stimulative
Moody’s concluded that the US economy would return to full employment in the second half of 2022 under a President Biden – especially if the Democrats win the Senate - compared to the first half of 2024 under a re-elected President Trump. Such a rapid closing of the deep US output gap that opened up because of the COVID-19 recession would likely trigger a reassessment of the Fed’s current highly dovish policy stance. The US output gap would close more rapidly under a President Biden, likely triggering a reassessment of the Fed’s current highly dovish policy stance. At the moment, the US overnight index swap (OIS) curve discounts one full 25bp Fed hike by late 2023/early 2024, and two full hikes by late 2024/early 2025 (Chart 3). This pricing of the future path of interest rates has occurred even with the Fed promising to keep the funds rate anchored near 0% until at least the end of 2023. The likelihood of some form of increased fiscal spending after the election will cause the bond market to challenge the Fed’s current forward guidance even more, putting upward pressure on Treasury yields. Chart 3US Fiscal Stimulus Will Pull Forward Fed Liftoff
US Fiscal Stimulus Will Pull Forward Fed Liftoff
US Fiscal Stimulus Will Pull Forward Fed Liftoff
Our colleagues at BCA Geopolitical Strategy see a Blue Sweep as the most likely outcome of the US election, although their forecasting models suggest that the race for control of the Senate will be much closer than the Biden vs Trump battle (there is little chance that control of the House of Representatives would switch back to the Republicans).3 Their scenarios for each of the White House/Senate combinations, along with their own estimated probability for each, are the following: Biden wins in a Democratic sweep: BCA probability = 45%. The US economy will benefit from higher odds of unfettered fiscal stimulus in 2021, although financial markets will simultaneously have to adjust for the negative shock to US corporate earnings from higher taxes and regulation. Government bond yields should rise on the generally reflationary agenda. Trump wins with a Republican Senate: BCA probability = 30%. In this status quo scenario, a re-elected President Trump would still face opposition from House Democrats on most domestic economic issues, forcing him to tilt towards more protectionist foreign and trade policies in his second term. Fiscal stimulus would be easy to agree, though not as large as under a Democratic sweep. US Treasury yields would rise, but would later prove volatile due to the risk to the cyclical recovery from a global trade war, as Trump’s tariffs will not be limited to China and could even affect the European Union. Biden wins with the Senate staying Republican: BCA probability = 20%. This is ultimately the most positive outcome for financial markets - reduced odds of a full-blown trade war with China, combined with no new tax hikes. Bond yields would drift upward over time, but not during the occasional fiscal battles that would ensue between the Democratic president and Republican senators. The first such battle would start right after the election. Treasuries would remain well bid until financial market pressures forced a Senate compromise with the new president sometime in H1 2021. Trump wins with a Democratic Senate: BCA probability = 5%. This is the least likely scenario but one that could produce a big positive fiscal impulse. Trump is a big spender and will veto tax hikes, but will approve populist spending on areas where he agrees. The Democratic Senate would not resist Trump’s tough stance on China, however, thus keeping the risk of US-China trade skirmishes elevated. This is neutral-to-bearish for US Treasuries, depending on the size of any bipartisan stimulus measures and Trump’s trade actions. The key takeaway is that the combined probability of scenarios that will put upward pressure on US Treasury yields is 80%, versus a 20% probability of a more bond-neutral outcome. That is a bond-bearish skew worth positioning for by reducing US duration exposure now, ahead of the November 3 election. Of this 80%, 35 percentage points come from scenarios in which President Trump would remain in power. Hence his trade wars would eventually undercut his reflationary fiscal policy. This would become the key risk to the short duration view after the initial market response. Bottom Line: The most likely scenarios for the US election will give a cyclical lift to US Treasury yields via increased fiscal stimulus. This justifies a move to a below-benchmark US duration stance on a 6-12 month horizon. If Trump is re-elected, the timing of Trump’s likely return to using broad-based tariffs will have to be monitored closely. A Moderate Bear Market Chart 4Less Election-Day Upside Than In 2016
Less Election-Day Upside Than In 2016
Less Election-Day Upside Than In 2016
While our anticipated Blue Sweep election outcome will lead to a large amount of fiscal spending in 2021 and beyond, we anticipate only a modest increase in bond yields during the next 6-12 months. In terms of strategy, our recommended reduction in portfolio duration reflects the fact that fiscal largesse meaningfully reduces the risk of another significant downleg in bond yields and strengthens our conviction in a moderate bear market scenario for bonds. This does raise the question of how large an increase in US Treasury yields we expect during the next 6-12 months. We turn to this question now. Not Like 2016 First, we do not expect a massive election night bond rout like we saw in 2016 (Chart 4). For one thing, the Fed was much more eager to tighten policy in 2016 than it is today, and it did deliver a rate hike one month after the Republicans won the House, Senate and White House (Chart 4, bottom panel). This time around, the Fed has made it clear that it will wait until inflation is running above its 2% target before lifting rates off the zero bound and will not respond directly to expectations for greater fiscal stimulus. A complete re-convergence to long-run fed funds rate estimates would impart 80 – 100 bps of upward pressure to the 5-year/5-year forward Treasury yield. Second, 2016’s election result was mostly unanticipated. This led to a dramatic adjustment in market prices once the results came in. The PredictIt betting market odds of a “Red Sweep” by the Republicans in 2016 were only 16% the night before the election. As of today, the betting markets are priced for a 58% chance of a Blue Sweep in 2020. Unlike in 2016, bonds are presumably already partially priced for the most bond-bearish election outcome. A Slow Return To Equilibrium To more directly answer the question of how high bond yields can rise, survey estimates of the long-run (or equilibrium) federal funds rate provide a useful starting point. In a world where the economy is growing at an above-trend pace and inflation is expected to move towards the Fed’s target, it is logical for long-maturity Treasury yields to settle near estimates of the long-run fed funds rate. Indeed, this theory is borne out empirically. During the last two periods of robust global economic growth (2017/18 & 2013/14), the 5-year/5-year forward Treasury yield peaked around levels consistent with long-run fed funds rate estimates (Chart 5). As of today, the median estimates of the long-run fed funds rate from the New York Fed’s Survey of Market Participants and Survey of Primary Dealers are 2% and 2.25%, respectively. In other words, a complete re-convergence to these equilibrium levels would impart 80 – 100 bps of upward pressure to the 5-year/5-year forward Treasury yield. We expect this re-convergence to play out eventually, but probably not within the next 6-12 months. In both prior periods when the 5-year/5-year forward Treasury yield reached these equilibrium levels, the Fed’s reaction function was much more hawkish. The Fed was hiking rates throughout 2017 & 2018 (Chart 5, panel 4), and the market moved quickly to price in rate hikes in 2013 (Chart 5, bottom panel). The Fed’s new dovish messaging will ensure that the market reacts less quickly this time around. Also, continued curve steepening will mean that the 5-year/5-year forward yield’s 80 – 100 bps of upside will translate into significantly less upside for the benchmark 10-year yield. The 10-year yield and 5-year/5-year forward yield peaked at similar levels in 2017/18 when the Fed was lifting rates and the yield curve was flat (Chart 6). But, the 10-year peaked far below the 5-year/5-year yield in 2013/14 when the Fed stayed on hold and the curve steepened. Chart 5How High For Treasury Yields?
How High For Treasury Yields?
How High For Treasury Yields?
Chart 6Less Upside In 10yr Than In 5y5y
Less Upside In 10yr Than In 5y5y
Less Upside In 10yr Than In 5y5y
The next bear move in bonds will look much more like 2013/14. The Fed will keep a firm grip over the front-end of the curve, leading to curve steepening and less upside in the 10-year Treasury yield than in the 5-year/5-year forward. In addition to shifting to a below-benchmark duration stance, investors should maintain exposure to nominal yield curve steepeners. Specifically, we recommend buying the 5-year note versus a duration-matched barbell consisting of the 2-year and 10-year notes (Chart 6, bottom panel).4 TIPS Versus Nominals We have seen that a full re-convergence to “equilibrium” implies 80 – 100 bps of upside in the 5-year/5-year forward nominal Treasury yield. Bringing TIPS into the equation, we have also observed that long-maturity (5-year/5-year forward and 10-year) TIPS breakeven inflation rates tend to settle into a range of 2.3 – 2.5 percent when inflation is well-anchored and close to the Fed’s target (Chart 7). The additional fiscal stimulus that will follow a Blue Sweep election makes it much more likely that the economic recovery will stay on course, leading to an eventual return of inflation to target and of long-maturity TIPS breakeven inflation rates to a 2.3 – 2.5 percent range. However, as with nominal yields, this re-convergence will be a long process whose pace will be dictated by the actual inflation data. To underscore that point, consider that our Adaptive Expectations Model of the 10-year TIPS breakeven inflation rate – a model that is driven by trends in the actual inflation data – has the 10-year breakeven rate as close to fair value (Chart 8).5 This fair value will rise only slowly over time, alongside increases in actual inflation. Chart 7Overweight TIPS Versus Nominals
Overweight TIPS Versus Nominals
Overweight TIPS Versus Nominals
Chart 8Real Yields Have Likely Bottomed
Real Yields Have Likely Bottomed
Real Yields Have Likely Bottomed
All in all, we continue to recommend an overweight allocation to TIPS versus nominal Treasuries. TIPS breakeven inflation rates will move higher during the next 6-12 months, but are unlikely to reach our 2.3 – 2.5 percent target range within that timeframe. TIPS In Absolute Terms As stated above, we expect nominal yields to increase more than real yields during the next 6-12 months, but what about the absolute direction of real (aka TIPS) yields? Here, our sense is that real yields have also bottomed. If we consider the extreme scenario where the 5-year/5-year forward nominal yield returns to its equilibrium level and where long-maturity TIPS breakeven inflation rates return to our target range, it implies about 80 bps of upside in the nominal yield and 40 bps of upside in the breakeven. This means that the 5-year/5-year real yield has about 40 bps of upside in a complete “return to equilibrium” scenario. While we don’t expect this “return to equilibrium” to be completed within the next 6-12 months, the process is probably underway. The only way for real yields to keep falling in this reflationary world is for the Fed to become increasingly dovish, even as growth improves and inflation rises. After its recent shift to an average inflation target, our best guess is that Fed rate guidance won’t get any more dovish from here. Real yields fell sharply this year as the market priced in this change in the Fed’s reaction function, but the late-August announcement of the Fed’s new framework will probably mark the bottom in real yields (Chart 8, bottom panel).6 Two More Curve Trades Chart 9Own Inflation Curve Flatteners And Real Curve Steepeners
Own Inflation Curve Flatteners And Real Curve Steepeners
Own Inflation Curve Flatteners And Real Curve Steepeners
In addition to moving to below-benchmark duration, maintaining nominal yield curve steepeners and staying overweight TIPS versus nominal Treasuries, there are two additional trades that investors should consider in order to profit from the reflationary economic environment. The first is inflation curve flatteners. The cost of short-maturity inflation protection is below the cost of long-maturity inflation protection, meaning that it has further to run as inflation returns to the Fed’s target (Chart 9). In addition, if the Fed eventually succeeds in achieving a temporary overshoot of its inflation target, then we should expect the inflation curve to invert. Real yield curve steepeners are in some ways the mirror image of inflation curve flatteners. Assuming no change in nominal yields, the real yield curve will steepen as the inflation curve flattens. But what makes real yield curve steepeners look even more attractive is that increases in nominal yields during the next 6-12 months will be concentrated in long-maturities. This will impart even more steepening pressure to the real yield curve. Investors should continue to hold inflation curve flatteners and real yield curve steepeners. Bottom Line: We anticipate a moderate bear market in US Treasuries to unfold during the next 6-12 months. In addition to below-benchmark portfolio duration, investors should overweight TIPS versus nominal Treasuries, hold nominal and real yield curve steepeners, and hold inflation curve flatteners. Non-US Government Bonds: Reduce Exposure To US Treasuries The mildly bearish case for US Treasuries that we have laid out above not only matters for our recommended duration stance, but also for our suggested country allocation within global government bond portfolios. Simply put, the risk of rising bond yields is much higher in the US than elsewhere, both for the immediate post-election period but also over the medium-term. Thus, the immediate obvious portfolio decision is to downgrade US Treasuries to underweight. The move higher in US Treasury yields that we expect is strictly related to spillovers from likely US fiscal stimulus. While other countries in the developed world are contemplating the need for additional fiscal measures, particularly in Europe where there is a renewed surge in coronavirus infections and growing economic restrictions, no country is facing as sharp a policy choice as the US with its upcoming election. The Fed has purchased 57% of all US Treasuries issued since late February of this year, in sharp contrast to the ECB and Bank of Japan that have purchased over 70% of euro area government bonds and JGBs issued. We can say with a fair degree of certainty that the US will have a relatively more stimulative fiscal policy stance than other developed economies over at least the next couple of years. This implies a higher relative growth trajectory for the US that hurts Treasuries more on the margin than non-US government debt. Chart 10The Fed Will Gladly Trade Less QE For More Fiscal Stimulus
Beware The Bond-Bearish Blue Sweep
Beware The Bond-Bearish Blue Sweep
In addition, the likely path of relative monetary policy responses are more bearish for US Treasuries. As described above, the scope of the US stimulus will cause bond investors to further question the Fed’s commitment to keeping the funds rate unchanged for the next few years. That also applies to the Fed’s other policy tools, like asset purchases. The Fed is far less likely to continue buying US Treasuries at the same aggressive pace it has for the past eight months if there is less need for monetary stimulus because of more fiscal stimulus. According to the IMF, the Fed has purchased 57% of all US Treasuries issued since late February of this year, in sharp contrast to the ECB and Bank of Japan that have purchased over 70% of euro area government bonds and JGBs issued (Chart 10). If US Treasury yields are rising because of improving US growth expectations, fueled by fiscal stimulus, the Fed will likely tolerate such a move and buy an even lower share of Treasuries issued – particularly if the higher bond yields do not cause a selloff in US equity markets that can tighten financial conditions and threaten the growth outlook. The fact that US equities have ignored the rise in Treasury yields seen since the end of September may be a sign that both bond and stock investors are starting to focus on a faster trajectory for US growth. In terms of country allocation, beyond downgrading US Treasuries to underweight, we recommend upgrading exposure to countries that are less sensitive to changes in US Treasury yields (i.e. countries with a lower yield beta to changes in US yields). In Chart 11, we show the rolling beta of changes in 10-year government bond yields outside the US to changes in 10-year US Treasury yields. This is a variation of the “global yield beta” concept that we have discussed in the BCA Research bond publications in recent years. Here, we modify the idea to look at which countries are more or less correlated to US yields, specifically. A few points stand out from the chart: Chart 11Reduce Exposure To Bond Markets More Correlated To UST Yields
Reduce Exposure To Bond Markets More Correlated To UST Yields
Reduce Exposure To Bond Markets More Correlated To UST Yields
All countries have a “US yield beta” of less than 1, suggesting that Treasuries are a consistent outperformer when US yields fall and vice versa. This suggests moving to underweight the US when US yields are rising is typically a winning strategy in a portfolio context. The list of higher beta countries includes Canada, Australia, New Zealand, the UK and Germany; although Canada stands out as having the highest yield beta in this group. The list of lower beta countries includes France, Italy, Spain, and Japan. In Chart 12, we show what we call the “upside yield beta” that is estimated only using data for periods when Treasury yields are rising. This gives a sense of which countries are more likely to outperform or underperform during a period of rising Treasury yields, as we expect to unfold after the election. From this perspective, the “safer” lower US upside yield beta group includes the UK, France, Germany and Japan. The riskier higher US upside yield beta group includes Canada, Australia, New Zealand, Italy and Spain. Chart 12Favor Bond Markets Less Correlated to RISING UST Yields
Favor Bond Markets Less Correlated to RISING UST Yields
Favor Bond Markets Less Correlated to RISING UST Yields
Spain and Italy are less likely to behave like typical high-beta countries as US yields rise, however, because the ECB is likely to remain an aggressive buyer of their government bonds as part of their asset purchase programs over the next 6-12 months. We also do not recommend trading UK Gilts off their yield beta to US Treasuries in the immediate future, given the uncertainties over the negotiations over a final Brexit deal. Both sets of US yield betas suggest higher-beta Canada, Australia and New Zealand are more at risk of relative underperformance versus lower-beta France, Germany and Japan. In terms of government bond country allocation, we recommend reducing exposure to the former group and increasing allocations to the latter group. Bottom Line: Within global government bond portfolios, downgrade the US to underweight. Favor countries that have lower sensitivity to rising US Treasury yields, especially those with central banks that are likely to be more dovish than the Fed in the next few years. That means increasing allocations to core Europe and Japan, while reducing exposure to “higher-beta” Canada and Australia. Robert Robis, CFA Chief Fixed Income Strategist rrobis@bcaresearch.com Ryan Swift US Bond Strategist rswift@bcaresearch.com Footnotes 1 http://www.crfb.org/papers/cost-trump-and-biden-campaign-plans 2 https://www.moodysanalytics.com/-/media/article/2020/the-macroeconomic-consequences-trump-vs-biden.pdf 3 Please see BCA Research Geopolitical Strategy Special Report, “Introducing Our Quantitative US Senate Election Model”, dated October 16, 2020, available at gps.bcaresearch.com 4 For more details on this recommended steepener trade please see US Bond Strategy Weekly Report, “Positioning For Reflation And Avoiding Deflation”, dated August 11, 2020, available at usbs.bcaresearch.com 5 For more details on our Adaptive Expectations Model please see US Bond Strategy Weekly Report, “How Are Inflation Expectations Adapting?”, dated February 11, 2020, available at usbs.bcaresearch.com 6 For a detailed look at the implications of the Fed’s policy shift please see US Bond Strategy / Global Fixed Income Strategy Special Report, “A New Dawn For US Monetary Policy”, dated September 1, 2020, available at usbs.bcaresearch.com
Highlights Long-term investors should seek companies and sectors that facilitate and support a new way of doing things: specifically, a way of life and business that is more de-centralised and de-urbanised… …and a way of life in which we live, work, and interact more online, remotely, and digitally. The long-term winners will be technology, biotechnology, healthcare, and communications: the growth defensives. The long-term losers will be banks, oil and gas, and resources: the value cyclicals. The European stock market’s substantial underweighting to the growth defensives will weigh on its relative performance, both in the short term and in the long term. Fractal trade: Overweight the US 30-year T-bond versus the French 30-year OAT. Also, we have closed our tactical underweight to equities versus bonds. Feature Chart of the WeekYield Chasers Get A Rude Awakening As Dividends Collapse
Yield Chasers Get A Rude Awakening As Dividends Collapse
Yield Chasers Get A Rude Awakening As Dividends Collapse
For the world’s yield chasers, 2020 has been a rude awakening. What seemed to be safe and attractive dividend yields have vanished into smoke, as blue-chip company after blue-chip company has slashed its dividend. To name just a few, HSBC has cut its dividend to zero for the first time ever; Barclays has cut its dividend to zero for the first time since 2009; and Royal Dutch Shell has slashed its dividend by 34 percent, taking it back to where it was in 2009. More generally, the high-yielding sectors have slashed their dividends: the world oil and gas sector by 60 percent (Chart of the Week) and the world bank sector by 33 percent (Chart I-2). The basic resources sector has cut its dividend by a more modest 15 percent, but the dividend now stands at the same level as it was in 2009 (Chart I-3). Chart I-2Dividend Cuts From High-Yielding Banks...
Dividend Cuts From High-Yielding Banks...
Dividend Cuts From High-Yielding Banks...
Chart I-3...And High-Yielding Resource Companies
...And High-Yielding Resource Companies
...And High-Yielding Resource Companies
In contrast, the low-yielding technology and healthcare sectors have managed to grow their dividends consistently over the past decades, and then maintain the dividends during the current crisis (Chart I-4 and Chart I-5). Chart I-4Dividend Growth And Continuity From ##br##Low-Yielding Healthcare...
Dividend Growth And Continuity From Low-Yielding Healthcare...
Dividend Growth And Continuity From Low-Yielding Healthcare...
Chart I-5…And Low-Yielding ##br##Tech
...And Low-Yielding Tech
...And Low-Yielding Tech
The world’s yield chasers have had a rude awakening because they often confuse yield with return. One reason for this confusion is that for cash and for high-quality government bonds held to redemption, yield and return are broadly the same.1 But for an equity, yield and return are not the same. As we have seen with the oil and gas sector and banks, an equity could start with a seemingly safe and attractive dividend yield yet end up generating a deeply negative return.2 The lesson is that long-term investors should never search for yield, they should always search for return. Mental Accounting Bias, And The Irrational Search For Yield The confusion between yield and return is not just an issue of semantics. It is a well-known phenomenon in behavioural finance known as mental accounting bias.3 This psychological bias describes the tendency to group financial gains and losses into separate mental accounts or buckets. This causes people to treat money differently according to the bucket that the money occupies. One version of this bias is a distinction between the return that an investment provides from yield and that which it provides from capital appreciation. The distinction between yield and capital appreciation is irrational. Assuming an equal tax treatment, the money that comes from yield and the money that comes from capital appreciation is perfectly fungible. Yet psychologically, the distinction is very stark. Behavioural finance postulates that because of fears about self-control, some people tend to categorize an investment’s yield as spending money, and its capital as saving money. Long-term investors should never search for yield, they should always search for return. Hence, those people who want their assets to generate spending money – say, retirees – have an irrational bias towards investments that generate yield. Whereas those people that are saving for the long term have a bias towards investments that generate capital growth. To reiterate, these biases are completely irrational. Under normal circumstances, the irrational biases are not a problem because there are enough investments available for both buckets. But in today’s world of zero and negative interest rates, the assets that would normally generate the safe income for the spending bucket – cash and government bonds – are no longer doing so (Chart I-6). In the ensuing ‘search for yield’, income focussed investors have flocked to the dwindling number of investments that appear to generate the required income, such as high-yielding equities. But in irrationally focussing on yield rather than on expected return, the world’s yield chasers have lost a lot of money. Chart I-6Equities Are The Only Yield-Generating Mainstream Asset-Class
Equities Are The Only Yield-Generating Mainstream Asset-Class
Equities Are The Only Yield-Generating Mainstream Asset-Class
The Halo Effect, And The Shattered Halo The matter is made worse by a second phenomenon in behavioural finance known as the halo effect. This is the tendency to worship – place a halo – on someone or something based on some narrow criteria. For a company, the narrow criteria can mean its dividend history. The dividend is one of the few financial metrics over which the company has substantial control, giving it totemic significance with the company’s investors. Investors place a halo on companies with dividend continuity, a lengthy absence of a dividend cut. The distinction between yield and capital appreciation is irrational. However, if the company cuts its dividend, even slightly, then the halo shatters. Given this stigma, companies try very hard not to cut the dividend until it is unavoidable. But when they do cut, they usually cut big, and for an extended period – because the halo is shattered anyway (Chart I-7 and Chart I-8). Chart I-7When Firms Cut Their Dividends, They Usually Cut Big...
When Firms Cut Their Dividends, They Usually Cut Big...
When Firms Cut Their Dividends, They Usually Cut Big...
Chart I-8...And For An Extended ##br##Period
...And For An Extended Period
...And For An Extended Period
Realising this, investors flip the company from saint to sinner, meaning that they demand a higher cost of capital. The upshot is that even after the dividend cut, the stock can suffer a prolonged period of underperformance. Low Yield To Deliver High Return To repeat, long-term investors should never search for yield, they should always search for return. Today, this search for return boils down to two questions: Which companies will be able to grow or, at the very least, maintain their dividends in the post-pandemic world? What is the likely direction of bond yields, and specifically the long-duration T-bond yield, given its pivotal role in setting the discount rate on all investments? To the first question, the winning companies will be the ones that facilitate and support a new way of doing things: specifically, a way of life and business that is more de-centralised and de-urbanised. And one in which the way we live, work, and interact – both socially and economically – is more remote, online, and digital. The pandemic is the accelerant, and not the cause, of the structural shift in our way of life. Crucially, this means that when a credible treatment for Covid-19 eventually arrives, it will not reverse the major changes that our way of life is now undergoing. To the second question, the Federal Reserve’s recent strategic review has made its reaction function blatantly asymmetric, especially to the labour market. The central bank has told us that it will be thick-skinned to reflationary shocks or lower unemployment, but trigger-happy to the slightest further deflationary shock or higher unemployment. The pandemic is the accelerant, and not the cause, of the structural shift in our way of life. Hence, when the slightest further deflationary shock comes – and sooner or later it will – the Fed will either follow the Bank of England in a volte-face about adding negative interest rate policy into its toolbox. Or more likely, the Fed will follow the Bank of Japan in formally implementing yield curve control. Either way, US long-duration bond yields will eventually converge with those in the UK and Japan at zero. The result of our two answers is that long-term investors should seek companies that can thrive off the major changes in the way we live, work, and interact; and investors should seek companies with long-duration cashflows that benefit most from a further compression in the long-duration T-bond yield. In combination, the long-term winners will be technology, biotechnology, healthcare, and communications: the growth defensives (Chart I-9). And the long-term losers will be banks, oil and gas, and resources: the value cyclicals (Chart I-10). Chart I-9Growth Defensives Are The Long-Term Winners
Growth Defensives Are The Long-Term Winners
Growth Defensives Are The Long-Term Winners
Chart I-10Value Cyclicals Are The Long-Term##br## Losers
Value Cyclicals Are The Long-Term Losers
Value Cyclicals Are The Long-Term Losers
For the European stock market, the unfortunate consequence is that its substantial underweighting to the growth defensives sectors will weigh on its relative performance, both in the short term and in the long term. Fractal Trading System* This week’s recommended trade is to go long the US 30-year T-bond versus the French 30-year OAT. Set the profit target and symmetrical stop-loss at 3.2 percent. The tactical underweight to equities versus bonds (short DAX versus 10-year T-bond) reached the end of its holding period. Although it closed in slight loss, the fractal signal correctly identified that the majority of the strong rally in the DAX was over by mid-July after which the DAX has traded broadly sideways. The countertrend move in the Italian BTP’s rally versus the German bund did not materialise, so this trade was closed at its stop-loss. The rolling 1-year win ratio now stands at 57 percent. Chart I-1130-Year Govt. Bonds: US Vs. France
30-Year Govt. Bonds: US Vs. France
30-Year Govt. Bonds: US Vs. France
When the fractal dimension approaches the lower limit after an investment has been in an established trend it is a potential trigger for a liquidity-triggered trend reversal. Therefore, open a countertrend position. The profit target is a one-third reversal of the preceding 13-week move. Apply a symmetrical stop-loss. Close the position at the profit target or stop-loss. Otherwise close the position after 13 weeks. * For more details please see the European Investment Strategy Special Report “Fractals, Liquidity & A Trading Model,” dated December 11, 2014, available at eis.bcaresearch.com. Dhaval Joshi Chief European Investment Strategist dhaval@bcaresearch.com Footnotes 1 Assuming no reinvestment risk on the bond’s income. 2 This is because unlike the government bond, the equity does not generate a predetermined stream of cash flows. 3 See Rational Choice and the Framing of Decisions by Amos Tversky and Daniel Kahneman. Fractal Trading System Cyclical Recommendations Structural Recommendations Closed Fractal Trades Trades Closed Trades Asset Performance Currency & Bond Equity Sector Country Equity Indicators Bond Yields Chart II-1Indicators To Watch - Bond Yields
Indicators To Watch - Bond Yields
Indicators To Watch - Bond Yields
Chart II-2Indicators To Watch - Bond Yields
Indicators To Watch - Bond Yields
Indicators To Watch - Bond Yields
Chart II-3Indicators To Watch - Bond Yields
Indicators To Watch - Bond Yields
Indicators To Watch - Bond Yields
Chart II-4Indicators To Watch - Bond Yields
Indicators To Watch - Bond Yields
Indicators To Watch - Bond Yields
Interest Rate Chart II-5Indicators To Watch - Interest Rate Expectations
Indicators To Watch - Interest Rate Expectations
Indicators To Watch - Interest Rate Expectations
Chart II-6Indicators To Watch - Interest Rate Expectations
Indicators To Watch - Interest Rate Expectations
Indicators To Watch - Interest Rate Expectations
Chart II-7Indicators To Watch - Interest Rate Expectations
Indicators To Watch - Interest Rate Expectations
Indicators To Watch - Interest Rate Expectations
Chart II-8Indicators To Watch - Interest Rate Expectations
Indicators To Watch - Interest Rate Expectations
Indicators To Watch - Interest Rate Expectations