Europe
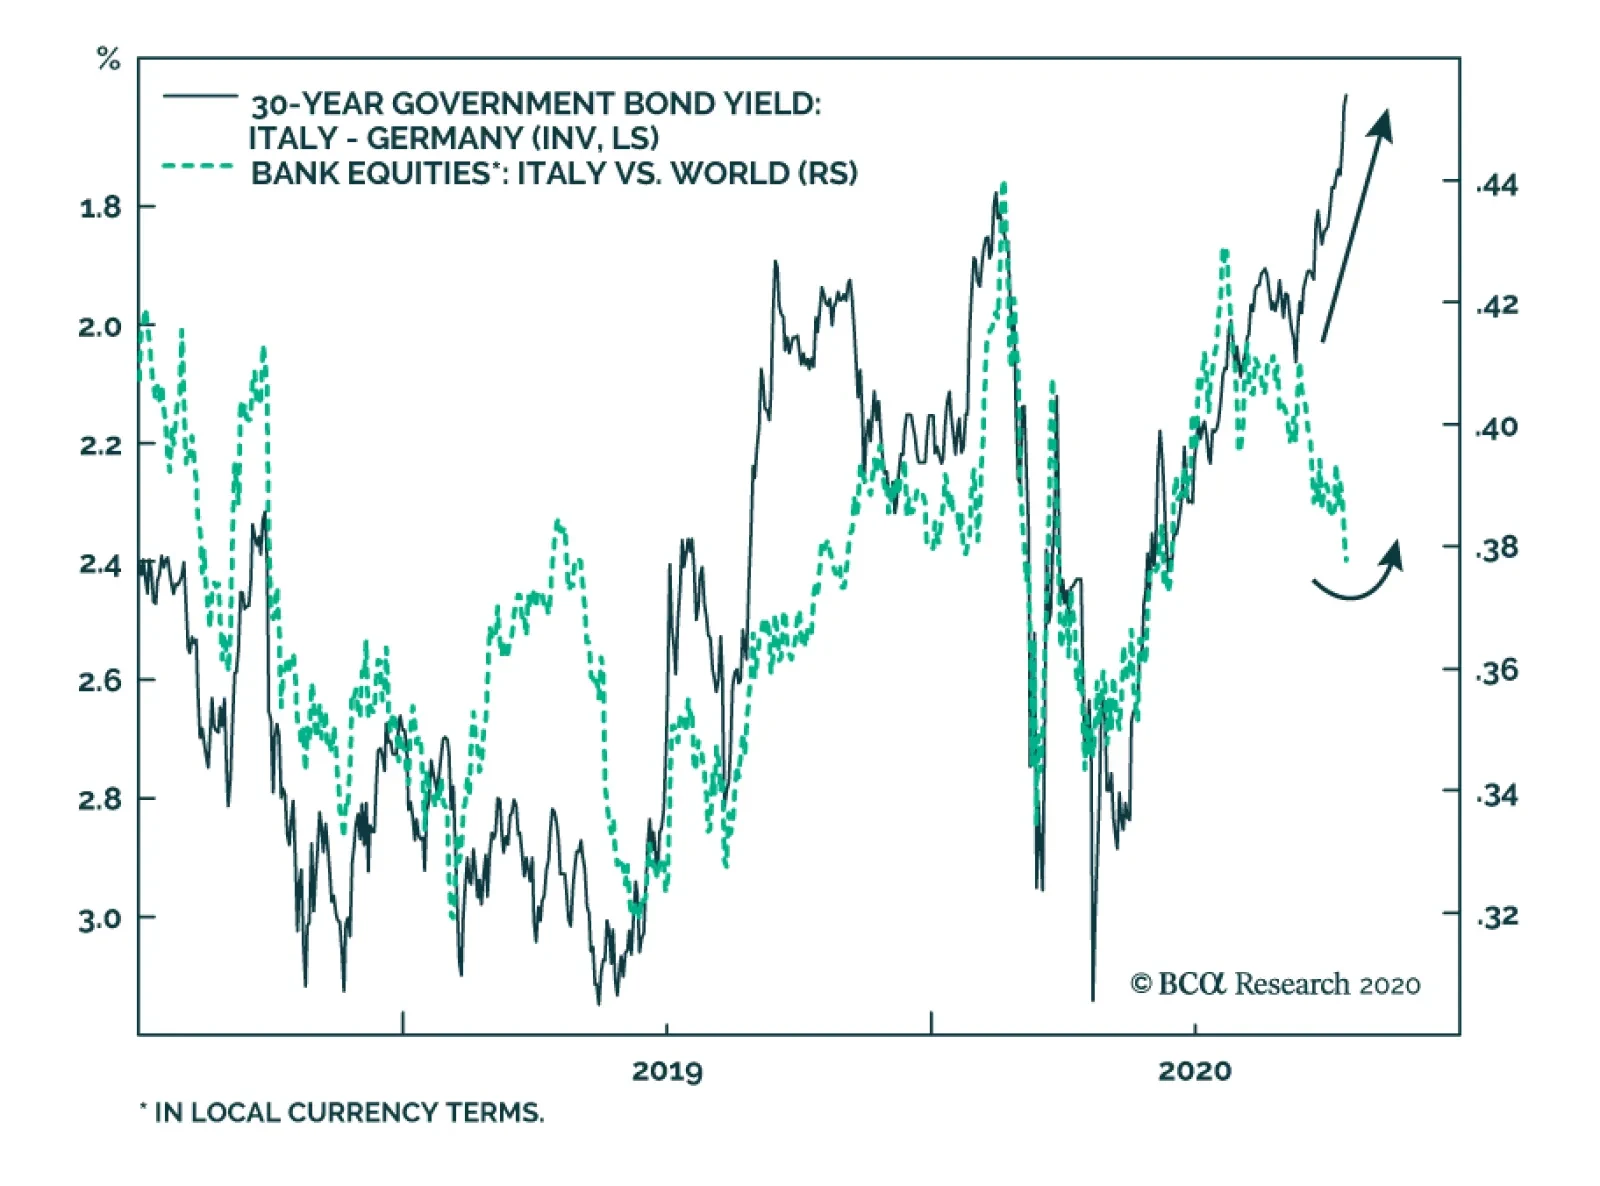
It is in fashion to talk about the collapse of Italian yields to record lows, but one of the key investment implications of this move is often overlooked: it makes Italian banks attractive relative to lenders in other nations. The fall in yields,…
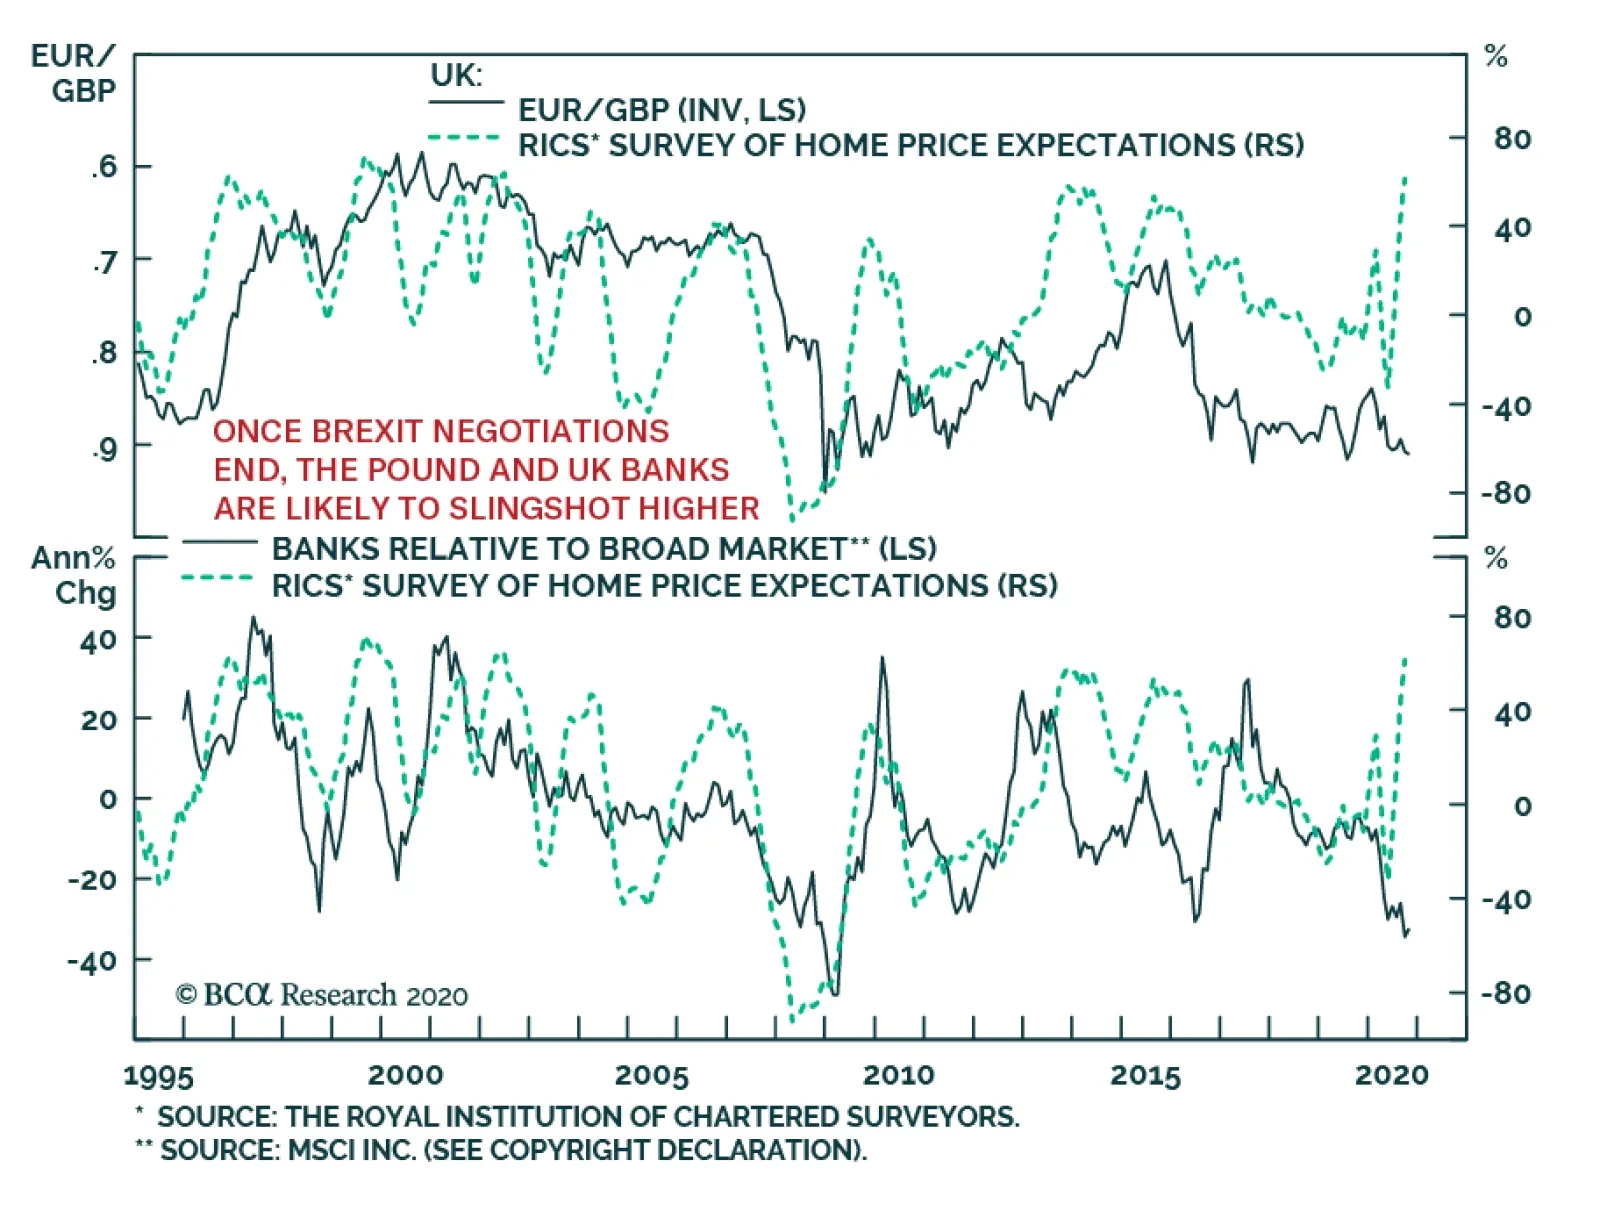
The UK’s RICS House Price Balance indicator surged to 61% in September, handily beating expectations of a decline to 40% from 44%. A strong RICS argues in favor of an acceleration in UK house price gains, which creates a powerful tailwind for…
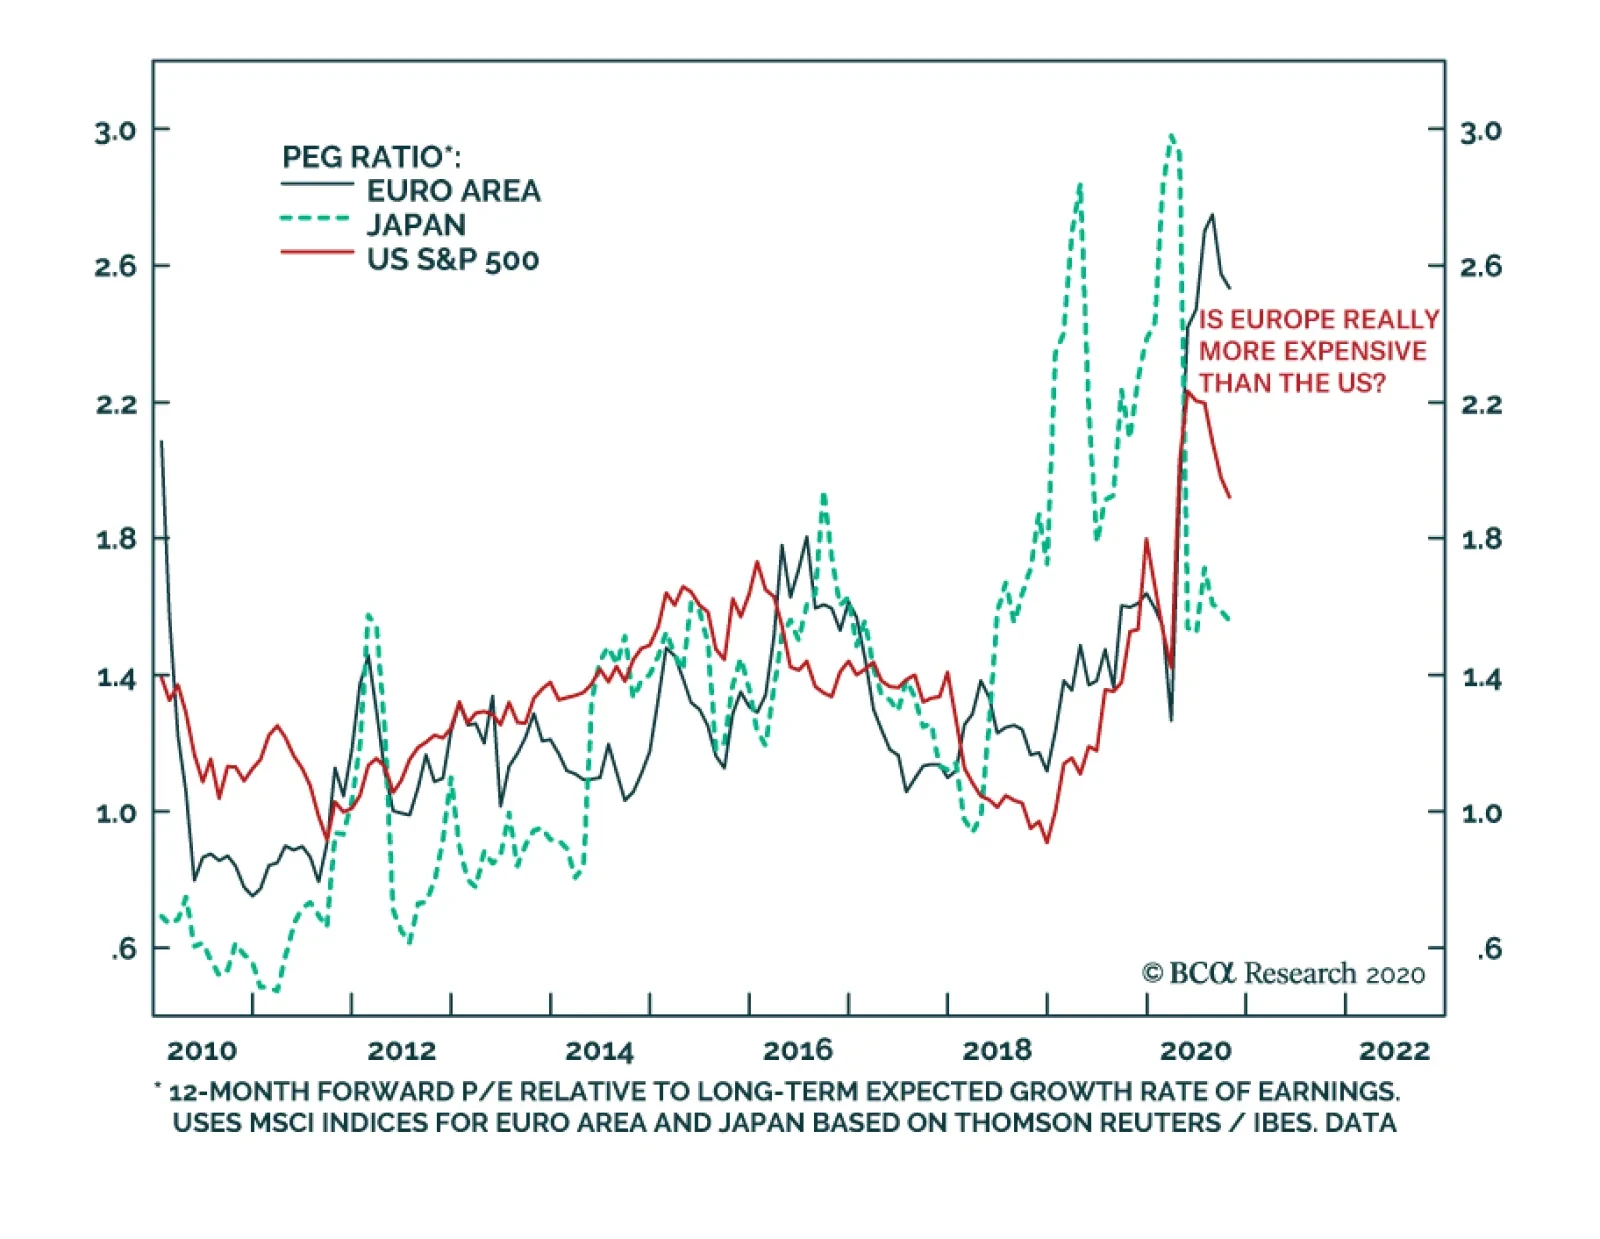
When looking at multiples like the price-to-book or price-to-earnings ratios, it is easy to paint the S&P 500 as exceptionally expensive compared to other major equity markets. However, the picture becomes murkier if we take into account growth…
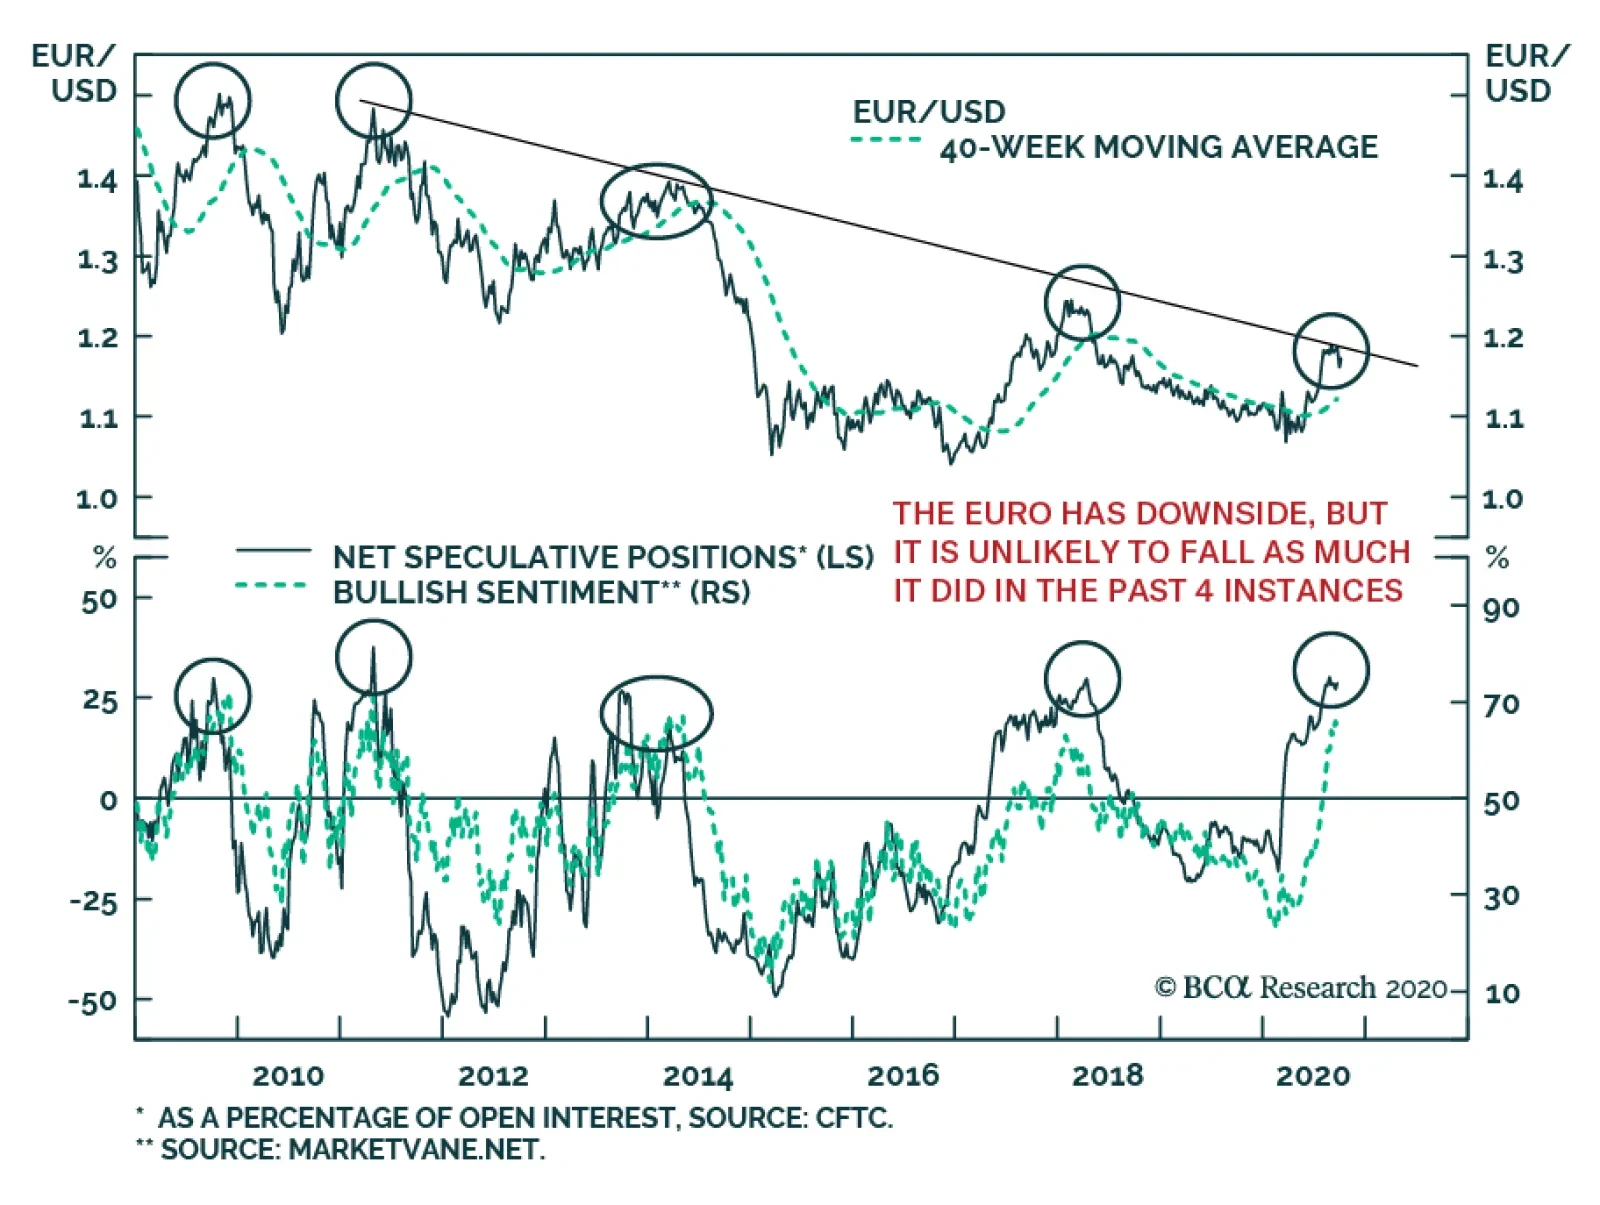
In recent weeks, we have repeatedly warned that since March, the dollar had fallen too quickly and risked staging a countertrend bounce. As a corollary, the euro was expected to undergo a temporary correction that could see it revisit the 1.14-1.15 zone. …

Highlights Misunderstanding 1: The danger of Covid-19 is its short-term mortality rate. In fact, the danger of Covid-19 is its long-term mortality and morbidity rate. Misunderstanding 2: The government-imposed lockdown causes the pandemic recession. In fact, the pandemic causes the pandemic recession. Misunderstanding 3: The pandemic’s main economic casualty is output. In fact, the pandemic’s main economic casualty is employment. Misunderstanding 4: The pandemic is a temporary shock to the way we live, work, and interact. In fact, the pandemic is accelerating long-term shifts in the way we live, work, and interact. Misunderstanding 5: The pandemic is pulling Europe apart. In fact, the pandemic is pulling Europe together. Feature Chart of the WeekThe Pandemic Is Pulling Europe Together
The Pandemic Is Pulling Europe Together
The Pandemic Is Pulling Europe Together
Covid-19 is a novel disease. And living through a pandemic is a novel experience for most of us. The result is that many things are not fully understood. In this report, we pull together five major misunderstandings about the Covid-19 pandemic. Or at least, five topics on which we disagree with the mainstream narratives. Misunderstanding 1: The danger of Covid-19 is its short-term mortality rate. Truth 1: The danger of Covid-19 is its long-term mortality and morbidity rate. Some people argue that the danger of Covid-19 is overstated. The mortality rate seems low, especially in the new waves of the pandemic. These people argue that we should just let the pandemic rip to achieve so-called ‘herd immunity’. Yet this focus on the low immediate mortality rate misunderstands the true danger (Chart I-2). Chart I-2Focussing On Covid-19’s Low Immediate Mortality Rate Misunderstands The Danger
Five Major Misunderstandings About Covid-19
Five Major Misunderstandings About Covid-19
The true danger might come from the long-term impact on mortality and morbidity. A good analogy is a non-lethal dose of radiation. It won’t kill you straightaway, and you might not even feel any immediate ill effects, but the exposure does irreparable long-term harm. Unlike other diseases, Covid-19 appears to have long-term sequelae. Unlike other diseases, Covid-19 appears to have long-term sequelae. It can permanently damage your respiratory, vascular, and metabolic systems. As The Lancet points out:1 “Weeks and months after the onset of Covid-19, people continue to suffer. 78 of 100 patients in an observational cohort study who had recovered from Covid-19 had abnormal findings on cardiovascular MRI and 36 reported dyspnoea and unusual fatigue… these patients are not only those recovering from the severe form of the acute disease, but also those who had mild and moderate disease. Long-term sequelae of Covid-19 are unknown… Other concerns are rising: does it cause diabetes, or other metabolic disorders? Will patients develop interstitial lung disease? We owe good answers on the long-term consequences of the disease to our patients and healthcare providers.” Until we know these answers, letting the pandemic rip to achieve herd-immunity is a very dangerous misunderstanding. Misunderstanding 2: The government-imposed lockdown causes the pandemic recession. Truth 2: The pandemic causes the pandemic recession. A pandemic is a classic complex adaptive system, in which there is constant feedback from millions of individual human actions to the pandemic, and from the pandemic to millions of individual human actions. It is this complex adaptive behaviour that generates a pandemic’s classic waves of infection, as well as its recessions. In response to an escalating pandemic, our instinct for self-preservation makes us go into our shells. In response to an escalating pandemic, our instinct for self-preservation makes us go into our shells. We shun crowds and public places, with the result that so-called ‘social consumption’ collapses. The misunderstanding is that the government-imposed lockdown causes the collapse in social consumption. In fact, this is a classic confusion between correlation and causation. The true cause of the recession is that the escalating pandemic is making millions of people go into their shells. But to the extent that an escalating pandemic also leads to an escalating lockdown, many people confuse the correlated lockdown with the underlying cause, the escalating pandemic. As we have previously pointed out, Sweden imposed no lockdown, while its neighbour Denmark imposed the most extreme lockdown in Europe. If it was the government-imposed lockdown that caused the recession, then the economy of no-lockdown Sweden should have fared much better than that of lockdown Denmark. In fact, based on the rise in unemployment rates, no-lockdown Sweden performed worse than lockdown Denmark (Chart I-3 and Chart I-4). Chart I-3No-Lockdown Sweden Performed No Better...
No-Lockdown Sweden Performed No Better...
No-Lockdown Sweden Performed No Better...
Chart I-4...Than Lockdown Denmark
...Than Lockdown Denmark
...Than Lockdown Denmark
Misunderstanding 3: The pandemic’s main economic casualty is output. Truth 3: The pandemic’s main economic casualty is employment. The widespread use of physical distancing and face masks restricts any activity that requires the use of your mouth and nose in proximity to others. These activities are concentrated in three highly labour-intensive sectors: hospitality, retail, and transport. Using the US as a template, hospitality, retail, and transport contribute 12 percent of economic output, but employ 25 percent of all workers (Table I-1). If the pandemic forces these sectors to operate one third below full capacity, the economy will lose a tolerable 4 percent of output. But it will lose a devastating 8.3 percent of jobs. And on less optimistic assumptions, the job destruction could rise to well over 10 percent. Table I-1Sectors Hurt By Social Distancing Employ 25% Of All Workers
Five Major Misunderstandings About Covid-19
Five Major Misunderstandings About Covid-19
Conversely, sectors which are unaffected by physical distancing and face masks make a much bigger contribution to economic output relative to employment. Financial activities generate 19 percent of economic output, but just 6 percent of jobs. Information technology generates 5 percent of output, but just 2 percent of jobs. Sectors hurt by social distancing employ 25 percent of all workers. Hence, the main economic casualty of the pandemic is not output. The main casualty is employment (Chart I-5 and Chart I-6). Worse, as employment suffers much more than output, the pandemic is devastating low-paid jobs. Chart I-5The Main Economic Casualty Of The Pandemic Is Employment…
Five Major Misunderstandings About Covid-19
Five Major Misunderstandings About Covid-19
Chart I-6…Not ##br##Output
Five Major Misunderstandings About Covid-19
Five Major Misunderstandings About Covid-19
Misunderstanding 4: The pandemic is a temporary shock to the way we live, work, and interact. Truth 4: The pandemic is accelerating long-term shifts in the way we live, work, and interact. The pandemic appears to have crystallised many shifts in consumer and business behaviour: for example, de-urbanisation, the shift from offline to online retailing, the shift from office working to remote working, and the shift from business travel to virtual meetings. In fact, these shifts were already in motion well before the pandemic hit (Chart I-7 and Chart I-8). Chart I-7The Pandemic Is Accelerating The Structural Shifts To De-Urbanisation…
Five Major Misunderstandings About Covid-19
Five Major Misunderstandings About Covid-19
Chart I-8…And Online ##br##Shopping
Five Major Misunderstandings About Covid-19
Five Major Misunderstandings About Covid-19
If the pandemic suddenly ended tomorrow, would people flock back to full-time office work in city centres? Would they flock back to bricks and mortar retailers? Would they return to the same intensity of long-haul business travel? We think not, because the shifts from these activities are not temporary. They are structural. The pandemic is devastating low-paid jobs. The pandemic has accelerated the hollowing out of labour-intensive industries such as bricks and mortar retailing, city centre cafes, bars and restaurants, and commercial travel. Combined with the ongoing threat to jobs from AI, this hollowing out process is blighting the job prospects of a generation, creating large numbers of underemployed and unemployed workers. Misunderstanding 5: The pandemic is pulling Europe apart. Truth 5: The pandemic is pulling Europe together. Let’s end on a positive note. The pandemic has allowed Europe to smash two major taboos: explicit fiscal transfers across countries, and the large-scale issuance of common EU bonds. The EU recovery plan also starts discussions on how the EU can ‘increase its own resources’. Which is to say, raise its own taxes. 2020 might turn out to be the most important year for European integration. The EU’s €750 billion ‘Next Generation’ recovery plan comprises €390 billion of grants whose main beneficiaries will be Italy and Spain – and these grants will be funded by common EU issuance. In breaking the long-standing taboos of fiscal transfers and common issuance, Next Generation constitutes a giant step towards European integration. Specifically, Italy’s net grant entitlement is likely to outweigh its contributions to the EU’s 2021-27 budget cycle. Thereby, Italy will flip from a net contributor to a net recipient of EU funds. The willingness to flip the sign of Italy’s contribution marks a sea-change in the EU’s attitude on fiscal solidarity, whose long-term significance should not be underestimated. 2020 might turn out to be the most important year for European integration. The irony is that it took a global pandemic to achieve it. Investment Conclusions The huge and growing slack in labour markets means that zero and negative interest rate policy will become a permanent feature of our lives. Hence, the relatively higher yielding 30-year US T-bond remains an effective hedge against stock market dislocations, as it did in March. Equity sectors whose profits can thrive off the shifts in the way we live, work, and interact, will outperform – specifically, technology, biotechnology, healthcare, and communications. Thereby, stock markets with an overweighting to these sectors will also outperform. The devastation of low-paying jobs means that bank credit growth is set to remain structurally weak or even non-existent. As such, banks should be bought for tactical countertrend moves (as now), but not for the long term. The yield spreads on euro area ‘periphery’ bonds over Germany and France will continue to tighten, and ultimately reach zero (Chart of the Week and Chart I-9). Chart I-9The Pandemic Is Pulling Europe Together
The Pandemic Is Pulling Europe Together
The Pandemic Is Pulling Europe Together
Fractal Trading System* Within the EM universe, the strong outperformance of India versus Czech Republic is vulnerable to a countertrend sell-off. Accordingly, this week’s recommended trade is short MSCI India versus MSCI Czech Republic. The profit target and symmetrical stop-loss is set at 8 percent. Chart I-10MSCI: India Vs. Czech Republic
MSCI: India Vs. Czech Republic
MSCI: India Vs. Czech Republic
In other trades, long USD/PLN achieved its 4 percent profit target, and short AUD/CHF reached the end of its holding period in profit. The rolling 1-year win ratio now stands at 57 percent. When the fractal dimension approaches the lower limit after an investment has been in an established trend it is a potential trigger for a liquidity-triggered trend reversal. Therefore, open a countertrend position. The profit target is a one-third reversal of the preceding 13-week move. Apply a symmetrical stop-loss. Close the position at the profit target or stop-loss. Otherwise close the position after 13 weeks. * For more details please see the European Investment Strategy Special Report “Fractals, Liquidity & A Trading Model,” dated December 11, 2014, available at eis.bcaresearch.com. Dhaval Joshi Chief European Investment Strategist dhaval@bcaresearch.com Footnotes 1 Please see The Lancet, Long-term consequences of Covid-19: research needs, September 1, 2020. Fractal Trading System Cyclical Recommendations Structural Recommendations Closed Fractal Trades Trades Closed Trades Asset Performance Currency & Bond Equity Sector Country Equity Indicators Bond Yields Chart II-1Indicators To Watch - Bond Yields
Indicators To Watch - Bond Yields
Indicators To Watch - Bond Yields
Chart II-2Indicators To Watch - Bond Yields
Indicators To Watch - Bond Yields
Indicators To Watch - Bond Yields
Chart II-3Indicators To Watch - Bond Yields
Indicators To Watch - Bond Yields
Indicators To Watch - Bond Yields
Chart II-4Indicators To Watch - Bond Yields
Indicators To Watch - Bond Yields
Indicators To Watch - Bond Yields
Interest Rate Chart II-5Indicators To Watch - Interest Rate Expectations
Indicators To Watch - Interest Rate Expectations
Indicators To Watch - Interest Rate Expectations
Chart II-6Indicators To Watch - Interest Rate Expectations
Indicators To Watch - Interest Rate Expectations
Indicators To Watch - Interest Rate Expectations
Chart II-7Indicators To Watch - Interest Rate Expectations
Indicators To Watch - Interest Rate Expectations
Indicators To Watch - Interest Rate Expectations
Chart II-8Indicators To Watch - Interest Rate Expectations
Indicators To Watch - Interest Rate Expectations
Indicators To Watch - Interest Rate Expectations
Highlights Bank credit 6-month impulses are plunging, and the pandemic is resurging. Maintain an overweight to growth defensives (technology and healthcare). In the short term, profits will be more resilient in a resurgent pandemic. In the long term, profits are well set to grow in an increasingly online, decentralised, remote-working, health-conscious world. The European stock market’s massive underweighting to growth defensives will weigh on its relative performance. Go underweight China economy plays. Fractal trade: Fractal analysis confirms that basic resources are vulnerable to a reversal. Within value cyclicals, tactically overweight financials versus basic resources. Feature Chart of the WeekThe Greatest Ever Monetary Stimulus Is Over... For Now
The Greatest Ever Monetary Stimulus Is Over... For Now
The Greatest Ever Monetary Stimulus Is Over... For Now
Monetary stimulus, as measured by the increase in banks’ six-month credit flows, reached an all-time high during the summer months. But now, the greatest ever monetary stimulus is fading (Chart of the Week). In the US and China, the increase in banks’ six-month credit flows peaked at $700 billion and $800 billion respectively during May. In the euro area, the increase peaked at over $1 trillion during July. The combination constituted the greatest ever global monetary stimulus, trumping even the stimulus that followed the 2008 financial crisis (Charts I-2 - I-4). Chart I-2US Monetary Stimulus Is Fading
US Monetary Stimulus Is Fading
US Monetary Stimulus Is Fading
Chart I-3China Monetary Stimulus Is Fading
China Monetary Stimulus Is Fading
China Monetary Stimulus Is Fading
Chart I-4Euro Area Monetary Stimulus To Fade
Euro Area Monetary Stimulus To Fade
Euro Area Monetary Stimulus To Fade
However, the increase in six-month credit flows has recently slumped to around $200 billion in both the US and China. The euro area has yet to update its data beyond July, but we expect it to fade too. The upshot is that the greatest ever monetary stimulus is over… for now. Bond Yields Are No Longer Stimulating Our preferred metric for assessing the transmission of monetary stimulus on an economy is the increase in the banks’ six-month credit flows. In turn, this depends on the six-month deceleration in the bond yield – meaning, the bond yield decline in the most recent six months must be greater than the decline in the previous six months. At first glance, this seems counterintuitive. Why focus on the bond yield’s deceleration rather than its plain vanilla decline? Box 1 explains how it follows from a fundamental accounting identity of GDP statistics. Box 1 Why The Bond Yield’s Deceleration Matters GDP is a flow statistic. It measures the flow of goods and services produced in a period. Hence, the GDP flow receives a contribution from the bank credit flow in that period. In turn, the bank credit flow is established by the decline in the bond yield (Chart I-5). Chart I-5The Decline In The Bond Yield Establishes The Bank Credit Flow
The Decline In The Bond Yield Establishes The Bank Credit Flow
The Decline In The Bond Yield Establishes The Bank Credit Flow
It follows that GDP growth receives a contribution from bank credit flow growth. Which, in turn, receives a contribution from the bond yield deceleration. In other words, the bond yield decline in the most recent period must be greater than the decline in the previous period. Finally, our preferred period is six months because it empirically equals the time to fully spend a bank credit flow. A quarter is too short: a year is much too long. Admittedly, during this year’s pandemic recession and rebound, the link between monetary stimulus and the real economy has weakened. Fiscal stimulus has played a more important role. Even when it comes to bank credit, much of the recent increase was not due to new loans. It was due to firms tapping pre-arranged credit lines, which they used to reinforce cash buffers, rather than to spend. Nevertheless, some impact of monetary stimulus will reach the real economy. This means that while this year’s earlier deceleration of bond yields was good news for the economy, the more recent acceleration of bond yields is bad news (Chart I-6). Chart I-6The Recent Acceleration Of Bond Yields Is Bad News
The Recent Acceleration Of Bond Yields Is Bad News
The Recent Acceleration Of Bond Yields Is Bad News
Tactically Underweight China Plays Through the summer months, 10-year bond yields flipped from sharp six-month decelerations to sharp accelerations. But the reversals were much more extreme in China and the US than in the euro area. Seen in this light, it is hardly surprising that the increase in six-month bank credit flows has already slumped in China and the US, and could soon turn negative. If so, they would be a contractionary force on the economy. One tactical investment conclusion is to underweight China economy plays. Specifically, with China’s bank credit six-month impulse in freefall, the 40 percent outperformance of basic resources versus financials is vulnerable to a sharp reversal (Chart I-7). This is also confirmed by fractal analysis (see later section). Chart I-7With China's Bank Credit 6-Month Impulse In Freefall, Basic Resources Are Vulnerable
With China's Bank Credit 6-Month Impulse In Freefall, Basic Resources Are Vulnerable
With China's Bank Credit 6-Month Impulse In Freefall, Basic Resources Are Vulnerable
Stay underweight cyclicals. But within cyclicals, tactically overweight financials versus basic resources. A Resurgent Pandemic Will Force People Back Into Their Shells A resurgence of the pandemic will create a further headwind to the economy, irrespective of whether governments impose fresh lockdowns or not. This is because most of us have an instinct for self-preservation as well as protecting our loved ones. In response to a resurgent pandemic, we will go back into our shells. Shunning public transport, shopping, and other crowded places, some might even think twice about letting their children go to school. But if this cautious behaviour is voluntary, then why do governments need to impose lockdowns? The answer is that while the majority behaves responsibly, a minority behaves irresponsibly. In the pandemic, this is critical because less than 10 percent of infected people are responsible for creating 90 percent of all Covid-19 infections. If this tiny minority of so-called ‘super-spreaders’ is left unchecked, then the pandemic will let rip. At first glance, it appears that the lockdown is causing the recession. In fact, this is a classic confusion between correlation and causation. The true cause of the recession is the pandemic, which forces people into their shells. But to the extent that severity of the lockdown correlates with the severity of the pandemic, many people confuse the correlated lockdown with the underlying cause, the pandemic. The ultimate proof comes from Scandinavia. Sweden imposed no lockdown, while its neighbour Denmark imposed the most extreme lockdown in Europe. If it was the lockdown that caused the recession, then the economy of no-lockdown Sweden should have fared much better than that of lockdown Denmark. In fact, the two Scandinavian economies suffered identical 9 percent recessions (Chart I-8). Chart I-8No-Lockdown Sweden Suffered An Identical Recession To Lockdown-Denmark
No-Lockdown Sweden Suffered An Identical Recession To Lockdown-Denmark
No-Lockdown Sweden Suffered An Identical Recession To Lockdown-Denmark
Focus On Sectors That Can Thrive In The New World Tactically we have recommended an underweight to stocks versus bonds since July 9, and this tactical position is broadly flat. Stick with it for now.1 A crucial question is: can bond yields go significantly lower? It is a crucial question because it was the collapse in bond yields earlier this year that saved the aggregate stock market. As long-duration bond yields plunged by 1 percent, the forward earnings yield of long-duration technology and healthcare stocks also plunged by 1 percent (Chart I-9). This surge in the valuation of the growth defensive sectors compensated for the collapsed profits of the value cyclical sectors – banks, basic resources, and oil and gas (Chart I-10). A resurgent pandemic combined with the end of the greatest ever monetary stimulus means that this playbook may get a rerun in the coming months. Chart I-9The Collapsed Bond Yield Explains The Collapsed Earnings Yield (Surging Valuation) Of Tech And Healthcare
The Collapsed Bond Yield Explains The Collapsed Earnings Yield (Surging Valuation) Of Tech And Healthcare
The Collapsed Bond Yield Explains The Collapsed Earnings Yield (Surging Valuation) Of Tech And Healthcare
Chart I-10Tech And Healthcare Saved The Aggregate Stock Market
Tech And Healthcare Saved The Aggregate Stock Market
Tech And Healthcare Saved The Aggregate Stock Market
The worry is that, from current levels, long-duration bond yields will struggle to plunge by another 1 percent and provide the same boost to valuations that they did in the first wave of the pandemic. In which case, the outlook for stocks and sectors will hinge more on their profits. On this basis, we still favour the growth defensives – which we define as technology and healthcare – both for the short term and the long term. In the short term, their profits will be more resilient in a resurgent pandemic. In the long term, their profits are well set to grow in an increasingly online, decentralised, remote-working, health-conscious world. One unfortunate consequence is that the European stock market’s massive underweighting to the growth defensives sectors will weigh on its relative performance, both in the short term and in the long term. Fractal Trading System* Supporting the fundamental analysis in the main body of this report, fractal analysis confirms that basic resources are vulnerable to a reversal versus financials. Hence, this week’s recommended trade is to go long financials versus basic resources. One way of implementing this is: long XLF, short XLB. Set the profit target and symmetrical stop-loss at 3.5 percent. In other trades, long ZAR/CLP reached the end of its holding period flat, and is now closed. The rolling 1-year win ratio now stands at 58 percent.
World: Basic Resources Vs. Financials
World: Basic Resources Vs. Financials
When the fractal dimension approaches the lower limit after an investment has been in an established trend it is a potential trigger for a liquidity-triggered trend reversal. Therefore, open a countertrend position. The profit target is a one-third reversal of the preceding 13-week move. Apply a symmetrical stop-loss. Close the position at the profit target or stop-loss. Otherwise close the position after 13 weeks. * For more details please see the European Investment Strategy Special Report “Fractals, Liquidity & A Trading Model,” dated December 11, 2014, available at eis.bcaresearch.com. Dhaval Joshi Chief European Investment Strategist dhaval@bcaresearch.com Footnotes 1 Expressed as short DAX versus 10-year T-bond. Fractal Trading System Cyclical Recommendations Structural Recommendations Closed Fractal Trades Trades Closed Trades Asset Performance Currency & Bond Equity Sector Country Equity Indicators Bond Yields Chart II-1Indicators To Watch - Bond Yields
Indicators To Watch - Bond Yields
Indicators To Watch - Bond Yields
Chart II-2Indicators To Watch - Bond Yields
Indicators To Watch - Bond Yields
Indicators To Watch - Bond Yields
Chart II-3Indicators To Watch - Bond Yields
Indicators To Watch - Bond Yields
Indicators To Watch - Bond Yields
Chart II-4Indicators To Watch - Bond Yields
Indicators To Watch - Bond Yields
Indicators To Watch - Bond Yields
Interest Rate Chart II-5Indicators To Watch - Interest Rate Expectations
Indicators To Watch - Interest Rate Expectations
Indicators To Watch - Interest Rate Expectations
Chart II-6Indicators To Watch - Interest Rate Expectations
Indicators To Watch - Interest Rate Expectations
Indicators To Watch - Interest Rate Expectations
Chart II-7Indicators To Watch - Interest Rate Expectations
Indicators To Watch - Interest Rate Expectations
Indicators To Watch - Interest Rate Expectations
Chart II-8Indicators To Watch - Interest Rate Expectations
Indicators To Watch - Interest Rate Expectations
Indicators To Watch - Interest Rate Expectations
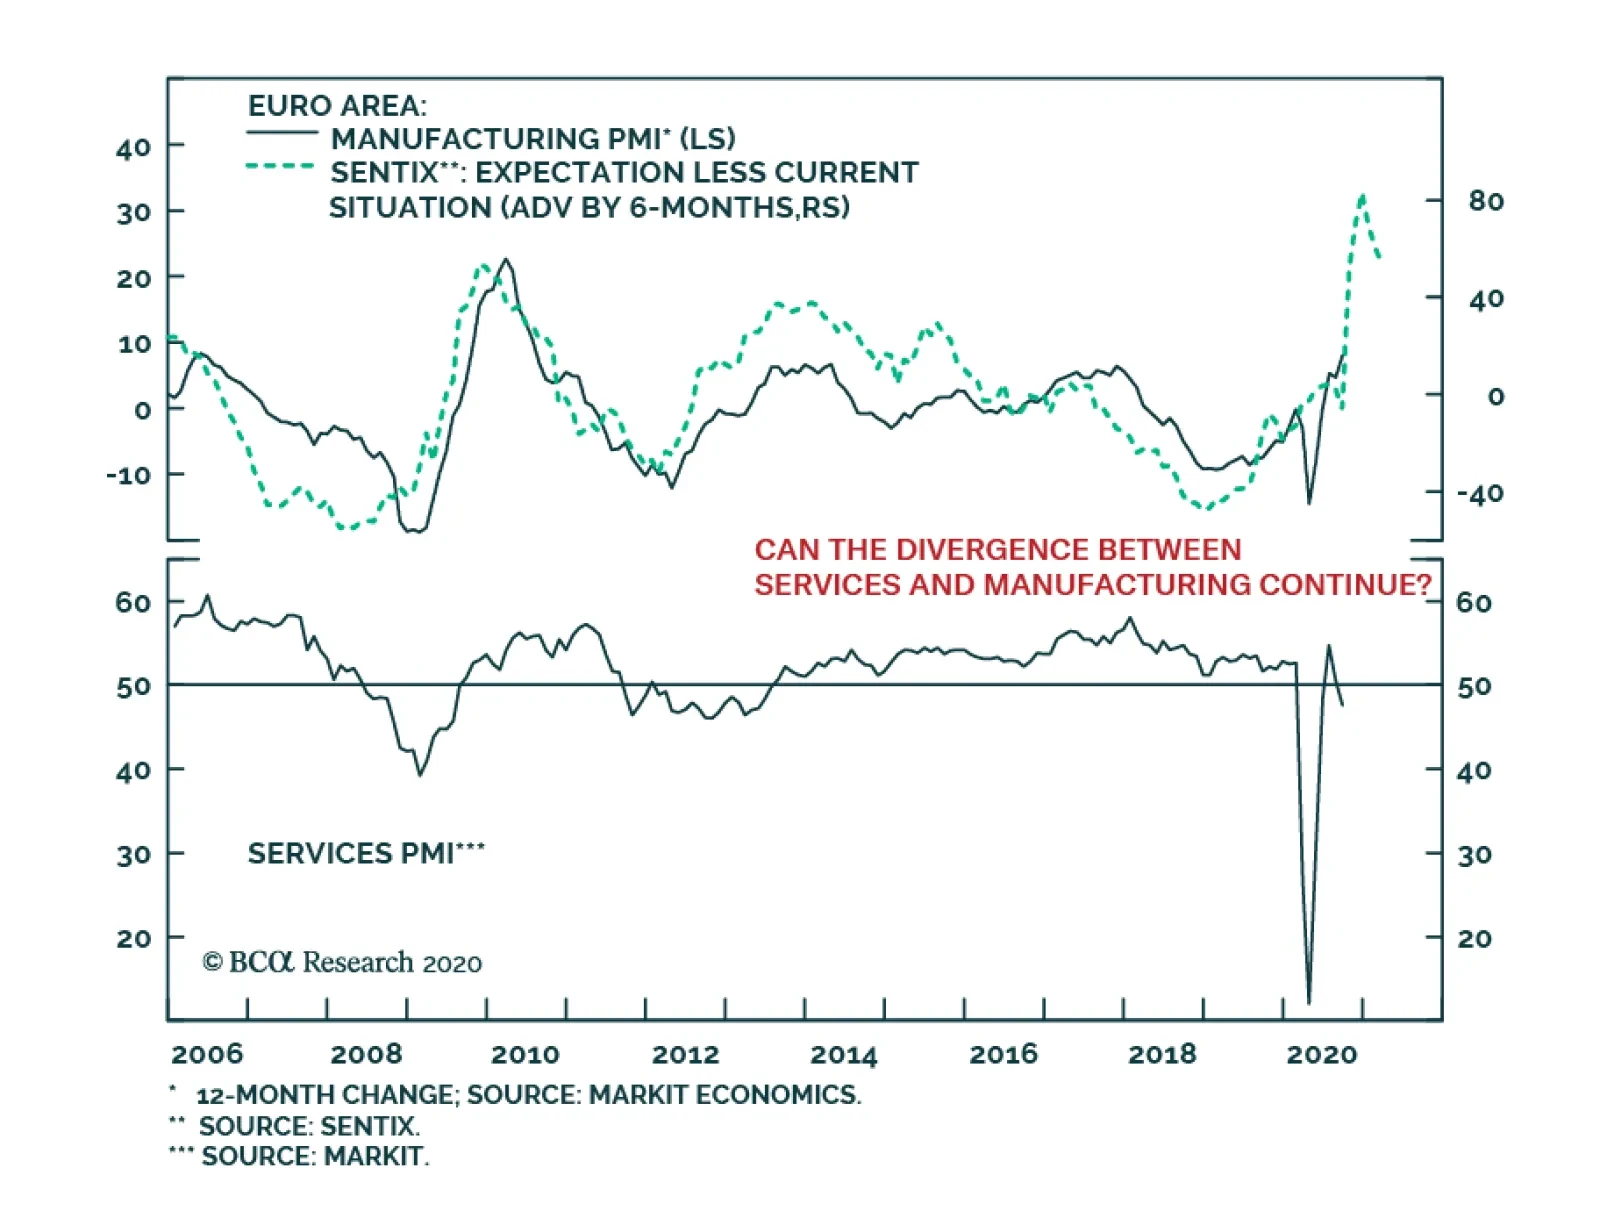
Yesterday, the release of the September Flash PMIs in the euro area bore the imprint of the COVID-19 second wave. The Composite measure declined from 51.9 to 50.1, dragged down by a sharp fall in Services from 50.5 to 47.6. Interestingly, the Manufacturing…
Highlights The great political surprises of 2016 are approaching key deadlines on November 3 and December 31. Investors should not let Brexit take their eye off the US election. Globalization will retreat faster under Trump regardless of what happens in the United Kingdom. The market is starting to price several clear risks: a failure to extend fiscal relief in the US (25% chance); a surprise Trump tariff move (40%); a contested election (20%); or a failure of the UK and EU to seal a deal (35%). Trump is unlikely to pull off a landslide like Boris Johnson in December 2019. The backdrop has darkened and Biden is an acceptable alternative for voters, unlike Jeremy Corbyn. Go long GBP-USD at the 1.25 mark; go long GBP-EUR volatility. Feature The end game is approaching for the two great political shocks of 2016 – Brexit and Trump. November 3 is the US election and December 31 is the deadline for an UK-EU trade deal. Investor sentiment is starting to show some cracks for various reasons, some technical (Chart 1). But we do not believe near-term volatility and risk-off sentiment have fully run their course yet. Either the US election cycle or the UK’s brinkmanship with the EU, or both, will agitate markets as the deadlines approach. The former is a much weightier factor. Chart 1Market Starts To Price Bevy Of Near-Term Risks ... But Cyclical View Still Constructive
Market Starts To Price Bevy Of Near-Term Risks ... But Cyclical View Still Constructive
Market Starts To Price Bevy Of Near-Term Risks ... But Cyclical View Still Constructive
The risks in play are a failure to extend fiscal relief in the US (25% chance); a conflict between Trump and one of America’s foreign rivals such as China, whether due to Trump’s reelection or lame duck status (40%); a contested election (20%); or a failure of the UK and EU to seal a deal, setting back their economic recovery (35%). Maybe all of these risks will dissipate by mid-November, but maybe not. The market has not discounted any of them fully. So investors should buy insurance now. Vox Populi Is The Biggest Constraint For global investors Brexit is far less consequential than President Trump’s “America First” policy but the UK does punch above its economic weight in financial markets (Chart 2). Chart 2Brexit: Why Should We Care? UK Punches Above Its Economic Weight In Financial Markets
Brexit: Why Should We Care? UK Punches Above Its Economic Weight In Financial Markets
Brexit: Why Should We Care? UK Punches Above Its Economic Weight In Financial Markets
Geopolitical analysis teaches that limitations on policymakers should be the starting point of analysis. For democracies, the biggest constraint of all is the vox populi – the voice of the people, or popular will. The Brexit movement faced a vociferous “Resistance” that won over the media and financial market consensus until reality struck in the general election of December 12, in which the Conservative Party won a historic victory. Chart 3Joe Biden Is Not Jeremy Corbyn
The End-Game For Trump And Brexit
The End-Game For Trump And Brexit
The election vindicated Prime Minister Boris Johnson’s brinkmanship and “hard Brexit” terms, while once again chastening the elites and experts – including an innovative Supreme Court. Johnson’s single-party majority, combined with COVID-19 and the surge in domestic economic stimulus, have increased the odds that the UK will choose sovereignty over the economy and walk away from trade talks. Trump’s supporters show the same enthusiasm as Brexiteers and the same scorn for conventional wisdom and opinion polls. Will they be similarly vindicated? Beyond any knee-jerk equity rally, that would entail a “Phase Two” trade war with China – and possibly a new trade war with Europe or a global trade war. However, Trump faces much worse odds than Boris Johnson did. First, Johnson’s snap election took place at the top of the business cycle, back when a novel coronavirus was just starting to be discovered in Wuhan, China. This is how Harry Truman won his surprise victory in 1948, in defiance of all the opinion polls. Had Truman run in 1949, after a deep recession, the story would have gone differently – which is a problem for both Trump and the near-term equity market. Second, the political alternative was not acceptable in the United Kingdom but it is in the United States. Johnson led Jeremy Corbyn, a far-left rival for the premiership, by around 15%-20% in the polls. The Conservative Party itself led the Labour Party by 10%. By contrast, former Vice President Joe Biden is a center-left Democrat who has many flaws but is not out of the mainstream. He leads President Trump in the polling, as do Democrats over Republicans, though only by single digits. There is no contest between Biden and Corbyn (Chart 3). Trump might still win, but an American version of the UK landslide in 2019 is unlikely. Trump will lose the popular vote even if he wins the Electoral College, and Republicans have a very slim chance of winning the House of Representatives. The implication for financial markets is doubly negative, at least in the near term: there is about a 35% chance that the UK will leave without a deal and about a 35% chance that Trump will win. He could also kick China in the interim period if he loses. Won’t stocks cheer a Trump comeback and victory? Perhaps, but a data-dependent approach suggests that a “blue sweep” is still the base case, and that would be a good trigger for a full equity correction. Nor would a Trump win be positive for long-term equity returns in the final analysis. Trump is reflationary, but a larger trade war would hamper the global economic recovery and thus keep earnings suppressed. There is a 35% chance that Trump will win re-election. Trump is unlikely to win the national vox populi, like Brexit did, but he obviously can win the popular vote in the critical regions – the Sun Belt and the Rust Belt. If he does, the revolution in the global system will be confirmed: the retreat of globalization will accelerate. If he does not, then Brexit alone cannot confirm de-globalization; rather the UK will face even more pressure to make concessions and get a trade deal. Trump’s Path To Victory Chart 4Sitting Presidents Win Half The Time If Recession Ends In H1
Sitting Presidents Win Half The Time If Recession Ends In H1
Sitting Presidents Win Half The Time If Recession Ends In H1
We may well be forced to upgrade Trump’s odds of winning if his comeback gains momentum. Our subjective odds of a Trump win come from the historical record – incumbent parties only retain the White House amid recessions five out of 13 times in American history – but there are some important exceptions. First, the longest-serving American president, Franklin Delano Roosevelt, served during the Great Depression. So obviously a bad economy does not always disqualify a president. Nevertheless FDR got lucky with the timing of the fluctuations and he was personally popular, unlike President Trump. Second, an incumbent president wins 50% of the time if the recession ends before the election – namely in 1900, 1904, and 1924 (contrasted with defeats in 1888, 1912, and 1980). Today’s market performance looks similar to these cases, though premature fiscal tightening is now jeopardizing Trump’s bid (Chart 4). Assuming new stimulus passes, it is extremely beneficial for President Trump that COVID-19 cases are subsiding (Chart 5). Chart 5COVID-19 Subsides In Nick Of Time For Trump?
The End-Game For Trump And Brexit
The End-Game For Trump And Brexit
Chart 6Even Approval Of Trump’s Pandemic Response Improving
The End-Game For Trump And Brexit
The End-Game For Trump And Brexit
His approval rating on handling COVID-19 is somewhat recovering at the moment (Chart 6). Trump’s “law and order” message is also benefiting him amid the rise in vandalism, rioting, and homicide, judging by his improvement in national approval rating across almost all demographic groups, including many that are otherwise averse to Trump. Finally, Trump’s Abraham Accords – a potentially major peace deal between Israel and an expanding list of Arab states – could give his image another boost (Table 1). Foreign policy will not decide the election but these peace deals should not be underrated because they underscore a more important argument for voters: that the US should withdraw from its endless foreign wars and pursue peace and prosperity instead. If Trump’s typically weak approval rating on foreign policy starts to rise then his comeback gains breadth. Table 1The Abraham Accords Give Boost To Trump Image As Peacemaker
The End-Game For Trump And Brexit
The End-Game For Trump And Brexit
We will upgrade our 35% odds of Trump’s re-election if Congress passes a new fiscal relief package, assuming Trump’s polling continues to improve. Our quantitative model is now giving Trump a 45% chance, which is in line with the consensus view but well above our subjective odds (Chart 7). We will upgrade our view if Congress passes a new fiscal relief package, assuming Trump’s polling continues to improve. Chart 7Quantitative US Election Model Puts Trump Win At 45% Odds
The End-Game For Trump And Brexit
The End-Game For Trump And Brexit
Chart 8Stimulus Hiccups Cause Market To Sell
Stimulus Hiccups Cause Market To Sell
Stimulus Hiccups Cause Market To Sell
The stock market does not perform well during periods in which fiscal cliff negotiations are prolonged – the failure of the Emergency Economic Stabilization Act in 2008 is one thing, but today’s impasse is more reminiscent of the debt ceiling crises of 2011 and 2013. Trump is now directly pressuring Senate Republicans to capitulate to House Democratic spending demands. If Republican senators abandon him, market turmoil will undercut his argument that he is the best man to revive the economy and he will lose the election (Chart 8). We do not think they will – and House Speaker Nancy Pelosi’s pledge to keep the House in session until a deal is passed is very positive news – but until the deal is sealed the market is vulnerable. As mentioned above we give a 25% chance of a failure to pass any stimulus bill in September or October. The next chance for stimulus will be in late January or February. Trump stands for growth at all costs, which will be received well by equity markets, other things being equal. But a Trump victory implies more trade war and that the GOP will retain the Senate, creating a steeper fiscal cliff next year – so any relief rally will be short-lived. Meanwhile a Trump defeat raises the risk he will take aggressive actions on the way out to cement his legacy as the Man Who Confronted China, and bind the Biden administration to decoupling policy. This is not a favorable outlook for investor sentiment or the economic recovery over the next few months. Brexit: The Three Kingdoms Will Force A Trade Deal Chart 9Sterling Will Fall Before It Bounces Back On A Deal
Sterling Will Fall Before It Bounces Back On A Deal
Sterling Will Fall Before It Bounces Back On A Deal
In December 2016 we pointed to the three kingdoms – England, Ireland, and Scotland – as the origin of the geopolitical and constitutional crisis that would arise from the Brexit referendum and act as a powerful bar against a no-deal Brexit. That framework remains salient today as the risk of no-deal escalates due to quarrels over Northern Ireland Protocol, which was agreed in October 2019 as part of the formal Withdrawal Agreement that made Brexit happen on January 31, 2020. The implication is that the pound has not bottomed yet, though we see a buying opportunity around the corner (Chart 9). No one should doubt that the UK could walk away from the EU without a deal this December: The Tories’ single-party majority gives them the raw capability to push through plans they decide on – and raises the risk that they will overreach. The tariff shock of a no-deal exit is frequently exaggerated. The UK would suffer a tariff shock of about 1.38% of GDP, larger than what the US suffered in its tariff-war with China but hardly a death knell (Table 2). (The costs of losing single-market access would grow over time, however.) Table 2A No-Trade-Deal Brexit Would Create A Minimum Tariff Shock Of 1.4% Of GDP
The End-Game For Trump And Brexit
The End-Game For Trump And Brexit
COVID-19 has supplanted the worst-case outcome of a no-deal exit by producing a much worse recession than anyone feared. The US is using the disruption to decouple from China and the UK could do the same with the EU. The result of COVID-19 is massive domestic stimulus that raises the UK’s and Europe’s threshold for pain. Any failure of trade talks would spur more stimulus. The Bank of England still has some bond-buying ammunition left and parliament, again, is undivided. Given that Boris Johnson has until 2024 before the next election, there is theoretically time for his personal and party approval ratings to improve as the economy recovers from the pandemic and any messy Brexit (Chart 10). Chart 10Bojo Has Until 2024 To Recover From Crises
The End-Game For Trump And Brexit
The End-Game For Trump And Brexit
Chart 11UK Would Face WTO-Level Tariffs If No Deal
The End-Game For Trump And Brexit
The End-Game For Trump And Brexit
The UK’s position in the quarrel over Ireland is rational – but so is the EU’s. If the trade talks collapse, the UK will need to remove any regulatory or customs divisions with Northern Ireland. Yet in preparing to do so it vitiates trust with the EU and makes a trade deal less likely. However, weighing all these points up, an UK-EU trade deal is still the most likely outcome (65% chance), as the economic and political costs are crystal clear while the benefits of a hard break are not so clear. Allow us to explain. Northern Ireland is the latest cause of tensions, although it was inevitable that tensions would arise ahead of the end-of-year deadline for a trade deal. Westminster has proposed an Internal Market Bill, which has passed with solid majorities in two readings in parliament, to reclaim aspects of sovereignty over Northern Ireland that were traded away to clinch the Withdrawal Agreement last year. The Johnson government’s position should be seen as a negotiating tactic to build leverage in the talks but also as a real fallback position if the talks fail. The House of Lords could delay the bill by a year, meaning that it may not take effect until end of 2021 – but a trade deal would make it moot. The Northern Ireland Protocol solved the riddle of how to preserve the integrity of the EU’s single market after Brexit yet avoid a return to a hard customs border with the Republic of Ireland. Customs checks were removed with the Good Friday (or Belfast) Agreement in 1998, which ended the Troubles between the two Irelands. The Protocol introduces a pseudo-customs border on the Irish Sea, requiring declarations on exports to Great Britain and EU oversight of UK state aid for Northern Irish firms, so that Northern Ireland can stay in the EU customs area while the UK can leave and still preserve a semblance of its own customs area in Northern Ireland. If the UK and EU get a trade deal, then all trade is tariff-free and the Protocol becomes redundant. Also, the Protocol enables a Joint Committee to review disputes over exports to Northern Ireland that are “at risk” of making their way into the EU without duties. The Protocol is supposed to operate even if the UK and EU fail to get a trade deal. Yet it is politically untenable for the UK to subject trade within its own country to EU rules or duties, or allow the EU to supervise state corporate subsidies across the UK, if no deal is agreed. The UK is more likely to violate the treaty to preserve its internal integrity. As Northern Ireland Secretary Brandon Lewis admitted, “Yes, this [Internal Market Bill] does break international law in a very specific and limited way.” While the EU’s threat to slap tariffs on British food exports to Northern Ireland is the proximate trigger of the Internal Market Bill, another key reason for the UK’s aggressive shift is the issue of state aid. All governments are extending emergency aid to major corporations to keep them from insolvency amid the recession. This will be the case for some time and it is even more true of the EU than of the United Kingdom. However, under the Protocol, the EU would be able to penalize companies in Great Britain that receive subsidies if goods or firms in Northern Ireland can be shown to benefit. Northern Ireland is supposed to operate within the EU’s standards on state aid. London obviously bristles at this backdoor for letting in EU regulation, not least because, in the event that a trade deal is not reached, it will need to pump the country full of state aid to compensate for the shock of seeing exports to the EU rise by 3% across the board according to Most Favored Nation status under the World Trade Organization (Chart 11). An UK-EU trade deal is the most likely outcome. As Dhaval Joshi of BCA’s European Investment Strategy points out, Boris needs to keep his own Tories under his heel (Chart 12). The Internal Market Bill provoked a backlash among 30 moderates. If that number rises to 40 Johnson loses his majority. This is a problem that he is seeking to address by giving parliament a veto over any future uses of the bill that would violate international law (this is an acceptable compromise because he has a majority). But a failure to drive a hard bargain with the EU would cause a much bigger rebellion among hard Brexit Conservative MPs and threaten his job. Chart 12Bojo Must Balance Hard Brexit Tories
The End-Game For Trump And Brexit
The End-Game For Trump And Brexit
Geopolitics is about might, not right – the UK can assert its sovereignty and violate these international agreements, while the EU can then apply punitive tariffs, non-tariff barriers, and sanctions under the Withdrawal Agreement. Brexit is a power-political struggle that could devolve into a trade war. Obviously that would be a very bad outcome for the market, particularly for the UK, which is overmatched (Chart 13). But this risk is also a key limitation on the UK that will prevent this worst-case outcome. Indeed, despite all of the above, our base case is still that the UK and EU will get a deal. First, the economy will clearly suffer without a deal. After all, the US-China tariffs produced a negative effect for these two economies in 2019 and the impact on the UK would be bigger than that on the US (Chart 14). Chart 13The Brick Wall The UK Cannot Avoid
The Brick Wall The UK Cannot Avoid
The Brick Wall The UK Cannot Avoid
Chart 14UK Faces Trade Shock If No Deal
UK Faces Trade Shock If No Deal
UK Faces Trade Shock If No Deal
Second, the public doesn’t support a no-deal exit (Chart 15). Northern Ireland itself voted against Brexit in the referendum and as such would rather see an agreement that groups the UK and the EU under a single zero-tariff free trade agreement. Third, Boris faces a rebellion in Scotland if he pursues a hard break. The Scottish National Party would revive ahead of Scottish elections in May 2021 and demand a second independence referendum (Chart 16). The Irish Sea is a natural division that makes a more intrusive customs presence more supportable than otherwise. A little more paperwork is an acceptable cost to keep the United Kingdom from falling apart. Scotland is much more likely to go independent than Ireland is to unite. Chart 15Only 25% Think 'No Deal' A Good Outcome
The End-Game For Trump And Brexit
The End-Game For Trump And Brexit
Boris is now prime minister, not just party leader, and he will ultimately have to decide whether he wants to be the last prime minister of a United Kingdom. Assuming Boris is at least focused on the next election, he will have to decide if he wants the rest of his premiership to be consumed with a self-inflicted double-dip recession and democratic revolt in Scotland, or a recovery on the back of a functional if uninspiring trade deal enabling him to head off the Scottish threat and save the union. Chart 16No Deal' Would Boost Scottish Independence Movement
No Deal' Would Boost Scottish Independence Movement
No Deal' Would Boost Scottish Independence Movement
Obviously the final deal may not be clinched until the eleventh hour. The October 15 deadline can be delayed but talks must conclude in November or December in time to be ratified by the EU member states by December 31. US Election Drives Geopolitics, But Not The Brexit Outcome One factor that will not play much of a role in the UK’s decision-making is the US election. It is true that the Johnson government would benefit from President Trump’s reelection. But the EU is a much bigger market for the UK and the UK’s best strategy is to focus on its national interest regardless of what the US does. The US election may not be decided in mid-December in time for the UK to agree to a deal that can be ratified by year’s end anyway. Moreover the UK’s best strategy is to conclude a deal with the EU first, and then pursue a deal with the United States. This is because President Trump will be inclined to sign at least an executive deal, while a congressional deal requires support from the Democrats, which is only possible if Northern Ireland is resolved without hard border checks. Because the EU makes up such a larger share of British trade, an American deal does not give the UK much leverage in negotiating with the EU, but an EU deal does give the UK greater leverage in negotiating with the US. As Diagrams 1 and 2 show, this strategic logic holds even if the UK knows the outcome of the US election ahead of time: the scenarios with the least benefit and the greatest cost would still be scenarios involving no deal with the European Union. Diagrams 1 & 2United Kingdom Wants An EU Trade Deal (Regardless Of Trump/Biden)
The End-Game For Trump And Brexit
The End-Game For Trump And Brexit
Diagram 3 boils all of this down to a single decision tree. First, the diagram shows that the economic costs are not prohibitive and therefore the risk of a no-deal exit is substantial – we would say 35%. Second, it shows that the risks of the negotiation are skewed to the downside. Third, it highlights that the UK will settle its affairs directly with the EU and not hinge its actions on the US election cycle. Diagram 3No-Deal Brexit Cost Not Prohibitive, But Best Strategy Is To Get A Deal
The End-Game For Trump And Brexit
The End-Game For Trump And Brexit
Clearly the best strategy and best outcome involve seeking a trade deal with the EU, and hence it is our base case. This means an opportunity to buy the pound and domestic-oriented British equities, and turn neutral on gilts, is just around the corner. Investment Takeaways The GBP-EUR is the best measure of the market’s sensitivity to Brexit risks, so it should fall in the near term and rally sharply after resolution. However, the US election complicates things. The euro’s response is fairly binary: it is one of the biggest winners if Biden wins and one of the biggest losers if Trump wins. Hence GBP-EUR volatility will rise in the coming months (Chart 17). We recommend going long 1-month implied volatility contracts for October and November. The pound sterling, by contrast, will ultimately rise regardless of US election result, since the UK will pursue a trade deal out of its own national interest. Trump is less negative for the US dollar than Biden and a comeback and victory will drive a counter-trend dollar bounce. However, in the medium term we expect the dollar to fall regardless due to debt monetization and global growth recovery. Thus we recommend going long GBP-USD on a strategic basis when political risks peak over the next two-to-three months and GBP-USD falls to around 1.25, as recommended by our Foreign Exchange Strategist Chester Ntonifor (Chart 18). Chart 17EUR-GBP Volatility Will Rise
EUR-GBP Volatility Will Rise
EUR-GBP Volatility Will Rise
Sterling bears are forgetting that the sound defeat of Corbyn ruled out a sharp left-wing turn in domestic economic policy (higher taxes), while the Tories have made a clear turn against fiscal austerity. Therefore the worst-case scenario is a failure to agree to a trade deal by the end of this year. But that is not the base case and the risk will be priced within a month or two. Chart 18Pound Will Rally After Deal Concluded In November Or December
Pound Will Rally After Deal Concluded In November Or December
Pound Will Rally After Deal Concluded In November Or December
Chart 19Yes, China Is Opening The Taps
Yes, China Is Opening The Taps
Yes, China Is Opening The Taps
We remain tactically cautious and defensive even though the US fiscal negotiations are improving. The market is underrating too many clear and concrete risks to sentiment and the corporate earnings outlook, so the current bout of volatility can continue until there is greater clarity on US fiscal spending, the US election cycle, associated geopolitical risks, and the Brexit showdown. Book gains on long Brent trade for a return of 69.7%. We initiated this trade on March 27 in our “No Depression” report, which marked our shift to a strategic risk-on positioning. We remain bullish on oil prices and commodities on the back of global stimulus and our assessment that the OPEC 3.0 cartel will maintain discipline overall, but the next three-to-six months are crowded with downside risk. Cyclically, we see a global economic recovery deepening and broadening. China’s stimulus is surprising to the upside, as we have long written and the latest credit numbers bear this view out (Chart 19), which is critical for global reflation. Matt Gertken Vice President Geopolitical Strategy mattg@bcaresearch.com
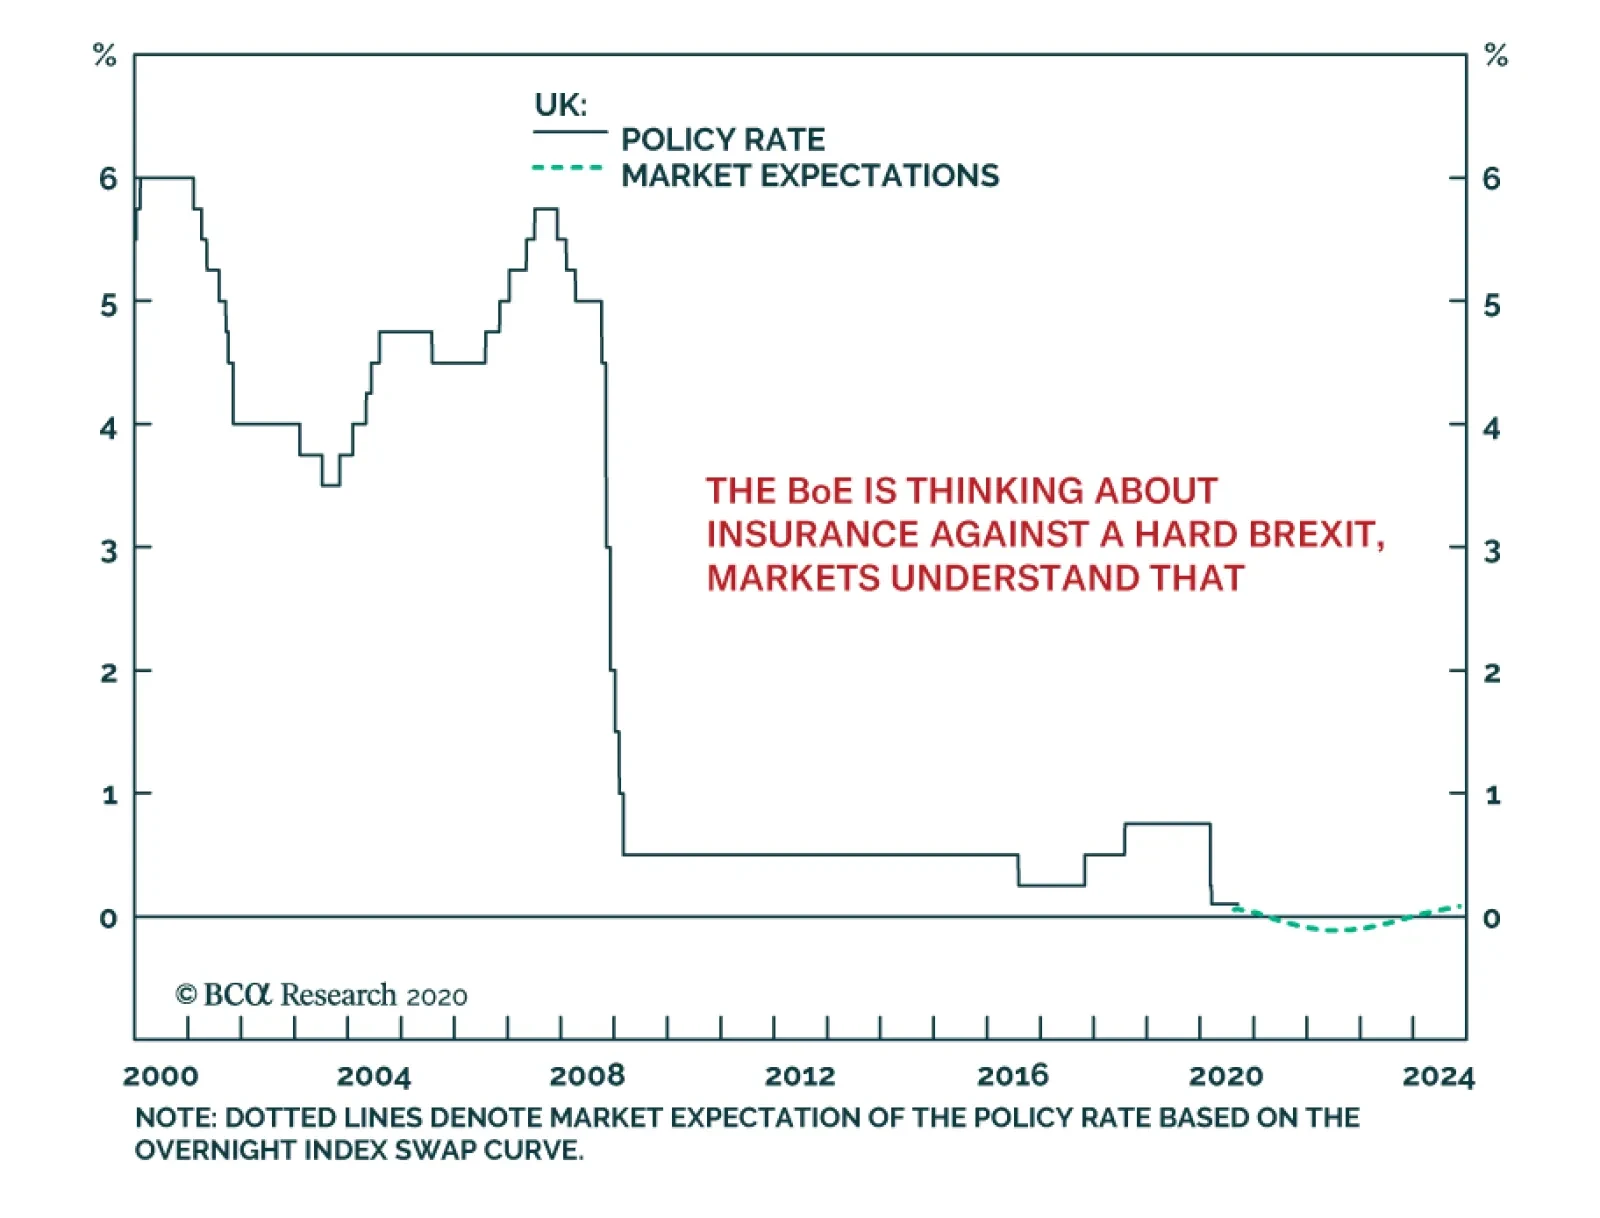
The Bank of England met yesterday and left policy unchanged. However, the meeting’s minutes revealed that the MPC is actively exploring the implementation of a negative Bank rate. So serious is the idea, the BoE is in talks with Prudential Regulation…
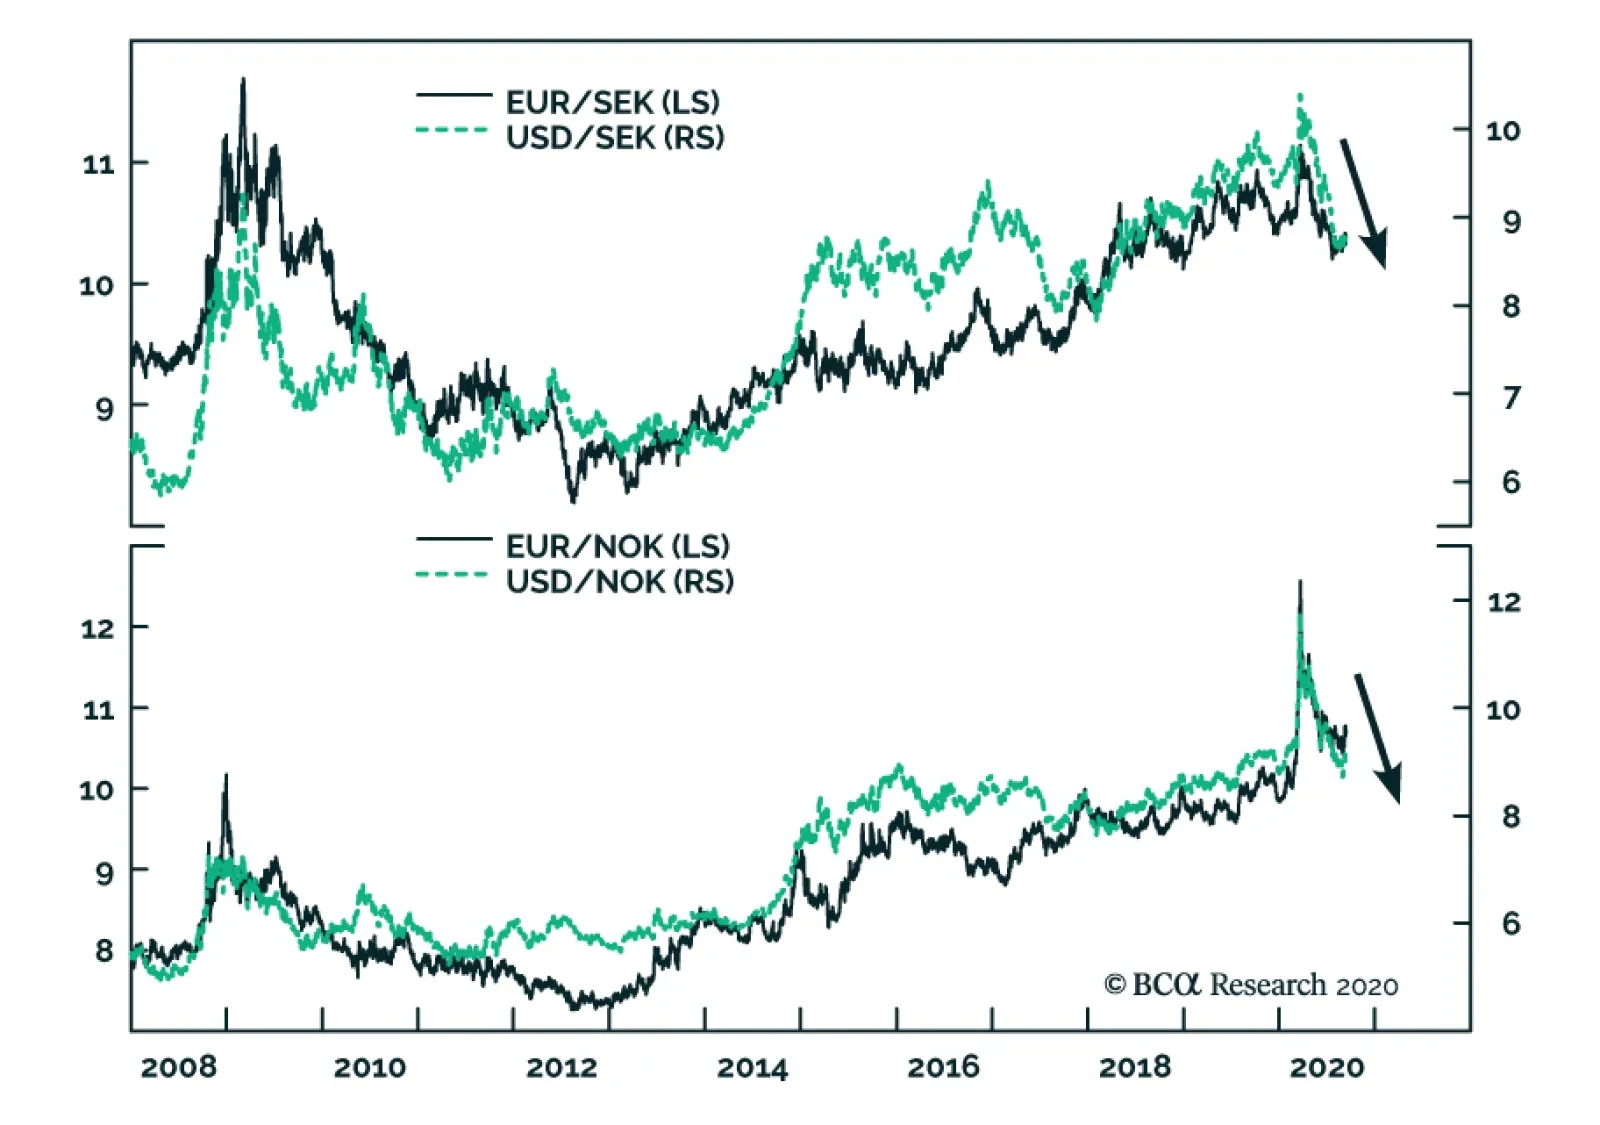
BCA Research's Foreign Exchange Strategy service estimates that Scandinavian currencies (NOK and SEK) are the best way to express its bearish dollar view over the coming 12 months. Both Norway and Sweden are well poised to benefit from a global economic…