Europe

Markets have shrugged off the rise in COVID-19 cases in the US and new clusters in other places such as Spain, Hong Kong, Melbourne, and Tokyo (Chart 1). The MSCI All-Country World Index is now only 4% off its all-time high in February. We don’t see the markets ignoring reality for much longer. Economic activity remains very subdued (Chart 2), which will eventually cause a significant rise in bankruptcies and problems for banks. Nevertheless, the unprecedented monetary and fiscal stimulus will be increased further in coming weeks, which should prevent a big shift towards pessimism for a while. The crunch time will come in the northern-hemisphere winter, when COVID cases in North America and Europe are likely to rise sharply again. Risk assets at their current levels are not pricing in those risks. Recommended Allocation
Monthly Portfolio Update: Winter Is Coming – But Maybe Not Yet
Monthly Portfolio Update: Winter Is Coming – But Maybe Not Yet
Chart 1COVID Cases Are Still On The Rise
COVID Cases Are Still On The Rise
COVID Cases Are Still On The Rise
Chart 2Activity Remains Subdued
Monthly Portfolio Update: Winter Is Coming – But Maybe Not Yet
Monthly Portfolio Update: Winter Is Coming – But Maybe Not Yet
Markets are driven by the second derivative of growth. It is not surprising, then, that equities began to rally in March, exactly when economic data stopped deteriorating, even though it remained atrocious (Chart 3). Real interest rates have also continued to fall, even as risk assets rallied; this further fueled the rally, since the theoretical value of equities rises as the rate at which they are discounted falls (Chart 4). Chart 3Data Stopped Deteriorating In March
Data Stopped Deteriorating In March
Data Stopped Deteriorating In March
Chart 4Real Interest Rates Have Continued To Fall
Real Interest Rates Have Continued To Fall
Real Interest Rates Have Continued To Fall
But the question now is: Can the data continue to improve? PMIs will fall back towards 50, and economic releases are unlikely to surprise so strongly on the upside. In the US, as a result of the rise in COVID-19 cases and renewed (albeit mostly moderate) government restrictions on activity, consumer confidence has started to weaken again and initial unemployment claims to pick up (Charts 5 and 6). Even though the Fed will remain ultra-dovish, real rates will not fall much further from their current level, which is the lowest since TIPS started trading in the late 1990s. Chart 5Consumer Confidence Is Weakening Again
Consumer Confidence Is Weakening Again
Consumer Confidence Is Weakening Again
Chart 6The Jobs Market Has Stopped Improving
The Jobs Market Has Stopped Improving
The Jobs Market Has Stopped Improving
Chart 7Will Money Supply Growth Peak?
Will Money Supply Growth Peak?
Will Money Supply Growth Peak?
Money supply growth has grown rapidly, as a result of the increase in central-bank balance-sheets and the rush of companies to borrow to shore up their cash positions (Chart 7). The increase in excess liquidity has also been a force behind the rise in risk assets. But money supply growth is likely to slow from now. At least partly offsetting these risks will be further fiscal stimulus. BCA Research’s Geopolitical strategists see Congress approving a big new package of around $2.5 trillion, mainly because of widespread popular support for an extension of more generous unemployment benefits (Table 1). Agreement should come before the scheduled recess on August 10 (if it doesn’t, this would trigger a market selloff). The recent agreement between European Union leaders on a EUR750 billion fiscal package was a major breakthrough, since it represented joint borrowing backed by the rich northern European countries to provide transfers to the poorer periphery. Table 1There Is Much Public Support For Fiscal Stimulus
Monthly Portfolio Update: Winter Is Coming – But Maybe Not Yet
Monthly Portfolio Update: Winter Is Coming – But Maybe Not Yet
Further upside may come as the many investors who have missed the rally since March capitulate and buy risk assets. Investor sentiment is currently unusually polarized. Speculative individuals and hedge funds are very bullish (Chart 8). But more conservative pension funds, wealth managers, and individual investors, mostly remain cautious, as evidenced by the AAII weekly survey, in which many more investors say they expect the stock market to fall over the next six months than to rise (Chart 9). Cash levels remain high by historical standards (Chart 10). Although only a minority of investors turned positive in March, a recent academic study demonstrated how hedge funds and small active institutions have a disproportionate influence on price movements (Chart 11). A downside risk, then, would be if these investors decided to take profits or turned more bearish. Chart 8Hedge Funds Are Bullish...
Hedge Funds Are Bullish...
Hedge Funds Are Bullish...
Chart 9...But Retail Investors Very Cautious
...But Retail Investors Very Cautious
...But Retail Investors Very Cautious
Chart 10Cash Holdings Remain Elevated
Cash Holdings Remain Elevated
Cash Holdings Remain Elevated
Chart 11Some Smaller Investors Have A Big Impact
Monthly Portfolio Update: Winter Is Coming – But Maybe Not Yet
Monthly Portfolio Update: Winter Is Coming – But Maybe Not Yet
We have argued, since the pandemic began, that investors should not take high-conviction bets in such an uncertain environment. They should, rather, design portfolios which are robust under various scenarios. After the 43% rise in global equities since March, we cannot recommend an above-benchmark weighting, since downside risks are not priced in. We remain neutral on global equities. However, fixed-income instruments look even more unattractive at the current low level of rates; we remain underweight. We recommend hedging via a large overweight in cash, which leaves dry powder for when a better buying opportunity arises. Currencies: A key (as always) to the macro view is what happens to the US dollar. Many of the drivers of the dollar – interest-rate differentials, valuation, momentum, and relative money-supply growth – point to it weakening further (Chart 12). The trade-weighted dollar is already off 9% from its March peak. We turned bearish on the USD in our Quarterly published at the beginning of July. It is too early, however, to declare that the dollar bull market, which began in 2012, is definitely over. Chart 12Dollar Indicators Are Bearish...
Dollar Indicators Are Bearish...
Dollar Indicators Are Bearish...
Chart 13…But Short USD Is Now A Consensus
Monthly Portfolio Update: Winter Is Coming – But Maybe Not Yet
Monthly Portfolio Update: Winter Is Coming – But Maybe Not Yet
A new downturn in the global economy would push the dollar back up again, since it is a safe-haven currency. Shorting the dollar, especially against the euro, is now a consensus position, and so a near-term reversal is quite likely (Chart 13). But, over the next 12-18 months, a move above 1.22 for the euro and towards 100 for the yen is possible. We will continue to analyze whether the dollar could be entering a bear market, since this would necessarily make us more structurally positive on commodities and emerging markets. Equities: A pickup in global growth and a weakening US dollar might prove positive for cyclicals and value stocks in the long run, which would cause European and EM equities to outperform. Given the current uncertainty, however, we cannot recommend that stance and therefore continue to prefer “growth defensives” such as Health Care and Technology, which implies an overweight on the overall US market. Valuations in the Health Care sector remain attractive (Chart 14). Companies in the (broadly defined) Tech sector are beneficiaries of the pandemic, generally have robust balance-sheets, and should continue to see strong earnings growth for some years. And, while Technology is clearly expensive, valuations are still nowhere as excessive as in 2000 (Chart 15). For Tech to crash would require either that it go ex-growth, or that there is significant regulatory action. Chart 14Health Care Still Attractively Valued
Health Care Still Attractively Valued
Health Care Still Attractively Valued
Chart 15Tech Still Way Below Bubble Levels
Tech Still Way Below Bubble Levels
Tech Still Way Below Bubble Levels
Chart 16Europe No Longer So Dominated By Financials
Europe No Longer So Dominated By Financials
Europe No Longer So Dominated By Financials
Neither of these seems likely for now. Euro zone equities are less dominated than they were by Financials, but remain more cyclical than the US, with very few internet-related names (Chart 16). Fixed Income: Central banks will remain very dovish and, as Fed chair Jerome Powell has emphasized, are not even thinking about thinking about tightening policy. This suggests that nominal rates will rise only moderately, even if growth continues to pick up. The Fed still has plenty of room to ease further if needed, since the programs it rolled out in March have barely been taken up yet (Table 2). We thus recommend a neutral position on duration. We find TIPS attractive as a hedge against an eventual spike in inflation. The 10-year breakeven inflation rate implied in TIPS remains around 100 basis points below being compatible with the Fed achieving its 2% PCE inflation target in the long run (Chart 17). The announcement in September of the results of the Fed’s 18-month review of its policy framework, which is likely to intensify its efforts to achieve the inflation target, could push breakevens up a bit further. In credit, we continue to recommend buying whatever central banks are buying, mostly investment-grade corporate bonds and the top end of the US junk bond market. Though spreads have fallen a long way, they are still well above end-2019 levels, and look attractive in a world of such low government bond yields (Chart 18). Table 2Usage Of The 2020 Federal Reserve Emergency Lending Facilities
Monthly Portfolio Update: Winter Is Coming – But Maybe Not Yet
Monthly Portfolio Update: Winter Is Coming – But Maybe Not Yet
Chart 17TIPS Still Pricing Low Inflation For A Decade
TIPS Still Pricing Low Inflation For A Decade
TIPS Still Pricing Low Inflation For A Decade
Chart 18Credit Spreads Could Fall Further
Credit Spreads Could Fall Further
Credit Spreads Could Fall Further
Commodities: The weakening US dollar and continued expansion of Chinese stimulus (Chart 19) should be positive for industrial metals prices over the next six to nine months. Oil prices also have some further upside, since the OPEC 2.0 agreement to restrict supply is being adhered to, and demand will gradually pick up (although air travel will remain depressed, more commuters are using their cars as they avoid public transport). BCA Research’s Energy Service forecasts Brent crude to average $44 in the second half of this year, and $65 in 2021 (up from the current $43). Gold has already run up a lot and is now close to a record high price in real terms, with sentiment very optimistic (Chart 20). Chart 19China Stimulus Positive For Metals
China Stimulus Positive For Metals
China Stimulus Positive For Metals
Nonetheless, in an environment of very low real rates, it represents a good hedge against extreme tail risks, and therefore we continue to recommend a moderate position as an insurance. Chart 20Gold Looking Rather Toppish
Gold Looking Rather Toppish
Gold Looking Rather Toppish
Garry Evans, Senior Vice President Global Asset Allocation garry@bcaresearch.com Recommended Asset Allocation
Dear Client, In lieu of our regular report next week, we will be sending you a Special Report from my colleague Garry Evans, Chief Global Asset Allocation Strategist. Garry will be discussing the social and industrial changes that will remain in place even after the COVID-19 pandemic is over, and how investors should tilt their portfolios to take advantage of them. I hope you find his report insightful. Best regards, Peter Berezin, Chief Global Strategist Highlights The number of coronavirus cases in the US appears to have peaked. Negotiations to avert a fiscal cliff continue in Washington. While we expect a deal to be reached, markets could tread nervously until this happens. The US dollar will weaken further over the next 12 months. Narrowing interest rate differentials, a revival in global growth, deteriorating momentum, and pricey valuations all bode poorly for the greenback. Global equities in general, and non-US stocks in particular, tend to fare well in a weak dollar environment. Small cap and value stocks usually outperform when the dollar weakens. Bank shares should start to do better as yield curves steepen and faster economic growth reduces concerns over non-performing loans. US Virus Wave Cresting, But Fiscal Risks Intensifying Chart 1US: Number Of New Cases Seems To Be Peaking
The Stock Market Implications Of A Weaker Dollar
The Stock Market Implications Of A Weaker Dollar
Last week, we argued that the two biggest near-term threats to stocks and other risky assets were the rising number of coronavirus cases in parts of the US and the looming fiscal cliff.1 Since then, the news on the virus has been broadly positive, while developments on the fiscal front have been mixed. Chart 1 shows that the number of new cases seems to have peaked in the US. In Texas, Florida, California, and Arizona, the share of doctor visits linked to suspected Covid infections is trending lower. This metric leads diagnoses by about one-to-two weeks (Chart 2). Chart 2Doctor Visits, Which Lead Diagnoses, Are Trending Lower
The Stock Market Implications Of A Weaker Dollar
The Stock Market Implications Of A Weaker Dollar
Over half the US population lives in states that have either suspended or reversed reopening plans (Chart 3). Assuming the number of infections keeps falling and fiscal policy is not unduly tightened, household spending and employment growth – which appear to have stalled out in the second half of July – should begin to pick up. Chart 3Not So Fast
The Stock Market Implications Of A Weaker Dollar
The Stock Market Implications Of A Weaker Dollar
Unfortunately, the assumption that fiscal policy will remain stimulative looks somewhat shaky. Expanded unemployment benefits for 30 million Americans, consisting mainly of an additional $600 per week for unemployed workers, are set to expire at the end of July. Congressional Republicans have suggested trimming benefits to $200 per week. However, even that would represent a fiscal tightening of nearly 3% of GDP. A Question Of Incentives The Republican position is understandable, given that two-thirds of unemployed workers are currently receiving more in unemployment benefits than they earned while working. Thus, some scaling back of benefits is not only inevitable, but desirable. The question is one of timing. While job openings have risen from their lows, they are still 23% below where they were at the start of the year. According to the NFIB survey, the share of small businesses reporting difficulty in finding qualified workers has also fallen from year-ago levels. When the binding constraint on employment is a shortage of jobs rather than a shortage of workers, higher unemployment benefits will likely boost hiring. This is because increased benefits will increase spending on goods and services across the economy, thus augmenting the demand for labor. Debt, Gold, And The Dollar Chart 4Gold Prices Have Risen On The Back Of Falling Real Yields
Gold Prices Have Risen On The Back Of Falling Real Yields
Gold Prices Have Risen On The Back Of Falling Real Yields
Does the inevitable increase in government debt due to ongoing fiscal stimulus portend disaster down the road? According to many commentators, the recent drop in the dollar and the surge in gold prices is surely telling us that it does. While it is a compelling story, it is mainly false. The yield on the 30-year Treasury bond currently stands at 1.20%, down from 1.5% in mid-June and 2.33% at the start of the year. Bondholders may be many things, but masochistic is not one of them. If they really thought a fiscal crisis was around the corner, yields would be a lot higher. So why is the dollar falling and gold rallying? The answer is inflation expectations have risen off very low levels, which has pushed down real yields. Gold prices are almost perfectly correlated with real interest rates (Chart 4). The Real Reason The Dollar Has Fallen Going into this year, US real yields had a lot more room to decline than rates abroad. For example, at the start of 2019, US real 2-year yields were 221 bps above comparable euro area yields. Today, US real rates are 35 bps lower – a swing of 256 bps. Yield differentials have narrowed against other economies as well, which has pushed down the value of the dollar (Chart 5). In addition, relative growth dynamics have hurt the greenback. The US economy tends to be less cyclical than most of its trading partners. While the US benefits from faster global growth, the rest of the world benefits even more. This causes capital to flow from the US to other countries, leading to a weaker dollar (Chart 6). Chart 5The Greenback Has Been Losing Interest Rate Support
The Greenback Has Been Losing Interest Rate Support
The Greenback Has Been Losing Interest Rate Support
Chart 6The Dollar Usually Weakens When Global Growth Accelerates
The Dollar Usually Weakens When Global Growth Accelerates
The Dollar Usually Weakens When Global Growth Accelerates
Chart 7The Dollar And Cycles
The Stock Market Implications Of A Weaker Dollar
The Stock Market Implications Of A Weaker Dollar
BCA Research’s Foreign Exchange Strategist, Chester Ntonifor, has stressed that the dollar typically fares worst in the initial stages of business cycle recoveries (Chart 7). That is the stage we are in today. Indeed, the gap in growth between the US and the rest of the world is likely to be larger than usual over the next few quarters because the pandemic has hit the US harder than most other developed economies. Momentum is also working against the dollar. Being a contrarian is usually a smart investment strategy. That is not the case when it comes to trading the dollar. With the dollar, you want to follow the herd. This is because the dollar is a high momentum currency (Chart 8). A simple trading rule that buys the dollar when it is trading above its 50-day or 200-day moving average, and sells the dollar when it is trading below its respective moving averages, has historically made a lot of money. Likewise, the dollar performs best prospectively when sentiment is bullish and improving (Chart 9). Currently, the dollar is trading below its various moving averages. Sentiment is also poor and deteriorating (Chart 10). Chart 8USD Is A High Momentum Currency
The Stock Market Implications Of A Weaker Dollar
The Stock Market Implications Of A Weaker Dollar
Chart 9Trading The Dollar: The Trend Is Your Friend
The Stock Market Implications Of A Weaker Dollar
The Stock Market Implications Of A Weaker Dollar
Chart 10The Dollar Has Started Breaking Down
The Dollar Has Started Breaking Down
The Dollar Has Started Breaking Down
Chart 11The Dollar Is Still Fairly Expensive
The Stock Market Implications Of A Weaker Dollar
The Stock Market Implications Of A Weaker Dollar
If the dollar were cheap, all the factors discussed above could be overlooked. But the dollar is not cheap. It is still pricey based on purchasing power parity measures which compare the common-currency cost of identical consumption bundles from one country to the next (Chart 11). A Weaker Dollar is Bullish For Stocks, Especially Non-US Stocks Global equities in general, and non-US stocks in particular, tend to perform well when the dollar is weakening (Chart 12). Chart 12A Weaker Dollar Should Help Global Equities
A Weaker Dollar Should Help Global Equities
A Weaker Dollar Should Help Global Equities
Chart 13Cyclicals Tend To Outperform Defensives In A Falling Dollar Environment
Cyclicals Tend To Outperform Defensives In A Falling Dollar Environment
Cyclicals Tend To Outperform Defensives In A Falling Dollar Environment
Cyclical sectors such as industrials, energy, and materials normally outperform defensives in a weak dollar environment (Chart 13). Relative profit growth in these sectors tends to rise when the dollar depreciates (Chart 14). To the extent that cyclicals are overrepresented in stock market indices outside the US, this gives non-US equities a leg up. Chart 14Relative Profit Growth In Cyclical Sectors Tend To Rise When The USD Depreciates
Relative Profit Growth In Cyclical Sectors Tend To Rise When The USD Depreciates
Relative Profit Growth In Cyclical Sectors Tend To Rise When The USD Depreciates
EM Is The Big Winner From Dollar Weakness A weaker dollar is particularly beneficial to emerging markets. Commodity prices usually rise when the dollar drops (Chart 15). Rising resource prices are good news for many emerging markets. EM debt dynamics also tend to improve when the dollar weakens. EM external debt has grown in recent years (Chart 16). About 80% of EM foreign currency denominated debt is in dollars. A falling dollar reduces the local-currency value of US dollar-denominated liabilities, thus strengthening the balance sheets of many EM companies and governments. Emerging markets with large current account deficits and significant dollar liabilities such as Brazil, Indonesia, Turkey, and Mexico will outperform EMs that generally run current account surpluses and have little in the way of foreign-currency debt. Chart 15Commodity Prices Usually Rise When The Dollar Falls
Commodity Prices Usually Rise When The Dollar Falls
Commodity Prices Usually Rise When The Dollar Falls
Chart 16EM External Debt Has Grown In Recent Years
EM External Debt Has Grown In Recent Years
EM External Debt Has Grown In Recent Years
The Federal Reserve today is trying to engineer an easing in US financial conditions. A weaker dollar is facilitating that goal. Historically, EM stocks have been almost perfectly inversely correlated with US financial conditions (Chart 17). Chart 17EM Equities Benefit From Easier US Financial Conditions
EM Equities Benefit From Easier US Financial Conditions
EM Equities Benefit From Easier US Financial Conditions
What About DM? The impact of a weaker dollar on the stock markets of developed economies is more nuanced. Consider the euro area, for example. On the one hand, a stronger euro hurts the euro area economy, which can ultimately push down domestic profits. A stronger EUR/USD also reduces the profits of European companies with operations in the US when those profits are converted back into euros. That can also hurt European stocks. On the other hand, the overall reflationary effect of a weaker dollar on global growth tends to push up profits. In practice, the latter effect usually dominates the former. Thus, euro area stocks, just like stocks in most other markets, generally outperform the US when the dollar is weakening (Chart 18). Chart 18ANon-US Stock Markets Do Well Vis-À-Vis The US When The Dollar Is Weakening
Non-US Stock Markets Do Well Vis-À-Vis The US When The Dollar Is Weakening
Non-US Stock Markets Do Well Vis-À-Vis The US When The Dollar Is Weakening
Chart 18BNon-US Stock Markets Do Well Vis-À-Vis The US When The Dollar Is Weakening
Non-US Stock Markets Do Well Vis-À-Vis The US When The Dollar Is Weakening
Non-US Stock Markets Do Well Vis-À-Vis The US When The Dollar Is Weakening
Small Caps And Value Stocks Tend To Outperform When The Dollar Weakens Even though companies in the small cap Russell 2000 index generate less of their sales from abroad than those in the S&P 500, small caps still tend to outperform large caps in weak dollar environments (Chart 19). This is partly because smaller companies are more cyclical in nature. It is also because the US dollar performs best in a risk-off setting when investors are pouring money into the safe-haven Treasury markets. In contrast, small caps excel in a risk-on environment. Value stocks tend to outperform growth stocks in a weaker dollar environment (Chart 20). Like small caps, cyclical equity sectors are overrepresented in value indices. Financials also tend to punch above their weight in value indices. Chart 19Small Caps Tend To Outperform Large Caps During Weak Dollar Environments...
Small Caps Tend To Outperform Large Caps During Weak Dollar Environments...
Small Caps Tend To Outperform Large Caps During Weak Dollar Environments...
Chart 20...The Same Goes For Value Stocks
...The Same Goes For Value Stocks
...The Same Goes For Value Stocks
Small caps and value stocks outperformed between 2000 and 2008, a time when the US dollar was generally weakening. That period saw both a commodity boom and a wave of debt-fueled housing booms. The former lifted commodity prices, while the latter buoyed financials. Commodity prices should rise over the next 12 months thanks to a rebound in global growth and copious Chinese stimulus. Chart 21 shows that the Chinese credit impulse is on track to reach the highest levels since the Global Financial Crisis, while the fiscal deficit will probably hit a record 8% of GDP. The Outlook For Financial Stocks Gauging the outlook for financials is trickier. Credit growth has slowed sharply since the Global Financial Crisis, which has weighed on bank profits. The structural decline in bond yields has also been toxic for bank shares (Chart 22). Lower bond yields tend to translate into flatter yield curves, which can depress net interest margins. Chart 21China Has Opened The Spigots
China Has Opened The Spigots
China Has Opened The Spigots
Chart 22The Structural Decline In Bond Yields Has Been Negative For Bank And Value Stocks
The Structural Decline In Bond Yields Has Been Negative For Bank And Value Stocks
The Structural Decline In Bond Yields Has Been Negative For Bank And Value Stocks
A falling dollar has historically been associated with higher bond yields (Chart 23). As global growth recovers over the next 12 months, bond yields will edge higher. That said, central bank bond purchases, coupled with aggressive forward guidance, will keep bond yields from rising as much as they normally would. And even if nominal yields do rise, inflation expectations will rise even more, implying that real yields will fall further. Falling real yields tend to benefit growth stocks more than they benefit value stocks. Chart 23Bond Yields Tend To Rise When The Dollar Weakens
Bond Yields Tend To Rise When The Dollar Weakens
Bond Yields Tend To Rise When The Dollar Weakens
Still, even a modest steepening of the yield curve will be good for bank earnings. A recovery in economic activity should also dampen concerns about a spike in bad loans. Credit spreads normally fall when economic growth is improving and the dollar is weakening (Chart 24). Banks have significantly increased provisions since the start of the year, which has depressed reported earnings. If some of those provisions are reversed, profits will jump. Chart 24Credit Spreads Tend To Fall When Growth Is Improving And The Dollar Is Weakening
Credit Spreads Tend To Fall When Growth Is Improving And The Dollar Is Weakening Credit Spreads Tend To Fall When Growth Is Improving And The Dollar Is Weakening
Credit Spreads Tend To Fall When Growth Is Improving And The Dollar Is Weakening Credit Spreads Tend To Fall When Growth Is Improving And The Dollar Is Weakening
Chart 25Bank And Value Stocks Are Quite Cheap
The Stock Market Implications Of A Weaker Dollar
The Stock Market Implications Of A Weaker Dollar
Moreover, bank stocks in particular, and value stocks in general, are extremely cheap by historic standards (Chart 25). Thus, while the case for favoring value over growth is not as clear-cut as it could be, it is strong enough that long term-oriented investors should consider moving capital from high-flying tech stocks to unloved value stocks. Peter Berezin Chief Global Strategist peterb@bcaresearch.com Footnotes 1 Please see Global Investment Strategy Weekly Report, “Will Bond Yields Ever Go Up?” dated July 24, 2020. Global Investment Strategy View Matrix
The Stock Market Implications Of A Weaker Dollar
The Stock Market Implications Of A Weaker Dollar
Current MacroQuant Model Scores
The Stock Market Implications Of A Weaker Dollar
The Stock Market Implications Of A Weaker Dollar
Highlights The tech sector faces mounting domestic political and geopolitical risks. We fully expected stimulus hiccups but believe they will give way to large new fiscal support, given that COVID-19 is weighing on consumer confidence. Europe’s relative political stability is a good basis for the euro rally but any comeback in opinion polling by President Trump could give dollar bulls new life. DXY is approaching a critical threshold below which it would break down further. The US could take aggressive actions on Russia and Iran, but China and the Taiwan Strait remain the biggest geopolitical risk. Feature Near-term risks continue to mount against the equity rally, even as governments’ combined monetary and fiscal policies continue to support a cyclical economic rebound. Chart 1Tech Bubble Amid Tech War
Tech Bubble Amid Tech War
Tech Bubble Amid Tech War
Testimony by the chief executives of Facebook, Apple, Amazon, and Alphabet to the US House of Representatives highlighted the major political risks facing the market leaders. There are three reasons not to dismiss these risks despite the theatrical nature of the hearings. First, the tech companies’ concentration of wealth would be conspicuous during any economic bust, but this bust has left pandemic-stricken consumers more reliant on their services. Second, acrimony is bipartisan – conservatives are enraged by the tendency of the tech companies to side with the Democratic Party in policing the range of acceptable political discourse, and they increasingly agree with liberals that the companies have excessive corporate power warranting anti-trust probes. Executive action is the immediate risk, but in the coming one-to-two years congressional majorities will also be mustered to tighten regulation. Third, technology is the root of the great power struggle between the US and China – a struggle that will not go away if Biden wins the election. Indeed Biden was part of the administration that launched the US’s “Pivot to Asia” and will have better success in galvanizing US diplomatic allies behind western alternatives to Chinese state-backed and military-linked tech companies. US tech companies struggle to outperform Chinese tech companies except during episodes of US tariffs, given the latter firms’ state-backed turn toward innovation and privileged capture of the Chinese domestic market (Chart 1). The US government cannot afford to break up these companies without weighing the strategic consequences for America’s international competitiveness. The attempt to coordinate a western pressure campaign against Huawei and other leading Chinese firms will continue over the long run as they are accused of stealing technology, circumventing UN sanctions, violating human rights, and compromising the national security of the democracies. China, for its part, will be forced to take counter-measures. US tech companies will be caught in the middle. Like the threat of executive regulation in the domestic sphere, the threat of state action in the international sphere is difficult to time. It could happen immediately, especially given that the US is having some success in galvanizing an alliance even under President Trump (see the UK decision to bar Huawei) and that President Trump’s falling election prospects remove the chief constraint on tough action against China (the administration will likely revoke Huawei’s general license on August 13 or closer to the election). Massive domestic economic stimulus empowers the US to impose a technological cordon and China to retaliate. Combining this headline risk to the tech sector with other indications that the equity rally is extended – the surge in gold prices, the fall in the 30-year/5-year Treasury slope – tells us that investors should be cautious about deploying fresh capital in the near term. Republicans Will Capitulate To New Stimulus Just as President Trump has ignored bad news on the coronavirus, financial markets have ignored bad news on the economy. Dismal Q2 GDP releases were fully expected – Germany shrank by 10.1% while the US shrank by 9.5% on a quarterly basis, 32.9% annualized. But the resurgence of the virus is threatening new government restrictions on economic activity. US initial unemployment claims have edged up over the past three weeks. US consumer confidence regarding future expectations plummeted from 106.1 in June to 91.5 in July, according to the Conference Board’s index. Chart 2Global Instability Will Follow Recession
A Tech Bubble Amid A Tech War (GeoRisk Update)
A Tech Bubble Amid A Tech War (GeoRisk Update)
Setbacks in combating the virus will hurt consumers even assuming that governments lack the political will to enforce new lockdowns. The share of countries in recession has surged to levels not seen in 60 years (Chart 2). Financial markets can look past recessions, but the pandemic-driven recession will result in negative surprises and second-order effects that are unforeseen. Yes, fresh fiscal stimulus is coming, but this is more positive for the cyclical outlook than the tactical outlook. Stimulus “hiccups” could precipitate a near-term pullback – such a pullback may be necessary to force politicians to resolve disputes over the size and composition of new stimulus. This risk is immediate in the United States, where House Democrats, Senate Republicans, and the White House have hit an all-too-predictable impasse over the fifth round of stimulus. The bill under negotiation is likely to be President Trump’s last chance to score a legislative victory before the election and the last significant legislative economic relief until early 2021. The Senate Republicans have proposed a $1.1 trillion HEALS Act in response to the House Democrats’ $3.4 trillion HEROES Act, passed in mid-May. As we go to press, the federal unemployment insurance top-up of $600 per week is expiring, with a potential cost of 3% of GDP in fiscal tightening, as well as the moratorium on home evictions. Congress will have to rush through a stop-gap measure to extend these benefits if it cannot resolve the debate on the larger stimulus package. If Democrats and Republicans split the difference then we will get $2.5 trillion in stimulus, likely by August 10. Compromise on the larger package is easy in principle, as Table 1 shows. If the two sides split the difference between their proposals in a commonsense way, as shown in the fourth and fifth columns of Table 1, then the result will be a $2.5 trillion stimulus. This estimate fits with what we have published in the past and likely meets market expectations for the time being. Table 1Outline Of Fifth US COVID Stimulus Package (Estimate)
A Tech Bubble Amid A Tech War (GeoRisk Update)
A Tech Bubble Amid A Tech War (GeoRisk Update)
Whether it is enough for the economy depends on how the virus develops and how governments respond once flu season picks up and combines with the coronavirus to pressure the health system this fall. A back-of-the-envelope estimate of the amount of spending necessary to keep the budget deficit from shrinking in the second half of the year comes much closer to the House Democrats’ $3.4 trillion bill (Table 2), which suggests that what appears to be a massive stimulus today could appear insufficient tomorrow. Nevertheless, $2.5 trillion is not exactly small. It would bring the US total to $5 trillion year-to-date, or 24% of GDP! Table 2Reducing The Budget Deficit On A Quarterly Basis Will Slow Economy
A Tech Bubble Amid A Tech War (GeoRisk Update)
A Tech Bubble Amid A Tech War (GeoRisk Update)
While a compromise bill should come quickly, the Republican Party is more divided over this round of stimulus than earlier this year. Chart 3US Personal Income Looks Good Compared To 2008-09
US Personal Income Looks Good Compared To 2008-09
US Personal Income Looks Good Compared To 2008-09
First, there is some complacency due to the fact that the economy is recovering, not collapsing as was the case back in March. Our US bond strategist, Ryan Swift, has shown that US personal income is much better off, thus far, than it was in the months following the 2008 financial crisis, even though the initial pre-transfer hit to incomes is larger (Chart 3). Second, the Republican Party is reacting to growing unease within its ranks over the yawning budget deficit, now the largest since World War II (Chart 4). Chart 4If Republicans React To Deficit Concerns They Cook Their Own Goose
If Republicans React To Deficit Concerns They Cook Their Own Goose
If Republicans React To Deficit Concerns They Cook Their Own Goose
Chart 5Consumer Confidence Sends Warning Signal To Republicans
A Tech Bubble Amid A Tech War (GeoRisk Update)
A Tech Bubble Amid A Tech War (GeoRisk Update)
If Republicans are guided by complacency and fiscal hawks, they will cook their own goose. A failure to provide government support will cause a financial market selloff, will hurt consumer confidence, and will put the final nail in the coffin of their own chance of re-election as well as President Trump’s. Consumer confidence tracks fairly well with presidential approval rating and election outcomes. A further dip could disqualify Trump, whereas a last-minute boost due to stimulus and an economic surge could line him up for a comeback in the last lap (Chart 5). These constraints are obvious so we maintain our high conviction call that a bill will be passed, likely by August 10. But at these levels on the equity market, we simply have no confidence in the market gyrations leading up to or following the passage of the bill. Our conviction level is on the cyclical, 12-month horizon, in which case we expect US and global stimulus to operate and equities to rise. Bottom Line: Political and economic constraints will force Republicans to join Democrats and pass a new stimulus bill of about $2.5 trillion by around August 10. This is cyclically positive, but hiccups in getting it passed, negative surprises, and other risks tied to US politics discourage us from taking an overtly bullish stance over the next three months. Yes, US-China Tensions Are Still Relevant Chart 6Chinese Politburo"s Bark Worse Than Bite On Stimulus
Chinese Politburo"s Bark Worse Than Bite On Stimulus
Chinese Politburo"s Bark Worse Than Bite On Stimulus
Financial markets have shrugged off US-China tensions this year for understandable reasons. The pandemic, recession, and stimulus have overweighed the ongoing US-China conflict. As we have argued, China is undertaking a sweeping fiscal and quasi-fiscal stimulus – despite lingering hawkish rhetoric – and the size is sufficient to assist in global economic recovery as well as domestic Chinese recovery. What the financial market overlooks is that China’s households and firms are still reluctant to spend (Chart 6). China’s Politburo's late July meetings on the economy are frequently important. Initial reports of this year’s meet-up reinforce the stimulus narrative. Hints of hawkishness here and there serve a political purpose in curbing market exuberance, both at home and in the US election context, but China will ultimately remain accommodative because it has already bumped up against its chief constraint of domestic stability. Note that this assessment also leaves space for market jitters in the near-term. The phase one trade deal remains intact as President Trump is counting on it to make the case for re-election while China is looking to avoid antagonizing a loose cannon president who still has a chance of re-election. As long as broad-based tariff rates do not rise, in keeping with Trump’s deal, financial markets can ignore the small fry. We maintain a 40% risk that Trump levels sweeping punitive measures; our base case is that he goes to the election arguing that he gets results through his deal-making while carrying a big stick. At the same time, our view that domestic stimulus removes the economic constraints on conflict, enabling the two countries to escalate tensions, has been vindicated in recent weeks. Chinese political risk continues on a general uptrend, based on market indicators. The market is also starting to price in the immense geopolitical risks embedded in Taiwan’s situation, which we have highlighted consistently since 2016. While North Korea remains on a diplomatic track, refraining from major military provocations, South Korean political risk is still elevated both for domestic and regional reasons (Chart 7). Chart 7China Political Risk Still Trending Upward
China Political Risk Still Trending Upward
China Political Risk Still Trending Upward
The market is gradually pricing in a higher risk premium in the renminbi, Taiwanese dollar, and Korean won, and this pricing accords with our longstanding political assessment. The closure of the US and Chinese consulates in Houston and Chengdu is only the latest example of this escalating dynamic. While the US’s initial sanctions on China over Hong Kong were limited in economic impact, the longer term negative consequences continue to build. Hong Kong was the symbol of the Chinese Communist Party’s compatibility with western liberalism; the removal of Hong Kong’s autonomy strikes a permanent blow against this compatibility. China’s decision to go forward with the imposition of a national security law in Hong Kong – and now to bar pro-democratic candidates from the September 6 Legislative Council elections, which will probably be postponed anyway – has accelerated coalition-building among the western democracies. The UK is now clashing with China more openly, especially after blocking Huawei from its 5G system and welcoming Hong Kong political refugees. Australia and China have fought a miniature trade war of their own over China’s lack of transparency regarding COVID-19, and Canada is implicated in the Huawei affair. Even the EU has taken a more “realist” approach to China. Across the Taiwan Strait, political leaders are assisting fleeing Hong Kongers, crying out against Beijing’s expansion of control in its periphery, rallying support from informal allies in the US and West, and doubling down on their “Silicon Shield” (prowess in semiconductor production) as a source of protection. Intel Corporation’s decision to increase its dependency on TSMC for advanced microchips only heightens the centrality of this island and this company in the power struggle between the US and China. China cannot fulfill its global ambitions if the US succeeds in creating a technological cordon. Taiwan is the key to China’s breaking through that cordon. Therefore Taiwan is at heightened risk of economic or even military conflict. The base case is that Beijing will impose economic sanctions first, to undermine Taiwanese leadership. The uncertainty over the US’s willingness to defend Taiwan is still elevated, even if the US is gradually signaling a higher level of commitment. This uncertainty makes strategic miscalculations more likely than otherwise. But Taiwan’s extreme economic dependence on the mainland gives Beijing a lever to pursue its interests and at present that is the most important factor in keeping war risk contained. By the same token, Taiwanese economic and political diversification increases that risk. A “fourth Taiwan Strait crisis” that involves trade war and sanctions is our base case, but war cannot be ruled out, and any war would be a major war. Thus investors can safely ignore Tik-Tok, Hong Kong LegCo elections, and accusations of human rights violations in Xinjiang. But they cannot ignore concrete deterioration in the Taiwan Strait. Or, for that matter, the South and East China Seas, which are not about fishing and offshore drilling but about China’s strategic depth and positioning around Taiwan. Taiwan is at heightened risk of economic or military conflict. The latest developments have seen the CNY-USD exchange rate roll over after a period of appreciation associated with bilateral deal-keeping (Chart 8). Depreciation makes it more likely that President Trump will take punitive actions, but these will still be consistent with maintaining the phase one deal unless his re-election bid completely collapses, rendering him a lame duck and removing his constraints on more economically significant confrontation. We are perilously close to such an outcome, which is why Trump’s approval rating and head-to-head polling against Joe Biden must be monitored closely. If his budding rebound is dashed, then all bets are off with regard to China and Asian power politics. Chart 8A Warning Of Further US-China Escalation
A Warning Of Further US-China Escalation
A Warning Of Further US-China Escalation
Bottom Line: China’s stimulus, like the US stimulus, is a reason for cyclical optimism regarding risk assets. The phase one trade deal with President Trump is less certain – there is a 40% chance it collapses as stimulus and/or Trump’s political woes remove constraints on conflict. Hong Kong is a red herring except with regard to coalition-building between the US and Europe; the Taiwan Strait is the real geopolitical risk. Maritime conflicts relate to Taiwan and are also market-relevant. Europe, Russia, And Oil Risks Europe has proved a geopolitical opportunity rather than a risk, as we have contended. The passage of joint debt issuance in keeping with the seven-year budget reinforces the point. The Dutch, facing an election early next year, held up the negotiations, but ultimately relented as expected. Emmanuel Macron, who convinced German Chancellor Angela Merkel to embrace this major compromise for European solidarity, is seeing his support bounce in opinion polls at home. He is being rewarded for taking a leadership position in favor of European integration as well as for overseeing a domestic economic rebound. His setback in local elections is overstated as a political risk given that the parties that benefited do not pose a risk to European integration, and will ally with him in 2022 against any populist or anti-establishment challenger. We still refrain from reinitiating our long EUR-USD trade, however, given the immediate risks from the US election cycle (Chart 9). We will reevaluate if Trump’s odds of victory fall further. A Biden victory is very favorable for the euro in our view. Chart 9EUR-USD Gets Boost From EU Solidarity
EUR-USD Gets Boost From EU Solidarity
EUR-USD Gets Boost From EU Solidarity
We are bullish on pound sterling because even a delay or otherwise sub-optimal outcome to trade talks is mostly priced in at current levels (Charts 10A and 10B). Prime Minister Boris Johnson has the raw ability to walk away without a deal, in the context of strong domestic stimulus, but the long-term economic consequences could condemn him to a single term in office. Compromise is better and in both parties’ interests. Chart 10APound Sterling A Buy Over Long Run
Pound Sterling A Buy Over Long Run
Pound Sterling A Buy Over Long Run
Chart 10BPound Sterling A Buy Over Long Run
Pound Sterling A Buy Over Long Run
Pound Sterling A Buy Over Long Run
Two other risks are worth a mention in this month’s GeoRisk Update: Chart 11Russia: GeoRisk Indicator Russian Bonds May Face Sanctions
Russia: GeoRisk Indicator Russian Bonds May Face Sanctions
Russia: GeoRisk Indicator Russian Bonds May Face Sanctions
Russia: In recent reports we have maintained that Russian geopolitical risk is understated by markets. Domestic unrest is rising, the Trump administration could impose penalties over Nordstream 2 or other issues to head off criticism on the campaign trail, and a Biden administration would be outright confrontational toward Putin’s regime. Moscow may intervene in the US elections or conduct larger cyber attacks. US sanctions could ultimately target trading of local currency Russian government bonds, which so far have been spared (Chart 11). Iran: The jury is still out on whether the recent series of mysterious explosions affecting critical infrastructure in Iran are evidence of a clandestine campaign of sabotage (Table 3). The nature of the incidents leaves some room for accident and coincidence.1 But the inclusion of military and nuclear sites in the list leads us to believe that some degree of “wag the dog” is going on. The prime suspect would be Israel and/or the United States during the window of opportunity afforded by the Trump administration, which looks to be closing over the next six months. Trump likely has a high tolerance for conflict with Iran ahead of the election. Even though Americans are war-weary, they will rally to the president’s defense if Iran is seen as the instigator, as opinion polls showed they did in September 2019 and January of this year. Iran is avoiding goading Trump so far but if it suffers too great of damage from sabotage then it may be forced to react. The dynamic is unstable and hence an oil price spike cannot be ruled out. Table 3Wag The Dog Scenario Playing Out In Iran
A Tech Bubble Amid A Tech War (GeoRisk Update)
A Tech Bubble Amid A Tech War (GeoRisk Update)
Chart 12Oil Supply Risks Stem From Iran/Iraq, But COVID Threat To Demand Persists
Oil Supply Risks Stem From Iran/Iraq, But COVID Threat To Demand Persists
Oil Supply Risks Stem From Iran/Iraq, But COVID Threat To Demand Persists
Oil markets have the capacity and the large inventories necessary to absorb supply disruptions caused by a single Iranian incident (Chart 12). Only a chain reaction or major conflict would add to upward pressure. This would also require global demand to stay firm. The threat from COVID-19 suggests that volatility is the only thing one can count on in the near-term. Over the long run we remain bullish crude oil due to the unfettered commitment by world governments to reflation. Bottom Line: The euro rally is fundamentally supported but faces exogenous risks in the short run. We would steer clear of Russian currency and local currency bonds over the US election campaign and aftermath, particularly if Trump’s polling upturn becomes a dead cat bounce. Iran is a “gray swan” geopolitical risk, hiding in plain sight, but its impact on oil markets will be limited unless a major war occurs. Investment Implications The US dollar is at a critical juncture. Our Foreign Exchange Strategist Chester Ntonifor argues that if the DXY index breaks beneath the 93-94 then the greenback has entered a structural bear market. The most recent close was 93.45 and it has hovered below 94 since Monday. Failure to pass US stimulus quickly could result in a dollar bounce along with other safe havens. Over the short run, investors should be prepared for this and other negative surprises relating to the US election and significant geopolitical risks, especially involving China, the tech war, and the Taiwan Strait. Over the long run, investors should position for more fiscal support to combine with ultra-easy monetary policy for as far as the eye can see. The Federal Reserve is not even “thinking about thinking about raising rates.” This combination ultimately entails rising commodity prices, a weakening dollar, and international equity outperformance relative to both US equities and government bonds. Matt Gertken Vice President Geopolitical Strategy mattg@bcaresearch.com Footnotes 1 See Raz Zimmt, "When it comes to Iran, not everything that goes boom in the night is sabotage," Atlantic Council, July 30, 2020. Section II: Appendix : GeoRisk Indicator China
China: GeoRisk Indicator
China: GeoRisk Indicator
Russia
Russia: GeoRisk Indicator
Russia: GeoRisk Indicator
UK
UK: GeoRisk Indicator
UK: GeoRisk Indicator
Germany
Germany: GeoRisk Indicator
Germany: GeoRisk Indicator
France
France: GeoRisk Indicator
France: GeoRisk Indicator
Italy
Italy: GeoRisk Indicator
Italy: GeoRisk Indicator
Canada
Canada: GeoRisk Indicator
Canada: GeoRisk Indicator
Spain
Spain: GeoRisk Indicator
Spain: GeoRisk Indicator
Taiwan
Taiwan: GeoRisk Indicator
Taiwan: GeoRisk Indicator
Korea
Korea: GeoRisk Indicator
Korea: GeoRisk Indicator
Turkey
Turkey: GeoRisk Indicator
Turkey: GeoRisk Indicator
Brazil
Brazil: GeoRisk Indicator
Brazil: GeoRisk Indicator
Section III: Geopolitical Calendar
Highlights The use of physical distancing and face masks restricts any activity that requires the use of your mouth and nose in proximity to others. We estimate that this restriction could wipe out 10 percent of jobs. Hence, as government lifelines to employers are cut, expect permanent unemployment to rise sharply. 30-year bond prices will soon hit all-time highs. Bank prices will soon hit all-time lows. While the pandemic remains in play, the European stock market will struggle to outperform the US stock market. The biggest risk to our positioning is that the pandemic suddenly ends. But our working assumption is that a credible vaccine will not be available until 2021. Fractal trade: Gold strength and dollar weakness are approaching trend exhaustion. Feature Table I-1Hospitality, Retail, And Transport Employ 25 Percent Of All Workers
An Economy Without Mouths Or Noses Will Lose 10 Percent Of Jobs
An Economy Without Mouths Or Noses Will Lose 10 Percent Of Jobs
In many countries, face masks have become compulsory in public places where physical distancing is impractical – such as on public transport or in supermarkets. Physical distancing and face masks create a barrier either of distance or of material between your mouth and nose and other people’s mouths and noses. The worthy objective is to control the pandemic while allowing most aspects of normal life and economic activity to resume. Yet some aspects of normal life and economic activity cannot resume. To state the obvious, the use of physical distancing and face masks restricts any activity that requires the use of your mouth and nose in proximity to others. These activities fall under three broad categories: Social eating, drinking, talking, singing, and cheering – a category of activities which economists call ‘social consumption’. Activities that require social communication at close quarters. Such social communication is often reliant on facial expressions, which become impossible to identify at distance or under a face mask. Long-haul travel. After all, who wants to get on an aeroplane if it means wearing a face mask for 10 hours? This raises a crucial question: in an economy which prevents mouths and noses getting in proximity to others, how much activity will be destroyed? Permanent Unemployment Set To Rise Sharply Three sectors that are suffering are hospitality, retail, and transport. ‘Bricks and mortar’ retail is suffering because physical distancing limits footfall, and because discretionary shopping is often regarded as a social activity which becomes pointless with physical distancing and face masks. Using the US as a template, the three sectors sum to around 12 percent of economic activity. If we assume that physical distancing and the use of face masks forces them to operate at two-thirds capacity, then the economy will lose a tolerable 4 percent of activity. That’s the good news. Here’s the bad news. The three sectors have a high labour intensity, so they employ 25 percent of all workers (Table I-1). Meaning that even with the optimistic assumption of operating at two-thirds capacity, more than 8 percent of jobs will get wiped out. And on less optimistic assumptions, the job destruction could rise to over 10 percent. The lockdowns were an emergency and temporary response to surging infection rates. They created massive temporary unemployment, as employers put their staff on state-subsidized furlough. As the lockdowns have eased, some of the these temporary unemployed have returned to work (Chart I-1). In contrast, the introduction of physical distancing and face masks forms a longer-term strategy to control the pandemic. As already explained, an economy without mouths and noses in proximity to others will increase the amount of permanent unemployment, which is already rising sharply (Chart I-2). Chart I-1Number Of Temporary Unemployed Down...
Number Of Temporary Unemployed Down...
Number Of Temporary Unemployed Down...
Chart I-2...But Number Of Permanent Unemployed Sharply Up
...But Number Of Permanent Unemployed Sharply Up
...But Number Of Permanent Unemployed Sharply Up
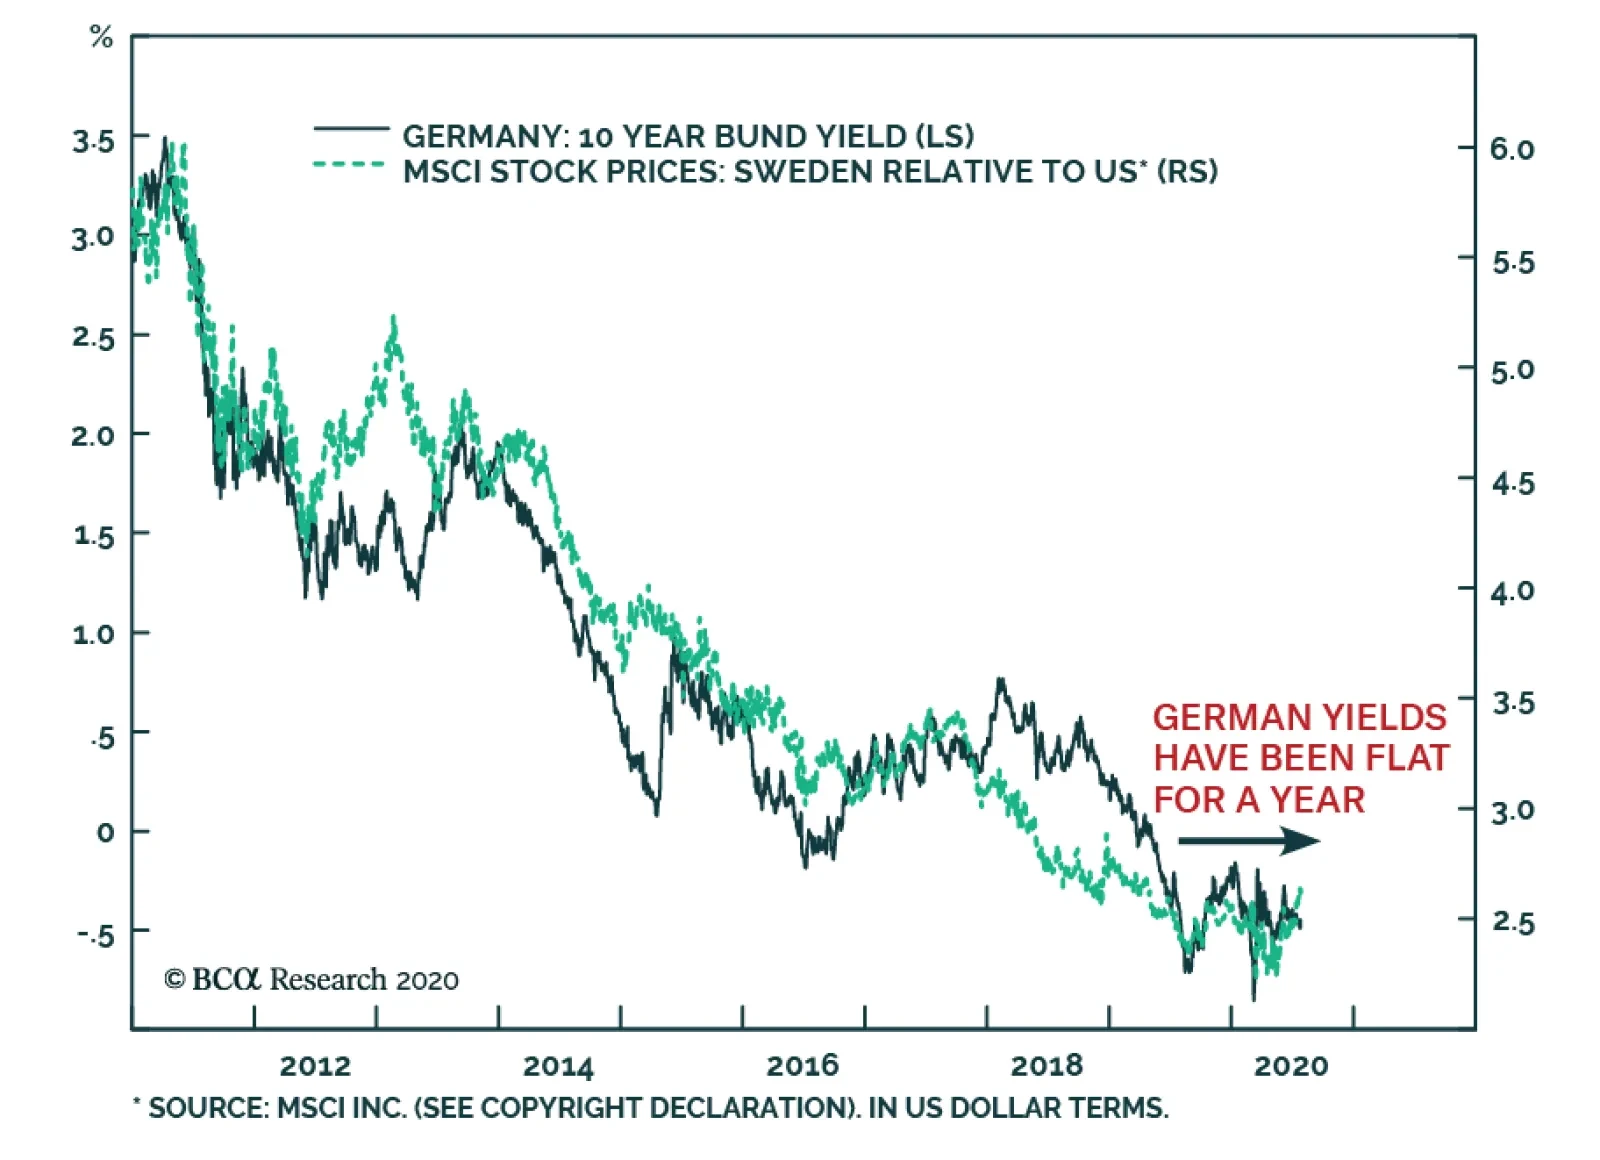
To make matters worse, state-subsidized furlough schemes are winding down. In France, the scheme will continue into 2021 but with a much-reduced subsidy per worker; in Germany the Kurzarbeit scheme finishes at the end of the year; and in the UK the furlough scheme finishes in October. As government lifelines to employers are cut, expect permanent unemployment to continue its climb. And expect this high level of structural unemployment to keep depressing 30-year bond yields. The good news is that in the coming months, 30-year bond prices will hit all-time highs (Chart I-3). But given the very tight connection between bond yields and bank share prices, the bad news is that bank prices will hit all-time lows (Chart I-4). Chart I-330-Year T-Bond Price Approaches All-Time High
30-Year T-Bond Price Approaches All-Time High
30-Year T-Bond Price Approaches All-Time High
Chart I-4Banks Are Tracking The Bond Yield
Banks Are Tracking The Bond Yield
Banks Are Tracking The Bond Yield
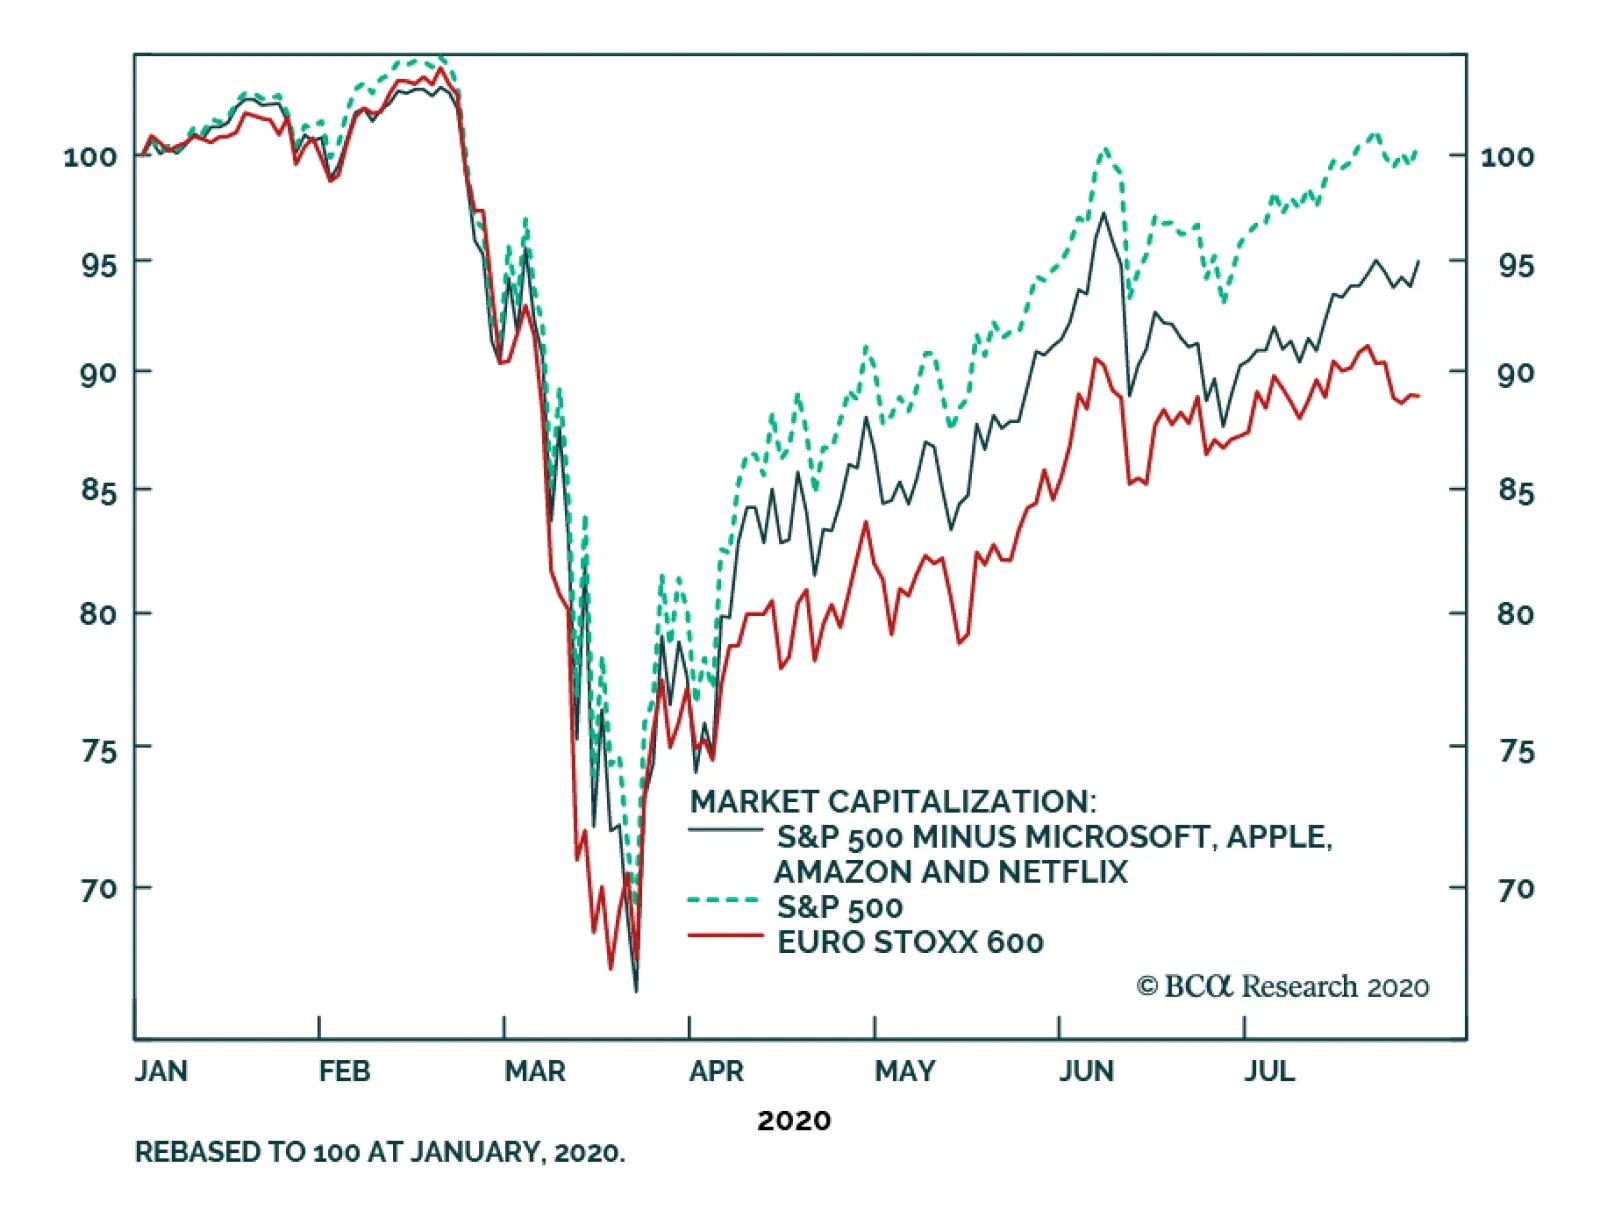
The Pandemic ‘Winners’ Are Not European To understand what has been happening in the stock market this year, you don’t need to think hard. You just need to think about how you spend a typical day in the pandemic era. Here’s a typical day for me, which I hope resonates with many of you. I participate in a series of virtual meetings using Microsoft Teams. My Apple iPhone and iPad have become my most constant and most needed work companions. I do most of my shopping on Amazon. And in the evening, I relax by watching movies on Netflix. All of which constitutes a major change from a typical day in the pre-pandemic era. In the pandemic era, I have a greater dependence on, loyalty to, and usage of Microsoft, Apple, Amazon, and Netflix products and services. Assuming my experience represents the mass experience, it explains why these companies, and a few others, are the pandemic ‘winners’. In the greatest demand shock since the Depression, the profits of Microsoft, Apple, and Amazon have held up well. While the profits of Netflix are up 40 percent1 (Chart I-5). The trouble for the European stock market is that the pandemic winners are all listed in the US, where they make an outsized contribution to stock market profits. This is the main reason why European profits are down 32 percent this year, while US profits are down ‘just’ 18 percent (Chart I-6). Chart I-5The Pandemic 'Winners' Are Not European...
The Pandemic 'Winners' Are Not European...
The Pandemic 'Winners' Are Not European...
Chart I-6...So European Profits Have Underperformed US Profits
...So European Profits Have Underperformed US Profits
...So European Profits Have Underperformed US Profits
More remarkably, these four stocks explain more than half of Europe’s Stoxx 600 underperformance versus the S&P 500. Stop and reflect on that for a moment. The major European index comprises 600 stocks, and the major US index comprises 500 stocks. Yet pretty much all you need to explain the performance difference this year are four US growth defensive stocks: Microsoft, Apple, Amazon, and Netflix (Chart I-7). Chart I-7The Absence Of Pandemic 'Winners' Explains Most Of European Underperformance
The Absence Of Pandemic 'Winners' Explains Most Of European Underperformance
The Absence Of Pandemic 'Winners' Explains Most Of European Underperformance
While the pandemic remains in play, the European stock market will struggle to outperform the US stock market. On Valuations And Risk Premiums What about rich valuations? Since the end of 2018, the forward earnings multiple of growth defensives – defined as global technology plus healthcare – is up from 16 to 23, a surge of almost 50 percent. Stated inversely, the forward earnings yield has collapsed from 6.2 percent to 4.4 percent. Yet over the same period, the 10-year T-bond yield has collapsed from 3.2 percent to 0.6 percent, so the gap between the growth defensive earnings yield and the bond yield has barely changed. In other words, the huge rally in absolute valuations is entirely due to the collapse in the bond yield. Put simply, if the long-term return on bonds collapses to near-zero, then the prospective returns on competing investments must also collapse to pitiful levels, justifying richer valuations (Chart I-8). Chart I-8The Collapsed Bond Yield Entirely Explains The Collapsed Earnings Yield Of Growth Defensives
The Collapsed Bond Yield Entirely Explains The Collapsed Earnings Yield Of Growth Defensives
The Collapsed Bond Yield Entirely Explains The Collapsed Earnings Yield Of Growth Defensives
In this regard, we strongly dispute the popular narrative that Robinhood day traders are creating a speculative frenzy in growth defensives. Whilst the narrative sounds alluring, the facts strongly contradict it. As the charts show, we can explain all the recent price move in terms of the two fundamentals: resilient profits combined with the collapsed bond yield. One objection is that the gap between the earnings yield and the bond yield – a measure of the equity risk premium – needs to be much higher in the pandemic era. Yet as we have shown, the growth defensives are even more defensive now than they were before the pandemic, raising the reasonable rejoinder: why should the risk premium be higher for this segment of the market during the pandemic compared to before it? Moreover, the pandemic has simply accelerated structural trends that were already underway: for example, the shift to remote working and the demise of bricks and mortar retailers started well before the virus. These major structural trends will continue with or without the pandemic. Nevertheless, the biggest risk to our positioning is that the pandemic suddenly ends. In which case, growth defensives would quickly fall out of favour while old-fashioned cyclicals – like banks – would come roaring back into favour, albeit only briefly. We are closely monitoring this risk. Our working assumption is that it is not a high risk right now because a credible vaccine will not be available until 2021. In which case, structural unemployment is set to rise sharply later this year. This will depress ultra-long bond yields even more, and keep supporting an overweight to growth defensives, at least relative to other parts of the stock market. Dhaval Joshi Chief European Investment Strategist dhaval@bcaresearch.com Footnotes 1 Based on 12-month forward earnings per share. Fractal Trading System* This week we highlight that both the sharp rally in gold and the sell-off in the dollar are approaching a short-term trend exhaustion. A potential catalyst for such a reversal would be Covid-19 infection rates re-accelerating in Europe to create a ‘second wave’. Given our open positions in short silver and short gold versus lead, there are no additional trades this week. The rolling 1-year win ratio now stands at 60 percent.
Gold
Gold
USD/CHF
USD/CHF
When the fractal dimension approaches the lower limit after an investment has been in an established trend it is a potential trigger for a liquidity-triggered trend reversal. Therefore, open a countertrend position. The profit target is a one-third reversal of the preceding 13-week move. Apply a symmetrical stop-loss. Close the position at the profit target or stop-loss. Otherwise close the position after 13 weeks. * For more details please see the European Investment Strategy Special Report “Fractals, Liquidity & A Trading Model,” dated December 11, 2014, available at eis.bcaresearch.com. Fractal Trading System Cyclical Recommendations Structural Recommendations Closed Fractal Trades Trades Closed Trades Asset Performance Currency & Bond Equity Sector Country Equity Indicators Bond Yields Chart II-1Indicators To Watch - Bond Yields
Indicators To Watch - Bond Yields
Indicators To Watch - Bond Yields
Chart II-2Indicators To Watch - Bond Yields
Indicators To Watch - Bond Yields
Indicators To Watch - Bond Yields
Chart II-3Indicators To Watch - Bond Yields
Indicators To Watch - Bond Yields
Indicators To Watch - Bond Yields
Chart II-4Indicators To Watch - Bond Yields
Indicators To Watch - Bond Yields
Indicators To Watch - Bond Yields
Interest Rate Chart II-5Indicators To Watch - Interest Rate Expectations
Indicators To Watch - Interest Rate Expectations
Indicators To Watch - Interest Rate Expectations
Chart II-6Indicators To Watch - Interest Rate Expectations
Indicators To Watch - Interest Rate Expectations
Indicators To Watch - Interest Rate Expectations
Chart II-7Indicators To Watch - Interest Rate Expectations
Indicators To Watch - Interest Rate Expectations
Indicators To Watch - Interest Rate Expectations
Chart II-8Indicators To Watch - Interest Rate Expectations
Indicators To Watch - Interest Rate Expectations
Indicators To Watch - Interest Rate Expectations
BCA Research's European Investment Strategy service concludes that while the pandemic remains in play, the European stock market will struggle to outperform the US stock market. To understand what has been happening in the stock market this year, you don’t…
Between October 2018 and May 2020, the US-German 10-year yield spread narrowed by 155 bps. This decline mostly reflected a faster fall in US yields than German ones. Since early May 2020, the spread has narrowed a further 14bps. This time, while US yields…
Highlights US Dollar: The overvalued US dollar is finally cracking under the weight of aggressive Fed policy reflation and non-US growth outperformance coming out of the COVID-19 recession. The US dollar weakness has more room to run, forcing investors to reconsider bond allocation and currency hedging decisions in multi-currency portfolios. Currency-Hedged Bond Yields: For USD-based investors, US Treasuries still offer enough yield such that currency-hedged non-US government bond yields remain less appealing in most countries. The notable exceptions are Germany, France, the UK, Sweden and Japan, where both unhedged and USD-hedged yields are below comparable US yields – stay underweight those sovereign markets versus the US in USD-hedged portfolios. Currency-Hedged Corporates: For corporate bonds, both US high-yield and investment grade offer more attractive yields, in both USD and euros, relative to euro area equivalents. Stay overweight US corporates versus the euro area in USD-hedged and EUR-hedged portfolios. Feature Chart of the WeekStart Hedging USD Exposure?
Start Hedging USD Exposure
Start Hedging USD Exposure
The mighty US dollar (USD), which had remained impervious to plunging US interest rates and surging US COVID-19 cases, is finally breaking down. The DXY index of major developed economy currencies is down -3% so far in 2020, and nearly -10% from the peak seen in March during the worst of the COVID-19 global market rout. Other forms of currency, like precious metals and even Bitcoin, are also surging with the price of gold hitting a new all-time high yesterday. A new USD bear market would represent a major change to the global economic and investment landscape, affecting global economic growth, inflation, corporate profitability and capital flows. We will cover these topics in more detail in the coming weeks and months with the USD entering what appears to be a sustainable bearish trend. In this report, however, we tackle the most basic question for global fixed income investors in light of the new weakening trend for the USD – what to do with non-US bond holdings, and currency hedges, after nearly a decade of generating outperformance by hedging non-US currencies into USD (Chart of the Week). Say Farewell To The USD Bull Market Chart 2These Currencies Have Clearly Broken Out
These Currencies Have Clearly Broken Out
These Currencies Have Clearly Broken Out
The latest breakdown of the USD has been broad-based across the developed market currencies, although some currencies have been faring much better. The biggest moves versus the USD have been for majors like the euro, Australian dollar and Swiss franc, all of which have clearly broken out above their 200-day moving averages (Chart 2). In fact, the 200-day moving averages for those currencies are now moving higher, indicating that the new medium-term trend for those pairs is appreciation versus the USD. Other important currencies like the British pound, Canadian dollar and Japanese yen have gained ground versus the USD, but at a much slower pace (Chart 3). This reflects some of the unique issues within those economies (ongoing Brexit uncertainty in the UK, the pause in the oil price rally in Canada and flailing growth in Japan). Yet even the Chinese yuan, heavily managed by Chinese policymakers, has seen some mild upward pressure versus the greenback (bottom panel). The USD is clearly a currency that wants to weaken further, with the decline broadening in terms of the number of currencies now rising versus the USD. There are numerous reasons why this is happening now and is likely to continue doing so in the months ahead: The USD is clearly a currency that wants to weaken further, with the decline broadening in terms of the number of currencies now rising versus the USD. The Fed’s aggressive rate cuts earlier this year – and even dating back to the 75bps of easing delivered in 2019 – have dramatically reduced the robust interest rate differentials that had previously boosted the USD and attracted global capital flows into the currency (Chart 4). This is true for both nominal and inflation-adjusted real yields. Chart 3These Currencies Are On The Cusp Of Breaking Out
These Currencies Are On The Cusp Of Breaking Out
These Currencies Are On The Cusp Of Breaking Out
Chart 4Low US Rates + Better Non-US Growth = A Weaker USD
Low US Rates + Better Non-US Growth = A Weaker USD
Low US Rates + Better Non-US Growth = A Weaker USD
Chart 5Does The USD Require A COVID-19 Risk Premium?
Does The USD Require A COVID-19 Risk Premium?
Does The USD Require A COVID-19 Risk Premium?
Chart 6Relative QE Trends Are USD-Negative
Relative QE Trends Are USD-Negative
Relative QE Trends Are USD-Negative
Chart 7The USD Is No Longer A High Carry Currency
The USD Is No Longer A High Carry Currency
The USD Is No Longer A High Carry Currency
Economic growth has been rebounding from the COVID-19 shock faster outside the US. The latest round of manufacturing purchasing managers’ index (PMI) data for July published last week showed significant monthly increases in the euro area, the UK and even Japan, with only a modest pickup in the US. This boosted the spread between the US and non-US manufacturing PMI, which correlates strongly to the price momentum of the US dollar, to the highest level in nearly three years (bottom panel). The surge in new COVID-19 cases in the southern US states represents a dramatic divergence with the lower number of cases in Europe and other developed countries (Chart 5). While there are some renewed flare-ups of the virus in places like Spain and Japan, the numbers pale in comparison to the explosion of new US cases. With the most affected areas in the US already reestablishing restrictions on economic activity, the gap between US and non-US growth seen in the PMI data is likely to widen in a USD-bearish direction. The Fed has been more aggressive in the expansion of its balance sheet compared to other major central banks like the ECB and Bank of Japan. While not a perfect indicator, the ratio of the Fed’s balance sheet to that of other central banks did coincide with the broad directional moves in the USD during the Fed’s “QE-era” after the 2008 financial crisis (Chart 6). We may be entering another such period, but with a lower impact as many other central banks are also aggressively expanding their balance sheets through asset purchases. Summing it all up, it is clear that the US weakness has further to run over the next few months - and perhaps longer with the Fed promising the keep the funds rate near 0% until the end of 2022. This fundamentally alters bond investing, and currency hedging, considerations, as the carry earned by being long US dollars is now far less attractive than has been the case over the past few years (Chart 7). In the current environment of microscopic global government bond yields, currency fluctuations will dominate the relative return performance between individual countries. Bottom Line: The overvalued US dollar is finally cracking under the weight of aggressive Fed policy reflation and non-US growth outperformance coming out of the COVID-19 recession. The US dollar weakness has more room to run, forcing investors to reconsider bond allocation and currency hedging decisions in multi-currency portfolios. Where Are The Most Attractive Yields Now For USD-Based Investors? Chart 8Puny Bond Yields Across The Developed Markets
Puny Bond Yields Across The Developed Markets
Puny Bond Yields Across The Developed Markets
In the current environment of microscopic global government bond yields, currency fluctuations will dominate the relative return performance between individual countries. That makes the decisions on bond allocation at the country level more challenging, as the relative yields on offer represent a tiny proportion of a bond’s overall return on a currency-unhedged basis. For example, a 30-year US Treasury currently yields 1.25%, while a 30-year German government bond yields -0.08% (Chart 8). While the decision to hold the US Treasury over the German bond should be obvious given that 133bp (annualized) yield differential, the -4.6% decline in EUR/USD seen so far in the month of July alone has already swamped the additional income earned by owning the US Treasury. This example shows why the decision to actively take, or hedge, the currency exposure of a foreign bond relative to a domestic equivalent so important for any global fixed income investor. For someone whose base currency is entering a depreciation trend, like the USD, the currency decision becomes critical – in fact, it is the ONLY decision that matters for the expected return on any unhedged bond allocation. A proper “apples for apples” comparison of the relative attractiveness of yields in different countries, however, needs to be done after adjusting for cost of currency hedging. On that basis, US fixed income assets still look relatively attractive, even in a USD bear market. In Tables 1-4, we present developed market government bond yields across different maturity points (2-year, 5-year, 10-year and 30-year) for twelve countries. In each table, we show the current yield in local currency terms, while also showing the yield hedged into six different currencies (USD, EUR, GBP, JPY, CAD, AUD). We calculate the gain/cost of hedging using the ratio of current spot exchange rates and 3-month forward exchange rates. That is an all-in cost of hedging that includes both short-term interest rate differentials and the additional currency funding costs determined by cross-currency basis swaps. Table 1Currency-Hedged 2-Year Government Bond Yields
What A Weaker US Dollar Means For Global Bond Investors
What A Weaker US Dollar Means For Global Bond Investors
Table 2Currency-Hedged 5-Year Government Bond Yields
What A Weaker US Dollar Means For Global Bond Investors
What A Weaker US Dollar Means For Global Bond Investors
Table 3Currency-Hedged 10-Year Government Bond Yields
What A Weaker US Dollar Means For Global Bond Investors
What A Weaker US Dollar Means For Global Bond Investors
Table 4Currency-Hedged 30-Year Government Bond Yields
What A Weaker US Dollar Means For Global Bond Investors
What A Weaker US Dollar Means For Global Bond Investors
Using the example of the 30-year US and German bonds described earlier, that 30-year German yield of -0.08%, hedged into USD, has an all-in yield of +0.74%. This is still well below the 30-year US Treasury yield of 1.25%. Thus, that 30-year EUR-denominated German bond is unattractive compared to the USD-denominated US Treasury, after converting the German bond to a USD-equivalent security through hedging. That relationship holds even if we were to hedge the Treasury into euros. As can be seen in Table 4, the 30-year US Treasury has a EUR-hedged yield of +0.48%, 56bps above the EUR-denominated 30-year German bond yield. Therefore, while owning the US Treasury seems like the riskier bet on an unhedged basis now with the EUR/USD appreciating rapidly, the US bond is the superior yielding bet once currency risk is hedged away. Right now, Italy, Spain and Australia offer the highest yields both in unhedged and USD-hedged terms for most maturities. For those that prefer charts over numbers, much of the data in Tables 1-4 is shown as static snapshots of government bond yields curves in Chart 9 (for local currency, or unhedged, yield curves), while Chart 10 shows all yields hedged into USD. The charts show that there appear to be far more interesting relative value opportunities across countries at varying yield maturities now, but those gaps become smaller after hedging non-US bonds into USD. Chart 9Currency-Unhedged Global Government Bond Yield Curves
What A Weaker US Dollar Means For Global Bond Investors
What A Weaker US Dollar Means For Global Bond Investors
Chart 10USD-Hedged Global Government Bond Yield Curves
What A Weaker US Dollar Means For Global Bond Investors
What A Weaker US Dollar Means For Global Bond Investors
Right now, Italy, Spain and Australia offer the highest yields both in unhedged and USD-hedged terms for most maturities, making those bonds interesting to USD-based investors that choose to either take or hedge the EUR and AUD exposure of those bonds. In Tables 5-8, we take the yield data from the previous tables and show the hedged yields as spreads to the “base yield” of each currency, which is the government bond yield for that country. For example, in Table 3, we can see that for all countries shown, the 10-year yield hedged into GBP terms produces a yield that is above that of the 10-year UK Gilt. This is true even or negative yielding German bunds and Japanese government bonds. Thus, looking purely from a yield perspective, currency-hedged non-UK government bonds look very attractive to a UK bond investor with GBP as the base currency. Table 5Currency-Hedged 2-Year Govt. Bond Yields Spreads Within The "G-6"
What A Weaker US Dollar Means For Global Bond Investors
What A Weaker US Dollar Means For Global Bond Investors
Table 6Currency-Hedged 5-Year Govt. Bond Yields Spreads Within The "G-6"
What A Weaker US Dollar Means For Global Bond Investors
What A Weaker US Dollar Means For Global Bond Investors
Table 7Currency-Hedged 10-Year Govt. Bond Yields Spreads Within The "G-6"
What A Weaker US Dollar Means For Global Bond Investors
What A Weaker US Dollar Means For Global Bond Investors
Table 8Currency-Hedged 30-Year Govt. Bond Yields Spreads Within The "G-6"
What A Weaker US Dollar Means For Global Bond Investors
What A Weaker US Dollar Means For Global Bond Investors
Chart 11Global Spread Product Yields Are Low
Global Spread Product Yields Are Low
Global Spread Product Yields Are Low
We can try the same analysis above for global spread products like corporate debt. Currency returns still matter for the returns on these assets, but less so given the higher outright yields offered compared to government bonds. Yields are relatively low across investment grade credit, junk bonds, mortgage-backed securities and emerging market debt after the massive rallies seen since March, but remain much higher than the sub-1% levels seen in most of the developed market government bond universe (Chart 11). In Table 9, we show the index yield (using Bloomberg Barclays indices) in both unhedged and currency-hedged terms for the main global credit sectors we include in our model bond portfolio universe. The index yields do not change that much after currency hedging costs are included, but there are some notable differences between corporate bonds of similar credit quality in the US and euro area. Table 9Currency-Hedged Spread Product Yields
What A Weaker US Dollar Means For Global Bond Investors
What A Weaker US Dollar Means For Global Bond Investors
Specifically, for both investment grade and high-yield corporate credit, the yield in the US is higher than that seen in the euro area. This is true for both USD-hedged and EUR-hedged terms, thus making US corporates more attractive simply from a yield perspective without factoring in credit quality. Currency-hedged non-UK government bonds look very attractive to a UK bond investor with GBP as the base currency. Looking within the high-yield universe by credit tiers, US yields are higher than euro area equivalents for Ba-rated bonds, while euro area yields are slightly higher for B-rated debt (Chart 12). Yields on lower-quality Caa-rated debt are similar, both for US yields hedged into euros and vice versa. Chart 12No Major Differences In US & Euro Area Junk Yields
What A Weaker US Dollar Means For Global Bond Investors
What A Weaker US Dollar Means For Global Bond Investors
Within investment grade, there is no contest with US yields higher than euro area equivalents across all credit tiers (Chart 13). Chart 13US IG Yields Are More Attractive Than Euro Area IG (in USD & EUR)
What A Weaker US Dollar Means For Global Bond Investors
What A Weaker US Dollar Means For Global Bond Investors
Summing it all up, the new trend towards USD weakness has not altered much of the relative attractiveness of US fixed income assets on a currency-hedged basis for USD-based investors. This is true even after the sharp fall in US bond yields since March. Bottom Line: In Germany, France, the UK, Sweden and Japan, both unhedged and USD-hedged government bond yields are below comparable US Treasury yields – underweight those sovereign markets versus the US in USD-hedged portfolios. For corporate bonds, both US high-yield and investment grade offer more attractive yields, in both USD and euros, relative to euro area equivalents. Stay overweight US corporates versus the euro area in USD-hedged and EUR-hedged portfolios. Robert Robis, CFA Chief Fixed Income Strategist rrobis@bcaresearch.com Recommendations The GFIS Recommended Portfolio Vs. The Custom Benchmark Index
What A Weaker US Dollar Means For Global Bond Investors
What A Weaker US Dollar Means For Global Bond Investors
Duration Regional Allocation Spread Product Tactical Trades Yields & Returns Global Bond Yields Historical Returns
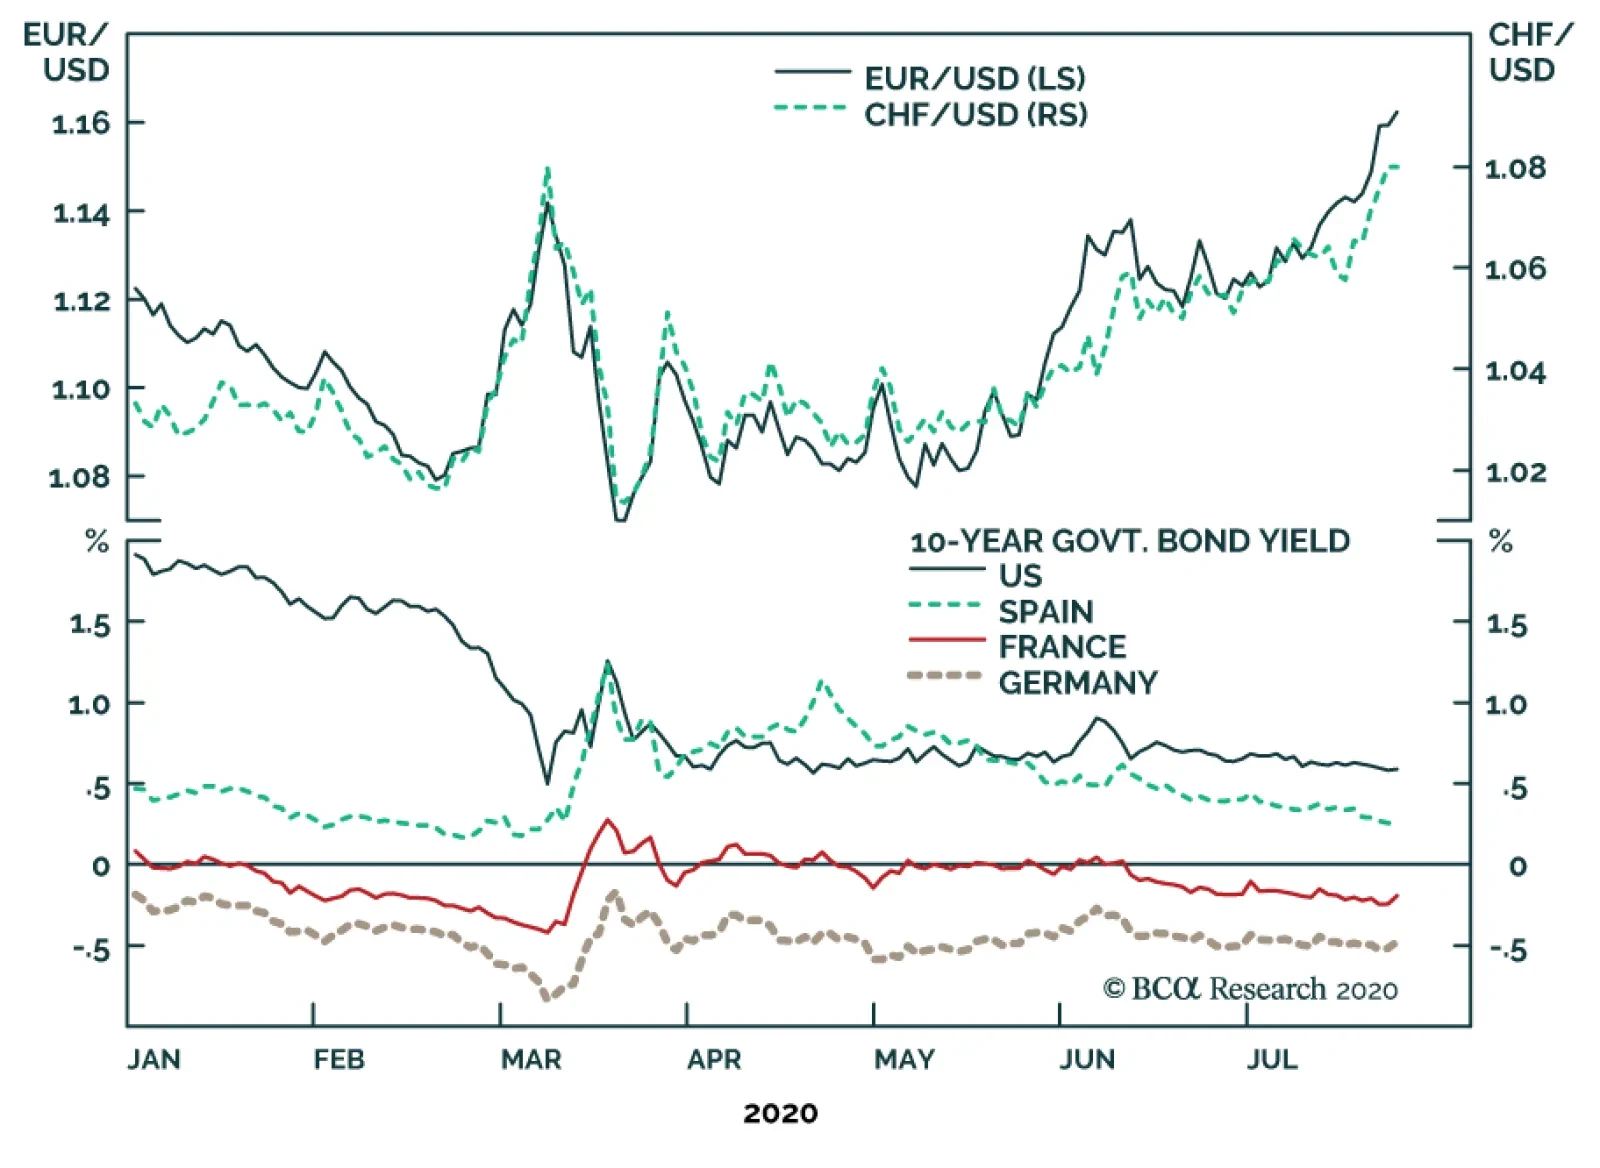
BCA Research's European Investment Strategy service recommends that investors play good news in Europe by remaining long EUR, CHF, and SEK versus USD, and long US T-bonds and Spanish Bonos versus German Bunds and French OATs. Things have been going right…
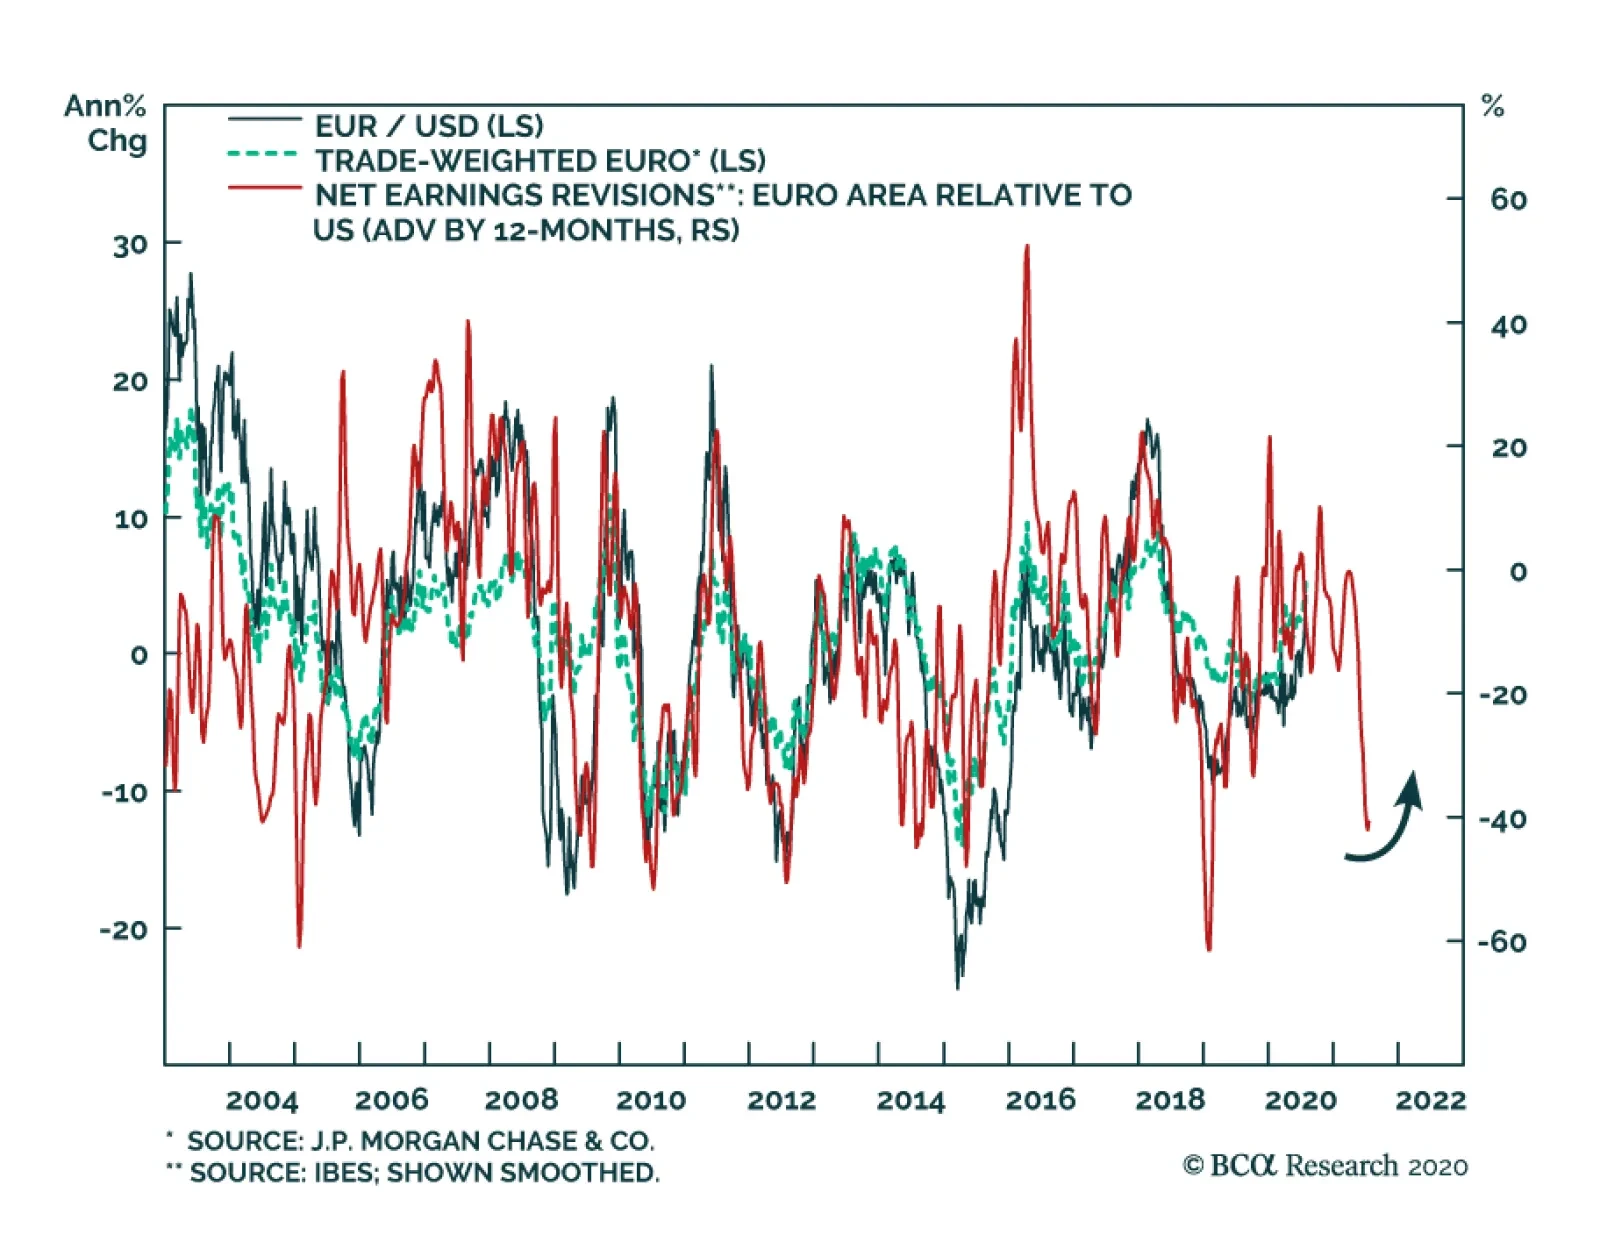
BCA Research's Foreign Exchange Strategy service concludes that the euro has more upside on a cyclical basis. As a relatively closed economy, the US has tended to have a higher services component to GDP. However, the service sector has been hit much harder…
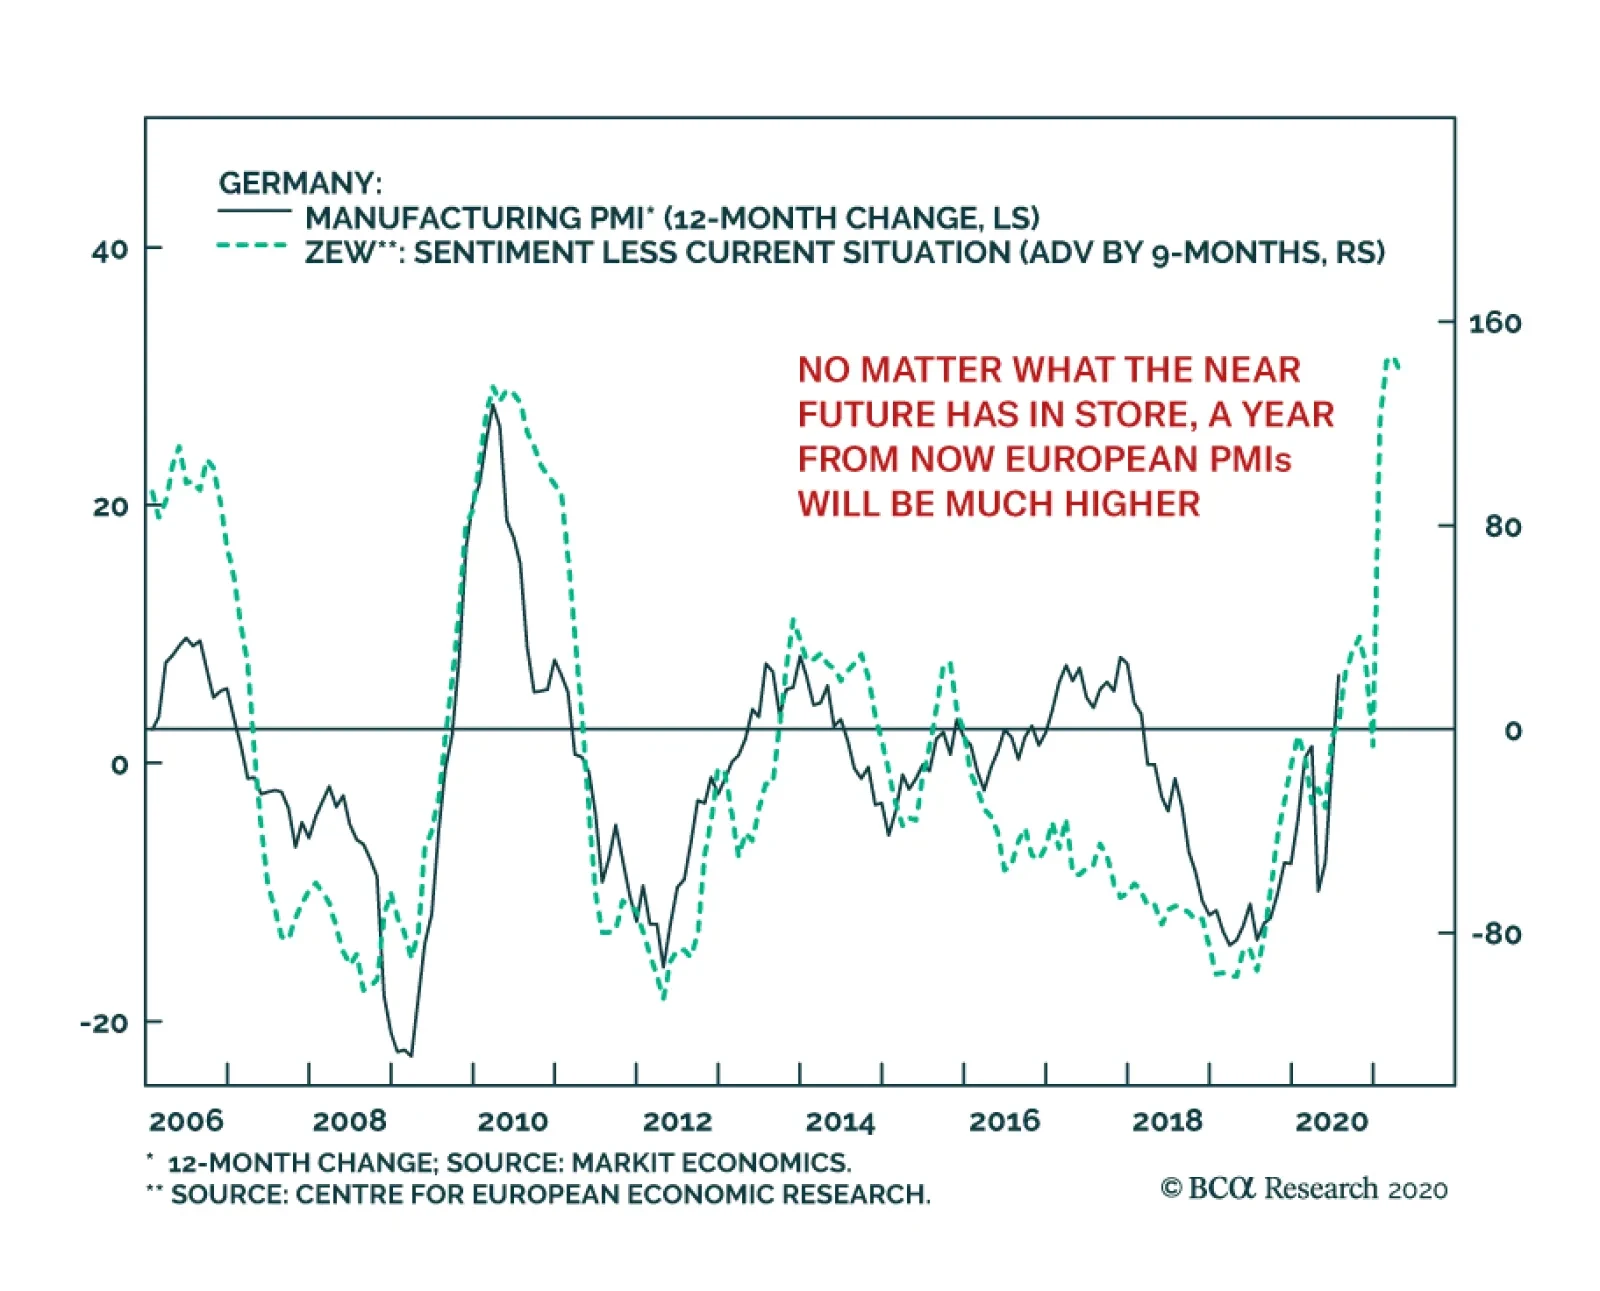
Last Friday, the European PMIs delivered a nice surprise for July. For the Eurozone, the Manufacturing index rebounded to 51.1 from 47.3, beating expectations of 50.1. The Services index bounced back to 55.1 from 48.3, handily outpacing the expected 51.0.…