Europe
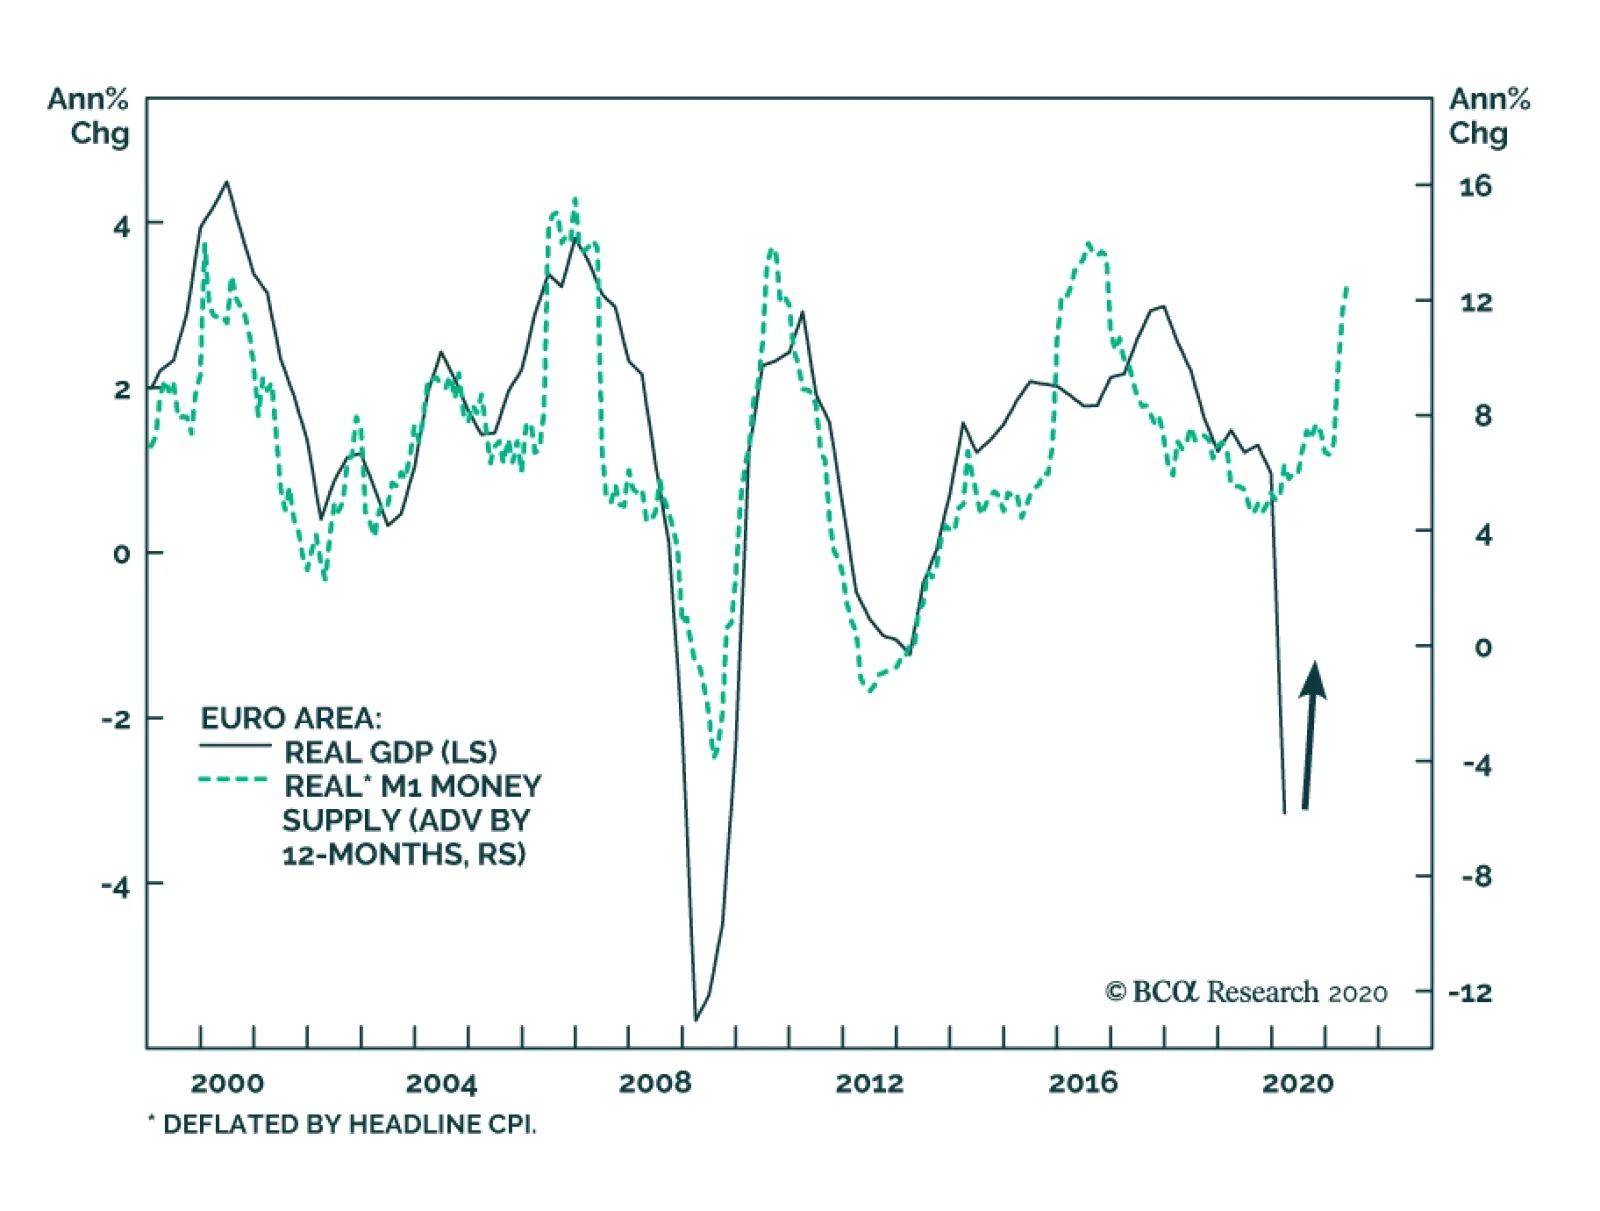
In May, the European M3 money supply growth accelerated to 8.9% from 8.3%. Broad money growth is slower in Europe than in the US, but bank intermediation plays a larger role in the allocation of credit in the Eurozone than it does in the US. As a result,…

Highlights The economic performance of Sweden, which did not have a lockdown, has been almost as bad as Denmark, which did have a lockdown. This proves that the current recession is not ‘man-made’, it is ‘pandemic-made’. While the pandemic remains in play, investors should maintain a defensive bias to their portfolios: favouring US T-bonds in bond portfolios, and technology and healthcare in equity portfolios. The technology sector has become defensive, largely because it has flipped from hardware dominance to software dominance. A new recommendation is to overweight technology-heavy Netherlands. Fractal trade: short AUD/CHF. Feature Chart I-IASweden: Avoiding A Lockdown Did Not Prevent A Slump In Consumption...
Sweden: Avoiding A Lockdown Did Not Prevent A Slump In Consumption...
Sweden: Avoiding A Lockdown Did Not Prevent A Slump In Consumption...
Chart I-1B...But Led To Many More ##br##Infections
...But Led To Many More Infections
...But Led To Many More Infections
Sweden and Denmark are neighbours. They speak near-identical languages and share a broadly similar culture and demographic. Yet the two countries have followed completely different strategies to halt the coronavirus pandemic. Sweden chose not to impose a lockdown. Instead, it opted for a ‘trust based’ approach, relying on its citizens to act sensibly and appropriately. Whereas Denmark imposed one of Europe’s earliest and most draconian lockdowns. The contrasting approaches of Sweden and neighbouring Denmark provide us with the closest thing to a controlled experiment on pandemic strategies. The Recession Is Not ‘Man-Made’, It Is ‘Pandemic-Made’ The surprising thing is that the economic performance of Sweden, which did not have a lockdown, has been almost as bad as Denmark, which did. This year, the unemployment rates in both economies have surged by 2 percentage points (albeit the latest data is for May in Sweden and April in Denmark). Furthermore, high-frequency measures of consumption show that Sweden suffered almost as severe a contraction as Denmark (Chart of the Week and Chart I-2). Chart I-2Unemployment Has Surged In Both No-Lockdown Sweden And Lockdown Denmark
Unemployment Has Surged In Both No-Lockdown Sweden And Lockdown Denmark
Unemployment Has Surged In Both No-Lockdown Sweden And Lockdown Denmark
This surprising result challenges the popular view that this global recession is man-made. This view argues that without the government-imposed lockdowns, the global economy would not have entered a tailspin. But if this view is right, then why did consumption crash in Sweden? The simple answer is that in a pandemic, most people will change their behaviour to avoid catching the virus. The cautious behaviour is voluntary, irrespective of whether there is no lockdown, as in Sweden, or there is a lockdown, as in Denmark. People will shun public transport, shopping, and other crowded places, and even think twice about letting their children go to school. In a pandemic, the majority of people will change their behaviour even without a lockdown. But if the cautious behaviour is voluntary, then why impose a lockdown? The answer is that without a lockdown, the majority will behave sensibly to avoid catching the virus, but a minority will take a ‘devil may care’ attitude. In the pandemic, this is critical because less than 10 percent of infected people are responsible for creating 90 percent of all coronavirus infections. If this tiny minority of so-called ‘super-spreaders’ is left unchecked, then the pandemic will let rip. All of which brings us back to Sweden versus Denmark. As a result of not imposing a mandatory lockdown to rein in its super-spreaders, Sweden now has one of the world’s worst coronavirus infection and mortality rates, four times higher than Denmark (Chart I-3, Chart I-4, Chart I-5). Chart I-3No-Lockdown Sweden Has Suffered Many More Deaths Than Lockdown Denmark
No-Lockdown Sweden Has Suffered Many More Deaths Than Lockdown Denmark
No-Lockdown Sweden Has Suffered Many More Deaths Than Lockdown Denmark
Chart I-4Avoiding A Lockdown Meant More Infections…
Who’s Right On The Pandemic – Sweden Or Denmark?
Who’s Right On The Pandemic – Sweden Or Denmark?
Chart I-5…And More ##br##Deaths
Who’s Right On The Pandemic – Sweden Or Denmark?
Who’s Right On The Pandemic – Sweden Or Denmark?
Put simply, containing the pandemic depends on reining in a minority of super-spreaders. Which explains why no-lockdown Sweden suffered a much worse outbreak of the disease than lockdown Denmark. In contrast, the economy depends on the behaviour of the majority. In a pandemic the majority will voluntarily exercise caution. Which explains why no-lockdown Sweden and lockdown Denmark suffered similar contractions in consumption. Looking ahead, will the widespread adoption of face masks and plexiglass screens change the public’s cautious behaviour? To a certain extent, yes – it will permit essential activities and let people take calculated risks. That said, if you are forced to wear a mask on public transport and in the shops, and you have to spread out in restaurants while being served by a masked waiter, then – rightly or wrongly – you are getting a strong signal: the danger is still out there. Meaning that many people will continue to shun discretionary activities and spending. The upshot is that while the pandemic remains in play, investors should maintain a defensive bias to their portfolios. Explaining Why Technology Is Now Defensive A defensive bias to your portfolio now requires an exposure to technology – because in 2020 the tech sector is behaving like a classic defensive. Its relative performance is correlating positively with the bond price, like other classic defensive sectors such as healthcare (Chart I-6 and Chart I-7). Chart I-6In 2020, Tech Is Behaving Like A Defensive...
In 2020, Tech Is Behaving Like A Defensive...
In 2020, Tech Is Behaving Like A Defensive...
Chart I-7...Like Healthcare
...Like Healthcare
...Like Healthcare
The behaviour of the technology sector in the current recession contrasts with its performance in the global financial crisis of 2008. Back then, it behaved like a classic cyclical – its relative performance correlated negatively with the bond price (Chart I-8). Begging the question: why has the tech sector’s behaviour flipped from cyclical to defensive? Chart I-8In 2008, Tech Behaved Like A Cyclical
In 2008, Tech Behaved Like A Cyclical
In 2008, Tech Behaved Like A Cyclical
The main reason is that the tech sector’s composition has flipped from hardware dominance to software dominance. In 2008, the sector market cap had a 65:35 tilt to technology hardware. But today, it is the mirror-image: a 65:35 tilt to computer and software services (Chart I-9). Chart I-9Tech Is More Defensive Now Because It Is Dominated By Software
Tech Is More Defensive Now Because It Is Dominated By Software
Tech Is More Defensive Now Because It Is Dominated By Software
Computer and software services have many defensive characteristics suited to the current environment: For many companies, enterprise software is now business critical. It is a must-have rather than a like-to-have. Computer and software services use a subscription-based revenue model, minimising the dependency on discretionary spending. Computer and software services are helping firms to cut costs through automation and back-office efficiencies as well as facilitating the boom in ‘working from home’. The sector is cash rich. Despite these defensive characteristics, there remains a lingering worry: is the tech sector overvalued? The Rally In Growth Defensives Is Not A Mania Some people fear that the recent run-up in stock markets does not make sense, other than as a ‘Robin Hood’ day-trader fuelled mania. After all, the pandemic is still very much in play, and so are other geopolitical risks, so how can some stock prices be near all-time highs? Yet the recent run-up in growth defensives such as tech and healthcare does make sense. Their valuations have moved in near-perfect lockstep with the bond yield, implying that the rally is based on fundamentals (Chart I-10). Chart I-10Tech And Healthcare Valuations Are Tracking The Bond Yield
Tech And Healthcare Valuations Are Tracking The Bond Yield
Tech And Healthcare Valuations Are Tracking The Bond Yield
Simply put, if the 10-year T-bond is going to deliver a pitiful 0.7 percent a year over the next decade, then the prospective return from growth defensives must also compress. It would be absurd to expect these stocks to be priced for high single digit returns. Since late 2018, the decline in growth defensives’ forward earnings yield has broadly tracked the 250bps decline in the 10-year T-bond yield. Given that the forward earnings yield correlates well with the 10-year prospective return, the depressed bond yield is depressing the prospective return from growth defensives – as it should. Tech and healthcare valuations have moved in near-perfect lockstep with the bond yield. But with the pandemic and geopolitical risks menacing in the background, shouldn’t the gap between the prospective return on stocks and bonds – the equity risk premium – be larger? This is open to debate. When bond yields approach the lower bound, the appeal of owning bonds also diminishes because bond prices have limited upside. Nevertheless, the gap between the tech and healthcare forward earnings yield and the bond yield has gone up this year and is much larger than in 2018 (Chart I-11). This suggests that valuations are taking some account of the pandemic and other risks. Moreover, in a longer-term perspective the current gap between the tech and healthcare forward earnings yield and the bond yield, at +4 percent, hardly indicates a mania. In the true mania of 2000, the gap stood at -4 percent! (Chart I-12) Chart I-11The Equity Risk Premium Has Risen In 2020
The Equity Risk Premium Has Risen In 2020
The Equity Risk Premium Has Risen In 2020
Chart I-12Tech And Health Care Valuations Are Not In A Mania
Tech And Health Care Valuations Are Not In A Mania
Tech And Health Care Valuations Are Not In A Mania
In summary, until the pandemic is conquered, investors should maintain a defensive bias to their portfolios. Bond investors should overweight US T-bonds versus core European bonds. Equity investors should overweight the growth defensives, technology and healthcare, which implies overweighting the technology-heavy US versus Europe. A new recommendation is to overweight technology-heavy Netherlands. Stay overweight healthcare-heavy Switzerland, and bank-light France and Germany (albeit expect a technical 5 percent underperformance of Germany versus the UK in the coming weeks). And stay underweight bank-heavy Austria. Fractal Trading System* The AUD is technically overbought and vulnerable to a tactical reversal. Accordingly, this week’s recommended trade is short AUD/CHF, with a profit target and symmetrical stop-loss set at 4.2 percent. The rolling 1-year win ratio now stands at 63 percent. Chart I-13AUD/CHF
AUD/CHF
AUD/CHF
When the fractal dimension approaches the lower limit after an investment has been in an established trend it is a potential trigger for a liquidity-triggered trend reversal. Therefore, open a countertrend position. The profit target is a one-third reversal of the preceding 13-week move. Apply a symmetrical stop-loss. Close the position at the profit target or stop-loss. Otherwise close the position after 13 weeks. * For more details please see the European Investment Strategy Special Report “Fractals, Liquidity & A Trading Model,” dated December 11, 2014, available at eis.bcaresearch.com. Dhaval Joshi Chief European Investment Strategist dhaval@bcaresearch.com Fractal Trading System Cyclical Recommendations Structural Recommendations Closed Fractal Trades Trades Closed Trades Asset Performance Currency & Bond Equity Sector Country Equity Indicators Bond Yields Chart II-1Indicators To Watch - Bond Yields
Indicators To Watch - Bond Yields
Indicators To Watch - Bond Yields
Chart II-2Indicators To Watch - Bond Yields
Indicators To Watch - Bond Yields
Indicators To Watch - Bond Yields
Chart II-3Indicators To Watch - Bond Yields
Indicators To Watch - Bond Yields
Indicators To Watch - Bond Yields
Chart II-4Indicators To Watch - Bond Yields
Indicators To Watch - Bond Yields
Indicators To Watch - Bond Yields
Interest Rate Chart II-5Indicators To Watch - Interest Rate Expectations
Indicators To Watch - Interest Rate Expectations
Indicators To Watch - Interest Rate Expectations
Chart II-6Indicators To Watch - Interest Rate Expectations
Indicators To Watch - Interest Rate Expectations
Indicators To Watch - Interest Rate Expectations
Chart II-7Indicators To Watch - Interest Rate Expectations
Indicators To Watch - Interest Rate Expectations
Indicators To Watch - Interest Rate Expectations
Chart II-8Indicators To Watch - Interest Rate Expectations
Indicators To Watch - Interest Rate Expectations
Indicators To Watch - Interest Rate Expectations
Highlights Economic shocks in recent decades have led to surges in nationalism and the COVID-19 crisis is unlikely to be different. Nationalism adds to the structural challenges facing globalization, which is already in retreat. Investors face at least a 35% chance that President Trump will be reelected and energize a nationalist and protectionist agenda that is globally disruptive. China is also indulging in nationalism as trend growth slows, raising the probability of a clash with the US even if Trump does not win. US-China economic decoupling will present opportunities as well as risks – primarily for India and Southeast Asia. Feature Since the Great Recession, investors have watched the US dollar and US equities outperform their peers in the face of a destabilizing world order (Chart II-1). Chart II-1US Outperformance Amid Global Disorder
US Outperformance Amid Global Disorder
US Outperformance Amid Global Disorder
Global and American economic policy uncertainty has surged to the highest levels on record. Investors face political and geopolitical power struggles, trade wars, a global pandemic and recession, and social unrest. How will these risks shape up in the wake of COVID-19? First, massive monetary and fiscal stimulus ensure a global recovery but they also remove some of the economic limitations on countries that are witnessing a surge in nationalism. Second, nationalism creates a precarious environment for globalization – namely the wave of “hyper-globalization” since 2000. Nationalism and de-globalization do not depend on the United States alone but rather have shifted to the East, which means that geopolitical risks will remain elevated even if the US presidential election sees a restoration of the more dovish Democratic Party. Economic Shocks Fuel Nationalism’s Revival Nationalism is the idea that the political state should be made up of a single ethnic or cultural community. While many disasters have resulted from this idea, it is responsible for the modern nation-state and it has enabled democracies to take shape across Europe, the Americas, and beyond. Industrialization is also more feasible under nationalism because cultural conformity helps labor competitiveness.1 At the end of the Cold War, transnational communist ideology collapsed and democratic liberalism grew complacent. Each successive economic shock or major crisis has led to a surge in nationalism to fill the ideological gaps that were exposed. Chart II-2The Resurgence Of Russian Nationalism
July 2020
July 2020
Chart II-3USA: From Nationalism To Anti-Nationalism
July 2020
July 2020
For instance, various nationalists and populists emerged from the financial crises of the late 1990s. Russian President Vladimir Putin sought to restore Russia to greatness in its own and other peoples’ eyes (Chart II-2). Not every Russian adventure has mattered for investors, but taken together they have undermined the stability of the global system and raised barriers to exchange. The invasion of Crimea in 2014 and the interference in the US election in 2016 helped to fuel the rise in policy uncertainty, risk premiums in Russian assets, and safe havens over the past decade. The September 11, 2001 terrorist attacks in the United States created a surge in American nationalism (Chart II-3). This surge has since collapsed, but while it lasted the US destabilized the Middle East and provided Russia and China with the opportunity to pursue a nationalist path of their own. Investors who went long oil and short the US dollar at this time could have done worse. The 2008 crisis spawned new waves of nationalist feeling in countries such as China, Japan, the UK, and India (Chart II-4). Conservatives of the majority cultural group rose to power, including in China, where provincial grassroots members of the elite reasserted the Communist Party’s centrality. Japan and India became excellent equity investment opportunities in their respective spheres, while the UK and China saw their currencies weaken. The rising number of wars and conflicts across the world since 2008 reflects the shift toward nationalism, whether among minority groups seeking autonomy or nation-states seeking living space (Chart II-5). Chart II-4Nationalist Trends Since The Great Recession
July 2020
July 2020
Chart II-5World Conflicts Rise After Major Crises
July 2020
July 2020
COVID-19 is the latest economic shock that will feed a new round of nationalism. At least 750 million people are extremely vulnerable across the world, mostly concentrated in the shatter belt from Libya to Turkey, Iran, Pakistan, and India.2 Instability will generate emigration and conflict. Once again the global oil supply will be at risk from Middle Eastern instability and the dollar will eventually fall due to gargantuan budget and trade deficits. Today’s shock will differ, however, in the way it knocks against globalization, a process that has already begun to slow. Specifically, this crisis threatens to generate instability in East Asia – the workshop of the world – due to the strategic conflict between the US and China. This conflict will play out in the form of “proxy battles” in Greater China and the East Asian periphery. The dollar’s recent weakness is a telling sign of the future to come. In the short run, however, political and geopolitical risks are acute and will support safe havens. Globalization In Retreat Nationalism is not necessarily at odds with globalization. Historically there are many cases in which nationalism undergirds a foreign policy that favors trade and eschews military intervention. This is the default setting of maritime powers such as the British and Dutch. Prior to WWII it was the American setting, and after WWII it was the Japanese. Over the past thirty years, however, the rise of nationalism has generally worked against global trade, peace, and order. That’s because after WWII most of the world accepted internationalist ideals and institutions promoted by the United States that encouraged free markets and free trade. Serious challenges to that US-led system are necessarily challenges to global trade. This is true even if they originate in the United States. Globalization has occurred in waves continuously since the sixteenth century. It is not a light matter to suggest that it is experiencing a reversal. Yet the best historical evidence suggests that global imports, as a share of global output, have hit a major top (Chart II-6).3 The line in this chart will fall further in 2020. American household deleveraging, China’s secular slowdown, and the 2014 drop in oil and commodities have had a pervasive impact on the export contribution to global growth. Chart II-6Globalization Hits A Major Top
Globalization Hits A Major Top
Globalization Hits A Major Top
Chart II-7Both Goods And Services Face Headwinds
Both Goods And Services Face Headwinds
Both Goods And Services Face Headwinds
The next upswing of the business cycle will prompt an increase in trade in 2021. Global fiscal stimulus this year amounts to 8% of GDP and counting. But will the import-to-GDP ratio surpass previous highs? Probably not anytime soon. It is impossible to recreate America’s consumption boom and China’s production boom of the 1980s-2000s with public debt alone. Global trend growth is slowing. Isn’t globalization proceeding in services, if not goods? The world is more interconnected than ever, with nearly half of the population using the Internet – almost 30% in Sub-Saharan Africa. One in every two people uses a smartphone. Eventually the pandemic will be mitigated and global travel will resume. Nevertheless, the global services trade is also facing headwinds. And it requires even more political will to break down barriers for services than it does for goods (Chart II-7). The desire of nations to control and patrol cyberspace has resulted in separate Internets for authoritarian states like Russia and China. Even democracies are turning to censorship and content controls to protect their ideologies. Political demands to protect workers and industries are gaining ground. Policymakers in China and Russia have already shifted back toward import substitution; now the US and EU are joining them, at least when it comes to strategic sectors (health, defense). Nationalists and populists across the emerging world will follow their lead. Regional and wealth inequalities are driving populations to be more skeptical of globalization. GDP per capita has not grown as fast as GDP itself, a simple indication of how globalization does not benefit everyone equally even though it increases growth overall (Chart II-8). Inequality is a factor not only because of relatively well-off workers in the developed world who resent losing their job or earning less than their neighbors. Inequality is also rife in the developing world where opportunities to work, earn higher wages, borrow, enter markets, and innovate are lacking. Over the past decade, emerging countries like Brazil, Indonesia, Mexico, and South Africa have seen growing skepticism about whether foreign openness creates jobs or lifts wages.4 Immigration is probably the clearest indication of the break from globalization. The United States and especially the European Union have faced an influx of refugees and immigrants across their southern borders and have resorted to hard-nosed tactics to put a stop to it (Chart II-9). Chart II-8Global Inequality Fuels Protectionism
July 2020
July 2020
Chart II-9US And EU Crack Down On Immigration
July 2020
July 2020
There is zero chance that these tough tactics will come to an end anytime soon in Europe, where the political establishment has discovered a winning combination with voters by promoting European integration yet tightening control of borders. This combination has kept populists at bay in France, Italy, the Netherlands, Spain, and Germany. A degree of nationalism has been co-opted by the transnational European project. In the US, extreme polarization could cause a major change in immigration policy, depending on the election later this year. But note that the Obama administration was relatively hawkish on the border and the next president will face sky-high unemployment, which discourages flinging open the gates. Reduced immigration will weigh on potential GDP growth and drive up the wage bill for domestic corporations. If nationalism continues to rise and to hinder the movement of people, goods, capital, and ideas, then it will reduce the market’s expectations of future earnings. American Nationalism Still A Risk The United States is experiencing a “Civil War Lite” that may take anywhere from one-to-five years to resolve. The November 3 presidential election will have a major impact on the direction of nationalism and globalization over the coming presidential term. If President Trump is reelected – which we peg at 35% odds – then American nationalism and protectionism will gain a new lease on life. Other nations will follow the US’s lead. If Trump fails, then nationalism will likely be driven by external forces, but protectionism will persist in some form. Chart II-10Trump Is Not Yet Down For The Count
July 2020
July 2020
Investors should not write Trump off. If the election were held today, Trump would lose, but the election is still four months away. His national approval rating has troughed at a higher level than previous troughs. His disapproval rating has spiked but has not yet cleared its early 2019 peak (Chart II-10).5 This is despite an unprecedented deluge of bad news: universal condemnation from Democrats and the media, high-profile defections from fellow Republicans and cabinet members, stunning defeats at the Supreme Court, and scathing rebukes from top US army officers. If Trump’s odds are 35% then this translates to a 35% chance that the United States will continue pursuing globally disruptive “America First” foreign and trade policies in the 2020-24 period. First Trump will attempt to pass a Reciprocal Trade Act to equalize tariffs with all trading partners. Assuming Democrats block it in the House of Representatives, he will still have sweeping executive authority to levy tariffs. He will launch the next round in the trade war with China to secure a “Phase Two” trade deal, which will be tougher because it will be focused on structural reforms. He could also open new fronts against the European Union, Mexico, and other trade surplus countries. By contrast, these risks will melt away if Biden is elected. Biden would restore the Obama administration’s approach of trade favoritism toward strategic allies and partners, such as Europe and the members of the Trans-Pacific Partnership, but only occasional use of tariffs. Biden would work with international organizations like the World Trade Organization. His foreign policy would also open up trade with pariah states like Iran, reducing the tail-risk of a war to almost zero. Biden would be tougher on China than Presidents Obama or Bill Clinton, as the consensus in Washington is now hawkish and Biden would need to keep the blue-collar voters he won back from Trump. He may keep Trump’s tariffs in place as negotiating leverage. But he is less likely to expand these tariffs – and there is zero chance he will use them against Europe. At the same time, it will take a year or more to court the allies and put together a “coalition of the willing” to pressure China on structural reforms and liberalization. China would get a reprieve – and so would financial markets. Thus investors have a roughly 65% chance of seeing US policy “normalize” into an internationalist (not nationalist) approach that reduces the US contribution to trade policy uncertainty and geopolitical risk over the next few years at minimum. But there are still four months to go before the election; these odds can change, and equity market volatility will come first. Moreover a mellower US would still need to react to nationalism in Asia. European Nationalism Not A Risk (Yet) Chart II-11English Versus Scottish Nationalism
English Versus Scottish Nationalism
English Versus Scottish Nationalism
European nationalism has reemerged in recent years but has greatly disappointed the prophets of doom who expected it to lead to the breakup of the European Union. The southern European states suffered the most from COVID-19 but many of them have made their decision regarding nationalism and the supra-national EU. Greece underwent a depression yet remained in the union. Italians could easily elect the right-wing anti-establishment League to head a government in the not-too-distant future. But there is no appetite for an Italian exit. Brexit is the grand exception. If Trump wins, then the UK and British Prime Minister Boris Johnson will be seen as the vanguard of the revival of nationalism in the West. If Trump loses, English nationalism will appear an isolated case that is constrained by its own logic given the response of Scottish nationalism (Chart II-11). The trend in the British Isles would become increasingly remote from the trends in continental Europe and the United States. The majority of Europeans identify both as Europeans and as their home nationality, including majorities in countries like Greece, Italy, France, and Austria where visions of life outside the union are the most robust (Chart II-12). Even the Catalonians are focused on options other than independence, which has fallen to 36% support. Eastern European nationalists play a careful balancing game of posturing against Brussels yet never drifting so far as to let Russia devour them. Chart II-12European Nationalism Is Limited (For Now)
European Nationalism Is Limited (For Now)
European Nationalism Is Limited (For Now)
Europeans have embraced the EU as a multi-ethnic confederation that requires dual allegiances and prioritizes the European project. COVID-19 has so far reinforced this trend, showing solidarity as the predominant force, and much more promptly than during the 2011 crisis. It will take a different kind of crisis to reverse this trend of deeper integration. European nationalists would benefit from another economic crash, a new refugee wave from the Middle East, or conflict with Turkish nationalism. The latter is already burning brightly and will eventually flame out, but not before causing a regional crisis of some kind. European policymakers are containing nationalism by co-opting some of its demands. The EU is taking steps to guard against globalization, particularly on immigration and Chinese mercantilism. The lack of nationalist uprisings in Europe do not overthrow the contention that globalization is slowing down. Europe can become more integrated at home while maintaining the higher barriers against globalization that it has always maintained relative to the UK and United States. Chinese Nationalism The Biggest Risk The nationalist risk to globalization is most significant in East Asia and the Pacific, where Chinese nationalism continues the ascent that began with the Great Recession. China’s slowdown in growth rates has weakened the Communist Party’s confidence in the long-term viability of single-party rule. The result has been a shift in the party line to promote ideology and quality of life improvements to compensate for slower income gains. Xi Jinping’s governing philosophy consists of nationalist territorial gains, promoting “the China Dream” for the middle class, and projecting ambitious goals of global influence by 2035 and 2049. The result has been a clash between mainland Chinese and peripheral Chinese territories – especially Hong Kong and Taiwan (Chart II-13). The turn away from Chinese identity in these areas runs up against their economic interest. It is largely a reaction to the surge in mainland nationalist sentiment, which cannot be observed directly due to the absence of reliable opinion polling. Chart II-13AChinese Nationalism On The Mainland, Anti-Nationalism In Periphery
July 2020
July 2020
Chart II-13BChinese Nationalism On The Mainland, Anti-Nationalism In Periphery
July 2020
July 2020
The conflict over identity in Greater China is perhaps the world’s greatest geopolitical risk. While Hong Kong has no conceivable alternative to Beijing’s supremacy, Taiwan does. The US is interested in reviving its technological and defense relationship with Taiwan now that it seeks to counterbalance China. Chart II-14Taiwan: Epicenter Of US-China Cold War
July 2020
July 2020
Beijing may be faced with a technology cordon imposed by the United States, and yet have the option of circumventing this cordon via Taiwan’s advanced semiconductor manufacturing. Taiwan’s “Silicon Shield” used to be its security guarantee. Now that the US is tightening export controls and sanctions on China, Beijing has a greater need to confiscate that shield. This makes Taiwan the epicenter of the US-China struggle, as we have highlighted since 2016. The risk of a fourth Taiwan Strait crisis is as pertinent in the short run as it is over the long run, given that the US and China have already intensified their saber-rattling in the Strait (Chart II-14), including in the wake of COVID-19 specifically. China’s secular slowdown is prompting it to encroach on the borders of all of its neighbors simultaneously, creating a nascent balance-of-power alliance ranging from India to Australia to Japan. If China fails to curb its nationalism, then eventually US political polarization will decline as the country unites in the face of a peer competitor. If American divisions persist, they could drive the US to instigate conflict with China. Thus a failure of either side to restrain itself is a major geopolitical risk. The US and China ultimately face mutually assured destruction in the event of conflict, but they can have a clash in the near term before they learn their limits. The Cold War provides many occasions of such a learning process – from the Berlin airlift to the Cuban missile crisis. Such crises typically present buying opportunities for financial markets, but the consequences could be more far reaching if the Asian manufacturing supply chain is permanently damaged or if the shifting of supply chains out of China is too rapid. Globalization will also suffer as a result of currency wars. The US has not been successful in driving the dollar down, a key demand of the US-China trade war. It is much harder to force China to reform its labor and wage policies than it is to force it to appreciate its currency. But unlike Japan in 1985, China will not commit to unilateral appreciation for fear of American economic sabotage. Punitive measures will remain an American tool. Contrary to popular belief, the US is not attempting to eliminate its trade deficit. It is attempting to reduce overreliance on China. Status quo globalization is intolerable for US strategy. But autarky is intolerable for US corporations. The compromise is globalization-ex-China, i.e., economic decoupling. Investment Implications Chart II-15Favor International Stocks As Growth Revives
Favor International Stocks As Growth Revives
Favor International Stocks As Growth Revives
US stock market’s capitalization now makes up 58% of global capitalization (Chart II-15), reflecting the strength and innovation of American companies as well as a worldwide flight to safety during a decade of rising policy uncertainty and geopolitical risk. The revival of global growth amid this year’s gargantuan stimulus will prompt a major rotation out of US equities and into international and emerging market equities over the long run. As mentioned, the US greenback would also trend downward. However, there will be little clarity on the pace of nationalism and the fate of globalization until the US election is decided. Moreover the fate of globalization does not depend entirely on the United States. It mostly depends on countries in the east – Russia, China, and India, all of which are increasingly nationalistic. A miscalculation over Taiwan, North Korea, the East China Sea, the South China Sea, trade, or technology could ignite into tariffs, sanctions, boycotts, embargoes, saber-rattling, proxy battles, and potentially even direct conflict. These risks are elevated in the short run but will persist in the long run. As the US decouples from China it will have to deepen relations with other trading partners. The trade deficit will not go away but will be redistributed to Asian allies. Southeast Asian nations and India – whose own nationalism has created a shift in favor of economic development – will be the long-run beneficiaries. Matt Gertken Vice President Geopolitical Strategist Footnotes 1 Ernest Gellner, Nations and Nationalism (Ithaca, NY: Cornell University Press, 1983). 2 Neli Esipova, Julie Ray, and Ying Han, “750 Million Struggling To Meet Basic Needs With No Safety Net,” Gallup News, June 16, 2020. 3 Christopher Chase-Dunn et al, “The Development of World-Systems,” Sociology of Development 1 (2015), pp. 149-172; and Chase-Dunn, Yukio Kawano, Benjamin Brewer, “Trade globalization since 1795: waves of integration in the world-system,” American Sociological Review 65 (2000), pp. 77-95. 4 Bruce Stokes, “Americans, Like Many In Other Advanced Economies, Not Convinced Of Trade’s Benefits,” September 26, 2018. 5 In other words, the mishandling of COVID-19 and the historic George Floyd protests of June 2020 have not taken as great of a toll on Trump’s national approval, thus far, as the Ukraine scandal last October, the government shutdown in January-February 2019, the near-failure to pass tax cuts in December 2017, or the Charlottesville incident in August 2017. This is surprising and points once more to Trump’s very solid political base, which could serve as a springboard for a comeback over the next four months.
Highlights The cyclical rally in stocks is not over, but the S&P 500 will churn between 2800 and 3200 this summer. Supportive policy, robust household balance sheets and budding economic growth have put a floor under global bourses. Political risk, demanding valuations and COVID-related headlines are creating potent headwinds in the near term that must be resolved. During the ongoing flat but volatile performance of equities, investors should build short positions against government bonds and the dollar. Deep cyclicals, banks and Japanese equities offer opportunities to generate alpha. In the long term, structurally rising inflation will ensure that stocks outperform bonds, but commodities will beat them both. Feature Institutional investors still despise the equity market rebound that began on March 23. Relative to history, professional investors are heavily overweight cash, bonds and defensive sectors but they are underweight equities as an asset class and cyclical sectors specifically. Furthermore, the beta of global macro hedge funds to the stock market is in the bottom of its distribution, which indicates the funds’ low net exposure to equities. The attitude of market participants is understandable given that the economy is in tatters. According to the New York Fed Weekly Economic Index, Q2 GDP in the US will contract by 8.4% compared with last year. Industrial production is still 15.9% below its pre-pandemic high and the US unemployment rate stands at either 13.3% or 16.4%, depending how the BLS accounts for furloughed employees. Moreover, deflationary forces are building, which hurts profits. Despite these discouraging economic reports, the S&P 500 is trading only 7.9% below its February 19 all-time high and is displaying a demanding forward P/E ratio of 21.4. Stocks will continue to churn over the summer with little direction. Financial markets are forward looking and the collapse of risk asset prices in March forewarned of an economic calamity. Stimulus, liquidity conditions and an eventual recovery are creating strong tailwinds for stocks. However, demanding valuations, rising political risks and overbought short-term technicals argue for a correction. These forces will probably balance out each other in the coming months. Investors must be nimble. Buying beta is not enough; finding cheap assets levered to the nascent recovery will be a source of excess returns. Bonds are vulnerable to the recovery and purchasing deep cyclicals at the expense of defensives makes increasing sense. Japanese stocks offer another attractive opportunity. Five Pillars Behind Stocks… Our BCA Equity Scorecard remains in bullish territory despite the conflict between the sorry state of the global economy and the violence of the equity rally since late March (Chart I-1). Five forces support share prices. Chart I-1The Rally Is Underpinned
The Rally Is Underpinned
The Rally Is Underpinned
The first pillar is extraordinarily accommodative liquidity conditions created by global central banks, which have aggressively slashed policy rates and allowed real interest rates to collapse. Additionally, forward guidance indicates that policy will remain easy for the foreseeable future. For example, the Federal Reserve does not anticipate tightening policy through 2022 and the Bank of Japan expects to stand pat until at least 2023. In response, the yield curve in advanced economies has started to steepen, which indicates that the policy easing is having a positive impact on the world’s economic outlook (Chart I-2). Various liquidity measures demonstrate the gush of high-powered money in the financial and economic system in the wake of monetary policy easing. Our US Financial Liquidity Index and dollar-based liquidity measure have skyrocketed. Historically, these two indicators forecast the direction of growth and the stock market (Chart I-3). Chart I-2The Yield Curve Likes What It Sees
The Yield Curve Likes What It Sees
The Yield Curve Likes What It Sees
Chart I-3Exploding Liquidity Conditions
Exploding Liquidity Conditions
Exploding Liquidity Conditions
The second pillar is the greatest fiscal easing since World War II. The US government has increased spending by $2.9 trillion since March. House Democrats have passed an additional $3 trillion plan. Senate Republicans will not ratify the entire proposal, but our Geopolitical Strategy service expects them to concede to $2 trillion.1 Meanwhile, the White House is offering a further $1 trillion infrastructure program over five years. Details of the infrastructure plan are murky, but its existence confirms that fiscal profligacy is the new mantra in Washington and the federal deficit could reach 23% of GDP this year. Chart I-4Loosest Fiscal Policy Since WWII
July 2020
July 2020
The list of new fiscal measures worldwide is long; the key point is that governments are injecting funds to lessen the COVID-19 recession pain on their respective populations and small businesses (Chart I-4). Excluding loans guarantees, even tight-fisted Germany has rolled out EUR 0.44 trillion in relief programs, amounting to 12.9% of GDP. Japan has announced JPY 63.5 trillion of “fresh water” stimulus so far, representing 11.4% of GDP. Loan guarantees administered by various governments along with the Fed’s Primary and Secondary Market Credit Facilities also limit how high business bankruptcies will climb. As we discussed last month, it is unlikely that countries will return to the level of spending and budget deficits that prevailed prior to COVID-19, even if the intensity of fiscal support declines from its current extreme.2 Voters in the West and emerging markets are fed up with the Washington Consensus of limited state intervention. Consequently, the median voter has pivoted to the left on economic matters, especially in Anglo-Saxon nations (Chart I-5).3 The fiscal laxity consistent with economic populism and dirigisme will boost aggregate demand for many years. The third supporting pillar is the private sector’s response to monetary and fiscal easing unleashed by global policymakers. Unlike in 2008, the amount of loans and commercial papers issued by US businesses is climbing, which indicates stronger market access than during the Great Financial Crisis (GFC). A consequence of the large uptick in credit growth has been an explosion in banking deposits. Given the surge in private-sector liquidity – not just base money – broad money creation has eclipsed that of the GFC (Chart I-6). Part of this money will seek higher returns than the -0.97% real short rate available to investors in the US (or -0.9% in Europe), a process that will bid up risk assets. Chart I-5The US Population's Shift To The Left
July 2020
July 2020
Chart I-6The Private Sector's Liquidity Is Improving
The Private Sector's Liquidity Is Improving
The Private Sector's Liquidity Is Improving
The financial health of the US household sector is the fourth pillar buttressing stocks. Households entered the recession with debt equal to 99.4% of disposable income, the lowest share in 19 years. Moreover, debt servicing only represents 9.7% of disposable income, the lowest percentage of the past four decades. Along with generous support from the US government, the resilience created by strong balance sheets explains why delinquency rates remain muted despite a surge in unemployment (Table I-1).4 Moreover, the decline in household net worth pales in comparison with the GFC (Chart I-7). Hence, the wealth effect will not have the same deleterious impact on consumption as it did after 2008. In the wake of large fiscal transfers, the savings rate explosion to an all-time high of 32.9% is a blessing. The surge in savings is applying a powerful brake on 67.7% of the US economy, but its eventual decline will fuel a quick consumption recovery, a positive trend absent after the GFC. Table I-1Consumer Borrowers Are Hanging In There
July 2020
July 2020
Chart I-7Smaller Hit To Net Worth Than The GFC
Smaller Hit To Net Worth Than The GFC
Smaller Hit To Net Worth Than The GFC
The final pillar is the path of the global business cycle. Important predictors of the US economy have improved. The June Philly Fed and Empire State surveys are gaining ground, thanks to their rebounding new orders and employment components. The Conference Board’s LEI is also climbing, even when its financial constituents are excluded. Residential activity, which also leads the US business cycle, is sending positive signals. According to the June NAHB Housing market index, homebuilder confidence is quickly recouping lost ground and building permits are bottoming. These two series suggest that the contribution of housing to GDP growth will only expand. Household spending is showing promising growth as the economy re-opens. In May, US auto sales jumped 44.1% higher and retail sales (excluding autos) soared by 12.4%. Additionally, the retail sales control group5 has already recovered to its pre-pandemic levels. The healing labor market and the bounce in consumer confidence have fueled this record performance because they will prompt a normalization in the savings rate. Progress is also evident outside the US. The expectations component of the German IFO survey is rebounding vigorously, a good omen for European industrial production (Chart I-8). Similarly, the continued climb in China’s credit and fiscal impulse suggests that global industrial production will move higher. Finally, EM carry trades are recovering, which indicates that liquidity is seeping into corners of the global economy that contribute the most to capex (Chart I-9). Chart I-8European Hopes
European Hopes
European Hopes
Chart I-9Positive Signals For Global Manufacturers
Positive Signals For Global Manufacturers
Positive Signals For Global Manufacturers
Against this backdrop, there is an increasing probability that analysts will upgrade their 2020 EPS estimates. The odds of upward revisions to 2021 and 2022 estimates (especially outside of the tech and healthcare sectors) are much more significant, especially because the historical pattern of deep recessions followed by sharp rebounds should repeat itself (Chart I-10). A strong recovery will ultimately foster risk-taking. Mechanically, higher expected cash flows and lower risk premia will remain tailwinds behind stocks. Chart I-10The Deeper The Fall, The Faster The Rebound
July 2020
July 2020
… And Three Reasons To Worry The five pillars shoring up stocks face three powerful factors working at cross purposes against share prices. The first hurdle against stocks is that in aggregate, the S&P 500 is already discounting the coming economic recovery. In the US, the 12-month forward P/E ratio bounced from a low of 13.4 on March 23 to the current 21.4. Bidding up multiples to such heights in a short timeframe opens up the potential for investor disappointments with economic activity or earnings. Equally concerning, the global expectations component of the German ZEW survey has returned to near-record highs. The ZEW is a survey of financial professionals largely influenced by the performance of equities. In order for stocks to continue to rise, they will need an even greater global economic rebound than implied by the ZEW (Chart I-11). Chart I-11Stocks Already Know That IP Will Jump Back
Stocks Already Know That IP Will Jump Back
Stocks Already Know That IP Will Jump Back
Political risk poses a second hurdle against stocks. As intense as it is today, policy uncertainty will not likely abate this summer, which will put upward pressure on the equity risk premium. According to BCA Research’s Geopolitical strategy service, the combination of elevated share prices and President Trump’s low approval rating will increase the prospect of erratic moves by the White House. A pitfall particularly under-appreciated by risk assets is a new round of tariffs in the Sino-US trade war.6 Another hazard is an escalation of tensions with the European Union. US domestic politics are also problematic. Fiscal stimulus has been a pillar for the market. However, as the economy recovers, politicians could let down their guard and resist passing new measures on the docket. This danger is self-limiting. If legislators delay voting on proposed laws, then the resulting drop in the market will put greater pressure on policymakers to continue to support the economy. Either way, this tug-of-war could easily cause some painful bouts of market volatility. Chart I-12How Long Will Stocks Ignore Politics?
How Long Will Stocks Ignore Politics?
How Long Will Stocks Ignore Politics?
In recent months, the equity risk premium could ignore rising political risk as long as financial liquidity was expanding at an accelerating pace (Chart I-12). However, the bulk of monetary easing is over because the Fed, the ECB and the global central banks have already expended most of their ammunition. Moreover, the ECB, the Bank of England, the Bank of Japan and the Swiss National Bank have agreed to slow the pace at which they tap the Fed’s dollar swap line from daily to three times a week. This indicates that the private sector’s extreme appetite for liquidity has been satiated by the increase in base money since March 19. Thus, the expansion of liquidity will decelerate, even if its level remains plentiful. Overlooking political uncertainty will become harder after the second derivative of liquidity turns negative. The third hurdle against the stock market is the evolution of COVID-19. A second wave of infection has started in many countries and it will only continue to escalate as economies re-open, loosen social distancing rules and test more potential cases. Investors will be rattled by headlines such as the resumption of lockdowns in Beijing and mounting new cases in the southern US. Chart I-13A Different Wave
A Different Wave
A Different Wave
BCA’s base case is that a second wave of infections will not result in large-scale lockdowns that paralyzed the global economy in Q1 and Q2. Importantly, the number of new deaths is lagging the spread of recorded new infections (Chart 1-13). This dichotomy highlights better testing, our improved understanding of the disease and our greater capacity to protect vulnerable individuals. A Summer Of Discontent The S&P 500 and global equities will face a summer of directionless gyrations with elevated volatility. Before we can escape this pattern, the technical froth that has engulfed the market must dissipate. Our Tactical Strength Indicator is massively overbought and is consistent with a period of consolidation. (Chart I-14). The same is true of short-term breadth. The proportion of NYSE stocks trading above their 10-week moving average is close to its highest level in the past 20 years, which indicates that meaningful equity gains are doubtful in the coming months. (Chart I-14, bottom panel). A correction should not morph into a renewed bear market because the pillars behind stocks are too strong. Nonetheless, the S&P 500 may retest the 2800-2900 zone during the summer. On the upside, it will be capped near 3200 during that same period. A resolution of the political risks surrounding the market is needed to settle the churning pattern. Another factor will be the progressive normalization of our tactical indicators after an extended period of sideways trading. Finally, continued progress on the treatment of COVID-19 (not necessarily a vaccine) and the formulation of a coherent health policy for the fall will create the impetus for higher share prices later this year. How To Profit When Stocks Churn A strategy most likely to generate the highest reward-to-risk ratio will be to focus on assets and sectors that have not yet fully priced in the upcoming global economic recovery, unlike the broad stock market. The bond market fits within this strategy. G-7 and US yields remain extremely expensive (Chart I-15). Additionally, according to our Composite Technical Indicator, Treasuries are losing momentum (see Section III, page 41). This valuation and technical backdrop renders government bonds vulnerable to both a strong economy and an upward reassessment of the outlook for inflation. Chart I-14A Needed Digestive Break
A Needed Digestive Break
A Needed Digestive Break
Chart I-15Bonds Are Pricey...
Bonds Are Pricey...
Bonds Are Pricey...
Cyclical dynamics also paint a poor outlook for bonds. Globally, the supply of government securities is swelling by approximately $6 trillion, which will slowly lift depressed term premia. Moreover, there has been a sharp incline in excess liquidity as approximated by the gap between our US Financial Liquidity Index and the rate of change of the US LEI. Such a development has led yields higher since the GFC (Chart I-16). Finally, the diffusion index of fifteen Swedish economic variables has started to recover, an indicator that often signals higher yields (Chart I-17). Sweden is an excellent bellwether for the global business cycle because it is a small, open economy where shipments of industrial and intermediate goods account for 55% of exports. Chart I-16...And Vulnerable To Excess Liquidity
...And Vulnerable To Excess Liquidity
...And Vulnerable To Excess Liquidity
Chart I-17Sweden's Message
Sweden's Message
Sweden's Message
The FX market also offers reasonably priced vehicles to bet on the burgeoning global cyclical upswing. Balance-of-payments dynamics are increasingly bearish for the US dollar. A fall in the household savings rate will widen the current account deficit because the fiscal balance remains deeply negative. Meanwhile, US real interest rate differentials are narrowing, thus the capital account surplus will likely recede. The resulting balance-of-payment deficit will accentuate selling pressures on the USD created by a pick-up in global industrial activity (Chart I-18). AUD/CHF offers another attractive opportunity. The AUD trades near a record low relative to the CHF, yet this cross will benefit from a rebound in global nominal GDP growth (Chart I-19). Moreover, Australia managed the COVID-19 crisis very well and it can proceed quickly with its re-opening. Meanwhile, the expensiveness of the CHF versus the EUR will continue to foster deflationary pressures in Switzerland. This contrast ensures that the Swiss National Bank remains more dovish than the Reserve Bank of Australia. Chart I-18Bearish Dollar Backdrop
Bearish Dollar Backdrop
Bearish Dollar Backdrop
Chart I-19AUD/CHF As A Bet On The Recovery
AUD/CHF As A Bet On The Recovery
AUD/CHF As A Bet On The Recovery
Within equities, deep cyclical stocks remain attractive relative to defensive ones. The same acceleration in our excess liquidity proxy that warned of a fall in bond prices indicates that the cyclicals-to-defensives ratio should appreciate. This ratio also benefits meaningfully when the dollar depreciates. A weaker dollar is synonymous with stronger global industrial production. It also eases deflationary pressures and boosts the price of commodities, which increases pricing power for industrial, material and energy stocks. Finally, the cyclical-to-defensives ratio rises when the silver-to-gold ratio turns up. An outperformance of silver has been an important signal that reflation is starting to improve the global economic outlook (Chart I-20).7 Chart I-20Cyclicals Have Not Priced In The Recovery
Cyclicals Have Not Priced In The Recovery
Cyclicals Have Not Priced In The Recovery
Banks also offer attractive opportunities. Investors have clobbered banks because they expect prodigious non-performing loans (NPL) due to the threats to private-sector balance sheets from the deepest recession in nine decades. However, NPLs are not expanding by as much as anticipated thanks to the ample support by global monetary and fiscal authorities. Moreover, banks were conservative and built loss reserves ahead of the crisis. In this context, the extreme valuation discount embedded in banks relative to the S&P 500 seems exaggerated (Chart I-21). Additionally, the gap between the expected growth rate of banks’ long-term earnings and that of the broad market is wider than at any other point in the past 15 years. Investors have also bid up the price of protection against bank shares (Chart I-22). Therefore, despite near-term risks induced by the Fed’s Stress Test, banks are a cheap contrarian bet on a global recovery. Chart I-21Banks Are Cheap
Banks Are Cheap
Banks Are Cheap
Chart I-22Banks As A Contrarian Bet
Banks As A Contrarian Bet
Banks As A Contrarian Bet
Investors should continue to favor foreign versus US equities, which is consistent with our positive outlook on banks and deep cyclical stocks, as well as our negative disposition toward the dollar. Foreign stocks outperform US ones when the dollar depreciates because the former overweight cyclical equities and financials (Chart I-23). Moreover, foreign stocks trade at discounts to US equities and embed significantly lower expected cash flow growth, which suggests that they would offer investors upside from the impending global economic recovery. Chart I-23Favor Foreign Stocks
Favor Foreign Stocks
Favor Foreign Stocks
EM stocks fit within this context. Both EM FX and equities trade at a valuation discount consistent with an upcoming rally (Chart I-24). Moreover, cheap valuations increase the likelihood that a depreciating US dollar will boost EM currencies by easing global financial conditions. Moreover, the momentum of EM equities relative to global ones is forming a positive divergence with the price ratio, which is consistent with liquidity making its way into these markets (Chart I-25). Our Emerging Markets Strategy team is more worried about EM stocks than we are because EM bourses would be unlikely to participate as much as US ones in a mania driven by retail investors.8 Chart I-24Attractive EM Valuations
Attractive EM Valuations
Attractive EM Valuations
Chart I-25EM: A Coiled-Spring Bet On A Weaker Dollar?
EM: A Coiled-Spring Bet On A Weaker Dollar?
EM: A Coiled-Spring Bet On A Weaker Dollar?
Chart I-26Japanese Stocks As A Trade
Japanese Stocks As A Trade
Japanese Stocks As A Trade
Finally, an opportunity to overweight Japanese equities has emerged. The Nikkei has collapsed in conjunction with a meltdown in Japanese industrial production. However, Japanese earnings should recover faster than in the rest of the world. Japan has efficiently handled its COVID-19 outbreak with fewer lockdowns. Moreover, Japan’s earnings per share (EPS) are highly levered to both the global business cycle and China’s economic fluctuations. Consequently, if we expect global activity to recover and China’s credit and fiscal impulse to continue to improve, then we also anticipate that Japan’s EPS will outperform the MSCI All-Country World Index (Chart I-26). Additionally, on a price-to-cash flow basis, Japanese equities trade at a deep-enough discount to global stocks to foreshadow an upcoming period of outperformance. Bottom Line: Equities will be tossed about for the coming quarter or two, buffeted between five tailwinds and three headwinds. While the S&P is expected to gyrate between 2800 and 3200 this summer, investors can seek alpha by selling bonds, selling the dollar and buying AUD/CHF, and favoring deep cyclical stocks as well as banks at the expense of defensives. As a corollary, foreign equities, especially Japanese ones, have a window to outperform the US. EM stocks could also generate excess returns, but they are a more uncertain bet. Exploring Long-Term Risks We explore some investment implications linked to our theme of structurally rising inflation, which will cause lower real long-term portfolio returns than in the previous four decades. Populism and the ossification of the supply-side of the economy will push inflation up this cycle toward an average of 3% to 5%.9 Chart I-27S&P 500 Long-Term Perspective
S&P 500 Long-Term Perspective
S&P 500 Long-Term Perspective
Adjusted for inflation, the 10-year cumulative average return for stocks stands at 12.4%, which is an elevated reading. The strength of the past performance increases the probability that a period of mean reversion is near (Chart I-27). The end of the debt supercycle raises the likelihood that an era of low real returns will materialize. Non-financial debt accounts for 258.7% of GDP, a level only topped at the depth of the Great Depression when nominal GDP collapsed by 46% from its 1929 peak. Meanwhile, yields are at record lows (Chart I-28). Such a combination suggests that there is little way forward to boost debt by enough to enhance growth, especially when each additional dollar of debt generates a diminishing amount of output. Chart I-28The End Of The Debt Super Cycle
The End Of The Debt Super Cycle
The End Of The Debt Super Cycle
Chart I-29Little Room To Cut Taxes
Little Room To Cut Taxes
Little Room To Cut Taxes
Populist governments will remain profligate and play an expanding role in the economy instead of accepting the necessary increase in savings required to reduce debt and create a more robust economy. However, effective personal and corporate tax rates are already very low in the US (Chart I-29). Therefore, the only way to offer fiscal support would be to increase government spending. Growth will become less vigorous as the government’s share of GDP increases (Chart I-30). Moreover, monetary policy will likely remain lax, which boosts the chance of stagflation developing. Chart I-30The Bigger The Government, The Lower The Growth
July 2020
July 2020
Elevated stock multiples are a problem for long-term investors. The S&P 500’s Shiller P/E ratio stands at 29.1, and its price-to-sales ratio is at 2.2. If bond yields remain minimal, then low discount rates can rationalize those extreme multiples. However, if inflation moves above 4%, especially when real output is not expanding robustly, then multiples will mean-revert and equities will generate subpar real returns. Chart I-31Profit Margins: From Tailwind To Headwind?
Profit Margins: From Tailwind To Headwind?
Profit Margins: From Tailwind To Headwind?
Profit margins pose an additional problem for stocks. The decline in unit labor costs relative to selling prices has allowed abnormally wide domestic EBITDA margins to persist (Chart I-31). However, inflation, populism, greater government involvement in the economy and lower efficiency of supply chains will conspire to undo this extraordinary level of profitability. In other words, while the share of national income taken up by wages will expand, profits will account for a progressively smaller slice of output. (Chart I-31, bottom panel). Lower profit margins will push down RoE and accentuate the decline in multiples while also hurting projected long-term cash flows. Chart I-32Elevated Household Exposure To Stocks
Elevated Household Exposure To Stocks
Elevated Household Exposure To Stocks
Finally, from a structural perspective, households are already aggressively overweighting equities. Stocks comprise 54% of US households’ discretionary portfolios. US households held more shares only in 1968 and 2000, two years that marked the beginning of painful drops in real stock prices (Chart I-32). US stocks are most vulnerable to the increase of inflation. Not only are they much more expensive than their global counterparts, but as the Section II special report written by Matt Gertken highlights, the growing nationalism spreading around the world hurts the global order built by and around the US during the past 70 years. With this system of influence diminished, US firms will not be able to command their current valuation premium. Despite low expected real rates of return, equities will still outperform bonds in the coming decade (Table I-2). Even though stocks are more volatile than bonds, stocks have not significantly outperformed bonds during the past 35 years. This was possible because inflation fell from its peak in the early 1980s. However, bonds are unlikely to once again generate higher risk-adjusted returns than equities if inflation bottoms. Moreover, bonds are more expensive than stocks (Chart I-33). A structural bear market in bonds would hurt risk-parity strategies and end the incredible strength in growth stocks. Table I-2Rising Inflation Flatters Stocks Over Bonds
July 2020
July 2020
The outperformance of stocks over bonds will be of little solace to investors if equities generate poor real returns. Instead, investors should explore commodities, an asset class that benefits from rising inflation, especially given the combination of strong government spending and too-accommodative monetary policy. Moreover, after a decade of weak capex in natural resource extraction, the supply of commodities will expand slowly. Hence, our base case this cycle is for a weakening in the stock-to-gold ratio (Chart I-34). The stock-to-industrial commodities ratio will also fall from its heady levels. As a result, the energy, materials and industrial sectors are attractive on a long-term basis beyond the next six to 12 months. Chart I-33Bonds Look Worse Than Stocks...
Bonds Look Worse Than Stocks...
Bonds Look Worse Than Stocks...
Chart I-34...But Gold Looks The Best
...But Gold Looks The Best
...But Gold Looks The Best
Mathieu Savary Vice President The Bank Credit Analyst June 25, 2020 Next Report: July 30, 2020 II. Nationalism And Globalization After COVID-19 Economic shocks in recent decades have led to surges in nationalism and the COVID-19 crisis is unlikely to be different. Nationalism adds to the structural challenges facing globalization, which is already in retreat. Investors face at least a 35% chance that President Trump will be reelected and energize a nationalist and protectionist agenda that is globally disruptive. China is also indulging in nationalism as trend growth slows, raising the probability of a clash with the US even if Trump does not win. US-China economic decoupling will present opportunities as well as risks – primarily for India and Southeast Asia. Since the Great Recession, investors have watched the US dollar and US equities outperform their peers in the face of a destabilizing world order (Chart II-1). Chart II-1US Outperformance Amid Global Disorder
US Outperformance Amid Global Disorder
US Outperformance Amid Global Disorder
Global and American economic policy uncertainty has surged to the highest levels on record. Investors face political and geopolitical power struggles, trade wars, a global pandemic and recession, and social unrest. How will these risks shape up in the wake of COVID-19? First, massive monetary and fiscal stimulus ensure a global recovery but they also remove some of the economic limitations on countries that are witnessing a surge in nationalism. Second, nationalism creates a precarious environment for globalization – namely the wave of “hyper-globalization” since 2000. Nationalism and de-globalization do not depend on the United States alone but rather have shifted to the East, which means that geopolitical risks will remain elevated even if the US presidential election sees a restoration of the more dovish Democratic Party. Economic Shocks Fuel Nationalism’s Revival Nationalism is the idea that the political state should be made up of a single ethnic or cultural community. While many disasters have resulted from this idea, it is responsible for the modern nation-state and it has enabled democracies to take shape across Europe, the Americas, and beyond. Industrialization is also more feasible under nationalism because cultural conformity helps labor competitiveness.10 At the end of the Cold War, transnational communist ideology collapsed and democratic liberalism grew complacent. Each successive economic shock or major crisis has led to a surge in nationalism to fill the ideological gaps that were exposed. Chart II-2The Resurgence Of Russian Nationalism
July 2020
July 2020
Chart II-3USA: From Nationalism To Anti-Nationalism
July 2020
July 2020
For instance, various nationalists and populists emerged from the financial crises of the late 1990s. Russian President Vladimir Putin sought to restore Russia to greatness in its own and other peoples’ eyes (Chart II-2). Not every Russian adventure has mattered for investors, but taken together they have undermined the stability of the global system and raised barriers to exchange. The invasion of Crimea in 2014 and the interference in the US election in 2016 helped to fuel the rise in policy uncertainty, risk premiums in Russian assets, and safe havens over the past decade. The September 11, 2001 terrorist attacks in the United States created a surge in American nationalism (Chart II-3). This surge has since collapsed, but while it lasted the US destabilized the Middle East and provided Russia and China with the opportunity to pursue a nationalist path of their own. Investors who went long oil and short the US dollar at this time could have done worse. The 2008 crisis spawned new waves of nationalist feeling in countries such as China, Japan, the UK, and India (Chart II-4). Conservatives of the majority cultural group rose to power, including in China, where provincial grassroots members of the elite reasserted the Communist Party’s centrality. Japan and India became excellent equity investment opportunities in their respective spheres, while the UK and China saw their currencies weaken. The rising number of wars and conflicts across the world since 2008 reflects the shift toward nationalism, whether among minority groups seeking autonomy or nation-states seeking living space (Chart II-5). Chart II-4Nationalist Trends Since The Great Recession
July 2020
July 2020
Chart II-5World Conflicts Rise After Major Crises
July 2020
July 2020
COVID-19 is the latest economic shock that will feed a new round of nationalism. At least 750 million people are extremely vulnerable across the world, mostly concentrated in the shatter belt from Libya to Turkey, Iran, Pakistan, and India.11 Instability will generate emigration and conflict. Once again the global oil supply will be at risk from Middle Eastern instability and the dollar will eventually fall due to gargantuan budget and trade deficits. Today’s shock will differ, however, in the way it knocks against globalization, a process that has already begun to slow. Specifically, this crisis threatens to generate instability in East Asia – the workshop of the world – due to the strategic conflict between the US and China. This conflict will play out in the form of “proxy battles” in Greater China and the East Asian periphery. The dollar’s recent weakness is a telling sign of the future to come. In the short run, however, political and geopolitical risks are acute and will support safe havens. Globalization In Retreat Nationalism is not necessarily at odds with globalization. Historically there are many cases in which nationalism undergirds a foreign policy that favors trade and eschews military intervention. This is the default setting of maritime powers such as the British and Dutch. Prior to WWII it was the American setting, and after WWII it was the Japanese. Over the past thirty years, however, the rise of nationalism has generally worked against global trade, peace, and order. That’s because after WWII most of the world accepted internationalist ideals and institutions promoted by the United States that encouraged free markets and free trade. Serious challenges to that US-led system are necessarily challenges to global trade. This is true even if they originate in the United States. Globalization has occurred in waves continuously since the sixteenth century. It is not a light matter to suggest that it is experiencing a reversal. Yet the best historical evidence suggests that global imports, as a share of global output, have hit a major top (Chart II-6).12 The line in this chart will fall further in 2020. American household deleveraging, China’s secular slowdown, and the 2014 drop in oil and commodities have had a pervasive impact on the export contribution to global growth. Chart II-6Globalization Hits A Major Top
Globalization Hits A Major Top
Globalization Hits A Major Top
Chart II-7Both Goods And Services Face Headwinds
Both Goods And Services Face Headwinds
Both Goods And Services Face Headwinds
The next upswing of the business cycle will prompt an increase in trade in 2021. Global fiscal stimulus this year amounts to 8% of GDP and counting. But will the import-to-GDP ratio surpass previous highs? Probably not anytime soon. It is impossible to recreate America’s consumption boom and China’s production boom of the 1980s-2000s with public debt alone. Global trend growth is slowing. Isn’t globalization proceeding in services, if not goods? The world is more interconnected than ever, with nearly half of the population using the Internet – almost 30% in Sub-Saharan Africa. One in every two people uses a smartphone. Eventually the pandemic will be mitigated and global travel will resume. Nevertheless, the global services trade is also facing headwinds. And it requires even more political will to break down barriers for services than it does for goods (Chart II-7). The desire of nations to control and patrol cyberspace has resulted in separate Internets for authoritarian states like Russia and China. Even democracies are turning to censorship and content controls to protect their ideologies. Political demands to protect workers and industries are gaining ground. Policymakers in China and Russia have already shifted back toward import substitution; now the US and EU are joining them, at least when it comes to strategic sectors (health, defense). Nationalists and populists across the emerging world will follow their lead. Regional and wealth inequalities are driving populations to be more skeptical of globalization. GDP per capita has not grown as fast as GDP itself, a simple indication of how globalization does not benefit everyone equally even though it increases growth overall (Chart II-8). Inequality is a factor not only because of relatively well-off workers in the developed world who resent losing their job or earning less than their neighbors. Inequality is also rife in the developing world where opportunities to work, earn higher wages, borrow, enter markets, and innovate are lacking. Over the past decade, emerging countries like Brazil, Indonesia, Mexico, and South Africa have seen growing skepticism about whether foreign openness creates jobs or lifts wages.13 Immigration is probably the clearest indication of the break from globalization. The United States and especially the European Union have faced an influx of refugees and immigrants across their southern borders and have resorted to hard-nosed tactics to put a stop to it (Chart II-9). Chart II-8Global Inequality Fuels Protectionism
July 2020
July 2020
Chart II-9US And EU Crack Down On Immigration
July 2020
July 2020
There is zero chance that these tough tactics will come to an end anytime soon in Europe, where the political establishment has discovered a winning combination with voters by promoting European integration yet tightening control of borders. This combination has kept populists at bay in France, Italy, the Netherlands, Spain, and Germany. A degree of nationalism has been co-opted by the transnational European project. In the US, extreme polarization could cause a major change in immigration policy, depending on the election later this year. But note that the Obama administration was relatively hawkish on the border and the next president will face sky-high unemployment, which discourages flinging open the gates. Reduced immigration will weigh on potential GDP growth and drive up the wage bill for domestic corporations. If nationalism continues to rise and to hinder the movement of people, goods, capital, and ideas, then it will reduce the market’s expectations of future earnings. American Nationalism Still A Risk The United States is experiencing a “Civil War Lite” that may take anywhere from one-to-five years to resolve. The November 3 presidential election will have a major impact on the direction of nationalism and globalization over the coming presidential term. If President Trump is reelected – which we peg at 35% odds – then American nationalism and protectionism will gain a new lease on life. Other nations will follow the US’s lead. If Trump fails, then nationalism will likely be driven by external forces, but protectionism will persist in some form. Chart II-10Trump Is Not Yet Down For The Count
July 2020
July 2020
Investors should not write Trump off. If the election were held today, Trump would lose, but the election is still four months away. His national approval rating has troughed at a higher level than previous troughs. His disapproval rating has spiked but has not yet cleared its early 2019 peak (Chart II-10).14 This is despite an unprecedented deluge of bad news: universal condemnation from Democrats and the media, high-profile defections from fellow Republicans and cabinet members, stunning defeats at the Supreme Court, and scathing rebukes from top US army officers. If Trump’s odds are 35% then this translates to a 35% chance that the United States will continue pursuing globally disruptive “America First” foreign and trade policies in the 2020-24 period. First Trump will attempt to pass a Reciprocal Trade Act to equalize tariffs with all trading partners. Assuming Democrats block it in the House of Representatives, he will still have sweeping executive authority to levy tariffs. He will launch the next round in the trade war with China to secure a “Phase Two” trade deal, which will be tougher because it will be focused on structural reforms. He could also open new fronts against the European Union, Mexico, and other trade surplus countries. By contrast, these risks will melt away if Biden is elected. Biden would restore the Obama administration’s approach of trade favoritism toward strategic allies and partners, such as Europe and the members of the Trans-Pacific Partnership, but only occasional use of tariffs. Biden would work with international organizations like the World Trade Organization. His foreign policy would also open up trade with pariah states like Iran, reducing the tail-risk of a war to almost zero. Biden would be tougher on China than Presidents Obama or Bill Clinton, as the consensus in Washington is now hawkish and Biden would need to keep the blue-collar voters he won back from Trump. He may keep Trump’s tariffs in place as negotiating leverage. But he is less likely to expand these tariffs – and there is zero chance he will use them against Europe. At the same time, it will take a year or more to court the allies and put together a “coalition of the willing” to pressure China on structural reforms and liberalization. China would get a reprieve – and so would financial markets. Thus investors have a roughly 65% chance of seeing US policy “normalize” into an internationalist (not nationalist) approach that reduces the US contribution to trade policy uncertainty and geopolitical risk over the next few years at minimum. But there are still four months to go before the election; these odds can change, and equity market volatility will come first. Moreover a mellower US would still need to react to nationalism in Asia. European Nationalism Not A Risk (Yet) Chart II-11English Versus Scottish Nationalism
English Versus Scottish Nationalism
English Versus Scottish Nationalism
European nationalism has reemerged in recent years but has greatly disappointed the prophets of doom who expected it to lead to the breakup of the European Union. The southern European states suffered the most from COVID-19 but many of them have made their decision regarding nationalism and the supra-national EU. Greece underwent a depression yet remained in the union. Italians could easily elect the right-wing anti-establishment League to head a government in the not-too-distant future. But there is no appetite for an Italian exit. Brexit is the grand exception. If Trump wins, then the UK and British Prime Minister Boris Johnson will be seen as the vanguard of the revival of nationalism in the West. If Trump loses, English nationalism will appear an isolated case that is constrained by its own logic given the response of Scottish nationalism (Chart II-11). The trend in the British Isles would become increasingly remote from the trends in continental Europe and the United States. The majority of Europeans identify both as Europeans and as their home nationality, including majorities in countries like Greece, Italy, France, and Austria where visions of life outside the union are the most robust (Chart II-12). Even the Catalonians are focused on options other than independence, which has fallen to 36% support. Eastern European nationalists play a careful balancing game of posturing against Brussels yet never drifting so far as to let Russia devour them. Chart II-12European Nationalism Is Limited (For Now)
European Nationalism Is Limited (For Now)
European Nationalism Is Limited (For Now)
Europeans have embraced the EU as a multi-ethnic confederation that requires dual allegiances and prioritizes the European project. COVID-19 has so far reinforced this trend, showing solidarity as the predominant force, and much more promptly than during the 2011 crisis. It will take a different kind of crisis to reverse this trend of deeper integration. European nationalists would benefit from another economic crash, a new refugee wave from the Middle East, or conflict with Turkish nationalism. The latter is already burning brightly and will eventually flame out, but not before causing a regional crisis of some kind. European policymakers are containing nationalism by co-opting some of its demands. The EU is taking steps to guard against globalization, particularly on immigration and Chinese mercantilism. The lack of nationalist uprisings in Europe do not overthrow the contention that globalization is slowing down. Europe can become more integrated at home while maintaining the higher barriers against globalization that it has always maintained relative to the UK and United States. Chinese Nationalism The Biggest Risk The nationalist risk to globalization is most significant in East Asia and the Pacific, where Chinese nationalism continues the ascent that began with the Great Recession. China’s slowdown in growth rates has weakened the Communist Party’s confidence in the long-term viability of single-party rule. The result has been a shift in the party line to promote ideology and quality of life improvements to compensate for slower income gains. Xi Jinping’s governing philosophy consists of nationalist territorial gains, promoting “the China Dream” for the middle class, and projecting ambitious goals of global influence by 2035 and 2049. The result has been a clash between mainland Chinese and peripheral Chinese territories – especially Hong Kong and Taiwan (Chart II-13). The turn away from Chinese identity in these areas runs up against their economic interest. It is largely a reaction to the surge in mainland nationalist sentiment, which cannot be observed directly due to the absence of reliable opinion polling. Chart II-13AChinese Nationalism On The Mainland, Anti-Nationalism In Periphery
July 2020
July 2020
Chart II-13BChinese Nationalism On The Mainland, Anti-Nationalism In Periphery
July 2020
July 2020
The conflict over identity in Greater China is perhaps the world’s greatest geopolitical risk. While Hong Kong has no conceivable alternative to Beijing’s supremacy, Taiwan does. The US is interested in reviving its technological and defense relationship with Taiwan now that it seeks to counterbalance China. Chart II-14Taiwan: Epicenter Of US-China Cold War
July 2020
July 2020
Beijing may be faced with a technology cordon imposed by the United States, and yet have the option of circumventing this cordon via Taiwan’s advanced semiconductor manufacturing. Taiwan’s “Silicon Shield” used to be its security guarantee. Now that the US is tightening export controls and sanctions on China, Beijing has a greater need to confiscate that shield. This makes Taiwan the epicenter of the US-China struggle, as we have highlighted since 2016. The risk of a fourth Taiwan Strait crisis is as pertinent in the short run as it is over the long run, given that the US and China have already intensified their saber-rattling in the Strait (Chart II-14), including in the wake of COVID-19 specifically. China’s secular slowdown is prompting it to encroach on the borders of all of its neighbors simultaneously, creating a nascent balance-of-power alliance ranging from India to Australia to Japan. If China fails to curb its nationalism, then eventually US political polarization will decline as the country unites in the face of a peer competitor. If American divisions persist, they could drive the US to instigate conflict with China. Thus a failure of either side to restrain itself is a major geopolitical risk. The US and China ultimately face mutually assured destruction in the event of conflict, but they can have a clash in the near term before they learn their limits. The Cold War provides many occasions of such a learning process – from the Berlin airlift to the Cuban missile crisis. Such crises typically present buying opportunities for financial markets, but the consequences could be more far reaching if the Asian manufacturing supply chain is permanently damaged or if the shifting of supply chains out of China is too rapid. Globalization will also suffer as a result of currency wars. The US has not been successful in driving the dollar down, a key demand of the US-China trade war. It is much harder to force China to reform its labor and wage policies than it is to force it to appreciate its currency. But unlike Japan in 1985, China will not commit to unilateral appreciation for fear of American economic sabotage. Punitive measures will remain an American tool. Contrary to popular belief, the US is not attempting to eliminate its trade deficit. It is attempting to reduce overreliance on China. Status quo globalization is intolerable for US strategy. But autarky is intolerable for US corporations. The compromise is globalization-ex-China, i.e., economic decoupling. Investment Implications Chart II-15Favor International Stocks As Growth Revives
Favor International Stocks As Growth Revives
Favor International Stocks As Growth Revives
US stock market’s capitalization now makes up 58% of global capitalization (Chart II-15), reflecting the strength and innovation of American companies as well as a worldwide flight to safety during a decade of rising policy uncertainty and geopolitical risk. The revival of global growth amid this year’s gargantuan stimulus will prompt a major rotation out of US equities and into international and emerging market equities over the long run. As mentioned, the US greenback would also trend downward. However, there will be little clarity on the pace of nationalism and the fate of globalization until the US election is decided. Moreover the fate of globalization does not depend entirely on the United States. It mostly depends on countries in the east – Russia, China, and India, all of which are increasingly nationalistic. A miscalculation over Taiwan, North Korea, the East China Sea, the South China Sea, trade, or technology could ignite into tariffs, sanctions, boycotts, embargoes, saber-rattling, proxy battles, and potentially even direct conflict. These risks are elevated in the short run but will persist in the long run. As the US decouples from China it will have to deepen relations with other trading partners. The trade deficit will not go away but will be redistributed to Asian allies. Southeast Asian nations and India – whose own nationalism has created a shift in favor of economic development – will be the long-run beneficiaries. Matt Gertken Vice President Geopolitical Strategist III. Indicators And Reference Charts We continue to favor stocks at the expense of bonds, a view held since our April issue. Global fiscal and monetary conditions remain highly accommodative. Now that the global economy is starting to recover as lockdowns ease, another tailwind for stocks has emerged. Nonetheless, last month we warned that the S&P 500 was entering a consolidation phase and that a pattern of volatile ups and downs would ensue. The combination of tactically overbought markets, elevated geopolitical risk, and a looming second wave of infections continues to sustain this short-term view. Hence, the S&P 500 is likely to churn between 2088 and 3200 over the coming months. On a cyclical basis, the same factors that made us willing buyers of stocks since late March remain broadly in place. Stocks are becoming increasingly expensive, but monetary conditions are extremely accommodative. Our Speculation Indicator continues to send a benign signal, which indicates that from a cyclical perspective, the market is not especially vulnerable. Finally, our Revealed Preference Indicator is flashing a strong buy signal. Tactically, equities must still digest the heady gains made since March 23. We have had five 5% or more corrections since March 23. More of them are in the cards. Both our Tactical Strength Indicator and the share of NYSE stocks trading above their 10-week moving averages point to a pullback of 5% to 10%. Moreover, while it remains extremely stimulative, our Monetary Indicator is not rising anymore, which increases the probability that traders start to pay more attention to geopolitical risks. According to our Bond Valuation Index, Treasurys are significantly more overvalued than equities. Additionally, our Composite Technical Indicator is losing momentum. This backdrop is dangerous for bonds, especially when sentiment towards this asset class is as high as it is today and economic growth is turning the corner. Finally, we expect the yield curve to steepen, especially for very long maturities where the Fed is less active. In a similar vein, inflation breakeven rates are a clean vehicle to bet on higher yields. Since we last published, the dollar has broken down. The greenback is expensive and its counter-cyclicality is a major handicap during a global economic recovery. Additionally, the US twin deficits are increasingly problematic. The fiscal deficit remains exceptionally wide and the re-opening of the US economy will pull down the household savings rate. The current account deficit is therefore bound to widen. The continued low level of real interest rates will complicate financing this deficit and to equilibrate the funding of US liabilities, the dollar will depreciate. The widening in the current account deficit also means that the large increase in money supply by the Fed will leak out of the US economy. This process will accentuate the dollar’s negative impulse. Technically, the accelerating downward momentum in our Dollar Composite Technical Indicator also warns of additional downside for the USD. Commodities continue to gain traction. The rapid move up in the Baltic Dry index suggests that more gains are in store for natural resource prices, especially as our momentum indicator is gaining strength. Moreover, the commodity advance/decline line remains in an uptrend. A global economic recovery, a weakening dollar, and falling real interest rates (driven by easy policy) indicate that fundamental factors – not just technical ones – are also increasingly commodity bullish. Tactically, if stocks churn, as we expect, commodities will likely do so as well. However, this move should also be seen as a consolidation of previous gains. Finally, gold remains strong, lifted by accommodative monetary conditions and a weak dollar. However, the yellow metal is now trading at a significant premium to its short-term fundamentals. Gold too is likely to trade in a volatile sideways pattern, especially if bond yields rise. EQUITIES: Chart III-1US Equity Indicators
US Equity Indicators
US Equity Indicators
Chart III-2Willingness To Pay For Risk
Willingness To Pay For Risk
Willingness To Pay For Risk
Chart III-3US Equity Sentiment Indicators
US Equity Sentiment Indicators
US Equity Sentiment Indicators
Chart III-4Revealed Preference Indicator
Revealed Preference Indicator
Revealed Preference Indicator
Chart III-5US Stock Market Valuation
US Stock Market Valuation
US Stock Market Valuation
Chart III-6US Earnings
US Earnings
US Earnings
Chart III-7Global Stock Market And Earnings: Relative Performance
July 2020
July 2020
Chart III-8Global Stock Market And Earnings: Relative Performance
July 2020
July 2020
FIXED INCOME: Chart III-9US Treasurys And Valuations
July 2020
July 2020
Chart III-10Yield Curve Slopes
Yield Curve Slopes
Yield Curve Slopes
Chart III-11Selected US Bond Yields
Selected US Bond Yields
Selected US Bond Yields
Chart III-1210-Year Treasury Yield Components
10-Year Treasury Yield Components
10-Year Treasury Yield Components
Chart III-13US Corporate Bonds And Health Monitor
US Corporate Bonds And Health Monitor
US Corporate Bonds And Health Monitor
Chart III-14Global Bonds: Developed Markets
Global Bonds: Developed Markets
Global Bonds: Developed Markets
Chart III-15Global Bonds: Emerging Markets
Global Bonds: Emerging Markets
Global Bonds: Emerging Markets
CURRENCIES: Chart III-16US Dollar And PPP
US Dollar And PPP
US Dollar And PPP
Chart III-17US Dollar And Indicator
US Dollar And Indicator
US Dollar And Indicator
Chart III-18US Dollar Fundamentals
US Dollar Fundamentals
US Dollar Fundamentals
Chart III-19Japanese Yen Technicals
Japanese Yen Technicals
Japanese Yen Technicals
Chart III-20Euro Technicals
Euro Technicals
Euro Technicals
Chart III-21Euro/Yen Technicals
Euro/Yen Technicals
Euro/Yen Technicals
Chart III-22Euro/Pound Technicals
Euro/Pound Technicals
Euro/Pound Technicals
COMMODITIES: Chart III-23Broad Commodity Indicators
Broad Commodity Indicators
Broad Commodity Indicators
Chart III-24Commodity Prices
Commodity Prices
Commodity Prices
Chart III-25Commodity Prices
Commodity Prices
Commodity Prices
Chart III-26Commodity Sentiment
Commodity Sentiment
Commodity Sentiment
Chart III-27Speculative Positioning
Speculative Positioning
Speculative Positioning
ECONOMY: Chart III-28US And Global Macro Backdrop
US And Global Macro Backdrop
US And Global Macro Backdrop
Chart III-29US Macro Snapshot
US Macro Snapshot
US Macro Snapshot
Chart III-30US Growth Outlook
US Growth Outlook
US Growth Outlook
Chart III-31US Cyclical Spending
US Cyclical Spending
US Cyclical Spending
Chart III-32US Labor Market
US Labor Market
US Labor Market
Chart III-33US Consumption
US Consumption
US Consumption
Chart III-34US Housing
US Housing
US Housing
Chart III-35US Debt And Deleveraging
US Debt And Deleveraging
US Debt And Deleveraging
Chart III-36US Financial Conditions
US Financial Conditions
US Financial Conditions
Chart III-37Global Economic Snapshot: Europe
Global Economic Snapshot: Europe
Global Economic Snapshot: Europe
Chart III-38Global Economic Snapshot: China
Global Economic Snapshot: China
Global Economic Snapshot: China
Mathieu Savary Vice President The Bank Credit Analyst Footnotes 1 Please see Geopolitical Strategy "Social Unrest Can Still Cause Volatility," dated June 5, 2020, available at gps.bcaresearch.com 2 Please see The Bank Credit Analyst "June 2020," dated May 28, 2020, available at bca.bcaresearch.com 3 Please see Geopolitical Strategy "Introducing: The Median Voter Theory," dated June 8, 2016, available at gps.bcaresearch.com 4 Please see US Investment Strategy "So Far, So Good (How Markets Learned To Stop Worrying And Love Washington, DC)," dated June 8, 2020, available at usis.bcaresearch.com 5 The control group excludes auto and gas stations, and building materials. 6 Please see Geopolitical Strategy "Geopolitics Is The Next Shoe To Drop," dated April 10, 2020, available at gps.bcaresearch.com 7 Gold and silver are precious metals that benefit from lower interest rates and a weak dollar. However, a much larger proportion of the demand for silver comes from industrial processes. Thus, silver outperforms gold when an economic recovery is imminent. 8 Please see Emerging Markets Strategy "A FOMO-Driven Mania?," dated June 4, 2020, and Emerging Markets Strategy "EM: Follow The Momentum," dated June 18, 2020, available at ems.bcaresearch.com 9 Please see The Bank Credit Analyst "June 2020," dated May 28, 2020, available at bca.bcaresearch.com 10 Ernest Gellner, Nations and Nationalism (Ithaca, NY: Cornell University Press, 1983). 11 Neli Esipova, Julie Ray, and Ying Han, “750 Million Struggling To Meet Basic Needs With No Safety Net,” Gallup News, June 16, 2020. 12 Christopher Chase-Dunn et al, “The Development of World-Systems,” Sociology of Development 1 (2015), pp. 149-172; and Chase-Dunn, Yukio Kawano, Benjamin Brewer, “Trade globalization since 1795: waves of integration in the world-system,” American Sociological Review 65 (2000), pp. 77-95. 13 Bruce Stokes, “Americans, Like Many In Other Advanced Economies, Not Convinced Of Trade’s Benefits,” September 26, 2018. 14 In other words, the mishandling of COVID-19 and the historic George Floyd protests of June 2020 have not taken as great of a toll on Trump’s national approval, thus far, as the Ukraine scandal last October, the government shutdown in January-February 2019, the near-failure to pass tax cuts in December 2017, or the Charlottesville incident in August 2017. This is surprising and points once more to Trump’s very solid political base, which could serve as a springboard for a comeback over the next four months.
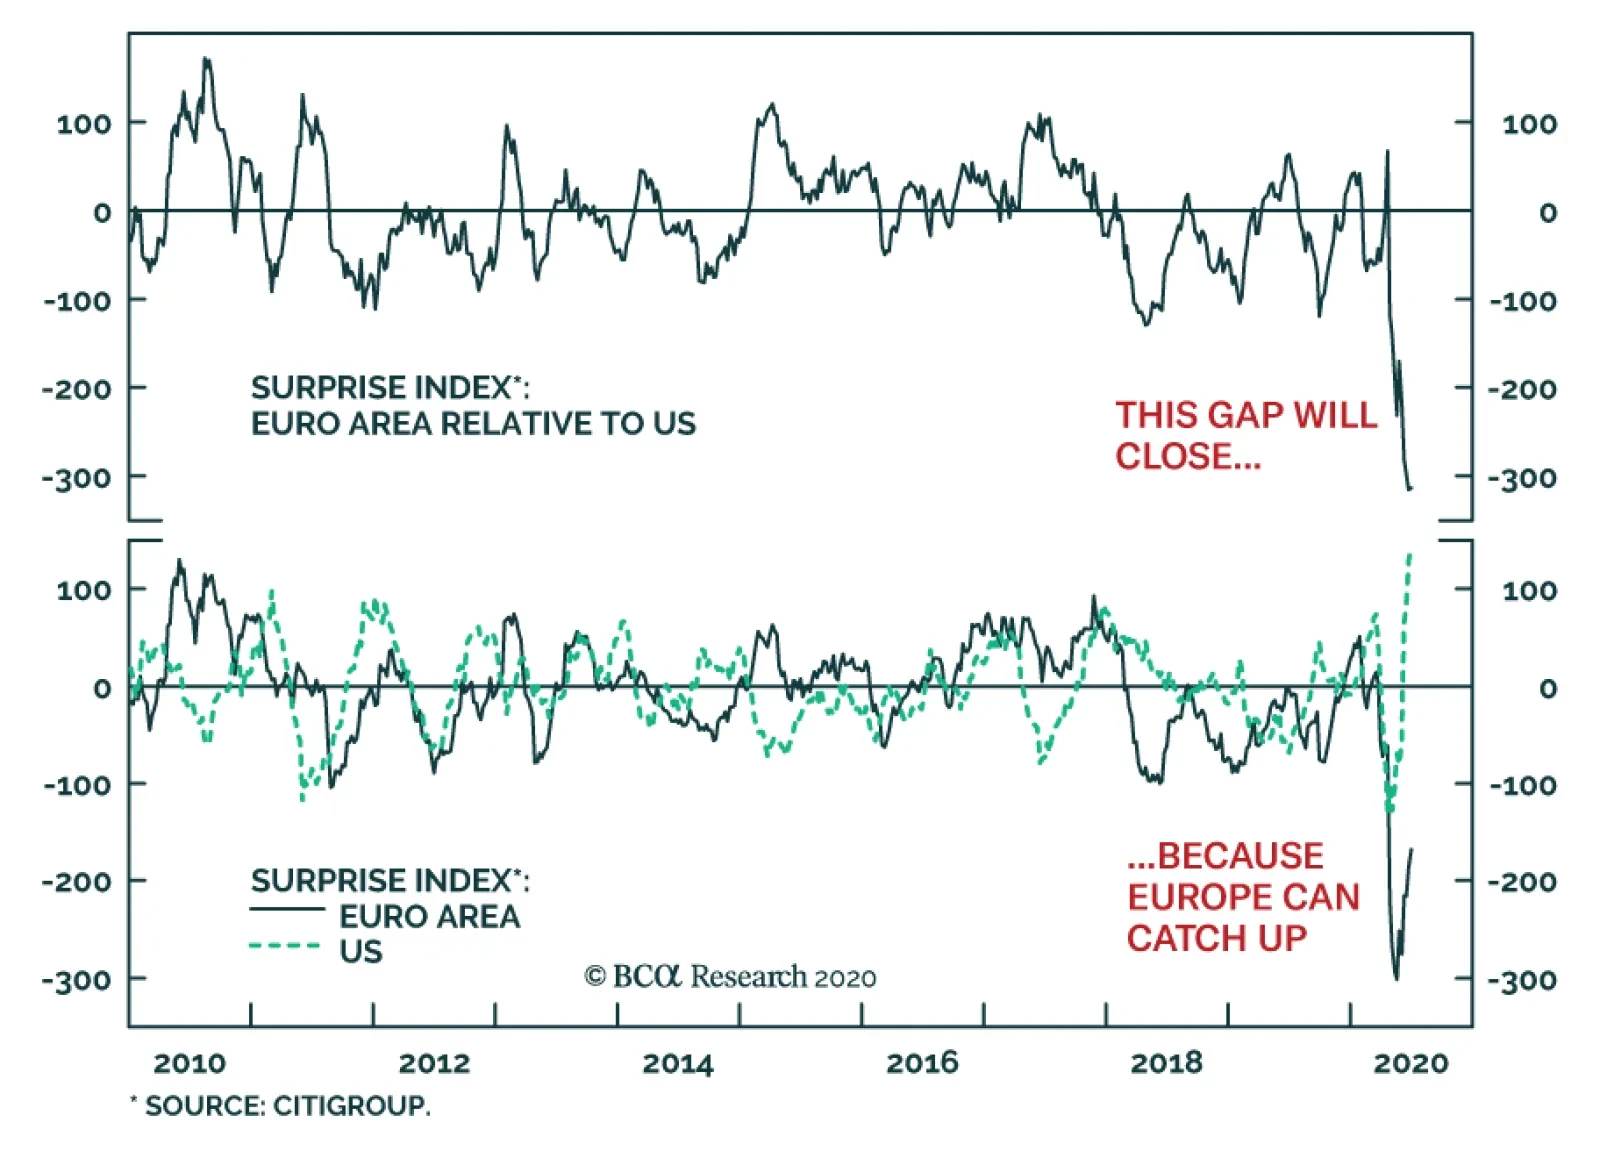
The European economy has room to catch up to the US. The gap between the euro area and the US economic surprise index lingers near all-time lows. While the European surprise index is recovering, it lags well behind the US indicator, which stands at a record…
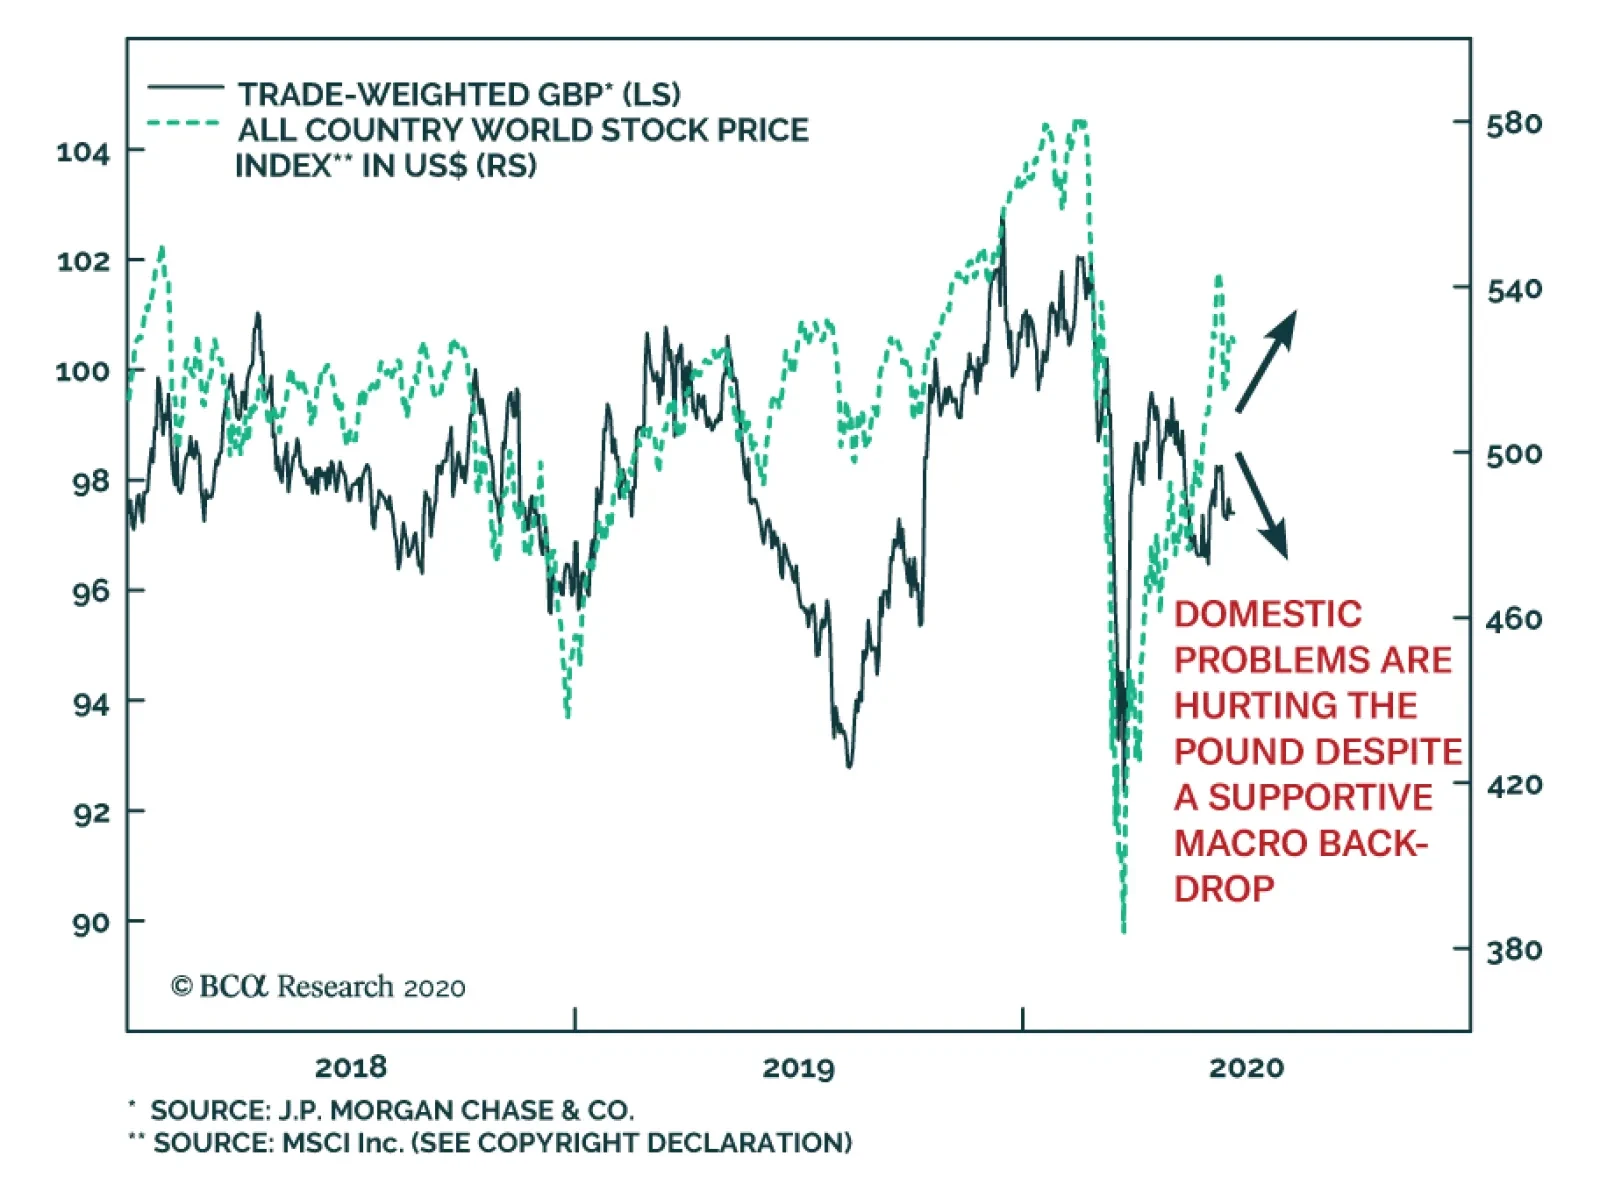
The pound historically is a pro-cyclical currency. The UK sports a current account deficit of 3.74% of GDP. Funding such a large deficit is easier when global liquidity is plentiful, when global growth is strong, and when risk aversion is decreasing. The…
Highlights We conservatively estimate lost output from shutdowns and social distancing will equal $10 trillion, and we expect the jobs market to be permanently scarred. Inflation, even at 2 percent, is a pipe dream, which leads to three investment conclusions on a 1-year horizon: Overweight US T-bonds and Spanish Bonos versus German Bunds and French OATs. Any high-quality bond yield that can decline will decline. Overweight CHF/USD. The tightening yield spread will structurally favour the CHF, while the haven status of the CHF should prevent it from underperforming in periods of market stress. Overweight defensive equities (technology and healthcare) versus cyclical equities (banks and energy). This implies underweight European equities versus other markets. Fractal trade: Short Germany versus the UK. The recent outperformance of German equities is technically extended. Feature Chart of the WeekCredit Impulses Are Large, But The Hole In Output Is Much Larger
Credit Impulses Are Large, But The Hole In Output Is Much Larger
Credit Impulses Are Large, But The Hole In Output Is Much Larger
Big numbers befuddle us. Hardly a day passes without someone listing the unprecedented global stimulus unleashed to counter the coronavirus forced shutdowns – the trillions in government spending promises, tax relief, loan guarantees, money supply growth, and central bank asset-purchases. The most optimistic estimates quantify the total stimulus at $15 trillion. This includes $7 trillion of loan guarantees plus increases in central bank balance sheets which do not directly boost demand. So the direct stimulus is closer to $7 trillion.1 Yet the size of the stimulus is meaningless until we quantify the massive hole in economic output that needs to be filled. Assuming no further large-scale shutdowns, we conservatively estimate that the hole will amount to 12 percent of world output, or $10 trillion. A $10 Trillion Hole In Output Last week, the UK’s Office for National Statistics (ONS) helped us to estimate the hole in output, because unusually the ONS calculates UK GDP on a monthly basis. Between February and April, when the UK economy went from fully open to full shutdown, UK GDP collapsed by 25 percent. This despite the UK having an outsized number of jobs suitable for ‘working from home.’ For a more typical economy, we estimate that a full shutdown collapses output by 30 percent (Chart I-2). Chart I-2A Full Shutdown Collapses Output By 30 Percent
A Full Shutdown Collapses Output By 30 Percent
A Full Shutdown Collapses Output By 30 Percent
The next question is: how long does the full shutdown last? Assuming it lasts for three months, output would suffer a hole amounting to 7.5 percent of annual GDP.2 But in practice, the economy will not fully re-open after three months. Social distancing will persist until people feel confident that the pandemic is under control. An effective vaccine against Covid-19 is unlikely to be available for a year. So, even without government policy to enforce social distancing, many people will choose to avoid crowds and congregations for fear of catching the virus. The size of the stimulus is meaningless until we quantify the massive hole in economic output. This means that the sectors that rely on crowds and congregations – leisure and hospitality and retail trade – will be operating at half-capacity, at best. Given that these sectors generate 9 percent of GDP, operating at half-capacity will create an additional hole amounting to 4.5 percent of output. More worryingly, these two sectors employ 21 percent of all workers, so operating at sub-par will leave the jobs market permanently scarred.3 Combining the 7.5 percent existing hole with the 4.5 percent future hole, the full hole in economic output will amount to around 12 percent of annual GDP. As global GDP is worth around $85 trillion, this equates to $10 trillion. Crucially though, our estimate assumes that a second wave of the pandemic will not force a new cycle of shutdowns. If it does, the hole will become even bigger. Don’t Be Fooled By Money Supply Growth The recent growth in broad money supply seems a big number. Since the start of the year, the outstanding stock of bank loans has increased by around $0.7 trillion in the euro area, and by $1 trillion in both the US and China (Chart I-3 and Chart I-4). This has boosted the 6-month credit impulses in all three economies. Indeed, the US 6-month credit impulse recently hit its highest value of all time, and the combined 6-month impulse across all three blocs equals around $2 trillion (Chart of the Week). Chart I-3Don't Be Fooled By Money Supply Growth In The Euro Area And The US...
Don't Be Fooled By Money Supply Growth In The Euro Area And The US...
Don't Be Fooled By Money Supply Growth In The Euro Area And The US...
Chart I-4...And In ##br##China
...And In China
...And In China
This 6-month credit impulse quantifies the additional borrowing in the most recent six-month period compared to the previous period. Ordinarily, a $2 trillion impulse would create a huge boost to demand. After all, the private sector does not usually borrow just to hold the cash in a bank. Yet in the coronavirus crisis this is precisely what has happened. While the shutdowns lasted, firms drew on existing bank credit lines to build up emergency cash buffers. Therefore, much of the money growth will not generate new demand. While the shutdowns lasted, firms drew on existing bank credit lines to build up emergency cash buffers. To the extent that this cash is sitting idly in a firm’s bank account, the monetary velocity will decline. Meaning there will be a much-reduced transmission from credit impulses to spending growth. Furthermore, when the economy re-opens, many firms will relinquish the precautionary credit lines. There is no point holding cash in the bank when there are few investment opportunities. Hence, credit impulses will fall back – as seems to be the case right now in the US. QE: The Great Misunderstanding To repeat, big numbers befuddle us. They must always be put into context. No truer is this than when it comes to central bank asset-purchases. The great misunderstanding is that the act of central banks buying assets, per se, drives up those asset prices. Central banks act as lenders of last resort to solvent but illiquid banks and sovereigns. If there is ample liquidity in these markets – as is the case now – then the primary function of central bank asset-purchases is to set the term-structure of interest rates. In turn, the term-structure of global interest rates establishes the prices of $500 trillion of global assets. The prices of these assets are inextricably inter-connected and inter-dependent4 (Chart I-5). Chart I-5The Prices Of $500 Trillion Of Assets Are Inextricably Inter-Connected
The Prices Of $500 Trillion Of Assets Are Inextricably Inter-Connected
The Prices Of $500 Trillion Of Assets Are Inextricably Inter-Connected
The great misunderstanding is that the act of central banks buying assets, per se, drives up those asset prices. Yet central banks set no price target for their asset-purchases. They leave that to the market. Moreover, in the context of the $500 trillion of inter-dependent asset prices, the $10-15 trillion or so of central bank asset-purchases to date constitutes chicken feed (Chart I-6). Hence, the mechanism by which asset-purchases work is through the signal they give to the $500 trillion market on the likely course of interest rate policy. This sets the term-structure of interest rates, which in turn sets the required return on all the $500 trillion of assets (Chart I-7). Chart I-6$10-15 Trillion Of QE Is Chicken Feed...
$10-15 Trillion Of QE Is Chicken Feed...
$10-15 Trillion Of QE Is Chicken Feed...
Chart I-7...Compared To $500 Trillion Of Assets Priced By The Term-Structure Of Interest Rates
...Compared To $500 Trillion Of Assets Priced By The Term-Structure Of Interest Rates
...Compared To $500 Trillion Of Assets Priced By The Term-Structure Of Interest Rates
As the ECB’s former Chief Economist, Peter Praet, explains: “There is a signalling channel inherent in asset purchases, which reinforces the credibility of forward guidance on policy rates. This credibility of promises to follow a certain course for policy rates in the future is enhanced by the asset purchases, as these asset purchases are a concrete demonstration of our desire (to keep policy rates at the lower bound.)” The credible commitment to keep policy rates near the lower bound for an extended period depresses bond yields towards the lower bound too. But once bond yields have reached their lower bound the effectiveness of central bank asset-purchases becomes exhausted. Three Investment Conclusions The main purpose of this report was to put the $7 trillion of direct stimulus dollars unleashed into the economy into a proper context. With lost output estimated at $10 trillion and the jobs market permanently scarred, inflation – even at 2 percent – is a pipe dream. Moreover, a second wave of the pandemic and a new cycle of shutdowns would inject a further disinflationary impulse. This leads to three investment conclusions on a 1-year horizon: Any high-quality bond yield that can decline – because it is not already near the -1 percent lower bound to yields – will decline. An excellent relative value trade is to overweight US T-bonds and Spanish Bonos versus German Bunds and French OATs (Chart I-8). Long CHF/USD is a win-win. The tightening yield spread will structurally favour the CHF, while the haven status of the CHF should prevent it from underperforming in periods of market stress. Overweight defensive equities versus cyclical equities, with technology correctly defined as defensive, not cyclical. The performance of cyclicals (banks and energy) versus defensives (technology and healthcare) is now joined at the hip to the bond yield (Chart I-9). This implies underweight European equities versus other markets. Chart I-8Bond Yields That Can Decline Will Decline
Bond Yields That Can Decline Will Decline
Bond Yields That Can Decline Will Decline
Chart I-9The Performance Of Cyclicals Versus Defensives Is Joined At The Hip To The Bond Yield
The Performance Of Cyclicals Versus Defensives Is Joined At The Hip To The Bond Yield
The Performance Of Cyclicals Versus Defensives Is Joined At The Hip To The Bond Yield
Fractal Trading System* The recent outperformance of German equities is technically extended. Accordingly, this week’s recommended trade is to go short Germany versus the UK, expressed through the MSCI dollar indexes. Set the profit target and symmetrical stop-loss at 5 percent.
MSCI: Germany Vs. UK
MSCI: Germany Vs. UK
In other trades, long euro area personal products versus healthcare achieved its 7 percent profit target at which it was closed. The rolling 1-year win ratio now stands at 65 percent. When the fractal dimension approaches the lower limit after an investment has been in an established trend it is a potential trigger for a liquidity-triggered trend reversal. Therefore, open a countertrend position. The profit target is a one-third reversal of the preceding 13-week move. Apply a symmetrical stop-loss. Close the position at the profit target or stop-loss. Otherwise close the position after 13 weeks. * For more details please see the European Investment Strategy Special Report “Fractals, Liquidity & A Trading Model,” dated December 11, 2014, available at eis.bcaresearch.com. Footnotes 1 Source: Reuters estimate. 2 A 30 percent loss in output for a quarter of a year (3 months) amounts to a 30*0.25 = 7.5 percent loss in annual output. 3 Using the weights of leisure and hospitality and retail trade in the US economy as a proxy for the global weights. 4 The $500 trillion of assets comprises: real estate $300 trillion, public and private equity $100 trillion, corporate bonds and EM debt $50 trillion, and high-quality government bonds $50 trillion. Dhaval Joshi Chief European Investment Strategist dhaval@bcaresearch.com Fractal Trading System Cyclical Recommendations Structural Recommendations Closed Fractal Trades Trades Closed Trades Asset Performance Currency & Bond Equity Sector Country Equity Indicators Bond Yields Indicators To Watch - Bond Yields
Indicators To Watch - Bond Yields
Indicators To Watch - Bond Yields
Indicators To Watch - Bond Yields
Indicators To Watch - Bond Yields
Indicators To Watch - Bond Yields
Indicators To Watch - Bond Yields
Indicators To Watch - Bond Yields
Indicators To Watch - Bond Yields
Indicators To Watch - Bond Yields
Indicators To Watch - Bond Yields
Indicators To Watch - Bond Yields
Interest Rate Indicators To Watch - Interest Rate Expectations
Indicators To Watch - Interest Rate Expectations
Indicators To Watch - Interest Rate Expectations
Indicators To Watch - Interest Rate Expectations
Indicators To Watch - Interest Rate Expectations
Indicators To Watch - Interest Rate Expectations
Indicators To Watch - Interest Rate Expectations
Indicators To Watch - Interest Rate Expectations
Indicators To Watch - Interest Rate Expectations
Indicators To Watch - Interest Rate Expectations
Indicators To Watch - Interest Rate Expectations
Indicators To Watch - Interest Rate Expectations
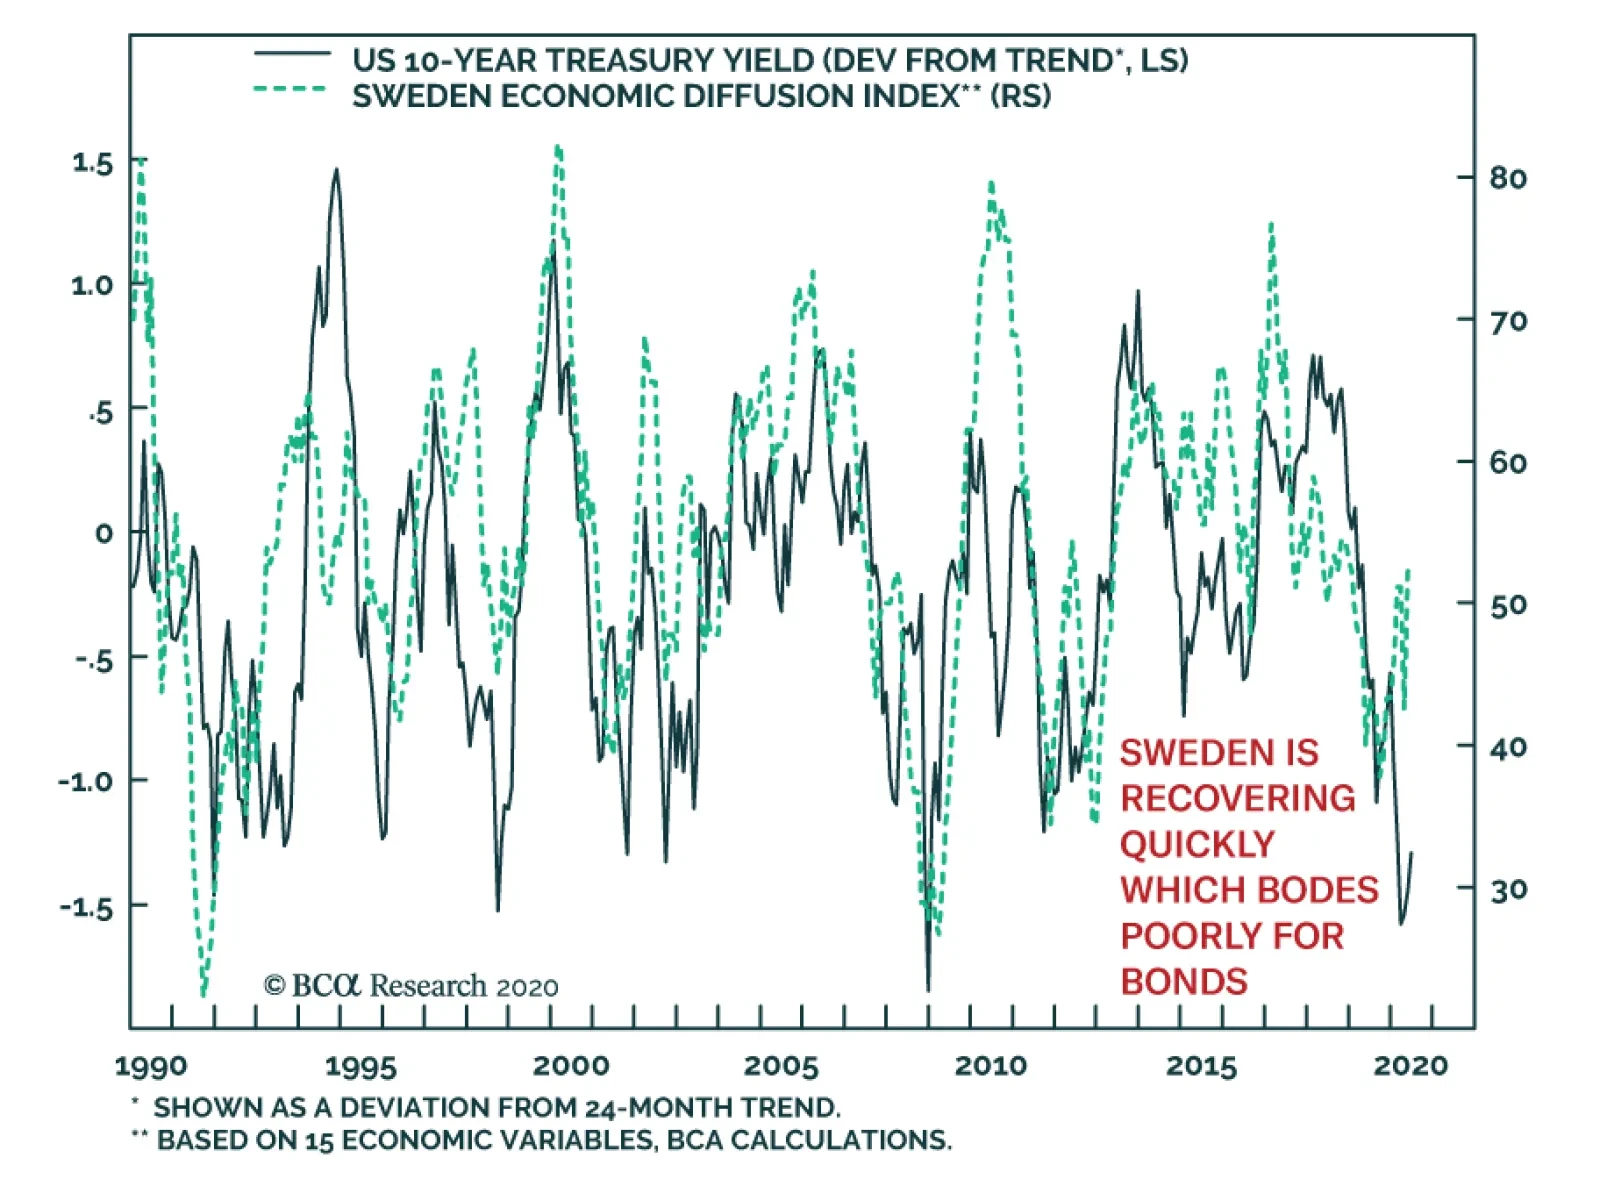
Sweden’s strategy to deal with the COVID-19 crisis has been controversial. While many dispute its health implication, its impact on the Swedish economy has been positive. Despite the profound pro-cyclicality of Sweden’s economy, its current recession is set…
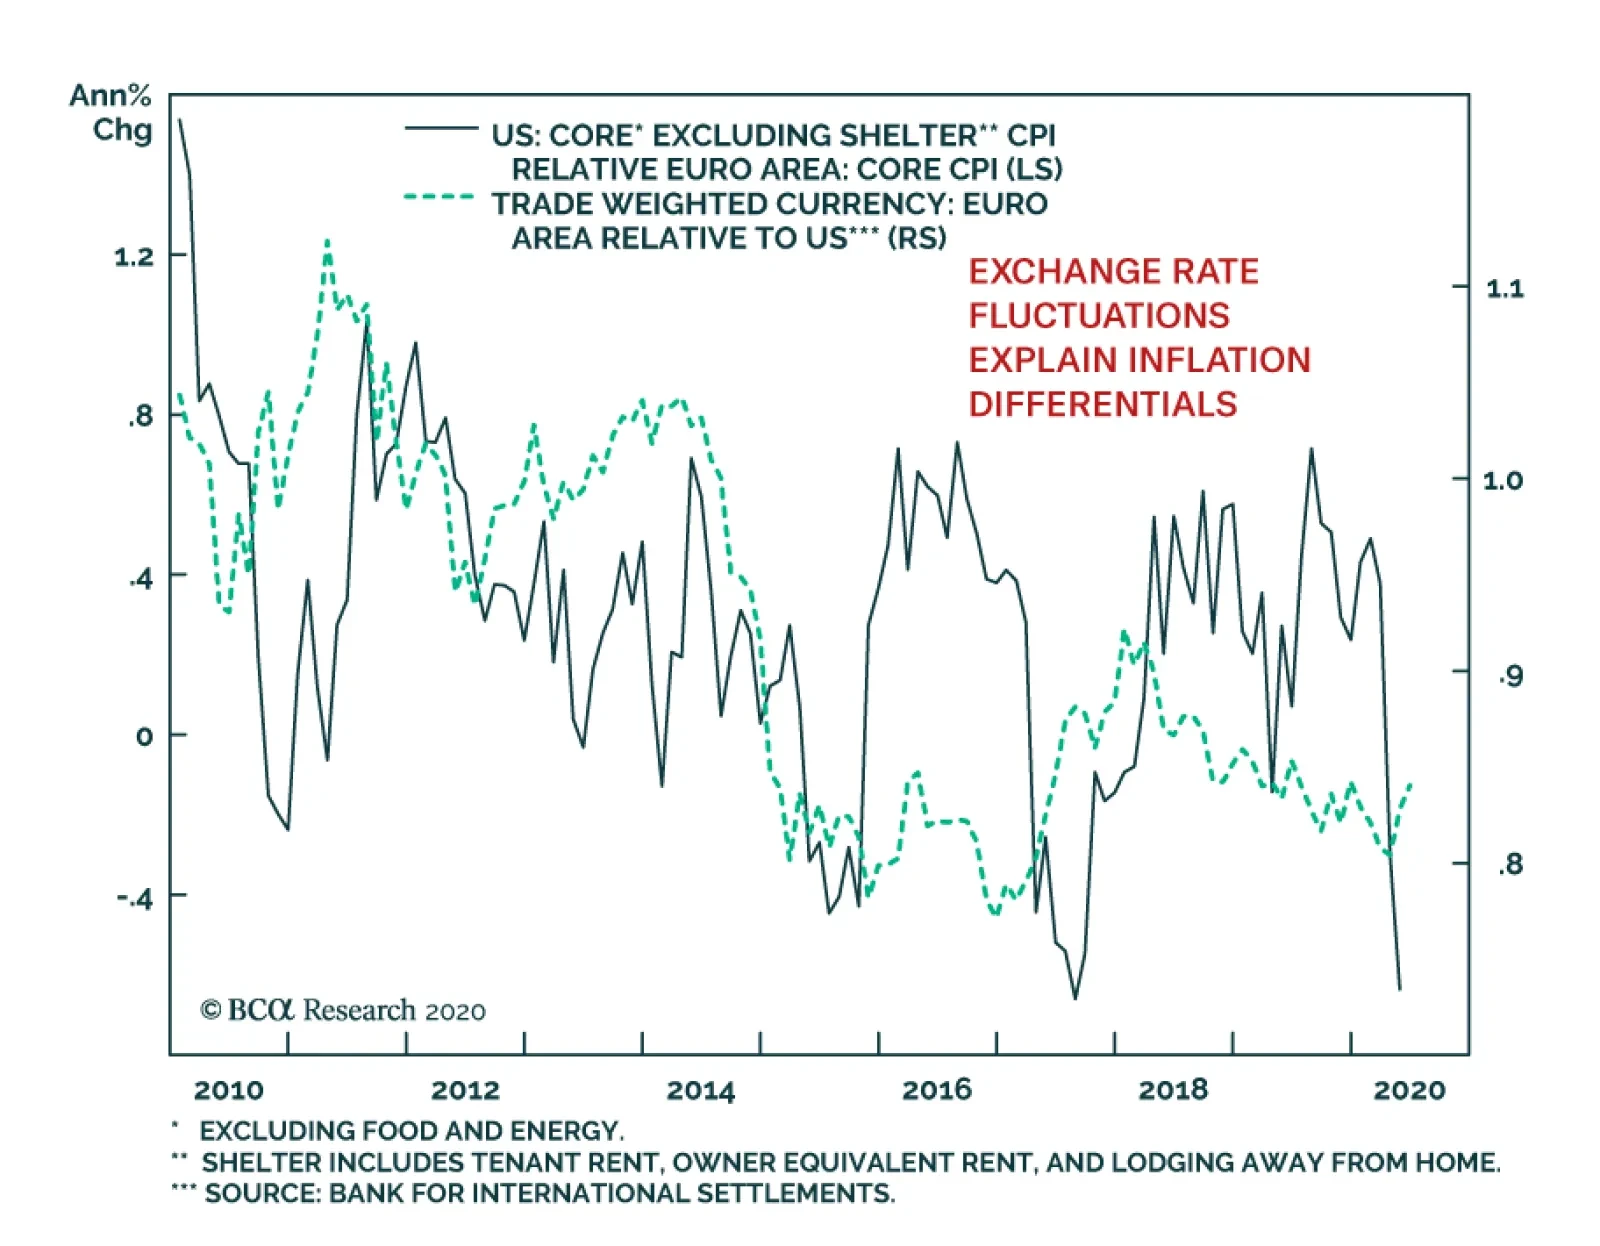
When comparing inflation between the US and the euro area, investors must make a crucial adjustment. US core CPI includes a shelter component that is absent in the European gauge. Removing the shelter component reveals that US inflation runs below that of…
In a webcast this Friday I will be joined by our Chief US Equity Strategist, Anastasios Avgeriou to debate ‘Sectors To Own, And Sectors To Avoid In The Post-Covid World’. Today’s report preludes five of the points that we will debate. Please join us for the full discussion and conclusions on Friday, June 12, at 8:00 AM EDT (1:00 PM BST, 2:00 PM CEST, 8.00 PM HKT). Highlights Technology is behaving like a Defensive. Defensive versus Cyclical = Growth versus Value. Growth stocks are not a bubble if bond yields stay ultra-low. The post-Covid world will reinforce existing sector mega-trends. Sectors are driving regional and country relative performance. Fractal trade: Long ZAR/CLP. Chart of the WeekSector Defensiveness/Cyclicality = Positive/Negative Sensitivity To The Bond Price
Sector Defensiveness/Cyclicality = Positive/Negative Sensitivity To The Bond Price
Sector Defensiveness/Cyclicality = Positive/Negative Sensitivity To The Bond Price
1. Technology Is Behaving Like A Defensive How do we judge an equity sector’s sensitivity to the post-Covid economy, so that we can define it as cyclical or defensive? One approach is to compare the sector’s relative performance with the bond price. According to this approach, the more negatively sensitive to the bond price, the more cyclical is the sector. And the more positively sensitive to the bond price, the more defensive is the sector (Chart I-1). On this basis the most cyclical sectors in the post-Covid economy are, unsurprisingly: energy, banks, and materials. Healthcare is unsurprisingly defensive. Meanwhile, the industrials sector sits closest to neutral between cyclical and defensive, showing the least sensitivity to the bond price. The tech sector’s vulnerability to economic cyclicality appears to have greatly reduced. The big surprise is technology, whose high positive sensitivity to the bond price during the 2020 crisis qualifies it as even more defensive than healthcare. This contrasts sharply with its behaviour during the 2008 crisis. Back then, tech’s relative performance was negatively correlated with the bond price, defining it as classically cyclical. But over the past year, tech’s relative performance has been positively correlated with the bond price, defining it as classically defensive (Chart I-2 and Chart I-3). Chart I-2In 2008, Tech Behaved Like ##br##A Cyclical...
In 2008, Tech Behaved Like A Cyclical...
In 2008, Tech Behaved Like A Cyclical...
Chart I-3...But In 2020, Tech Is Behaving Like A Defensive
...But In 2020, Tech Is Behaving Like A Defensive
...But In 2020, Tech Is Behaving Like A Defensive
This is not to say that the big tech companies cannot suffer shocks. They can. For example, from new superior technologies, or from anti-oligopoly legislation. However, the tech sector’s vulnerability to economic cyclicality appears to have greatly reduced over the past decade. 2. Defensive Versus Cyclical = Growth Versus Value If we reclassify the tech sector as defensive in the 2020s economy, then the post mid-March rebound in stocks was first led by defensives. Cyclicals took over leadership of the rally only in May. Moreover, with the reclassification of tech as defensive, the two dominant defensive sectors become tech and healthcare. But tech and healthcare are also the dominant ‘growth’ sectors. The upshot is that growth versus value has now become precisely the same decision as defensive versus cyclical (Chart I-4). Chart I-4Defensive Versus Cyclical = Growth Versus Value
Defensive Versus Cyclical = Growth Versus Value
Defensive Versus Cyclical = Growth Versus Value
3. Growth Stocks Are Not A Bubble If Bond Yields Stay Ultra-Low Some people fear that growth stocks have become dangerously overvalued. There is even mention of the B-word. Let’s address these fears. Yes, valuations have become richer. For example, the forward earnings yield for healthcare is down to 5 percent; and for big tech it is down to just over 4 percent. This valuation starting point has proved to be an excellent guide to prospective 10-year returns, and now implies an expected annualised return from big tech in the mid-single digits. Yet this modest positive return is well above the extremes of the negative 10-year returns implied and delivered from the dot com bubble (Chart I-5). Chart I-5Big Tech Is Priced To Deliver A Positive Return, Unlike In 2000
Big Tech Is Priced To Deliver A Positive Return, Unlike In 2000
Big Tech Is Priced To Deliver A Positive Return, Unlike In 2000
Moreover, we must judge the implied returns from growth stocks against those available from competing long-duration assets – specifically, against the benchmark of high-quality government bond yields. If bond yields are ultra-low, then they must depress the implied returns on growth stocks too. Meaning higher absolute valuations (Chart I-6 and Chart I-7). Chart I-6Tech's Forward Earnings Yield Is Above The Bond Yield, Unlike In 2000
Tech's Forward Earnings Yield Is Above The Bond Yield, Unlike In 2000
Tech's Forward Earnings Yield Is Above The Bond Yield, Unlike In 2000
Chart I-7Healthcare's Forward Earnings Yield Is Above The Bond Yield, Unlike In 2000
Healthcare's Forward Earnings Yield Is Above The Bond Yield, Unlike In 2000
Healthcare's Forward Earnings Yield Is Above The Bond Yield, Unlike In 2000
In the real bubble of 2000, big tech was priced to return 12 percent (per annum) less than the 10-year T-bond. Whereas today, the implied return from big tech – though low in absolute terms – is above the ultra-low yield on the 10-year T-bond. If bond yields are ultra-low, then they must depress the implied returns on growth stocks too. The upshot is that high absolute valuations of growth stocks are contingent on bond yields remaining at ultra-low levels. And that the biggest threat to growth stock valuations would be a sustained rise in bond yields. 4. The Post-Covid World Will Reinforce Existing Sector Mega-Trends If a sector maintains a structural uptrend in sales and profits, then a big drop in the share price provides an excellent buying opportunity for long-term investors. This is because the lower share price stretches the elastic between the price and the up-trending profits, resulting in an eventual catch-up. However, if sales and profits are in terminal decline, then the sell-off is not a buying opportunity other than on a tactical basis. This is because the elastic will lose its tension as profits drift down towards the lower price. In fact, despite the sell-off, if the profit downtrend continues, the price may be forced ultimately to catch-down. This leads to a somewhat counterintuitive conclusion. After a big drop in the stock market, long-term investors should not buy everything that has dropped. And they should not buy the stocks and sectors that have dropped the most if their profits are in major downtrends. In this regard, the post-Covid world is likely to reinforce the existing mega-trends. The profits of oil and gas, and of European banks will remain in major structural downtrends (Chart I-8 and Chart I-9). Conversely, the profits of healthcare, and of European personal products will remain in major structural uptrends (Chart I-10 and Chart I-11). Chart I-8Oil And Gas Profits In A Major ##br##Downtrend
Oil And Gas Profits In A Major Downtrend
Oil And Gas Profits In A Major Downtrend
Chart I-9Bank Profits In A Major ##br##Downtrend
European Banks Profits In A Major Downtrend Bank Profits In A Major Downtrend
European Banks Profits In A Major Downtrend Bank Profits In A Major Downtrend
Chart I-10Healthcare Profits In A Major Uptrend
Healthcare Profits In A Major Uptrend
Healthcare Profits In A Major Uptrend
Chart I-11Personal Products Profits In A Major Uptrend
Personal Products Profits In A Major Uptrend
Personal Products Profits In A Major Uptrend
5. Sectors Are Driving Regional And Country Relative Performance Finally, sector winners and losers determine regional and country equity market winners and losers. Nowadays, a stock market’s relative performance is predominantly a play on its distinguishing overweight and underweight ‘sector fingerprint’. This is because major stock markets are dominated by multinational corporations which are plays on their global sectors, rather than the region or country in which they have a stock market listing. It follows that when tech and healthcare outperform, the tech-heavy and healthcare-heavy US stock market must outperform, while healthcare-lite emerging markets (EM) must underperform. It also follows that the tech-heavy Netherlands and healthcare-heavy Denmark stock markets must outperform. Sector mega-trends will shape the mega-trends in regional and country relative performance. Equally, when energy and banks underperform, the energy-heavy Norway and bank-heavy Spain stock markets must underperform. (Chart I-12 and Chart I-13). These are just a few examples. Every stock market is defined by a sector fingerprint which drives its relative performance. Chart I-12Sector Relative Performance Drives...
Sector Relative Performance Drives...
Sector Relative Performance Drives...
Chart I-13...Regional And Country Relative Performance
...Regional And Country Relative Performance
...Regional And Country Relative Performance
If sector mega-trends continue, they will also shape the mega-trends in regional and country relative performance – favouring those stock markets that are heavy in growth stocks and light in old-fashioned cyclicals. Please join the webcast to hear the full debate and conclusions. Fractal Trading System* This week’s recommended trade is to go long the South African rand versus the Chilean peso. Set the profit target and symmetrical stop-loss at 5 percent. In other trades, long Spanish 10-year bonds versus New Zealand 10-year bonds achieved its 3.5 percent profit target at which it was closed. And long Australia versus New Zealand equities is approaching its 12 percent profit target. The rolling 1-year win ratio now stands at 63 percent. Chart I-14ZAR/CLP
ZAR/CLP
ZAR/CLP
When the fractal dimension approaches the lower limit after an investment has been in an established trend it is a potential trigger for a liquidity-triggered trend reversal. Therefore, open a countertrend position. The profit target is a one-third reversal of the preceding 13-week move. Apply a symmetrical stop-loss. Close the position at the profit target or stop-loss. Otherwise close the position after 13 weeks. * For more details please see the European Investment Strategy Special Report “Fractals, Liquidity & A Trading Model,” dated December 11, 2014, available at eis.bcaresearch.com. Dhaval Joshi Chief European Investment Strategist dhaval@bcaresearch.com Fractal Trading System Cyclical Recommendations Structural Recommendations Closed Fractal Trades Trades Closed Trades Asset Performance Currency & Bond Equity Sector Country Equity Indicators Bond Yields Chart II-1Indicators To Watch - Bond Yields
Indicators To Watch - Bond Yields
Indicators To Watch - Bond Yields
Chart II-2Indicators To Watch - Bond Yields
Indicators To Watch - Bond Yields
Indicators To Watch - Bond Yields
Chart II-3Indicators To Watch - Bond Yields
Indicators To Watch - Bond Yields
Indicators To Watch - Bond Yields
Chart II-4Indicators To Watch - Bond Yields
Indicators To Watch - Bond Yields
Indicators To Watch - Bond Yields
Interest Rate Chart II-5Indicators To Watch - Interest Rate Expectations
Indicators To Watch - Interest Rate Expectations
Indicators To Watch - Interest Rate Expectations
Chart II-6Indicators To Watch - Interest Rate Expectations
Indicators To Watch - Interest Rate Expectations
Indicators To Watch - Interest Rate Expectations
Chart II-7Indicators To Watch - Interest Rate Expectations
Indicators To Watch - Interest Rate Expectations
Indicators To Watch - Interest Rate Expectations
Chart II-8Indicators To Watch - Interest Rate Expectations
Indicators To Watch - Interest Rate Expectations
Indicators To Watch - Interest Rate Expectations