Europe
The “substitution effect” thesis is a double-edged sword for Europe. A resolution of the trade war between the U.S. and China would likely include a massive purchase of U.S. agricultural, commodity, and manufacturing goods: the so-called “Beef and Boeings”…
Europe will remain a high-beta play on global growth that is unlikely to collapse. As such, investors should deploy funds in Europe once the global economy turns up the confidence that the continent will not descend into chaos. This is largely…

Highlights Global bond yields have closely tracked the trajectory of global growth. While the global economy remains fragile, some positive signs are emerging: Our global leading economic indicator has moved off its lows; global financial conditions have eased significantly; U.S. household spending remains resilient; and China is set to further increase stimulus. Neither a severe escalation of the trade war nor a hard Brexit is likely. A simple comparison between current dividend yields and bond yields implies that global equities would need to fall by an outsized amount over the next decade for bonds to outperform stocks. As global growth stabilizes and then begins to recover over the coming months, bond yields will rebound from depressed levels. Investors should overweight stocks versus bonds for now, and look to upgrade EM and European equities later this year. Feature Global Growth Driving Bond Yields Chart 1Global Bond Yields: How Low Will They Go?
Global Bond Yields: How Low Will They Go?
Global Bond Yields: How Low Will They Go?
Global bond yields rose sharply yesterday on word that U.S. and Chinese trade negotiators will meet in October. The announcement by China’s State Council of additional stimulus measures and better-than-expected data on the health of the U.S. service sector also drove the bond sell-off. The jump in yields follows a period of almost unrelenting declines. After hitting a high of 3.25% last October, the U.S. 10-year yield fell to 1.43% this Tuesday, just shy of its all-time low of 1.34% reached on July 5, 2016. The 30-year Treasury yield broke below 2% for the first time in history on August 15, falling to as low as 1.91% this week. It now stands at 2.07%. In Japan and across much of Europe, bond yields remain firmly in negative territory (Chart 1). The large movements in bond yields can be attributed to both the state of the global economy as well as to changes in how central banks are reacting to economic uncertainty. Just as stronger global growth pushed yields higher between mid-2016 and early-2018, the deceleration in growth since then has pulled yields lower. Chart 2 shows that there has been a close correlation between changes in the U.S. 10-year yield and the ISM manufacturing index. The release on Tuesday of a weaker-than-expected ISM manufacturing print for August was enough to push the 10-year yield down by seven basis points within a matter of minutes. Chart 2The Deceleration In Growth Has Pulled Yields Down
The Deceleration In Growth Has Pulled Yields Down
The Deceleration In Growth Has Pulled Yields Down
The forward-looking new orders component of the ISM manufacturing index sunk to a seven-year low. The export orders component fell to the lowest level since 2009. Export volumes track ISM export orders quite closely (Chart 3). Not surprisingly, the ISM press release noted that trade remains “the most significant issue” for U.S. manufacturers. Chart 3Export Volumes Track The ISM Export Component
Export Volumes Track The ISM Export Component
Export Volumes Track The ISM Export Component
The only redeeming feature in the report was that the customers’ inventories index dropped a notch from 45.7 in July to 44.9 in August. A reading below 50 for this subindex indicates that manufacturers believe that their customers are holding too few inventories, which is positive for future production. Global Manufacturing PMI Not Looking Much Brighter The Markit global manufacturing PMI remained below 50 for the fourth month in a row in August. While the global PMI did edge up slightly from July’s reading, this was largely due to a modest rebound in the Chinese PMI, which rose from 49.9 to 50.4. The improvement in the China Markit-Caixin PMI stands in contrast to the further deterioration observed in the “official” National Bureau of Statistics PMI. The former is more heavily geared towards private-sector exporting companies, and hence may have been influenced by the front-loading of exports ahead of the planned tariff increase on Chinese exports to the United States. Some Positive Signs Chart 4Global LEI Has Moved Off Its Lows
Global LEI Has Moved Off Its Lows
Global LEI Has Moved Off Its Lows
In light of the disappointing manufacturing data, it is too early to call a bottom in the global industrial cycle. Nevertheless, there are some hopeful signs. Our Global Leading Economic Indicator (LEI) has moved off its lows (Chart 4). It usually leads the PMIs by a few months. Sterling will probably be the best performing currency in the G7 over the next five years. Despite ongoing weakness in the manufacturing sector, household spending has held up in most economies. In the U.S., the nonmanufacturing ISM index jumped to 56.4 in August from 53.7 in July. Real personal consumption is still on track to grow by 2.8% in Q3 according to the Atlanta Fed (Chart 5). The euro area services PMIs have also been resilient (Chart 6). In Germany, where the manufacturing PMI stood at 43.5 in August, the services PMI rose to 54.8. Chart 5Inventories And Net Exports Have Subtracted From U.S. Growth In Q2 And Q3
Bond Yields Have Hit Bottom
Bond Yields Have Hit Bottom
Chart 6AThe Service Sector Has Softened Much Less Than Manufacturing (I)
The Service Sector Has Softened Much Less Than Manufacturing (I)
The Service Sector Has Softened Much Less Than Manufacturing (I)
Chart 6BThe Service Sector Has Softened Much Less Than Manufacturing (II)
The Service Sector Has Softened Much Less Than Manufacturing (II)
The Service Sector Has Softened Much Less Than Manufacturing (II)
Global financial conditions have eased significantly, mainly thanks to the steep decline in bond yields. The current level of financial conditions implies that global growth could rebound swiftly (Chart 7). The Chinese government is also likely to step up fiscal/credit stimulus over the coming months in an effort to shore up growth. In a boldly worded statement released on Wednesday, the Chinese State Council promised to further increase bond issuance to finance infrastructure projects, while cutting interest rates and reserve requirements. A stronger Chinese economy should benefit global growth (Chart 8). Chart 7Easier Financial Conditions Will Benefit Global Growth
Easier Financial Conditions Will Benefit Global Growth
Easier Financial Conditions Will Benefit Global Growth
Chart 8Stronger Chinese Growth Should Benefit The Global Economy
Stronger Chinese Growth Should Benefit The Global Economy
Stronger Chinese Growth Should Benefit The Global Economy
The Trade War: Moving Towards A Détente? The announcement that the U.S. and China will resume trade negotiations on October 5th is a step in the right direction. As we noted last week, both parties have an incentive to de-escalate the trade conflict. President Trump wants to prop up the stock market and the economy in order to improve his re-election prospects. China also wants to bolster growth.1 Chart 9Would China Really Be Better Off Negotiating With A Democrat As President?
Would China Really Be Better Off Negotiating With A Democrat As President?
Would China Really Be Better Off Negotiating With A Democrat As President?
As difficult as it has been for China to deal with Donald Trump, trying to secure a trade deal with him after he has been re-elected would be even more challenging. This would be especially the case if Trump thought that the Chinese had tried to sabotage his re-election bid. Even if Trump were to lose the election, it is not clear that China would end up with someone more palatable to deal with on trade matters. Does the Chinese government really want to negotiate over labor standards and human rights with President Warren, who betting markets now think has a better chance of becoming the Democratic nominee than Joe Biden (Chart 9)? While Republicans in Congress would be able to restrain a Democratic president on domestic issues, the president would still enjoy free rein over trade policy. Brexit Uncertainty Adding To Investor Angst Two weeks before the Brexit vote on June 23, 2016, I wrote that “Just like my gut told me last August that Trump would do much better at the polls than almost anyone thought possible, I increasingly feel that come June 24th, the EU may find itself with one less member.”2 Chart 10Brexit Opposition Has Been Growing
Brexit Opposition Has Been Growing
Brexit Opposition Has Been Growing
Soon after the shocking verdict, we argued that a hard Brexit would prove to be politically infeasible, meaning that the U.K. would either end up holding another referendum or be forced to negotiate some sort of customs union with the EU. Our view that a hard Brexit will not happen has not changed. Chart 10 shows that opposition to Brexit has only grown since that fateful day. Boris Johnson does not have enough votes in Westminster to force a hard Brexit. Another election would not change this outcome, given that it would almost certainly produce a hung parliament. In any case, it is not clear that Johnson actually wants a hard Brexit. The Times of London recently reported that the government’s own contingency plans for a hard Brexit, weirdly code-named “Operation Yellowhammer,” predicted a crippling logjam at British ports leading to shortages of fuel, food and medicine.3 Boris Johnson is all hat and no cattle. He will be forced to make a deal with the EU. Buy the pound on any dips. Sterling will probably be the best performing currency in the G7 over the next five years. Central Banks: Cut First, Ask Questions Later Chart 11Inflation Expectations Are Low Across The Globe
Inflation Expectations Are Low Across The Globe
Inflation Expectations Are Low Across The Globe
Despite a few glimmers of good news, central banks are in no mood to take any chances. St. Louis Fed President James Bullard said it bluntly last week: “Our job is to get the yield curve uninverted.”4 If history is any guide, global growth will stabilize and begin to recover over the coming months. Inflation expectations are below target in most economies (Chart 11). Central banks know full well that if the current slowdown morphs into a full-blown recession, they will be out of monetary ammunition very quickly. In such a setting, it does not make sense to hold your punches. Much better to generate as much inflation as possible, and as soon as possible, so that real rates can be brought deeper into negative territory if economic circumstances later warrant it. What If The Medicine Works? The risk of easing monetary policy too much is that economies will eventually overheat, producing more inflation than is desirable. It is easy to forget that the aggregate unemployment rate in the G7 is now below its 2007 lows (Chart 12). True, inflation has yet to take off, but this may simply be because inflation is a lagging indicator (Chart 13). Chart 12Unemployment Rates Keep Trending Lower
Unemployment Rates Keep Trending Lower
Unemployment Rates Keep Trending Lower
Chart 13Inflation Is A Lagging Indicator
Bond Yields Have Hit Bottom
Bond Yields Have Hit Bottom
For all the talk about how the Phillips curve is dead, the empirical evidence suggests it is very much alive and well (Chart 14). Ironically, this means that lower interest rates today could set the stage for much higher rates in the future if hyperstimulative monetary policies ultimately generate a bout of inflation. Chart 14The Phillips Curve Is Alive And Well
The Phillips Curve Is Alive And Well
The Phillips Curve Is Alive And Well
Chart 15The Dollar Is A Countercyclical Currency
The Dollar Is A Countercyclical Currency
The Dollar Is A Countercyclical Currency
Investment Conclusions Like most economic forecasters, central banks tend to extrapolate recent trends too far into the future. Global growth has been weakening since early 2018 so it seems reasonable to assume that this trend will persist into next year. However, as we have documented, global industrial cycles tend to last about three years – 18 months of rising growth followed by 18 months of falling growth.5 If history is any guide, global growth will stabilize and begin to recover over the coming months. Should that occur, we will enter an environment where the lagged effects of easier monetary policy are hitting the economy just when the manufacturing cycle is taking a turn for the better. Stocks are likely to fare well in such a setting, while long-term bond yields will move higher. As a countercyclical currency, the dollar will also start to weaken anew (Chart 15). Granted, an intensification of the trade war or some other major adverse shock would upset this rosy forecast. Nevertheless, current market pricing offers a fairly large cushion against downside risks. Thanks to the drop in bond yields, the equity risk premium is quite high globally (Chart 16). Even if one were to assume that nominal dividend payments remain unchanged for the next ten years, the S&P 500 would still need to fall by more than 20% in real terms over the next decade for bonds to outperform stocks (Chart 17). Euro area stocks would need to drop by more than 42%. U.K. stocks would need to plummet by at least 60%! Chart 16AEquity Risk Premia Remain Quite High (I)
Equity Risk Premia Remain Quite High (I)
Equity Risk Premia Remain Quite High (I)
Chart 16BEquity Risk Premia Remain Quite High (II)
Equity Risk Premia Remain Quite High (II)
Equity Risk Premia Remain Quite High (II)
Chart 17AStocks Need To Fall By A Considerable Amount For Bonds To Outperform Over A 10-Year Horizon (I)
Stocks Need To Fall By A Considerable Amount For Bonds To Outperform Over A 10-Year Horizon (I)
Stocks Need To Fall By A Considerable Amount For Bonds To Outperform Over A 10-Year Horizon (I)
Chart 17BStocks Need To Fall By A Considerable Amount For Bonds To Outperform Over A 10-Year Horizon (II)
Stocks Need To Fall By A Considerable Amount For Bonds To Outperform Over A 10-Year Horizon (II)
Stocks Need To Fall By A Considerable Amount For Bonds To Outperform Over A 10-Year Horizon (II)
Investors should remain overweight stocks versus bonds over the next 12 months. We intend to upgrade EM and European equities once we see a bit more evidence that global growth has troughed. Peter Berezin, Chief Global Strategist Global Investment Strategy peterb@bcaresearch.com Footnotes 1Please see Global Investment Strategy Weekly Report, “A Psychological Recession?” dated August 30, 2019. 2Please see Global Investment Strategy Weekly Report, “Worry About Brexit, Not Payrolls,” dated June 10, 2016. 3Rosamund Urwin and Caroline Wheeler, “Operation Chaos: Whitehall’s Secret No-Deal Brexit Preparations Leaked,” The Times, August 18, 2019. 4“Fed’s Bullard Sees ‘Robust Debate’ Over Half-Point Cut,” Bloomberg, August 23, 2019. 5Please see Global Investment Strategy Weekly Report, “Three Cycles,” dated July 26, 2019. Strategy & Market Trends MacroQuant Model And Current Subjective Scores
Bond Yields Have Hit Bottom
Bond Yields Have Hit Bottom
Strategic Recommendations Closed Trades
The non-linearity of any potential U.K. election is what makes it difficult to take a high-conviction view on sterling’s direction. Instead, as soon as an election is announced, a good strategy is to buy sterling volatility. Although it has risen recently,…
The only way out of the impasse is to change the parliamentary arithmetic via a snap general election. The trouble is that the outcome of such an election is near impossible to predict. This is because the U.K.’s first past the post electoral system is…
Highlights Currency markets continue to fight a tug-of-war between deteriorating global growth and easing global financial conditions. Such an environment is typically fertile ground for a dollar bull market, yet the trade-weighted dollar is up only 2.3% this year. The lack of more-pronounced strength in the greenback suggests that other powerful underlying forces are preventing the dollar from gapping higher. The breakdown in the bond-to-gold ratio is an important distress signal for dollar bulls. As both political and economic uncertainty remain elevated, likely winners in the interim remain safe-haven currencies such as the yen and the Swiss franc. For the remainder of the year, portfolio managers should focus on relative value trades at the crosses, rather than outright dollar bets. Stand aside on the pound for now. Aggressive investors can place a buy stop at 1.25 and sell stop at 1.20. The Riksbank’s hawkish surprise was a welcome development for the krona. Remain long SEK/NZD. The SEK might be the best-performing G10 currency over the next five years. Feature Yearly performance is an important benchmark for most portfolio managers. As most CIOs return to their desks from a summer break, they will be looking at a few barometers to help them navigate the rest of 2019. On the currency front, here is what the report card looks like so far: The dollar has been a strong currency, but the magnitude of the increase has been underwhelming, given market developments. The Federal Reserve’s trade-weighted dollar is up only 2.3% this year. In contrast, the yen is up 3.6% and the Canadian dollar 2.3%. Meanwhile, the best shorts have been the Swedish krona (down 9.7%) and the kiwi. Through the lens of the currency market, the dollar has been in a run-of-the-mill bull market, rather than in a panic buying frenzy (Chart I-1). Chart I-1A Report Card On Currency Performance
Preserving Capital During Riot Points
Preserving Capital During Riot Points
Gold has broken out in every major currency. This carries a lot of weight because it has occurred amid dollar strength, a historical rarity. Importantly, the breakout culminates the seven-or-so-year pattern where gold was stable versus many major currencies (Chart I-2). We are no technical analysts, but ever since gold peaked in 2011, all subsequent rallies have seen diminishing amplitude, which by definition were bull traps. This appeared to have changed since 2015-2016, which could be a signal that the dollar bull market is nearing an end. Commodities have been a mixed bag. Precious metals have surged alongside gold. Despite the recent correction, oil is still up 13.8% for the year. Meanwhile, natural gas is in a bear market. Among metals, nickel has surged 70%, while Doctor Copper is down 5.1%. The only semblance of agreement is among soft commodities, which have been mostly deflating (Chart I-3). In short, there has been no coherent theme for commodity currencies. All the talk of a Sino-U.S. trade war, Chinese A-shares are up 18.7% for the year. This more than makes up for any CNY depreciation. Equities have performed well across the board, mostly up double digits. The only notable laggards have been in Asia, specifically Japan, Hong Kong and Korea. That said, of all the talk of a Sino-U.S. trade war, Chinese A-shares are up 18.7% for the year. This more than makes up for any CNY depreciation. This also suggests that capital flows into equities have not been a major driver of currencies this year. Chart I-2Gold Has Been The Ultimate Currency
Gold Has Been The Ultimate Currency
Gold Has Been The Ultimate Currency
Chart I-3Commodities Are A Mixed Bag
Commodities Are A Mixed Bag
Commodities Are A Mixed Bag
Yields have collapsed, with higher-beta markets seeing bigger drops. Differentials have mostly moved against the dollar in recent weeks as the U.S. 10-year yield plays catch-up to the downside. One important question is that with Swiss 10-year yields now at -0.96% and German yields at -0.67%, is there a theoretical floor to how low bond yields can fall (Chart I-4)? Chart I-4Yields Have Melted
Yields Have Melted
Yields Have Melted
Heading back to his office, the CIO is now pondering how to deploy fresh capital. On one hand, the typical narrative that we have been operating in the quadrant of a deflationary bust, given the trade war, manufacturing recession, political unrest and rapidly rising probability of recession is not clearly visible in financial data. This would have been historically dollar bullish, and negative for other asset classes. However, the plunge in bond yields begs the question of whether this is a prelude to worse things to come. A more sanguine assessment is that we might be at a crossroads of sorts. If economic data continues to deteriorate due to much larger endogenous factors, a defensive strategy is clearly warranted. One way to tell will be an emerging divergence between our leading indicators and actual underlying data. On the flip side, any specter of positive news could light a fire under sectors, currencies and countries that have borne the brunt of the slowdown. Time is of the essence, and strategy will be dependent on horizons. A review of the leading indicators for the major economic blocks is in order. Are We At The Cusp Of A Recession? Centripetal systems tend to stay in equilibrium, while centrifugal forces can explode in spectacular fashion. In the currency world, this means that the tug of war between deteriorating global growth and easing liquidity conditions cannot last forever. Either the dollar breakout morphs into a panic buying frenzy or proves to be a bull trap. Are we at the cusp of a bottom in global growth, or approaching a riot point? Let us start with the economic front: U.S.: Plunging U.S. bond yields have historically been bullish for growth. More importantly, the recent decline in the ISM Manufacturing Index is approaching 2008 recessionary levels. Either easing in financial conditions revive the index, or the decoupling persists for a while longer. The tone on the political front appears reconciliatory, which means September and October data will be critical. In 2008, the divergence between deteriorating economic conditions and falling yields was an important signpost for a riot point (Chart I-5). Eurozone: The Swedish manufacturing PMI ticked up to 52.4 in August. Most importantly, the new orders-to-inventories ratio is suggesting that the German (and European) manufacturing recession is reversing (Chart I-6). For all the debate about whether China is stimulating enough or not, the beauty about this indicator is that there are no Chinese variables in it (the euro zone and Sweden export a lot of goods and services to China). Any surge higher in this indicator will categorically conclude the euro zone manufacturing recession is over, lighting a fire under the euro in the process. Whatever the number is, if it can stabilize Chinese growth, a powerful deflationary force that dictated markets in 2018-2019 will dissipate. China: Chinese bond yields have melted alongside global yields. This is reflationary, given the liberalization in the bond market over the past few years. Policy makers are currently discussing the quota for next year’s fiscal spending. Whatever the number is, if it can stabilize Chinese growth, a powerful deflationary force that dictated markets in 2018-2019 will dissipate. Chart I-5Is U.S. Manufacturing Close ##br##To A Bottom?
Is U.S. Manufacturing Close To A Bottom?
Is U.S. Manufacturing Close To A Bottom?
Chart I-6Is Eurozone Manufacturing Close To A Bottom?
Is Eurozone Manufacturing Close To A Bottom?
Is Eurozone Manufacturing Close To A Bottom?
Discussions among industry specialists suggest some anecdotal evidence that many manufacturers have been engaged in re-routing channels and parallel manufacturing chains to avoid the U.S.-China tariffs. This is welcome news, since global exports and global trade are still in a downtrend. A key barometer to watch on whether the global slowdown is infecting domestic demand will be Chinese imports (Chart I-7). So far, the message is that traditional correlations have not yet broken down. As a contrarian, this is positive. Manufacturing slowdowns have tended to last 18 months peak-to-trough, the final months of which are characterized by fatigue and capitulation. However, unless major imbalances exist (our contention is that so far they do not), mid-cycle slowdowns sow the seeds of their own recovery via accumulated savings and pent-up demand. In the currency world, the dollar has tended to be an excellent counter-cyclical barometer. On the dollar, the bond-to-gold ratio is breaking down, in contrast to the rise in the DXY. This is not a sustainable divergence (Chart I-8). The last time the bond-to-gold ratio diverged from the DXY was in 2017, and that proved extremely short-lived. As global growth rebounded and U.S. repatriation flows eased, dollar support was quickly toppled over. Chart I-7Chinese Imports Could Soon Rebound
Chinese Imports Could Soon Rebound
Chinese Imports Could Soon Rebound
Chart I-8Mind The Gap
Mind The Gap
Mind The Gap
Ever since the end of the Bretton Woods agreement broke the gold/dollar anchor in the early 1970s, bullion has stood as a viable threat to dollar liabilities, capturing the ebbs and flows of investor confidence in the greenback tick-for-tick. While U.S. yields remain attractive, portfolio outflows and a deteriorating balance-of-payments backdrop will keep longer-term investors on the sidelines. Chart I-9Dollar Bulls Need A More Hawkish Fed
Dollar Bulls Need A More Hawkish Fed
Dollar Bulls Need A More Hawkish Fed
Capital tends to gravitate towards higher returns, and the U.S. tax break in 2017 was a one-off that is now ebbing. Meanwhile, despite wanting to resist the appearance of influence from President Trump, the Fed realises that the neutral rate of interest in the U.S. is now below its target rate, which should keep them on an easing path. A dovish Fed has historically been bearish for the dollar (Chart I-9). Bottom Line: In terms of strategy, heightened uncertainty can keep the greenback bid in the coming weeks, but we will be sellers on strength. Our favorite plays remain the Swedish krona, the Norwegian krone, and, for insurance purposes, the Japanese yen. Outright dollar shorts await confirmation from more economic data. What To Do About CAD? The Bank of Canada (BoC) decided to stay on hold at its latest policy meeting. This was highly anticipated, but the silver lining is that the BoC might later reflect on this move as a policy mistake, given the arms race by other central banks to ease policy. The three most important variables for the Canadian economy are a:) what is happening to the U.S. economy, b:) what is happening to crude oil prices and c:) what is happening to consumer leverage and the housing market. On all three fronts, there has been scant good news in recent weeks. Heightened uncertainty can keep the greenback bid in the coming weeks, but we will be sellers on strength. The Nanos Investor Confidence Index suggests Canadian GDP might be at the cusp of a slowdown after an excellent run of a few quarters (Chart I-10). One of the key drivers for the CAD/USD exchange rate is interest rate differentials with the U.S., and the compression in rates could run further (Chart I-11). Unless the BoC adopts a looser monetary stance, a rising exchange rate is likely to tighten financial conditions. Rising energy prices will be a tailwind, but the Western Canadian Select discount, and persistent infrastructure problems are headwinds. As such, we think domestic conditions will continue to knock down whatever benefit comes from rising oil prices. Chart I-10Canadian Data Has##br## Been Firm
Canadian Data Has Been Firm
Canadian Data Has Been Firm
Chart I-11A Firm Exchange Rate Could Tighten Financial Conditions
A Firm Exchange Rate Could Tighten Financial Conditions
A Firm Exchange Rate Could Tighten Financial Conditions
On the consumer side, real retail sales are deflating at the worst pace since the financial crisis, but consumer confidence remains elevated given the robust labor market data (Chart I-12). However, if house prices continue to roll over, confidence is likely to crater (Chart I-13). Chart I-12Canada: Consumer Spending Is Weak
Canada: Consumer Spending Is Weak
Canada: Consumer Spending Is Weak
Chart I-13Canada: The Housing Market Is Softening
Canada: The Housing Market Is Softening
Canada: The Housing Market Is Softening
On the corporate side of the equation, the latest Canadian Business Outlook Survey suggests there has been no meaningful revival in capital spending. This is a big headwind, since Canada finances itself externally rather than via domestic savings. For external investors, the large stock of debt in the Canadian private sector and overvaluation in the housing market are likely to continue leading to equity outflows (from bank shares) on a rate-of-change basis (Chart I-14). Chart I-14Foreign Investors Are Fleeing Canadian Securities
Foreign Investors Are Fleeing Canadian Securities
Foreign Investors Are Fleeing Canadian Securities
Technically, the USD/CAD failed to break below the upward sloping trend line drawn from its 2012 lows, and the series of lower highs since the 2016 peak is forcing the cross into the apex of a tight wedge. The next resistance zone on the downside is the 1.30-1.32 level. Our bias is that this zone will prove to be formidable resistance. We continue to recommend investors short the CAD, mainly via the euro. Housekeeping We were stopped out of our short XAU/JPY position amid fervent buying in gold. Even though we are gold bulls, the rationale behind the trade was that the ratio of the two safe havens was at a speculative extreme. We will stand aside for now and look to re-establish the position in the near future. The Risksbank left rates on hold this week. This was welcome news for our long SEK/NZD position. The weakness in the SEK this year was expected given the surge in summer volatility, but the magnitude of the fall took us by surprise. In general, as soon as President Trump ramped up the trade-war rhetoric and China started devaluing the RMB, the environment became precarious for all pro-cyclical currencies. In terms of strategy going forward, the SEK probably has some additional downside, but not a lot. It is currently the cheapest currency in the G10. Should the Riksbank be actively trying to weaken the currency ahead of ECB policy stimulus this month, the final announcement, depending on what it entails, might be the bottom for the SEK and top for the EUR/SEK. Finally, as the Brexit drama unfolds, the outlook for the pound is highly binary. Aggressive investors can place a buy stop at 1.25 and a sell stop at 1.20. Anything in between should be regarded as noise. Chester Ntonifor, Foreign Exchange Strategist chestern@bcaresearch.com Currencies U.S. Dollar Chart II-1USD Technicals 1
USD Technicals 1
USD Technicals 1
Chart II-2USD Technicals 2
USD Technicals 2
USD Technicals 2
Recent data in the U.S. have been firm: PCE deflator nudged up from 1.3% to 1.4% year-on-year in July. Core PCE was unchanged at 1.6% year-on-year. Michigan consumer sentiment index fell from 92.1 to 89.8 in August. Trade deficit narrowed marginally by $1.5 billion to $54 billion in July. Notably, the trade deficit with China increased by 9.4% to $32.8 billion in July. Initial jobless claims was little changed at 217 thousand for the past week. Unit labor cost increased by 2.6% in Q2. Nonfarm productivity remained unchanged at 2.3%. Factory orders increased by 1.4% month-on-month in July. More importantly on the PMI front, Markit manufacturing PMI was down from 50.4 in July to 50.3 in August. ISM manufacturing PMI deteriorated to 49.1 in August, while ISM non-manufacturing PMI increased to 56.4, up from the previous 53.7 and well above estimates. DXY index fell by 0.5% this week. The recent worries about a near-term recession since the 10/2 yield curve inverted last month has been supporting the dollar, together with possible additional tariffs against China and the Chinese yuan devaluation. Going forward, we believe the dollar strength will ebb, given fading interest rate differentials. Report Links: Has The Currency Landscape Shifted? - August 16, 2019 USD/CNY And Market Turbulence - August 9, 2019 Focusing On the Trees But Missing The Forest - August 2, 2019 The Euro Chart II-3EUR Technicals 1
EUR Technicals 1
EUR Technicals 1
Chart II-4EUR Technicals 2
EUR Technicals 2
EUR Technicals 2
Recent data in the euro area have been firm: Unemployment rate was unchanged at 7.5% in July. Both headline and core preliminary inflation were unchanged at 1% and 0.9% year-on-year respectively in August. PPI fell from 0.7% to 0.2% year-on-year in July. On the PMI front, Markit composite PMI was little changed at 51.9 in August. Manufacturing component was unchanged at 47, while services component nudged up slightly to 53.5. Retail sales growth fell from upwardly-revised 2.8% to 2.2% year-on-year in July, still better than the estimated 2%. EUR/USD appreciated by 0.5% this week. While the manufacturing sector across Europe remain depressed, the services sector seems to be alive and well. The ECB monetary policy meeting next Thursday will be key for the path of the euro. Report Links: Battle Of The Central Banks - June 21, 2019 EUR/USD And The Neutral Rate Of Interest - June 14, 2019 Take Out Some Insurance - May 3, 2019 The Yen Chart II-5JPY Technicals 1
JPY Technicals 1
JPY Technicals 1
Chart II-6JPY Technicals 2
JPY Technicals 2
JPY Technicals 2
Recent data in Japan have been mixed: Housing starts fell by 4.1% year-on-year in July. Construction orders increased by 26.9% year-on-year in July, a positive shift from 4.2% contraction in the previous month. Capital spending growth slowed to 1.9% in Q2. Manufacturing PMI fell slightly to 49.3 in August, while services PMI jumped from 51.8 to 53.3. USD/JPY increased by 0.5% this week. The consumption tax hike in Japan is scheduled for October 1. The tax rate will rise from 8% to 10%, with possible exemption on several goods such as food and non-alcoholic beverages, which could be a drag on domestic spending. That being said, we continue to favor the Japanese yen due to the risk of a recession amid the escalating global trade war. Report Links: Has The Currency Landscape Shifted? - August 16, 2019 Portfolio Tweaks Into Thin Summer Trading - July 5, 2019 Battle Of The Central Banks - June 21, 2019 British Pound Chart II-7GBP Technicals 1
GBP Technicals 1
GBP Technicals 1
Chart II-8GBP Technicals 2
GBP Technicals 2
GBP Technicals 2
Recent data in the U.K. continued to deteriorate: Nationwide house price index was unchanged in August. Markit composite PMI fell to 50.2 in August: Manufacturing component slowed to 47.4; Construction PMI fell to 45; Services component decreased to 50.6. Retail sales contracted by 0.5% year-on-year in August. GBP/USD increased by 1.2% this week. Brexit remains the biggest driver behind the pound. British PM Boris Johnson’s brother resigned this week, citing tension between “family loyalty” and “national interest”. Our Geopolitical Strategy upgraded a no-deal Brexit probability to about 33%, maintaining that it is not the base case since nobody wants an imminent recession. From a valuation perspective, the pound is quite cheap and currently trading far below its fair value. Report Links: Battle Of The Central Banks - June 21, 2019 A Contrarian View On The Australian Dollar - May 24, 2019 Take Out Some Insurance - May 3, 2019 Australian Dollar Chart II-9AUD Technicals 1
AUD Technicals 1
AUD Technicals 1
Chart II-10AUD Technicals 2
AUD Technicals 2
AUD Technicals 2
Recent data in Australia have been mixed: Building approvals keep contracting by 28.5% year-on-year in July. Australian Industry Group (AiG) manufacturing index increased to 53.1 in August. The services index soared to 51.4 in August from a previous reading of 43.9. Current account balance shifted to A$5.9 billion in Q2, the first surplus since 1975. Retail sales contracted by 0.1% month-on-month in July. GDP growth slowed down to 1.4% year-on-year in Q2, the lowest rate in over a decade. Exports and imports both grew by 1% and 3% month-on-month respectively. Trade surplus narrowed marginally to A$7.3 million. AUD/USD increased by 1.4% this week. While Q2 GDP growth rate continued to soften, the current account and PMI data are showing tentative signs of a recovery. On Monday, the RBA kept interest rates unchanged at 1%. In the press release, the Bank acknowledged that low income growth and falling house prices limited household consumption in the first half of the year. Going forward, the tax cuts, infrastructure spending, housing market stabilization, and a healthy resources sector should all support the Australian economy, and put a floor under the Aussie dollar. Report Links: A Contrarian View On The Australian Dollar - May 24, 2019 Beware Of Diminishing Marginal Returns- April 19, 2019 Not Out Of The Woods Yet - April 5, 2019 New Zealand Dollar Chart II-11NZD Technicals 1
NZD Technicals 1
NZD Technicals 1
Chart II-12NZD Technicals 2
NZD Technicals 2
NZD Technicals 2
Recent data in New Zealand have been negative: Consumer confidence improved slightly to 118.2 in August. Building permits continued to contract by 1.3% month-on-month in July. Terms of trade increased to 1.6% in Q2. NZD/USD increased by 1.2% this week. In a Bloomberg interview earlier this week, the New Zealand finance minister Grant Robertson expressed his confidence on the fundamentals of the domestic economy, especially the low unemployment rate and sound wage growth. The largest downside risk remains the global trade and manufacturing slowdown. As a small open economy, New Zealand is ultimately vulnerable to exogenous factors, especially those related to its large trading partners including U.S., China, and Australia. On the policy side, the finance minister believes that there is “still room to move” in terms of monetary policy. Report Links: USD/CNY And Market Turbulence - August 9, 2019 Where To Next For The U.S. Dollar? - June 7, 2019 Not Out Of The Woods Yet - April 5, 2019 Canadian Dollar Chart II-13CAD Technicals 1
CAD Technicals 1
CAD Technicals 1
Chart II-14CAD Technicals 2
CAD Technicals 2
CAD Technicals 2
Recent data in Canada have been mostly negative: Annualized Q2 GDP growth jumped from 0.5% to 3.7% quarter-on-quarter, well above estimates. Bloomberg Nanos confidence fell slightly from 57 to 56.4. Markit manufacturing PMI fell to 49.1 in August, right after a small rebound in July to 50.2. Trade deficit widened to C$1.12 billion in July. USD/CAD fell by 0.5% this week. On Wednesday, BoC held its interest rate unchanged at 1.75%, as widely expected. In its monetary policy statement, the BoC sounded cautiously dovish, and expects economic activity to slow in the second half of the year amid global growth worries. The strong Q2 rebound was mostly driven by cyclical energy production and robust export growth, which could be temporary given the current market volatility. The rate cut probability next month is currently at 40%. Report Links: Portfolio Tweaks Into Thin Summer Trading - July 5, 2019 On Gold, Oil And Cryptocurrencies - June 28, 2019 Currency Complacency Amid A Global Dovish Shift - April 26, 2019 Swiss Franc Chart II-15CHF Technicals 1
CHF Technicals 1
CHF Technicals 1
Chart II-16CHF Technicals 2
CHF Technicals 2
CHF Technicals 2
Recent data in Switzerland have been positive: KOF leading indicator was unchanged at 97 in August. Real retail sales grew by 1.4% year-on-year in July, up from the previous 0.7%. Manufacturing PMI increased to 47.2 in August, up from 44.7 in the previous month. Headline inflation remained muted at 0.3% year-on-year in July. GDP yearly growth slowed to 0.2% in Q2, from a downwardly-revised 1% in Q1. USD/CHF fell by 0.2% this week. We remain positive on the Swiss franc. The global economic slowdown and increasing worries about a near-term recession remain tailwind for the safe-haven franc. Report Links: What To Do About The Swiss Franc? - May 17, 2019 Beware Of Diminishing Marginal Returns - April 19, 2019 Balance Of Payments Across The G10 - February 15, 2019 Norwegian Krone Chart II-17NOK Technicals 1
NOK Technicals 1
NOK Technicals 1
Chart II-18NOK Technicals 2
NOK Technicals 2
NOK Technicals 2
Recent data in Norway have been mostly negative: Retail sales increased by 0.9% year-on-year in July. Current account surplus plunged by 60% from NOK 73.1 billion to NOK 30.6 billion in Q2, the lowest since Q4 2017. USD/NOK fell by 1.3% this week. The rebound in oil prices this week has supported petrocurrencies. On the supply side, the production discipline is likely to be maintained. On the demand side, fiscal stimulus globally should revive overall demand. A potential weaker USD should also support oil prices in the second half of the year, which will be bullish for the Norwegian krone. Report Links: Portfolio Tweaks Into Thin Summer Trading - July 5, 2019 On Gold, Oil And Cryptocurrencies - June 28, 2019 Currency Complacency Amid A Global Dovish Shift - April 26, 2019 Swedish Krona Chart II-19SEK Technicals 1
SEK Technicals 1
SEK Technicals 1
Chart II-20SEK Technicals 2
SEK Technicals 2
SEK Technicals 2
Recent data in Sweden have been mixed: Manufacturing PMI increased slightly to 52.4 in August, from 52 in the previous month. Current account surplus narrowed from SEK 63 billion to SEK 37 billion in Q2. Industrial production increased by 3.2% year-on-year in July. Manufacturing new orders increased by 0.4% in July compared with last month. However, on a year-on-year basis, it fell by 2.2%. The Swedish krona rallied this week, appreciating by 1.4% against USD. The Riksbank held its interest rate unchanged at -0.25% this Thursday, and stated that they still plan to raise interest rates this year or early next, but at a slower pace than the previous forecast. Report Links: Where To Next For The U.S. Dollar? - June 7, 2019 Balance Of Payments Across The G10 - February 15, 2019 A Simple Attractiveness Ranking For Currencies - February 8, 2019 Trades & Forecasts Forecast Summary Core Portfolio Tactical Trades Limit Orders Closed Trades
HighlightsEuropean fiscal stimulus will not drive European equity outperformance – Europe needs China to open the stimulus taps.Our mega-theme of European integration continues – the continent is politically stable.The U.S.-China trade war is an opportunity for Europe. Any Sino-American trade deal is unlikely to resolve tech disputes. Go long European tech stocks versus American.The euro has room to grow as a global reserve currency given the dollar’s mounting structural flaws. Look for an opportunity to go long EUR/USD on a strategic basis within the near future.FeatureTalk of European fiscal stimulus is accelerating as investors look for reasons to take advantage of depressed European valuations (Chart 1) and traditional late-cycle outperformance relative to the U.S. (Chart 2). We are skeptical of the thesis. Chart 1European 'Cheapness' An Obvious Inducement
European 'Cheapness' An Obvious Inducement
European 'Cheapness' An Obvious Inducement
Chart 2Euro Stocks Outperform Late In The Cycle
Euro Stocks Outperform Late In The Cycle
Euro Stocks Outperform Late In The Cycle
Europe is a price taker, not a price maker, when it comes to global growth. In order for investors to generate alpha from an overweight Europe position, the rest of the world needs to pick up the slack and reverse the current decline in economic fundamentals. That will require policy action on the behalf of the Fed, the Trump administration, and – most relevant to Europe – Chinese fiscal policy.That said, long-term investors should start thinking about increasing exposure to Europe. Not only is the continent well priced relative to the rest of the world, but it may have two more things going for it. First, political risks remain low. Second, Europe stands to gain in any prolonged China-U.S. confrontation. The flipside risk is that it stands to lose enormously in any temporary resolution as well.Europe Is A Derivative – Not A Source – Of Global Growth…Despite accounting for 16% of global GDP, the Euro Area generates an ever-shrinking proportion of the annual incremental change in global GDP (Chart 3). This is not surprising, given that the world has undergone significant transformation due to China’s industrialization and the growth of EM economies. Chart 3Europe’s Contribution To Global Growth Declining
Europe: Not A Price Maker
Europe: Not A Price Maker
China’s imports today drive Euro Area manufacturing PMI broadly and Chinese retail sales drive German manufacturing orders specifically (Chart 4). As such, it is critically important to watch Chinese total social financing (TSF) impulse, which closely leads Europe’s exports to China by six months (Chart 5). Chart 4Europe And Germany Rely On China
Europe And Germany Rely On China
Europe And Germany Rely On China
Chart 5China's Credit Cycle Drives EU Exports
China's Credit Cycle Drives EU Exports
China's Credit Cycle Drives EU Exports
The problem is that the Chinese credit impulse has only tepidly recovered and implies more downside to European exports ahead. In addition, hopes of a rebound in Chinese retail sales have been dashed (Chart 6). The jump in auto sales in June was the result of heavy discounts offered by manufacturers and dealers to clear inventory before new emission standards came into effect on July 1. Due to the frontloading, car sales are now declining in what is traditionally an off-season for car purchases in China. While the worst may be over, weakness could linger for months. Chart 6China's Retail Sales Flashing Red
China's Retail Sales Flashing Red
China's Retail Sales Flashing Red
The bottom line is that without an upturn in global growth, Europe will remain in the doldrums. The good news is that BCA’s Chief Strategist Peter Berezin expects precisely such a development in the second half of 2019.1 The bad news is that Chinese credit stimulus appears to be weighed down by a combination of impaired transmission mechanisms and policymaker unwillingness to launch an old-school credit orgy (Chart 7). This is creating a highly unusual – for this cycle – development where China is not playing its usual counter-cyclical role amidst the global manufacturing cycle (Chart 8). Chart 7China's Credit Stimulus Restrained Thus Far
China's Credit Stimulus Restrained Thus Far
China's Credit Stimulus Restrained Thus Far
Chart 8Beijing Goes On Strike As Global Spender
Beijing Goes On Strike As Global Spender
Beijing Goes On Strike As Global Spender
Without more Chinese stimulus, European fiscal spending won’t be that meaningful.As such, it is difficult to get excited about European growth. As we discussed in last week’s missive, Europe is moving gingerly towards more fiscal spending. However, it has already done so this year, with fiscal thrust at 0.46% of GDP, the highest figure since 2009 (Chart 9). Did anyone notice? Not really. Chart 9Headwinds Overpower EU's Strong Fiscal Thrust
Headwinds Overpower EU's Strong Fiscal Thrust
Headwinds Overpower EU's Strong Fiscal Thrust
Moreover Euro Area countries have to submit their 2020 budgets in early Q4 to the European Commission. It is unlikely that these proposals will be meaningful, given that there is not yet enough panic to spur massive stimulus.Bottom Line: Yes, Europe will provide more fiscal spending in 2020. But it will remain at the mercy of global growth given its high-beta nature.…But At Least It Is Not Falling Apart! That said, not all is disappointing on the Old Continent. For one, the aforementioned fiscal thrust at least prevented a deeper slowdown this year – and the drop-off in thrust next year will be less dramatic as budgets turn more accommodative.Meanwhile political risk is falling. Anti-establishment parties are either cleaning up their act, putting on a tie, and becoming part of the establishment, or they are losing power. Our long-held thesis that European integration would persist into the next decade remains well-supplied with empirical evidence.2On the Euroskepticism front, much of the hype today surrounds the collapse of the Five Star Movement (M5S) coalition with the League in Italy. The formerly Euroskeptic M5S has shed its critique of European integration and has decided to partner with the center-left and pro-establishment Democratic Party (PD).This is merely the tip of the iceberg. Several key developments throughout 2019 have signaled to investors that the Euroskeptic moment has passed. For a plethora of data and polling to support this view, please refer to our May report on the European Parliament (EP) election. Here we merely survey the latest developments:European Parliament Election: As expected in our EP election forecast, the May contest was a non-event. Support for the euro and the EU is trending higher (Chart 10 and 11), and 73% of Euroskeptic seats are held by Eastern European or U.K. MEPs (Chart 12), both irrelevant for EU policy.3 Chart 10Even Italy Swings In Favor Of Euro
Even Italy Swings In Favor Of Euro
Even Italy Swings In Favor Of Euro
Chart 11Public Opinion Supports The Union
Public Opinion Supports The Union
Public Opinion Supports The Union
Chart 12Euroskepticism Overstated
Europe: Not A Price Maker
Europe: Not A Price Maker
Random Elections: We rarely cover politics in Denmark or Finland, but the two Nordic countries have been at the forefront of the anti-establishment, right-wing, evolution in Europe. As such, the elections in Denmark (in June) and Finland (in April) were relevant. The Danish People’s Party (DPP) – one of the original “People’s Parties,” founded in 1995 – was massacred, losing 21 seats in the 179-seat legislature.In Finland, the moderately Euroskeptic Finns similarly saw a disappointing – if not as disastrous – performance.Finally, Austrian election on September 29 will likely see the other Europe’s prominent right-wing, Euroskeptic, party – the Freedom Party of Austria (FPO) – decline below 20% for the first time since 2008. Chart 13Macron Recovering In Polls
Macron Recovering In Polls
Macron Recovering In Polls
France: Our high conviction view in February that the Yellow Vest protest would ultimately dissipate proved correct. President Emmanuel Macron has also seen a recovery in polling. Although tepid, at least he appears to be diverging from the trajectory of his disastrously unpopular predecessor François Hollande (Chart 13).The good news for Macron is that he continues to lead Marine Le Pen by double digits in the theoretical 2022 second round. While this represents a considerable improvement for Le Pen from her 2017 performance, the fact is that she has had to adjust her policies and rebrand the National Front in order to close the gap with Macron. The party is now called the National Rally and has publicly revised its stance towards both the EU and the euro.4The events in France, Denmark, Finland, and Austria have largely gone unnoticed amidst the China-U.S. trade war, attacks against Federal Reserve independence, and general breakdown in global institutions and paradigms. But they reveal that Euroskepticism in Europe is evolving from a definitive one – in or out – to a much more nuanced position.For students of history, this is not a surprise. European integration has always been a push-pull process. Charles de Gaulle famously caused a total breakdown in integration during the 1965 “Empty Chair Crisis” when France recalled its representative in Brussels and refused to take its seat on the Council.De Gaulle was a Euroskeptic in so far as he believed that European integration was a national, not a supra-national process.5 It could proceed apace, but only if controlled by national capitals. As such, he warred with the Commission all the time. However, de Gaulle did not want to eliminate European integration as he understood its geopolitical and economic imperative. He simply wanted to shape the process to fit French interests.Absolutist Euroskepticism – the idea that all European institutions ought to be replaced by national ones – is an alien idea to the post-World War Two continent, one imported from the nineteenth century. The irony of Brexit, therefore, is that the most vociferous supporters of an absolute end to the EU integrationist project are now abandoning their fellow absolutists on the continent.Geopolitical and structural factors are also pushing European Euroskeptics to evolve from absolutists to modern-era Gaullists. We have identified most of these factors before, but they are worth repeating:Europe has a geopolitical imperative to integrate. In a multipolar world dominated by global powers like the U.S. and China – and with Russia, India, Japan, Iran, and Turkey playing an increasingly independent role – European states are not large enough on their own to defend their economic and geopolitical interests. Chart 14Geopolitical Forces Behind Integration
Geopolitical Forces Behind Integration
Geopolitical Forces Behind Integration
The purpose of integration is to aggregate the geopolitical power of Europe’s individual states amidst rising global multipolarity. Chart 14 is a stylized visualization of what European integration is attempting. It illustrates that the average BCA Geopolitical Power Index (GPI) score of an EMU-5 country is well below that of a BRIC state.6 By aggregating their geopolitical power, European states retain some semblance of relevance in the world.Obviously this is merely a thought experiment as European integration is not aggregation and never will be. Not only is aggregation politically unfeasible, but there is also a lot of double counting in simply adding GPI scores of European states. Nonetheless, the point is that European countries are asymptotically moving from the average to the aggregate score. Chart 15No Basis For Fascism In Great Recession
No Basis For Fascism In Great Recession
No Basis For Fascism In Great Recession
No, the Nazis are not coming. Europe has managed to recover from a generational financial crisis. Pessimists point to the depth of the crisis to explain why Europe is unsustainable, with angst matching the severity of the downturn. However, analogizing to the 1930s is folly. First, Europe’s shared memories of the ravages of populism act as antibodies preventing precisely the same infection from breaking out on the continent.7 Second, the European financial crisis was simply nowhere close to the depth of the Great Depression that rocked Germany as it descended into National Socialism (Chart 15). As for the argument that the European Central Bank fed populism through unorthodox policy easing, the tide of populism would have been much more formidable if Europe had been allowed to sink into deeper recession and deflation.Europeans are just not that desperate. Europe scores much better than the U.S. (or the U.K.) when it comes to the balance between the median income and middle-income share of total population. Chart 16 shows that most Euro Area economies have around 70% of their population in the middle-income bracket. Those that fall short nonetheless hug the line of best fit closely (Italy, Spain, Greece, and the Baltic States). The U.S., on the other hand, has one of the highest median income levels, but with barely 50% of the population considered in the middle-income. Meaning that a lot of the people below the median line are far below it. This is a recipe for actual populist political outcomes (President Trump), as opposed to artificial ones (Italy). Chart 16U.S. At Greater Risk Of Populism Than EU
Europe: Not A Price Maker
Europe: Not A Price Maker
European populism is artificial, U.S. populism is actual.What of the risks in Europe? For example, investors are concerned about mounting Target2 imbalances. Here we agree with our colleague Dhaval Joshi, who has pointed out that growing imbalances in Europe’s monetary system will only further constrain centrifugal forces among the nations.Target2 has seen a steady outflow of Italian cash to German banks as the ECB’s QE saw respective central banks purchase domestic bonds (Chart 17). This means that the Bank of Italy holds assets – BTPs – denominated in Italian euros, while the Bundesbank has a new liability to German banks denominated in German euros. EMU dissolution would be too painful due to this mismatch. Target2 is therefore not a threat to the EMU, but rather a Gordian Knot that can only be unraveled with immense pain and violence.That said, there may be an upcoming headline risk in Europe: the end of Chancellor Merkel’s reign. In our view, Merkel’s role in stabilizing Europe is greatly overstated. Her dithering and lack of conviction caused several crises to descend into chaos amidst the sovereign debt imbroglio. As such, an infusion of new blood will be positive for Europe. The populist threat is also overstated, with the Alternative for Germany (AfD) performing relatively tepidly in the polls. In fact, the liberal, Europhile, Greens are starting to gain votes (Chart 18). As such, an early election in Germany would create volatility and uncertainty but would not undermine our secular thesis on Europe. Chart 17Gordian Knot Supports Integration
Gordian Knot Supports Integration
Gordian Knot Supports Integration
Chart 18Germany Not Falling To Populism
Germany Not Falling To Populism
Germany Not Falling To Populism
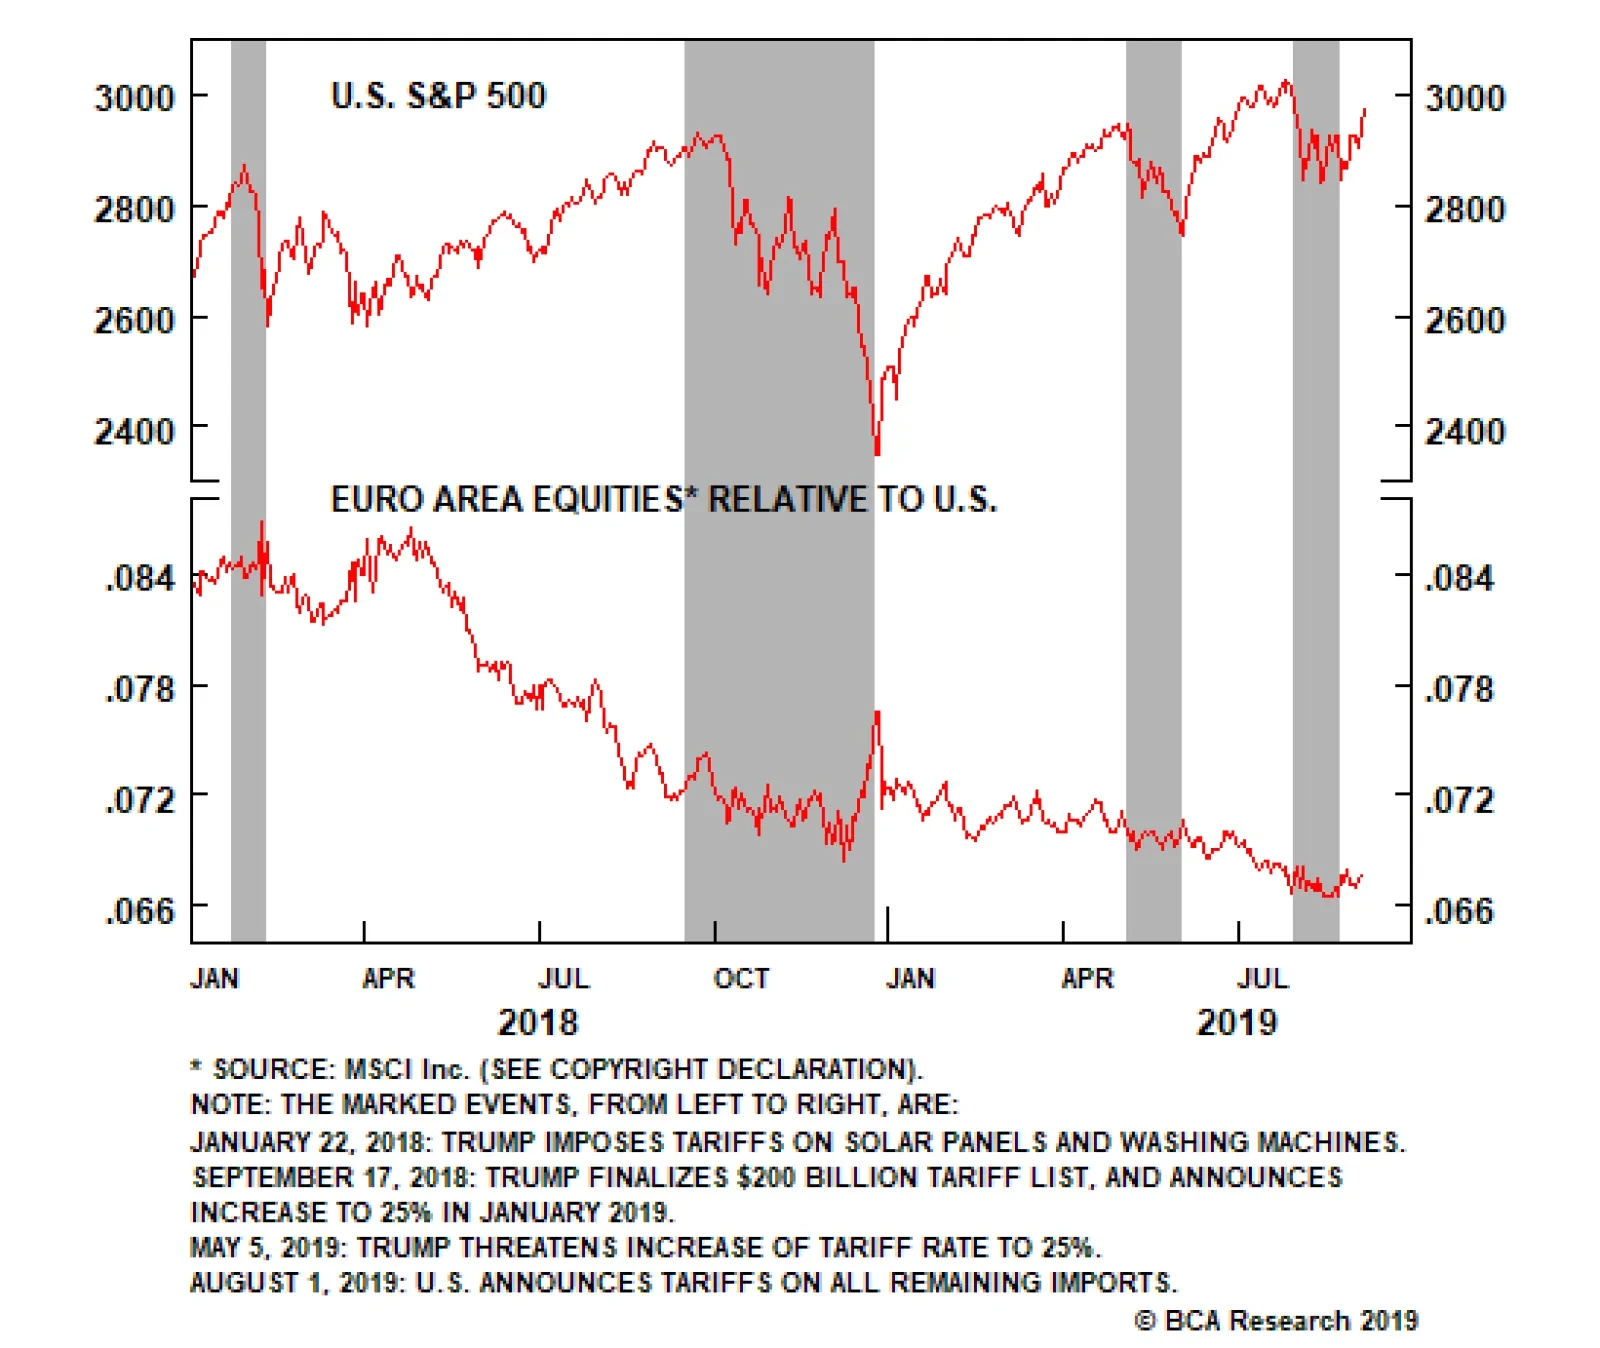
Bottom Line: There is an ever-strengthening case for the sustainability of the Euro Area and European integration well into the next decade.From Geopolitical Gambit To A Geopolitical Safe-Haven?At this point, we have built a strong case for why Europe will remain a high-beta play on global growth that is unlikely to collapse. As such, investors should plow into Europe when the rest of the world is doing well with confidence that the continent will not descend into chaos.The U.S.- China trade war offers an intriguing opportunity for Europe.This is largely underwhelming as an investment thesis. Could there be something more exciting to the story given a slew of well-known headwinds to European growth from demographics, low productivity, and regulatory malaise?The trade war between the U.S. and China does offer an intriguing opportunity for Europe.There appears to be an interesting development where European equities outperform those of the U.S. during periods of trade war turbulence (Chart 19). The outperformance is not major, but it is highly counterintuitive. Chart 19Europe Outperforms Amid Trade War Shocks
Europe Outperforms Amid Trade War Shocks
Europe Outperforms Amid Trade War Shocks
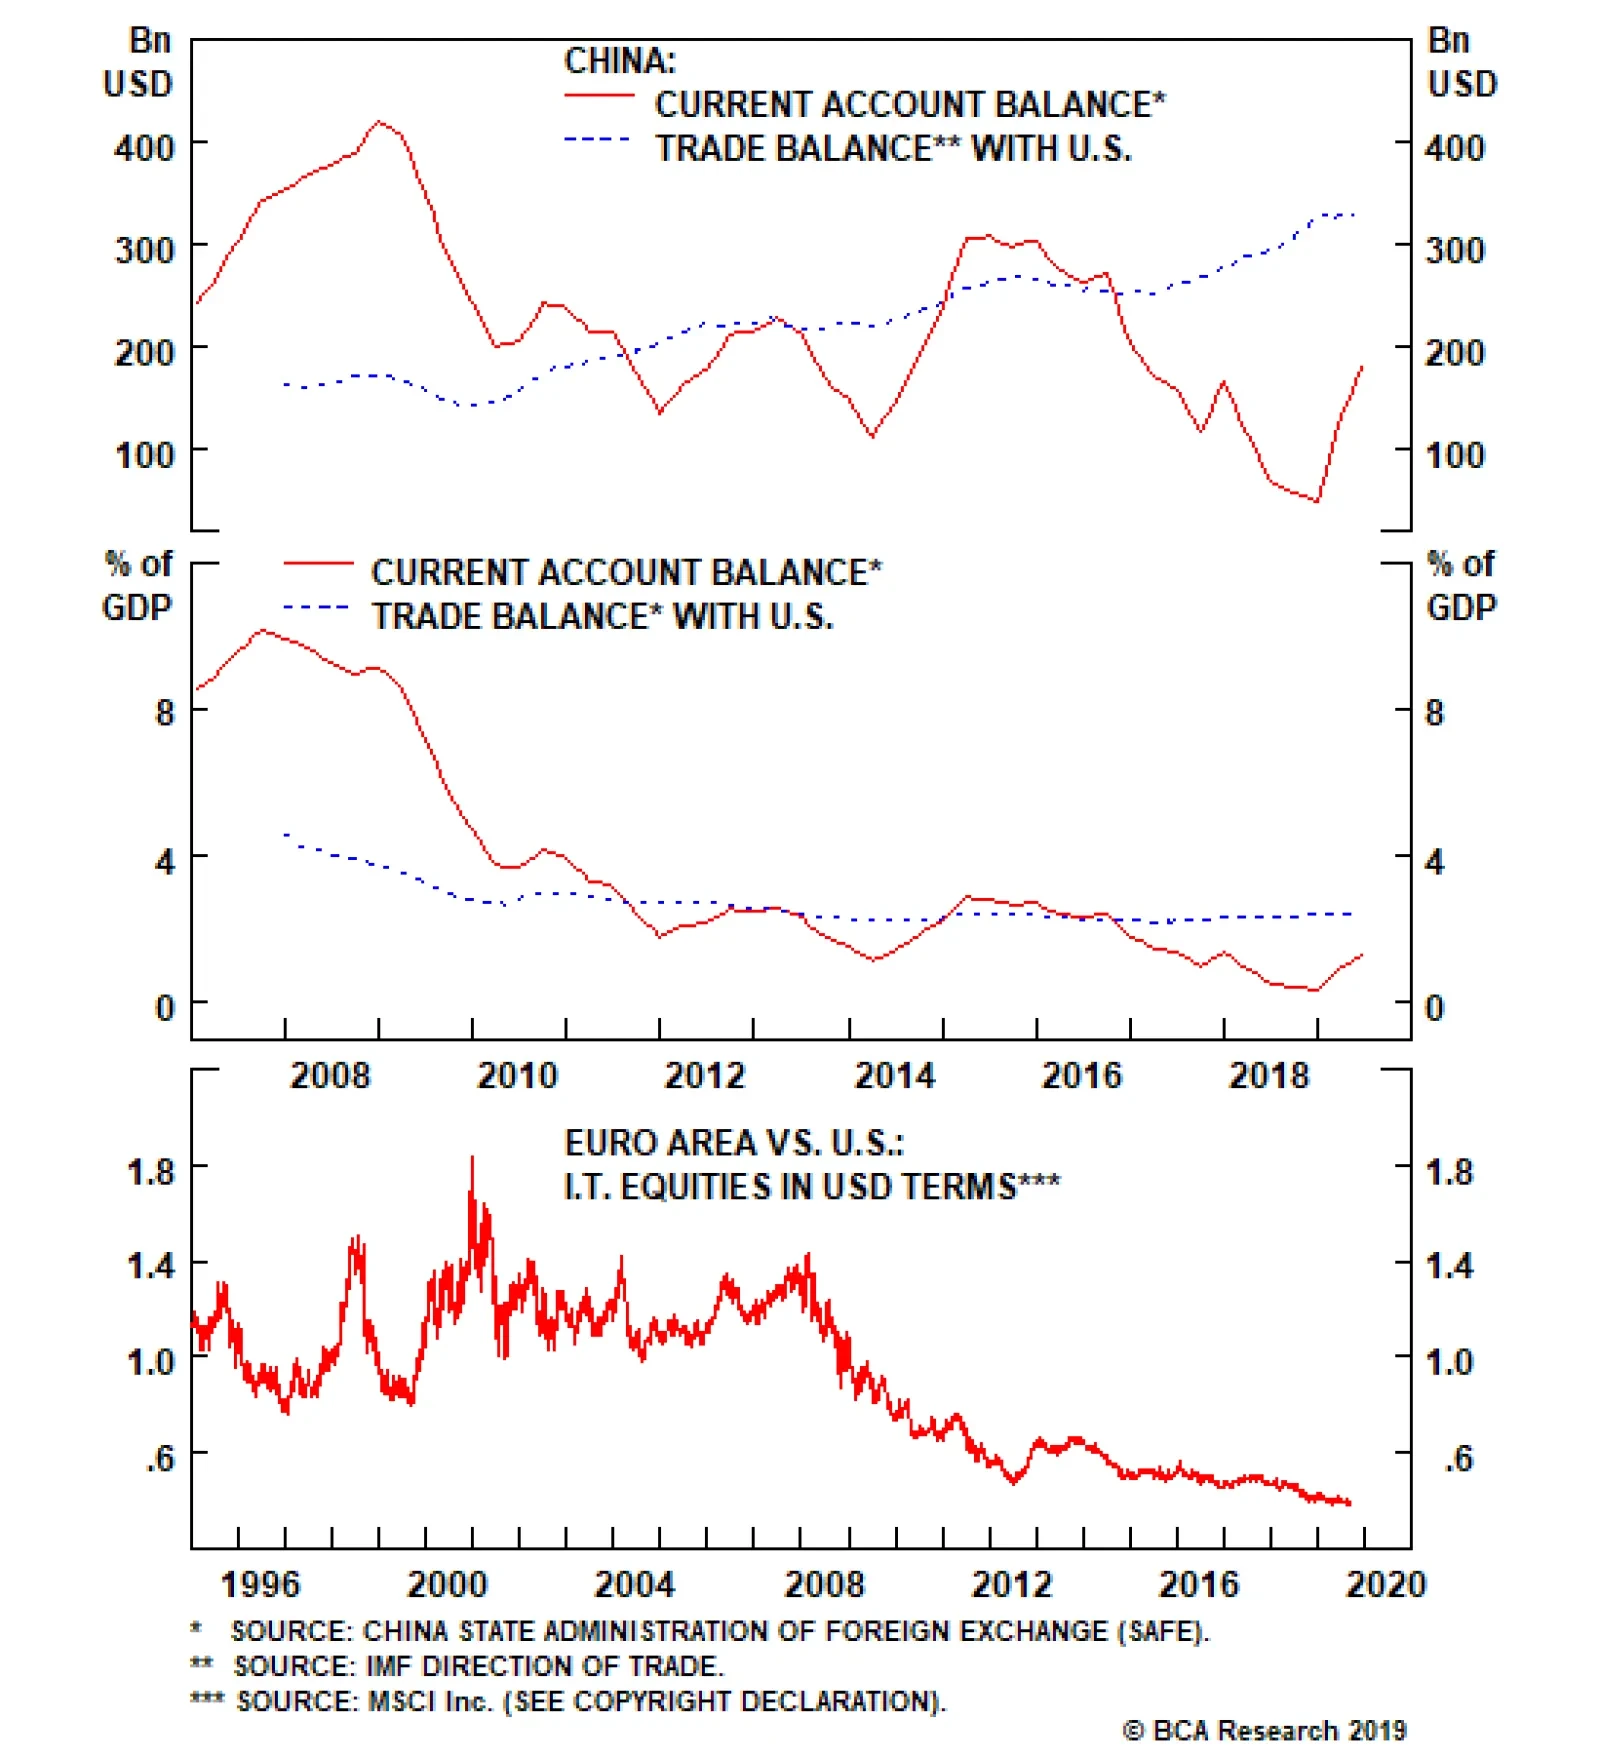
As is understood, Europe is a high-beta play on global growth. Presumably, investors should abandon high-growth derivative plays when trade war accelerates. It is one of the reasons that EM equities and EM FX suffer whenever trade war accelerates.So why is Europe different? Because European exporters generally compete with their American counterparts (and Japanese and South Korean) for Chinese market share. And if China retaliates against U.S. companies, European companies stand to benefit, potentially massively.Take Boeing and Airbus. Boeing expects China to demand 7,700 new airplanes over the next two decades, an order valued at $1.2 trillion. It would be disastrous to the U.S. airline industry if the entirety of that order went to Airbus and its subsidiaries.8 According to the latest news reports, China has slowed down its airplane procurement to a crawl as it awaits the outcome of the dispute with the U.S.9 It is predictably using the procurement decision as leverage in the negotiations. Chart 20Europe To Lose If China Strikes U.S. Deal
Europe To Lose If China Strikes U.S. Deal
Europe To Lose If China Strikes U.S. Deal
Yet this “substitution effect” thesis is a double-edged sword for Europe. A resolution of the trade war between the U.S. and China would likely include a massive purchase of U.S. agricultural, commodity, and manufacturing goods: the so-called “Beef and Boeings” deal. China bears often point out that such a massive purchase will negatively impact China’s current account, which is barely in surplus thanks to China’s trade surplus with the U.S. (Chart 20). This is false. Chinese policymakers are not suicidal. The last thing China needs is a balance of payments crisis due to a trade deal with the U.S.China would simply rob Peter to pay Paul, pulling its orders of soy from Brazil and Airbus from Europe in order to make a deal with the U.S. As such, it is highly likely that European capital goods exporters would suffer in any trade war resolution between China and the U.S.That said, a substantive trade deal that resolves all U.S.-China tensions is extremely unlikely. The U.S. and China are not just commercial rivals, they are also geopolitical rivals. As such, the tech conflict between the U.S. and China will continue well beyond any resolution of the trade war. This could create an opportunity for Europe’s traditionally beleaguered tech stocks to finally outperform their American counterparts (Chart 21). Chart 21Go Long EU Tech Versus U.S. Tech
Go Long EU Tech Versus U.S. Tech
Go Long EU Tech Versus U.S. Tech
Bottom Line: A deterioration of the U.S.-China trade relationship would be a boon for European exporters. Short of a total breakdown of U.S.-China trade, however, European tech stocks may finally begin outperforming their U.S. counterparts thanks to the open distrust between U.S. and China.In addition, U.S. technology firms are likely going to face a slew of regulatory challenges over the next decade. While not necessarily negative, these challenges will nonetheless create new headwinds for the sector.10 We are therefore initiating a structural theme of being long European tech relative to U.S.Investment ImplicationsAre there any broader themes to be extracted from the combined geopolitical forecasts presented in this report? Europe will not collapse, and it may benefit from the souring of U.S.-China geopolitical and economic relations.Long euro is an obvious theme. As our colleague Dhaval Joshi has recently pointed out, the chasm between monetary policies of the Fed and the ECB has become a major geopolitical risk. This is because it has depressed the euro versus the dollar by at least 10 percent – based on the ECB’s own competitiveness indicators. The exchange rate distortion stemming from polarized monetary policies is the culprit for the euro area’s huge trade surplus with the United States (Chart 22).In the short term, EUR/USD may have reached its practical (and geopolitically acceptable) lows. Yes, the ECB is readying another round of monetary stimulus on September 12, but the fiscal policy counterpart is likely to be tepid and thus fail to (yet again) take advantage of historically depressed borrowing costs on the continent. The September 12 ECB meeting may therefore be a “sell the rumor, buy the news” event for EUR/USD. Chart 22Monetary Policy Accounts For Bilateral Surplus
Monetary Policy Accounts For Bilateral Surplus
Monetary Policy Accounts For Bilateral Surplus
Chart 23U.S. Rivals Buying Gold, Ditching Dollar
U.S. Rivals Buying Gold, Ditching Dollar
U.S. Rivals Buying Gold, Ditching Dollar
On the more cyclical and secular horizon, we see an opportunity for the euro to reestablish some of its lost reserve currency status due to the geopolitical conflict between China and the U.S. Washington’s willingness to use trade and financial sanctions for geopolitical benefit has given pause to central bank authorities around the world in using dollars as a reserve currency. Purchases of gold for FX reserve have surged, particularly among America’s geopolitical rivals (Chart 23), as our colleague Chester Ntonifor has recently pointed out.As we argued in a report entitled “Is King Dollar Facing Regicide?” the euro has some catch-up potential. In 1990, the combined currencies of the countries that today comprise the Euro Area accounted for 35% of total composition of global currency reserves. Today, the figure is merely 20% (Chart 24). Chart 24Euro Has Plenty Of Room To Grow As Reserve Currency
Europe: Not A Price Maker
Europe: Not A Price Maker
Could Europe supply the world with enough euros to replace USD as a reserve currency? This is highly unlikely. However, at the margin, an expansion of European liquidity is possible, particularly if Germany finally learns to love fiscal expansion and if European policymakers capitulate on the issuance of Eurobonds. However, such a lack of euro liquidity is not negative for the euro. The world could soon experience a situation where the demand for non-USD liquid assets dramatically increases due to the politicization of America’s reserve currency status while the supply of USD-alternatives remains relatively low. This should be positive for the only true alternative to the USD as a global reserve currency: the euro.As such, we will be looking to initiate a strategic long EUR/USD position, potentially sometime this fall as the ECB and FOMC meetings take place and the risk of a no-deal Brexit is averted. We do not expect the massive monetary policy divergence between Europe and the U.S. to continue, while the Euro Area’s political stability, and the broader geopolitical demand for a non-USD reserve currency, create more long-term tailwinds for the euro.Marko PapicConsulting Editor, BCA Research Chief Strategist, Clocktower GroupHousekeepingOur high-conviction view that no-deal Brexit odds were overrated has been confirmed by the recent events in the U.K. parliament. We are going long GBP-USD with a tight stop-loss of 3%. Since we expect further volatility – with an election likely and the Conservative Party performing well in the polls and monopolizing the Brexit vote in a first-past-the-post system – we will sell at the $1.30 mark.Footnotes1 Please see Global Investment Strategy, “Trade War: The Storm Before The Calm,” dated August 9, 2019, available at gis.bcaresearch.com.2 Please see Geopolitical Strategy, “Europe's Geopolitical Gambit: Relevance Through Integration,” dated November 3, 2011, available at gps.bcaresearch.com.3 The reason we extracted the U.K. Euroskeptics from the calculation is because with Brexit nigh, the U.K. members of European Parliament are no longer policy relevant. As for Central European Euroskeptics, we extracted them because they are irrelevant for EU policy as they hail from member states that – in truth – nobody seriously thinks would ever leave the EU.4 Ahead of the May EP election, National Rally electoral platform focused on “local, ecological, and socially responsible production." The party advocates combining environmentalism with protectionism, creating an ecological custom barrier at the EU’s doorstep which would defend the European market from products manufactured or produced with less environmentally friendly processes. On the matters of EU membership, the party now advocates a more traditionally Euroskeptic line, a purely Gaullist form of Euroskepticism that seeks to curb – or, at best, abolish – the EU Commission and replace its legislative prerogative by giving the Council of the EU all legislative powers. 5 Please see Julian Jackson, De Gaulle (Cambridge, MA: Harvard UP, 2018).6 We chose to use EMU-5 in the chart because it focuses on the top-five economies in the Euro Area: France, Germany, Italy, Spain, and the Netherlands. If we focused on the overall average EMU score, even one we weighed by population, the results would be even more stark in terms of loss of importance.7 And, worryingly, the U.S. lacks precisely the same shared memory of how wild pendulum swings of polarization can descend into extreme nationalism or left-wing extremism.8 Airbus would not have the capacity to fulfill that entire order today. However, demand creates its own supply, giving Airbus a reason to surge capex and reap the profits.9 Please see Reuters, “Exclusive: Boeing CEO eyes major aircraft order under any U.S.-China trade deal.”10 Please see Geopolitical Strategy, “Is The Stock Rally Long In The FAANG?,” dated August 1, 2018 and “Surviving A Breakup: The Investor’s Guide To Monopoly-Busting In America,” dated March 20, 2019, available at gps.bcaresearch.com.
Highlights An inevitable and imminent U.K. general election will be one of the most unpredictable and ‘non-linear’ elections ever. This non-linearity makes it difficult to take a high-conviction view on sterling’s direction because a tiny vote swing in one direction or another could be the difference between a no-deal Brexit – and the pound below parity against the euro – or a solid coalition for remain – and the pound at €1.30. Instead, a good strategy is to buy sterling volatility on the announcement of the election. The easiest way to implement this is simultaneously to buy at-the-money call and put options (versus either the euro or dollar). In a soft Brexit or remain, the U.K. equity sectors most likely to outperform the overall market are real estate and general retailers. In a hard Brexit, a U.K. sector likely to outperform the overall market is clothing and accessories. Feature Chart of the WeekSterling Volatility Could Go Up A Lot
Sterling Volatility Could Go Up A Lot
Sterling Volatility Could Go Up A Lot
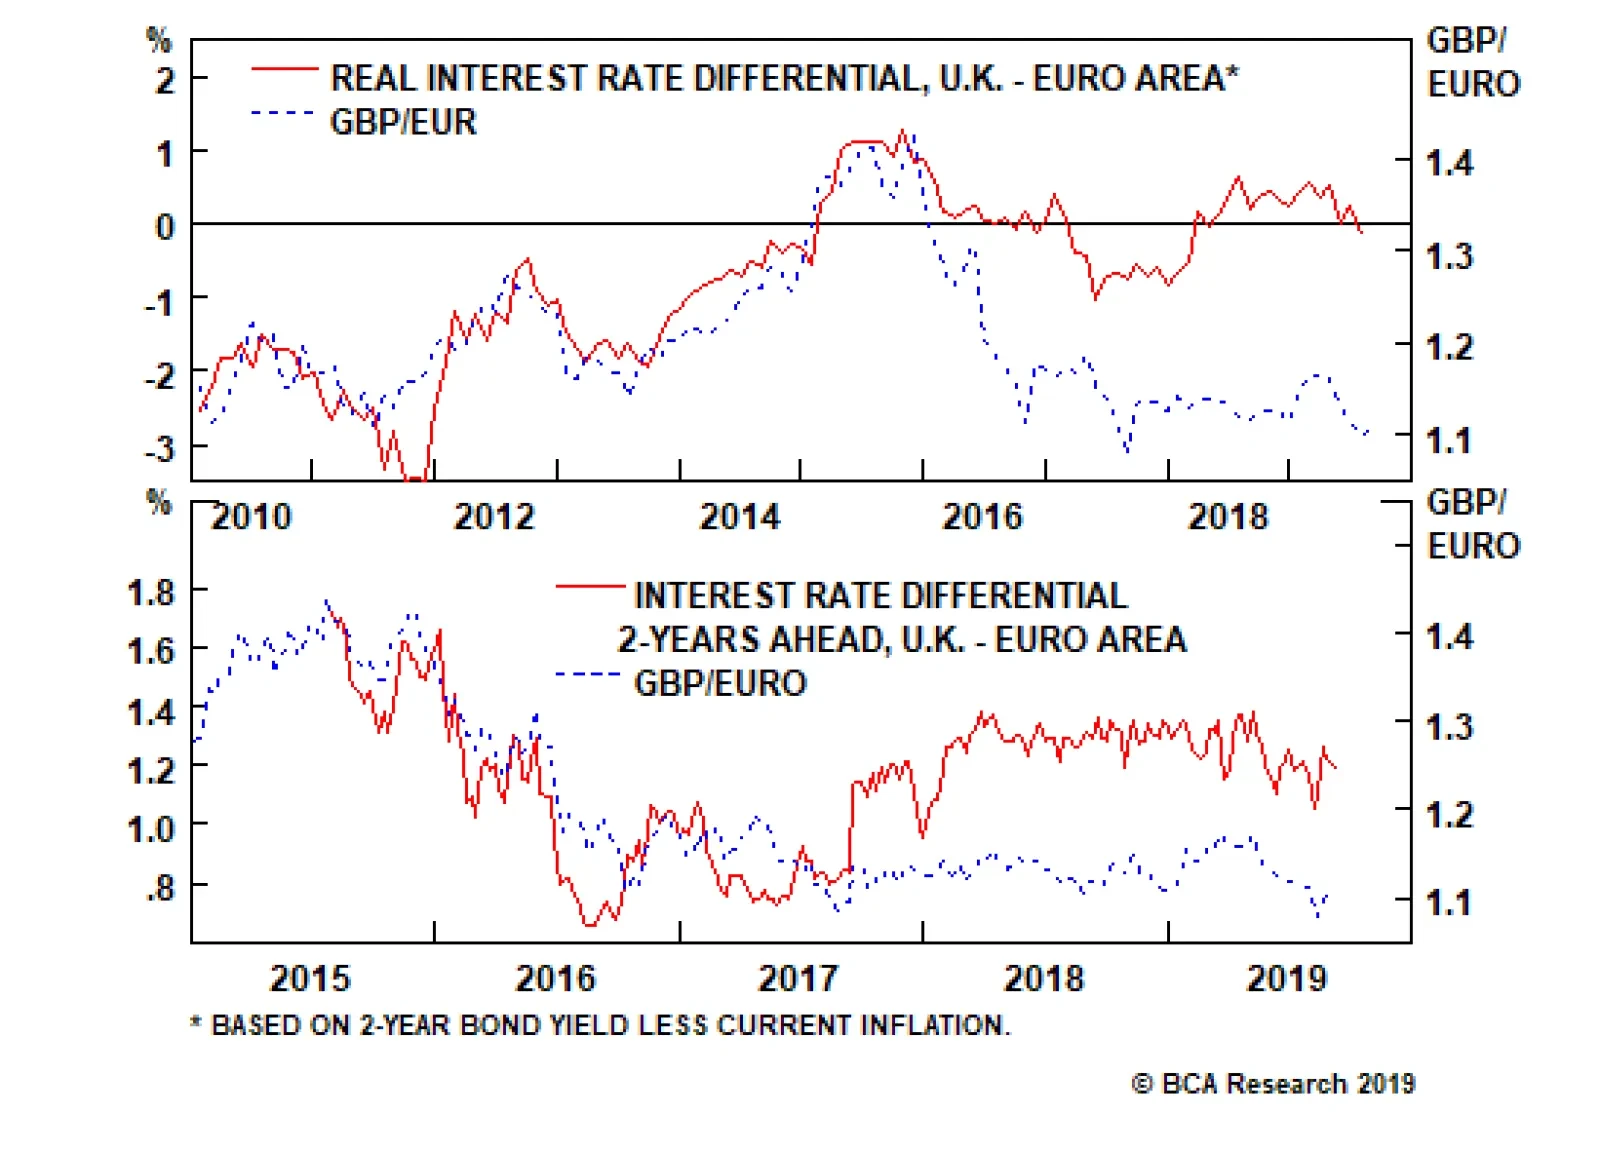
Lyndon B Johnson famously said that that the first rule of politics is to learn to count. A government is a lame duck if it does not have a majority of legislators to drive and set its policy. Fifty years on, LBJ’s namesake is learning this first rule of politics. Boris Johnson is running a minority U.K. government. The irony is that this makes it impossible for a pro-Brexit Johnson to pass legislation for the Brexit process itself! Ending the free movement of EU citizens was supposedly one of the biggest ambitions of the Brexit vote. But astonishingly, even after a no-deal Brexit, free movement would not end – because EU law continues to apply until its legal foundation is repealed. The U.K. government wanted to end free movement through a new law, the immigration bill, but the proposed legislation, along with several other key new laws, cannot make it through parliament. The Most Non-Linear Election Looms The only way out of the impasse is to change the parliamentary arithmetic via a snap general election. The trouble is that the outcome of such an election is near impossible to predict. This is because the U.K.’s first past the post electoral system is designed for a head-to-head between two dominant parties. But right now, there are four parties in play – from left to right: Labour, Liberal Democrat, Conservative, and Brexit. While in Scotland, the SNP is resurgent. Making the next U.K. general election one of the most unpredictable and ‘non-linear’ elections ever. The outcome of a snap general election is near impossible to predict. For example, in the recent Brecon and Radnorshire by-election, the 10 percent of votes that went to the Brexit party syphoned just enough ‘leave’ votes from the Conservatives to hand the seat to the Lib Dems. Repeated nationwide, such a swing could inflict mortal damage to the Conservatives. On the other hand, the staunchly pro-remain Lib Dems could also syphon crucial votes from a Labour party that is prevaricating on its Brexit policy. Understanding this, Johnson isn’t using the next election to resolve Brexit; quite the opposite, he is using Brexit to resolve the next election – in his favour – with the ancient strategy of ‘divide and rule’. Unite ‘leave’ by tacking to the hard right, and divide ‘remain’ between Labour, Lib Dem, Green, SNP, and Plaid Cymru. However, it is a very risky strategy. A small but critical rump of Brexit party voters are diehard anti-establishment rather than pure leave votes; furthermore, remainers almost certainly will vote tactically as they did in 2017 when they obliterated the Conservatives’ overall majority. For U.K. investments, the inevitable imminent election dominates all other considerations, as its outcome will determine the U.K.’s ultimate trading relationship with the EU and rest of the world, as well as establish the U.K’s overarching economic policy and strategy. But to reiterate, the outcome is highly non-linear. A tiny vote swing in one direction or another could be the difference between a no-deal Brexit – and the pound below parity against the euro – or a solid coalition for remain – and the pound at €1.30, as sterling’s ‘Brexit discount’ is unwound (Chart I-2 and Chart I-3). Chart I-2Sterling's Brexit Discount Is 15 Percent, Based On Real Interest Rate Differentials...
Sterling's Brexit Discount Is 15 Percent, Based On Real Interest Rate Differentials...
Sterling's Brexit Discount Is 15 Percent, Based On Real Interest Rate Differentials...
Chart I-3...And Expected Interest Rate ##br##Differentials
...And Expected Interest Rate Differentials
...And Expected Interest Rate Differentials
The non-linearity makes it difficult to take a high-conviction view on sterling’s direction. Instead, as soon as an election is announced, a good strategy is to buy sterling volatility. Although it has risen recently, sterling volatility is only in the foothills relative to the heights of 2016, meaning plenty of upside (Chart I-1). The easiest way to implement this is simultaneously to buy at-the-money call and put options (versus either the euro or dollar). Brexit Investments A common question we get is what are the most Brexit-impacted investments, in both directions? As mentioned, the most obvious is sterling. Relative to the established relationship with interest rate differentials prior to the Brexit vote in 2016, the pound now carries a Brexit discount of around 15 percent. For U.K. investments, the inevitable imminent election dominates all other considerations. Related to this, the FTSE100 has outperformed the Eurostoxx600. This is exactly as theory would suggest. The FTSE100 and Eurostoxx600 are just a collection of global multi-currency earning companies quoted in pounds and euros respectively. So when sterling weakens, the multi-currency earnings increase more in FTSE100 index terms than in Eurostoxx600 index terms, resulting in FTSE100 outperformance (Chart I-4). Chart I-4The FTSE100 Outperforms When Sterling Weakens
The FTSE100 Outperforms When Sterling Weakens
The FTSE100 Outperforms When Sterling Weakens
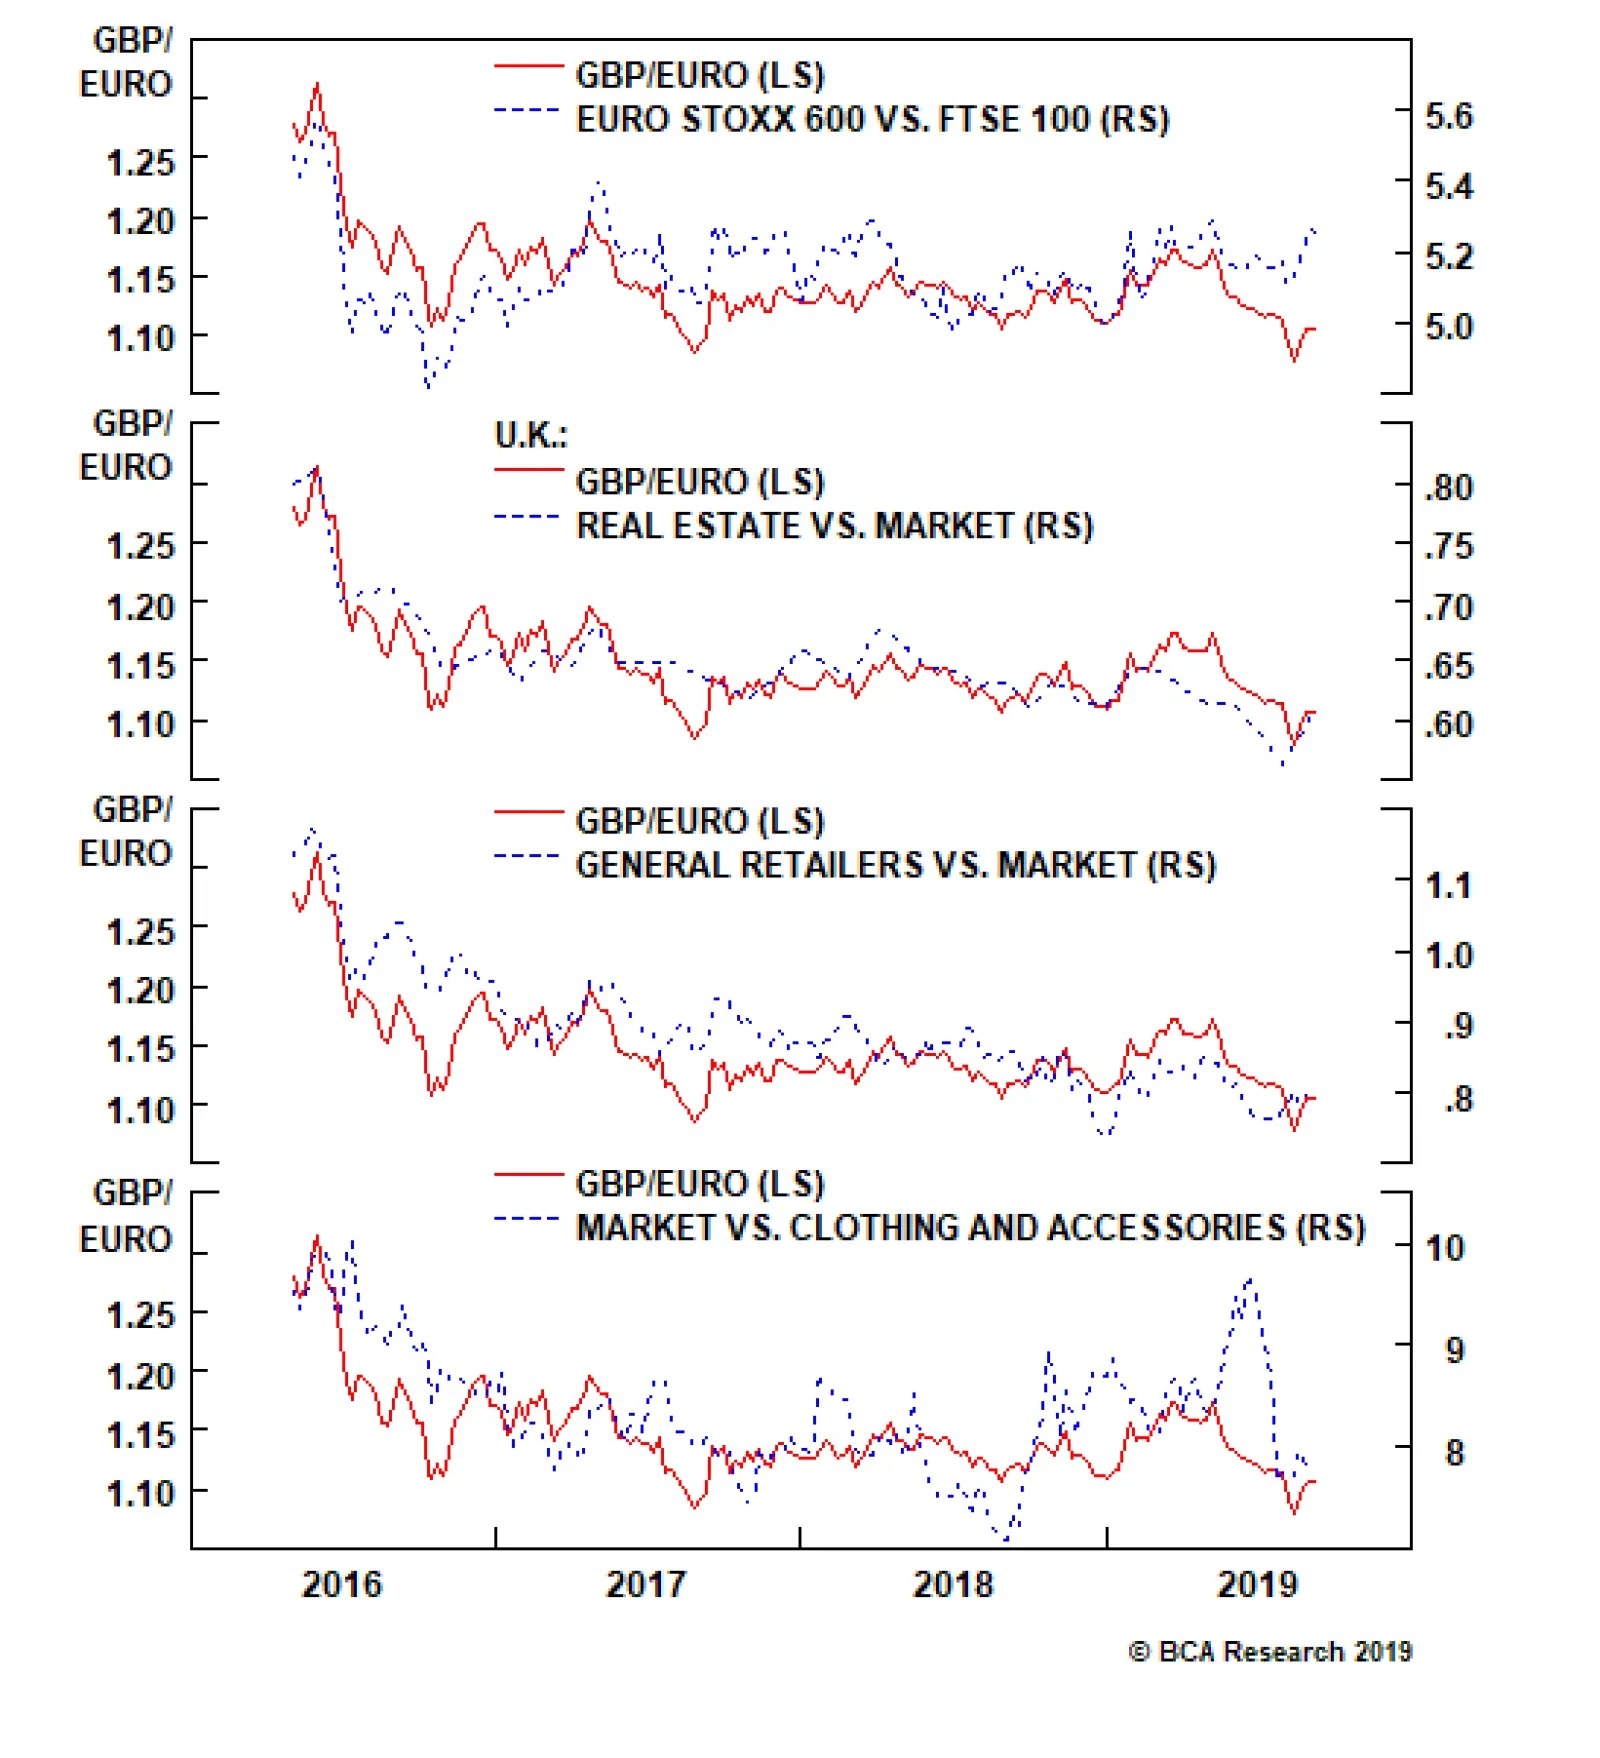
Turning to U.K. equity sectors, those most likely to outperform the overall market in a soft Brexit are real estate and general retailers (Chart I-5 and Chart I-6). Chart I-5U.K. Real Estate Outperforms In A Soft Brexit
U.K. Real Estate Outperforms In A Soft Brexit
U.K. Real Estate Outperforms In A Soft Brexit
Chart I-6U.K. General Retailers Outperform In A Soft Brexit
U.K. General Retailers Outperform In A Soft Brexit
U.K. General Retailers Outperform In A Soft Brexit
While a sector likely to outperform the overall market in a hard Brexit is clothing and accessories (Chart I-7). Chart I-7U.K. Clothing And Accessories Could Outperform In A Hard Brexit
U.K. Clothing And Accessories Could Outperform In A Hard Brexit
U.K. Clothing And Accessories Could Outperform In A Hard Brexit
Four Disruptors Revisited The final section this week revisits the wider context for Brexit and other recent examples of populism. Specifically, they are backlashes to four structural disruptors to economies and financial markets. Disruptor 1: Protectionism. Since the Great Recession, an extremely polarised distribution of economic growth has left many people’s standard of living stagnant – despite seemingly decent headline economic growth and job creation (Chart I-8). Chart I-8Disruptor 1: Income Inequality Leads To Protectionism
Disruptor 1: Income Inequality Leads To Protectionism
Disruptor 1: Income Inequality Leads To Protectionism
Looking to find a scapegoat, economic nationalism and protectionism have resonated very strongly with voters in several major economies: the U.S., U.K., Italy, and Brazil. Other voters could follow in the same vein. But history teaches us that protectionism ends up hurting many more people than it helps. Disruptor 2: Technology. The bigger danger is that the malaise is being misdiagnosed. Many middle-income job losses are not due to globalization, but due to technology. A polarised distribution of economic growth has left many people’s standard of living stagnant. Specifically, Artificial Intelligence (AI) is replacing secure middle-income jobs and displacing workers into insecure low-income manual jobs – like bartending and waitressing – which AI cannot (yet) replace (Table I-1). And AI’s impact on middle-income jobs is only in its infancy.1 The worry is that by misdiagnosing the illness as globalization and wrongly responding with protectionism, the illness will get worse, rather than improve. Table I-1Disruptor 2: Technology
Brexit: Rock Meets Hard Place
Brexit: Rock Meets Hard Place
Disruptor 3: Debt super-cycles have reached exhaustion. Protectionism carries a further danger. Just like developed economies did a decade ago, major emerging market economies are now coming to the end of structural credit booms and need to wean themselves off their credit addictions (Chart I-9). At this point of vulnerability, aggressive protectionism risks tipping these emerging economies into a sharp slowdown. Chart I-9Disruptor 3: Debt Super-Cycles Have Reached Exhaustion
Disruptor 3: Debt Super-Cycles Have Reached Exhaustion
Disruptor 3: Debt Super-Cycles Have Reached Exhaustion
Disruptor 4: Financial markets are richly valued. Disruptors one, two and three come at a time when equities are valued to generate feeble total nominal returns over the next decade (Chart I-10). Extremely compressed risk premiums are justified so long as bond yields remain ultra-low. Otherwise, the rich valuations will come under pressure. Chart I-10Disruptor 4: Financial Markets Are Richly Valued
Disruptor 4: Financial Markets Are Richly Valued
Disruptor 4: Financial Markets Are Richly Valued
The long-term investment message is crystal clear. With the four disruptors in play, we strongly advise long-term investors not to follow passive (equity) index-tracking strategies. Instead, we advise long-term investors to follow bespoke structural investment themes as shown in our structural recommendations section. Please note that owing to my travelling there is no fractal trading system this week. Normal service will resume next week. Dhaval Joshi, Chief European Investment Strategist dhaval@bcaresearch.com Footnotes 1 Please see the European Investment Strategy Special Report ‘The Superstar Economy: Part 2’ January 19, 2017 available at eis.bcaresearch.com Cyclical Recommendations Structural Recommendations Closed Fractal Trades Trades Closed Trades Asset Performance Currency & Bond Equity Sector Country Equity Indicators Bond Yields Chart II-1Indicators To Watch - Bond Yields
Indicators To Watch - Bond Yields
Indicators To Watch - Bond Yields
Chart II-2Indicators To Watch - Bond Yields
Indicators To Watch - Bond Yields
Indicators To Watch - Bond Yields
Chart II-3Indicators To Watch - Bond Yields
Indicators To Watch - Bond Yields
Indicators To Watch - Bond Yields
Chart II-4Indicators To Watch - Bond Yields
Indicators To Watch - Bond Yields
Indicators To Watch - Bond Yields
Interest Rate Chart II-5Indicators To Watch - Interest Rate Expectations
Indicators To Watch - Interest Rate Expectations
Indicators To Watch - Interest Rate Expectations
Chart II-6Indicators To Watch - Interest Rate Expectations
Indicators To Watch - Interest Rate Expectations
Indicators To Watch - Interest Rate Expectations
Chart II-7Indicators To Watch - Interest Rate Expectations
Indicators To Watch - Interest Rate Expectations
Indicators To Watch - Interest Rate Expectations
Chart II-8Indicators To Watch - Interest Rate Expectations
Indicators To Watch - Interest Rate Expectations
Indicators To Watch - Interest Rate Expectations
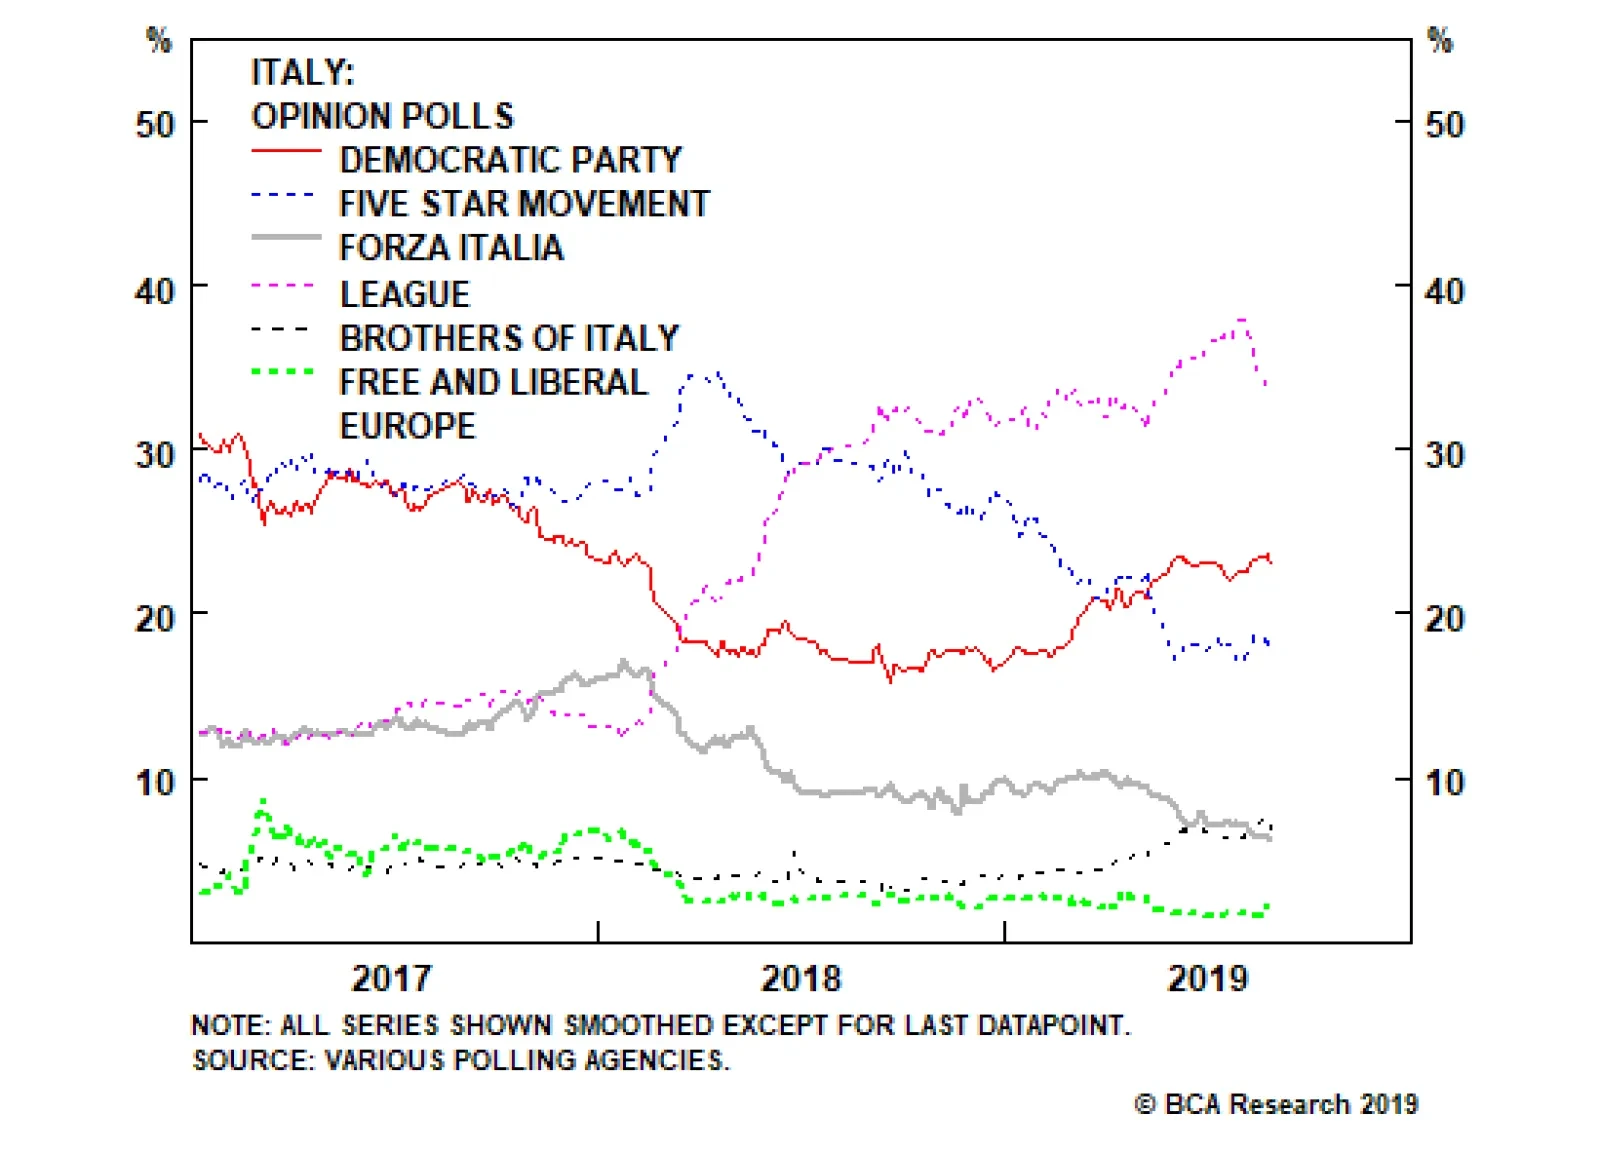
At present, the market is relieved that an election was avoided that might have seen Salvini and the League form a government with a much smaller right-wing party (Fratelli D’Italia) – but the truth is that Salvini had already capitulated to the EU, both on…
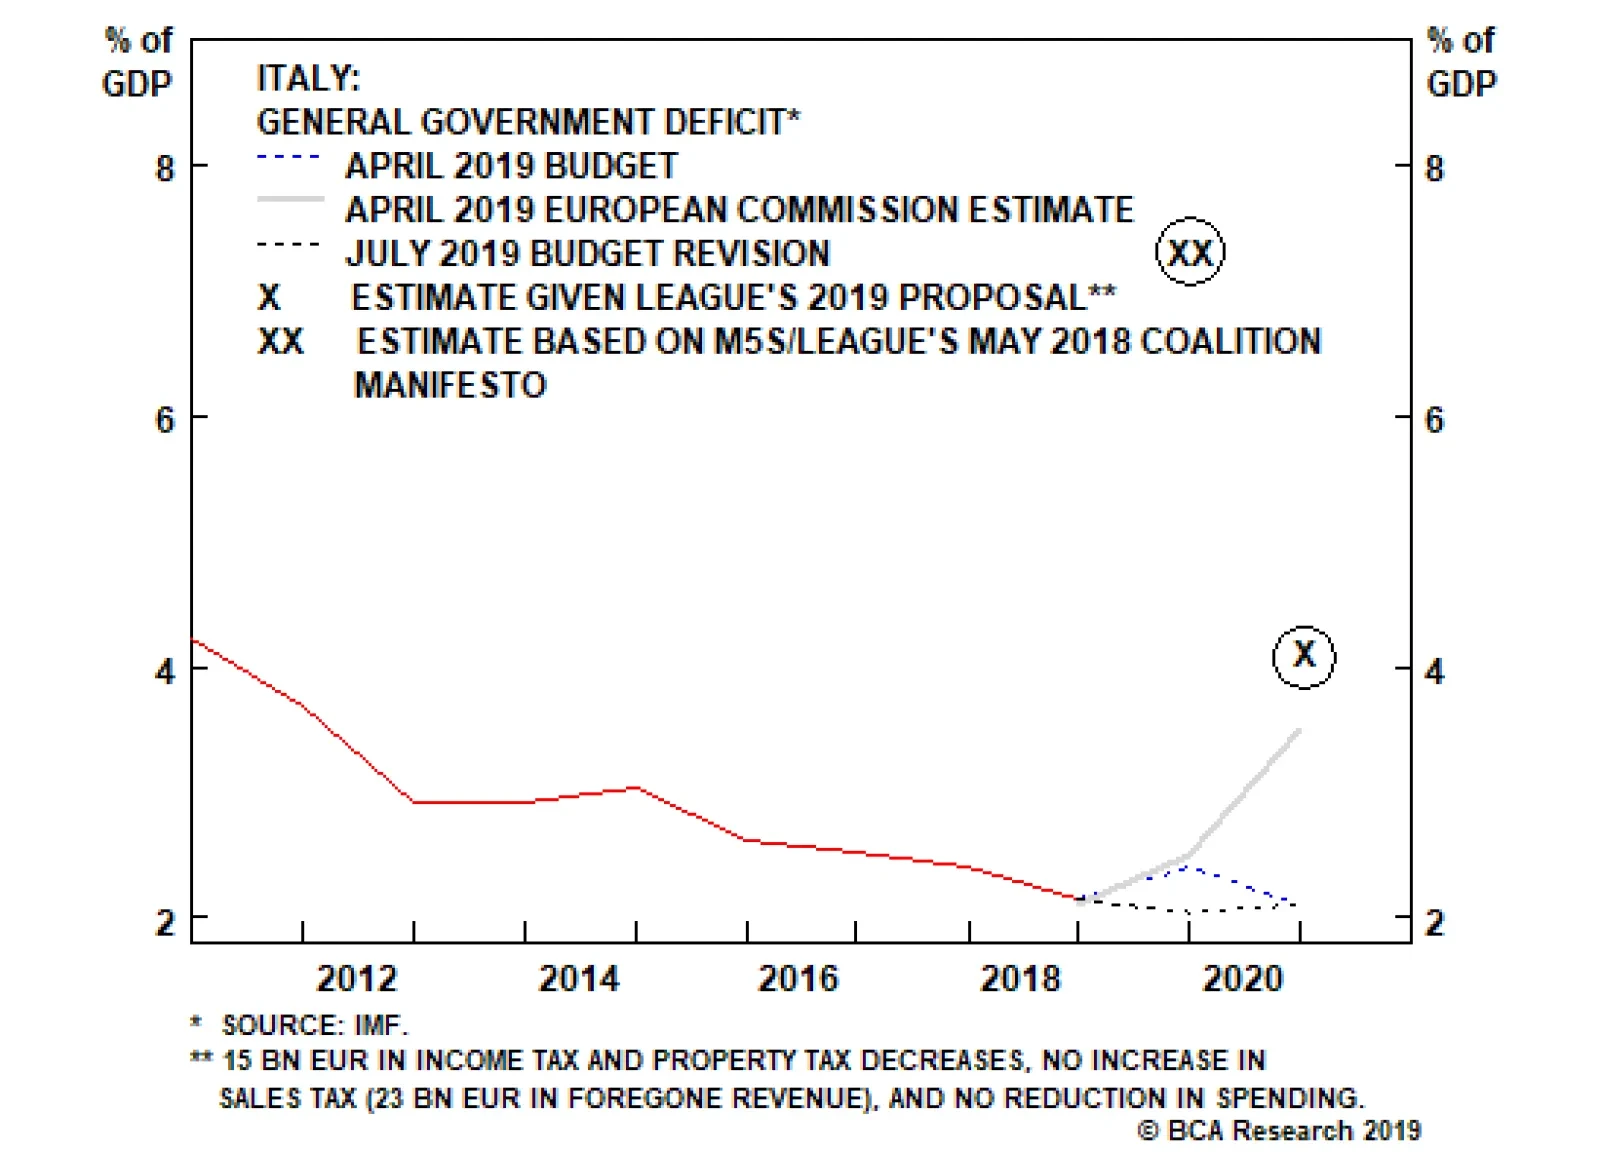
Italy has potentially avoided a new election by producing an unusual tie-up between the establishment Democratic Party and the anti-establishment Five Star Movement (M5S). The coalition still needs to clear some internal hurdles and an online vote by Five…