Europe

Dear Client, In case you missed it in real time, please listen to a replay of this quarter’s webcast ‘The Investment World in 5 Charts and 18 Minutes’ available at eis.bcaresearch.com. Also please note that we will be taking a summer break, so our next report will come out on August 22. Dhaval Joshi Highlights The aggregate equity market will go nowhere for the remainder of this year – as the sell-offs from a down-oscillation in growth fight the rallies from the valuation boost given by ultra-low bond yields. But there will be sector and regional losers and winners. Economically-sensitive ‘value’ sectors will be the losers, specifically Industrials and Semiconductors. Defensive ‘growth’ sectors will be the relative winners, specifically Healthcare. Continue to overweight European equities versus Chinese equities. Feature Chart of the WeekThe Global Bond Yield Is Within A Whisker Of An All-Time Low
The Global Bond Yield Is Within A Whisker Of An All-Time Low
The Global Bond Yield Is Within A Whisker Of An All-Time Low
This week the global long bond yield came within a whisker of the all-time low reached after the shock vote for Brexit in June 2016 (Chart of the Week). By definition, this means that the aggregate bond market has gone nowhere for several years. Since the autumn of 2017, the aggregate equity market has also gone nowhere, with no rally or sell-off lasting more than three months (Chart I-2).1 Chart I-2Since October 2017, No Rally Or Sell-Off Has Lasted More Than Three Months
Since October 2017, No Rally Or Sell-Off Has Lasted More Than Three Months
Since October 2017, No Rally Or Sell-Off Has Lasted More Than Three Months
The correct strategy then has been to sell the equity market’s three month rallies and buy the three month sell-offs. In June we predicted that equities would end the year at broadly the same level as then, but that they would experience a dip of at least 4-5 percent along the way. We are now experiencing the dip. The correct strategy has been to sell the three month rallies and buy the three month sell-offs. But isn’t the global bond yield approaching an all-time low a good thing for the economy and equity market? The answer is yes, and no. Yes, the ultra-low level of yields is a boon for the valuation of risk-assets. However, when it comes to credit-sourced economic growth, what matters is not the level of the bond yield, nor its direction, so much as its rate of change. If Bond Yields Decline At A Reduced Pace, Growth Slows Many people struggle to understand this subtle and counterintuitive point. If the bond yield declines, but at a reduced pace, it can slow credit-sourced growth. To understand why, imagine that in a certain period, a -0.5 percent decline in the bond yield added €50 billion to credit creation. This would constitute additional economic demand. If, in the following period, a further -0.5 percent yield decline added another €50 billion of credit-sourced demand, it would constitute the same amount of additional demand – which is to say, the same growth – as in the first period. By comparison, a -0.25 percent yield decline which added €25 billion to demand would result in the growth rate halving. The subtle and counterintuitive point is that the bond yield has continued to decline, yet it has caused credit-sourced growth to slow! Chart I-3In China, The Bond Yield's Peak Rate Of Decline Happened 6 Months Ago
In China, The Bond Yield's Peak Rate Of Decline Happened 6 Months Ago
In China, The Bond Yield's Peak Rate Of Decline Happened 6 Months Ago
This counterintuitive dynamic has unfolded in the global economy this year. Although bond yields have been heading lower, the peak rate of decline – notably in China – happened six months ago. Meaning that credit-sourced growth has almost certainly slowed (Chart I-3). Amplifying this down-oscillation in growth, geopolitical storm clouds are now regathering over the global economy. In the early part of this year, trade tensions and currency wars between the major economic blocs seemed to dissipate, the Middle East was quiet, and the Brexit deadline was postponed. But the lull was temporary. The geopolitical headwinds to growth are now strengthening with a vengeance. That’s the bad news. Equity Valuations Are Hyper-Sensitive To Low Bond Yields Now the good news. While the level of bond yields does not drive economic growth, it does drive the valuations of equities and other risk-assets. Moreover, it does so in a powerful non-linear way. Below a threshold level, ultra-low bond yields can give the valuation of equities an exponential boost. Geopolitical storm clouds are now regathering over the global economy. We refer readers to our other reports for the details, but in a nutshell at ultra-low bond yields the risk of owning bonds converges to the risk of owning equities. The upshot of this risk convergence is that investors price equities to deliver the same feeble nominal return as bonds, meaning that the valuation of equities soars (Chart I-4).2 Chart I-4The Valuation Of Equities Is Back To The Peak Level Of 2000 And 2007
The Valuation Of Equities Is Back To The Peak Level Of 2000 And 2007
The Valuation Of Equities Is Back To The Peak Level Of 2000 And 2007
Theoretically and empirically, this threshold level of the bond yield is in the region of 2 percent. And the bond yield that matters is the global long bond yield, defined as the simple average of the 10-year yields of the U.S., the euro area, and China. To simplify matters, we can proxy the 10-year yield of the aggregate euro area with the 10-year yield of France. So calculate the simple average of the 10-year yields of the U.S., France, and China. A value rising towards 2.5 percent equates to danger for equity valuations. A value falling below 2.0 percent equates to an underpinning for equity valuations. Today, the value stands near 1.5 percent creating a good support for equity and risk-asset valuations. The upshot is that the aggregate equity market will go nowhere for the remainder of this year – as the sell-offs from the down-oscillation in growth fight the rallies from the valuation boost given by ultra-low bond yields. But there will be sector losers and winners. Essentially, economically-sensitive ‘value’ sectors will be the losers while defensive ‘growth’ sectors will be the relative winners. Put simply, the sector trends present during the last up-oscillation in global growth are likely to unwind if they have not already done so. In which case, the sectors most likely to suffer underperformance are: Industrials and Semiconductors (Chart I-5). Chart I-5Industrials Outperformed Strongly... But Are Now Underperforming
Industrials Outperformed Strongly... But Are Now Underperforming
Industrials Outperformed Strongly... But Are Now Underperforming
And the sector most likely to see (continued) outperformance is: Healthcare. There will also be regional losers and winners. This is because regional equity market relative performance just follows from sector relative performance combined with each region’s sector ‘fingerprint’. Bear in mind that a fingerprint can be defined not just by overweight sectors but also by underweight sectors, such as the Shanghai Composite’s negligible weighting in Healthcare, making the Chinese index ultra-cyclical. Continue to overweight European equities versus Chinese equities (Chart I-6). Chart I-6Overweight Europe Versus China
Overweight Europe Versus China
Overweight Europe Versus China
Market Dislocations And Recessions: Cause And Effect As investment strategists, our primary focus should be the financial markets rather than the economy. On this basis, we define a major dislocation in terms of the markets: an episode in which equities underperform bonds by more than 20 percent over a period of more than six months. There have been three such episodes in the twenty-first century.3 Yet our market based definition of a major dislocation also perfectly captures the three last times that the European economy went into recession or near-recession. Does this mean that the recessions caused the financial market dislocations? No. Quite the reverse. The twenty-first century’s recessions have all resulted from financial market dislocations. The twenty-first century’s recessions have all resulted from the financial market dislocations that followed market distortion or mispricing: the bubble valuations of the technology, media and telecom sectors in 2000 (Chart I-7); the mispricing of U.S. mortgages and credit in 2007 (Chart I-8); and the mispricing of euro area sovereign credit risk in 2011 (Chart I-9). Therefore, the major dislocations in the financial markets have always preceded the recessions and near-recessions, sometimes by several quarters, even when both are measured in real time. Chart I-7The Twenty First Century Recessions Stemmed From Financial Market Distortions: The Dot Com Bubble In 1999/2000...
The Twenty First Century Recessions Stemmed From Financial Market Distortions: The Dot Com Bubble In 1999/2000...
The Twenty First Century Recessions Stemmed From Financial Market Distortions: The Dot Com Bubble In 1999/2000...
Chart I-8...The Mispricing Of U.S.##br## Mortgages And Credit In##br## 2007/2008...
...The Mispricing Of U.S. Mortgages And Credit In 2007/2008...
...The Mispricing Of U.S. Mortgages And Credit In 2007/2008...
Chart I-9...And The Mispricing Of Euro Area Sovereign Credit Risk In 2010/2011
...And The Mispricing Of Euro Area Sovereign Credit Risk In 2010/2011
...And The Mispricing Of Euro Area Sovereign Credit Risk In 2010/2011
Today, the consensus overwhelmingly believes that a recession will cause the next major dislocation in financial markets. But history has taught us time and time again that the causality is much more likely to run the other way. Hence, a major dislocation in the financial markets – should one occur – will cause the next recession. And not the other way round! Fractal Trading System* The nickel price has surged on continued fears over Indonesian exports bans. But from a technical perspective the recent surge is excessive and susceptible to a reversal on any easing of the fears. Accordingly, this week’s trade is short nickel versus copper, setting a profit target of 10 percent with a symmetrical stop-loss. In other trades, short ASX200 versus FTSE100 hit its 2 percent stop-loss, but short MSCI All-Country World has moved well into profit. For any investment, excessive trend following and groupthink can reach a natural point of instability, at which point the established trend is highly likely to break down with or without an external catalyst. An early warning sign is the investment’s fractal dimension approaching its natural lower bound. Encouragingly, this trigger has consistently identified countertrend moves of various magnitudes across all asset classes. Chart I-10Short Nickel, Long Copper
Short Nickel, Long Copper
Short Nickel, Long Copper
The post-June 9, 2016 fractal trading model rules are: When the fractal dimension approaches the lower limit after an investment has been in an established trend it is a potential trigger for a liquidity-triggered trend reversal. Therefore, open a countertrend position. The profit target is a one-third reversal of the preceding 13-week move. Apply a symmetrical stop-loss. Close the position at the profit target or stop-loss. Otherwise close the position after 13 weeks. Use the position size multiple to control risk. The position size will be smaller for more risky positions. * For more details please see the European Investment Strategy Special Report “Fractals, Liquidity & A Trading Model,” dated December 11, 2014, available at eis.bcaresearch.com. Dhaval Joshi, Chief European Investment Strategist dhaval@bcaresearch.com Footnotes 1 We define the global long bond yield as the simple average of the 10-year yields in the U.S., euro area, and China. And to make things simple, France provides a good proxy for the euro area long bond yield. 2 Please see the European Investment Strategy Weekly Report “Risk: The Great Misunderstanding Of Finance”, October 25, 2018 available at eis.bcaresearch.com. 3 Based on the relative performance of the MSCI All Country World Index versus the JP Morgan Global Government Bond Index, both in local currency terms. Fractal Trading System Cyclical Recommendations Structural Recommendations Closed Fractal Trades Trades Closed Trades Asset Performance Currency & Bond Equity Sector Country Equity Indicators Bond Yields Chart II-1Indicators To Watch - Bond Yields
Indicators To Watch - Bond Yields
Indicators To Watch - Bond Yields
Chart II-2Indicators To Watch - Bond Yields
Indicators To Watch - Bond Yields
Indicators To Watch - Bond Yields
Chart II-3Indicators To Watch - Bond Yields
Indicators To Watch - Bond Yields
Indicators To Watch - Bond Yields
Chart II-4Indicators To Watch - Bond Yields
Indicators To Watch - Bond Yields
Indicators To Watch - Bond Yields
Interest Rate Chart II-5Indicators To Watch - Interest Rate Expectations
Indicators To Watch - Interest Rate Expectations
Indicators To Watch - Interest Rate Expectations
Chart II-6Indicators To Watch - Interest Rate Expectations
Indicators To Watch - Interest Rate Expectations
Indicators To Watch - Interest Rate Expectations
Chart II-7Indicators To Watch - Interest Rate Expectations
Indicators To Watch - Interest Rate Expectations
Indicators To Watch - Interest Rate Expectations
Chart II-8Indicators To Watch - Interest Rate Expectations
Indicators To Watch - Interest Rate Expectations
Indicators To Watch - Interest Rate Expectations
Politicians have to pay attention to the opinion polls as well as the referendum result, since opinion polls impact the next election. These show a plurality in favor of remaining in the EU and a strong trend against Brexit since 2017. While the evidence does…

All of Boris Johnson's moves, since he took over, were anticipated – hence the decline in our Geopolitical Strategy Service's GeoRisk indicator – but the pound sterling is falling now that the confrontation is truly getting under way. Parliament is adjourned…
The Bank of England (BoE) held rates steady at last week’s Monetary Policy Committee (MPC) meeting, keeping the Bank Rate at 0.75%. The MPC modestly lowered its growth forecasts for 2019 and 2020 due to the dual uncertainties over global growth and, more…
Highlights So What? Prime Minister Boris Johnson’s threat to take the U.K. out of the EU without a withdrawal deal in place is a substantial 21% risk. Why? The odds of a no-deal exit could range from today’s 21% to around 30%, depending on whether Johnson manages to obtain some concessions from the EU in forthcoming negotiations. It is far too early to go bottom-feeding for the pound sterling, as Brexit risks are asymmetrical. We maintain our tactically cautious positioning, despite some cyclical improvements, due to elevated geopolitical risks in the United States, East Asia, and the Middle East. Feature Thank you Mr. Speaker, and of course I should welcome the prime minister to his place … the last prime minister of the United Kingdom. – Ian Blackford, head of the Scottish National Party in Westminster, July 25, 2019 Chart 1No-Deal Brexit Would Come At A Very Bad Time
No-Deal Brexit Would Come At A Very Bad Time
No-Deal Brexit Would Come At A Very Bad Time
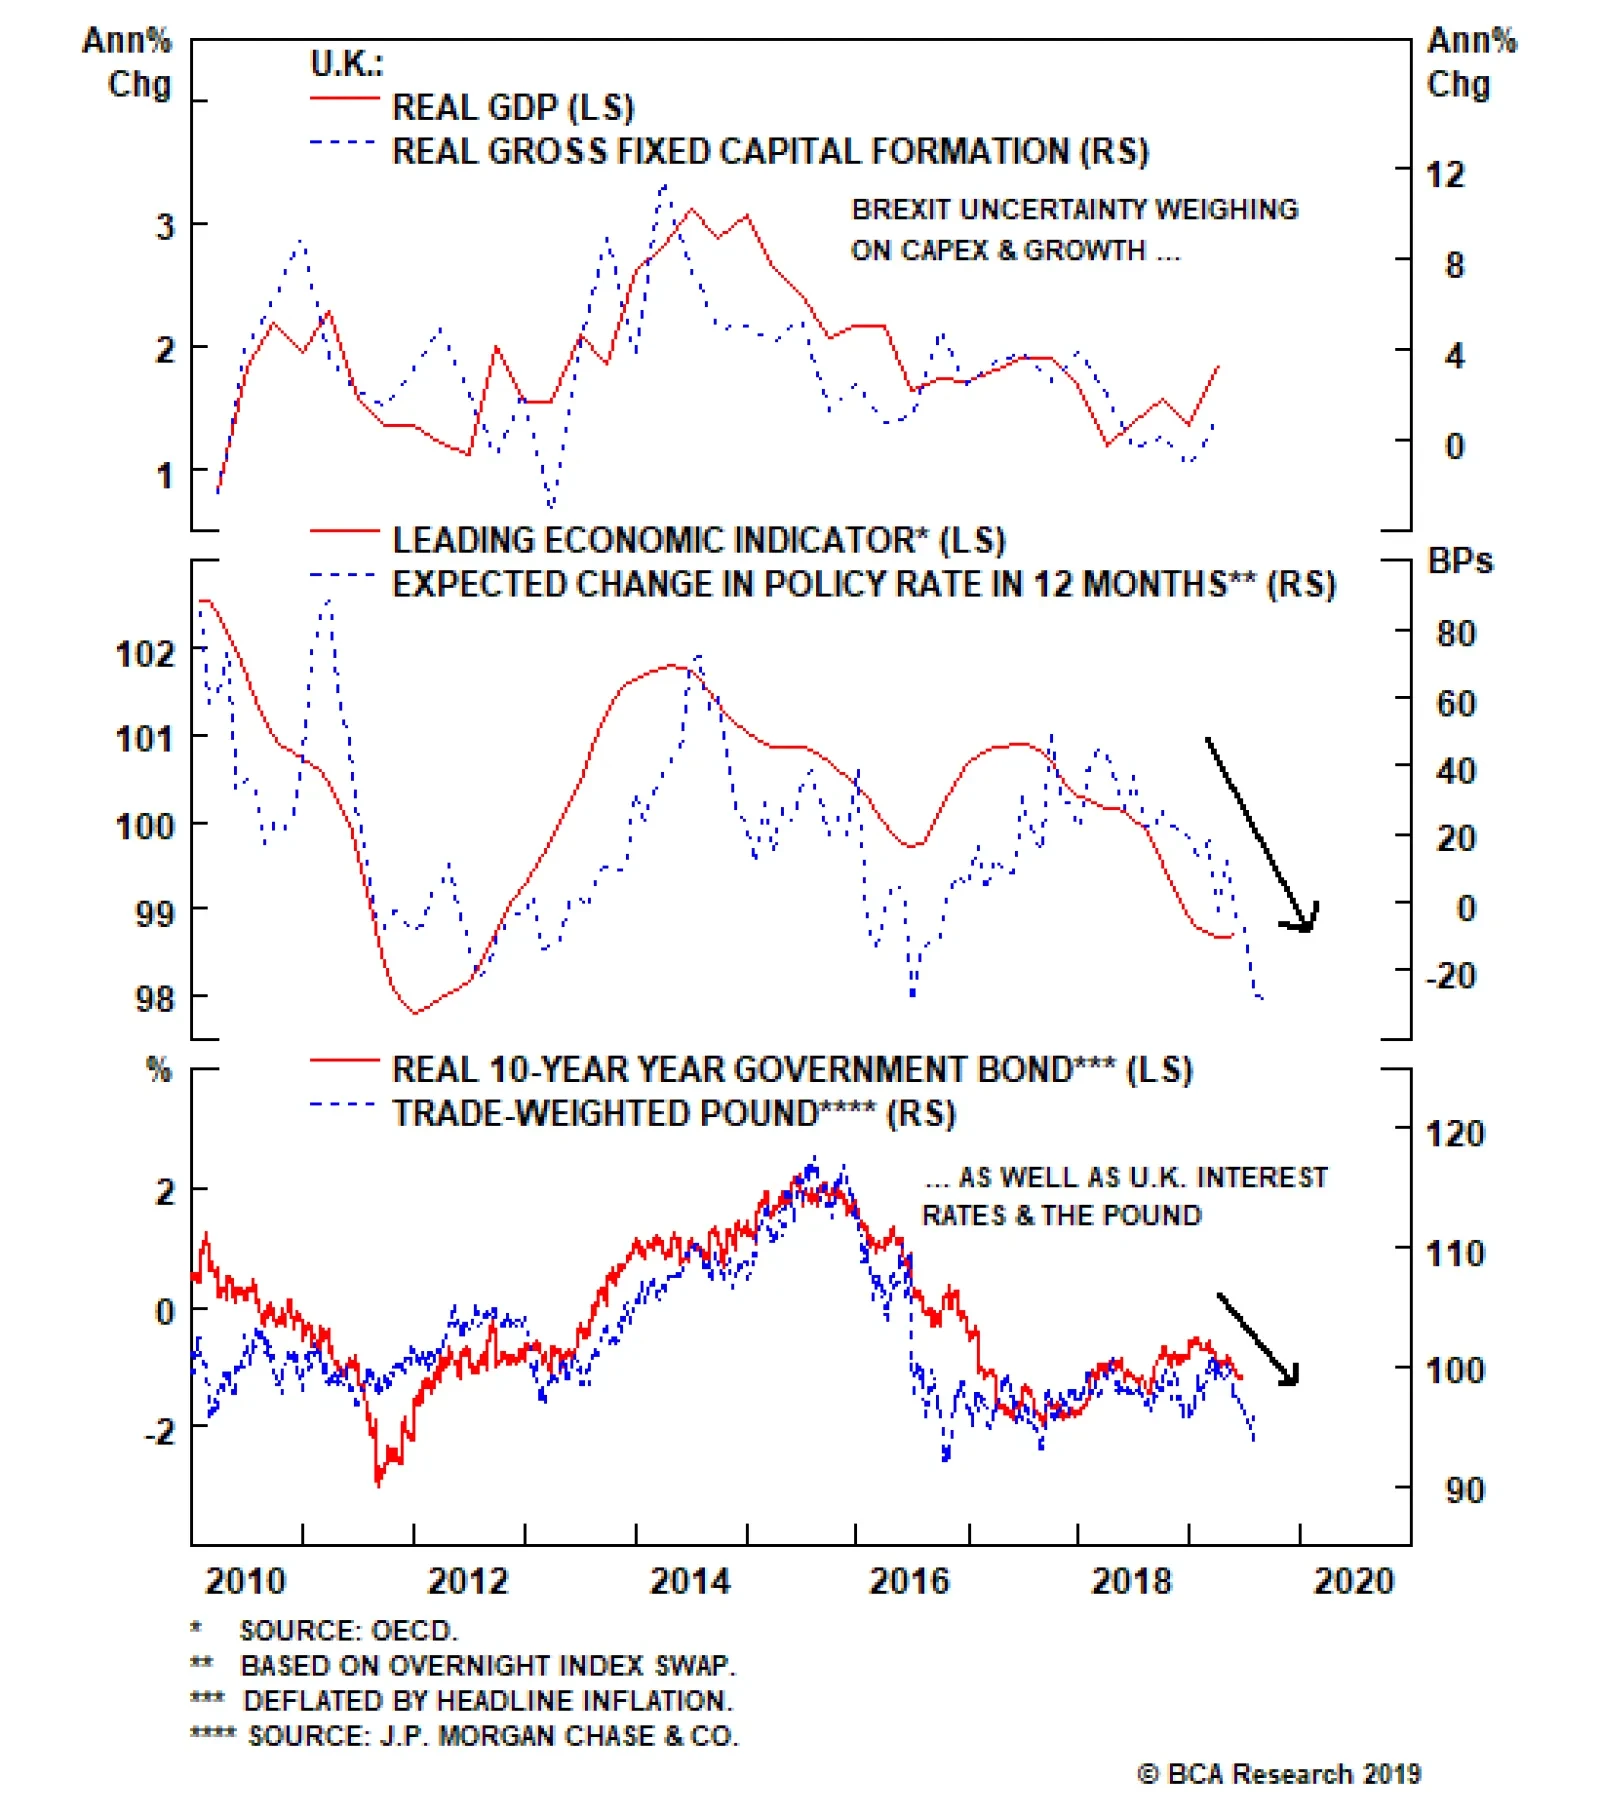
The Federal Reserve cut interest rates for the first time since the global financial crisis in 2008 on July 31. The Fed suggested that the door is open for future cuts, though Chairman Jerome Powell signaled that the cut should not be seen as the launch of a “lengthy rate cutting cycle” but rather as a “mid-cycle adjustment” comparable to cuts in 1995 and 1998. President Donald Trump responded by declaring a new 10% tariff on $300 billion worth of imports from China! He resumed criticizing Powell for insufficient dovishness – and Trump could in fact fire Powell, though the decision would be contested at the Supreme Court. The Fed’s move shows that Trump’s direct handle on interest rates comes from his ability to control trade policy and hence affect the “the external sector.” The trade war with China has exacerbated a global manufacturing slowdown that is keeping global growth and U.S. inflation weak enough to justify additional rate cuts with each future deterioration (Chart 1). Improvements in global monetary and fiscal policy suggest that the U.S. and global economic expansion will be extended to 2021 or beyond, which is positive for equities relative to government bonds or cash, but we remain defensively positioned in the near-term due to a range of geopolitical risks, highlighted by the new tariffs. The unconvincing U.S.-China tariff ceasefire agreed at the Osaka G20 has fallen apart as we expected; the period of “fire and fury” between the U.S. and Iran continues; and the U.S. is entering what we expect to be a period of socio-political instability in the lead up to the momentous 2020 presidential election. Moreover the risk of a “no deal” Brexit, in which the U.K. exits the European Union and reverts to basic World Trade Organization tariff levels, is rising and will create acute uncertainty over the next three months despite the world’s easy monetary policy settings (Charts 2A & 2B). In June we upgraded our odds of a no-deal Brexit to 21%, up from 7% this spring. While not our base case, the probability is too high for comfort and the critical timing for the rest of Europe warns against taking on additional risk. The risk of a “no deal” Brexit ... is rising and will create acute uncertainty. Chart 2AUncertainty And Sentiment Getting Worse ...
Uncertainty And Sentiment Getting Worse ...
Uncertainty And Sentiment Getting Worse ...
Chart 2B... Despite Easy Monetary Policy
... Despite Easy Monetary Policy
... Despite Easy Monetary Policy
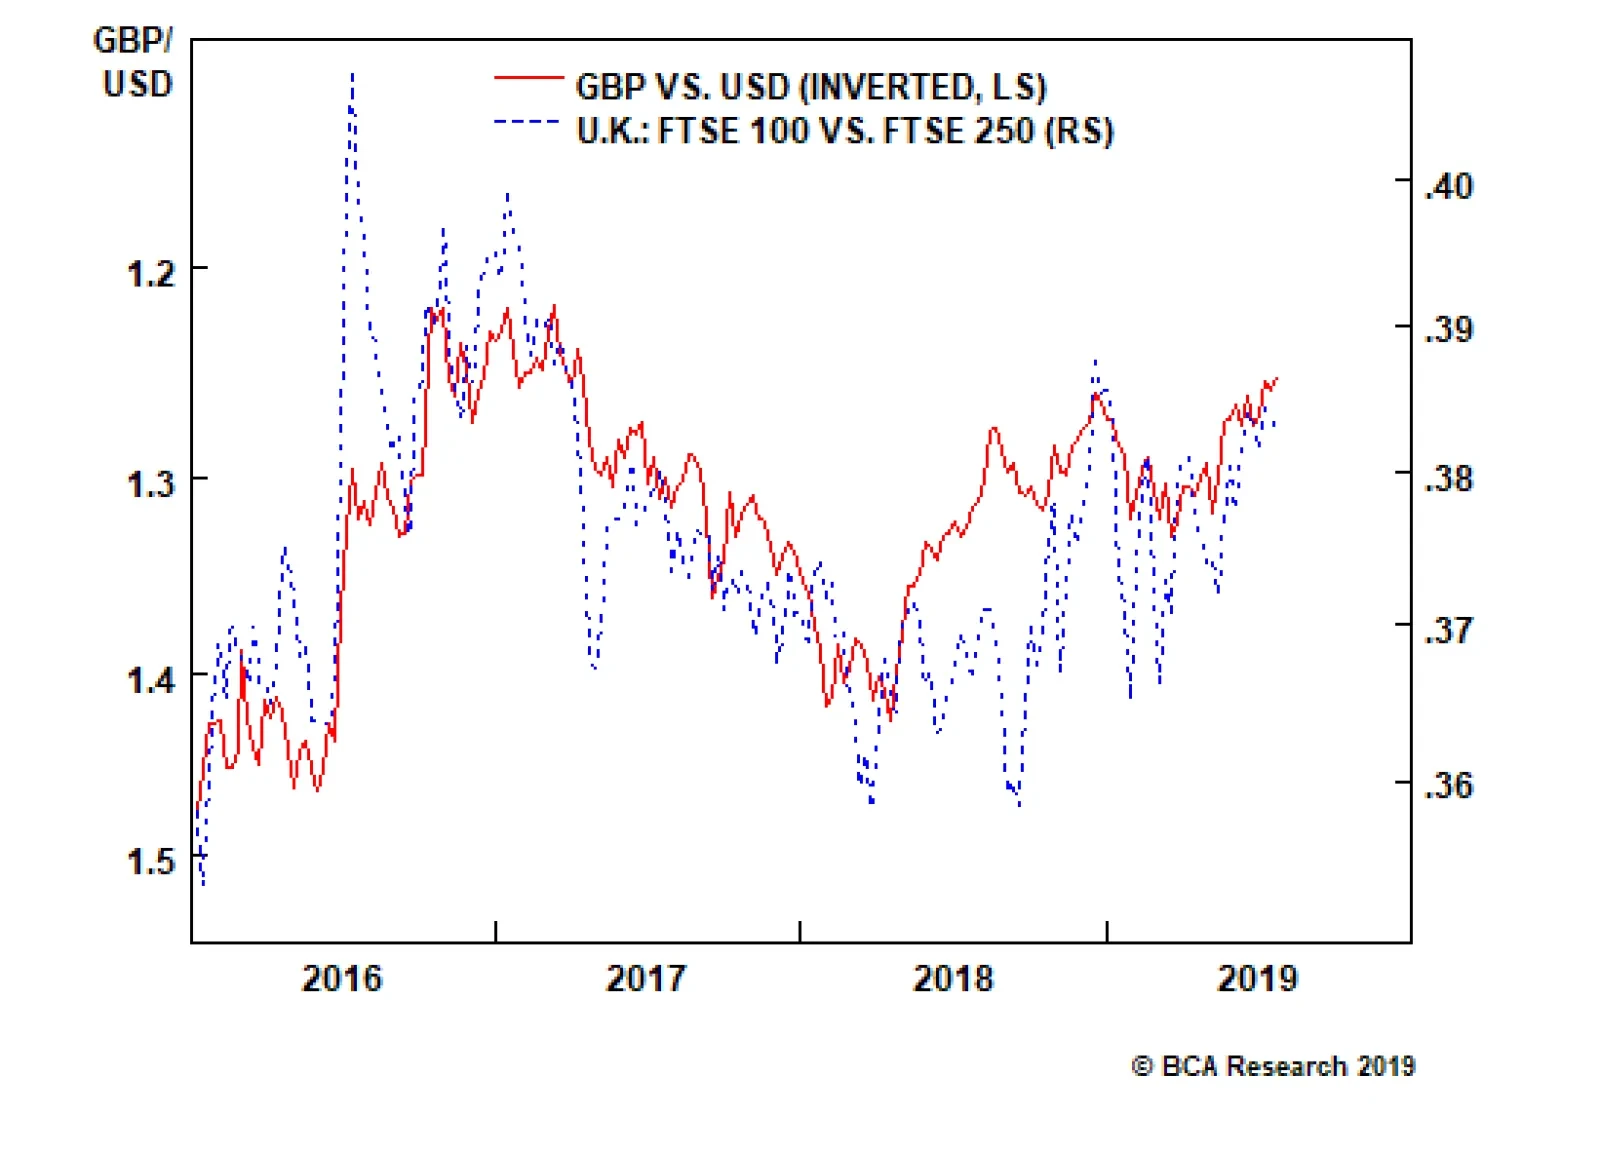
BoJo’s Gambit Boris Johnson – aka “BoJo” – former mayor of London and foreign secretary, cemented his position as the U.K.’s 77th prime minister on July 24. He immediately launched a gambit to renegotiate the U.K.’s withdrawal. He is threatening not to pay the “divorce bill” (the U.K.’s outstanding budget contributions for the 2014-20 budget period and other liabilities in subsequent decades) of 39 billion pounds. He insists that the Irish backstop (which would keep Northern Ireland or the U.K. in the EU customs union to prevent a hard border between the two Irelands) must be abandoned. He has stacked his cabinet with pro-Brexit hardliners who share his “do or die” stance that Brexit must occur on October 31 regardless of whether an agreement for an orderly exit is in place. These developments were anticipated – hence the decline in our GeoRisk indicator – but the pound sterling is falling now that the confrontation is truly getting under way (Chart 3). Parliament is adjourned in August, so Johnson’s hardline negotiating tactics will get full play in the media cycle until early September, when the real showdown begins. Crunch time will likely run up to the eleventh hour, with Halloween marking an ominous deadline. There is plenty of room for the pound to fall further throughout this period, according to our European Investment Strategy’s handy measure (Chart 4), because the success of Boris’s gambit depends entirely upon creating a credible threat of crashing out of the EU in order to wring concessions that could conceivably pass through the British parliament. Chart 3Our Market-Based Indicator Suggests Still Some Complacency On Brexit Risks
Our Market-Based Indicator Suggests Still Some Complacency On Brexit Risks
Our Market-Based Indicator Suggests Still Some Complacency On Brexit Risks
Chart 4GBP-EUR Still Has Room To Fall Under BoJo's Gambit
GBP-EUR Still Has Room To Fall Under BoJo's Gambit
GBP-EUR Still Has Room To Fall Under BoJo's Gambit
Geopolitically, the United Kingdom is not prohibited from exiting the EU without a deal. Though the empire is a thing of the past, the U.K. remains a major world power. It has Europe’s second-largest economy, nuclear weapons, a blue-water navy, a leading voice in global political institutions, and is a close ally of the United States. It mints its own coin. It is a sovereign entity that can survive on its own just as Japan can survive on its own. This geopolitical foundation always supported our view that there was a 50% chance of the referendum passing in 2016, and today it supports the view that fears over a no-deal Brexit are not misplaced. Investors should therefore not confuse Johnson’s bluster with that of Alexis Tsipras in 2015. A British government dead-set on delivering this outcome – given the popular mandate from the 2016 referendum and the government’s constitutional handling of foreign affairs as opposed to parliament – can probably achieve it. However, the probability of a no-deal Brexit may become overstated in the next two-to-three months. Economically and politically, a no-deal exit is extremely difficult to follow through on – hence our 21% probability. Estimates of the negative economic impact range from a 2% reduction in GDP growth to an 11% reduction (Table 1). The 8% drop cited by Scottish National Party leader Ian Blackford in his denunciation of Prime Minister Johnson’s strategy is probably exaggerated. The U.K.’s recorded twentieth-century recessions range from 2%-7% (Chart 5). These offer as good of a benchmark as any. While a no-deal exit is probably not going to create a shock the same size as the Great Depression or the Great Recession, the recessions of 1979 and 1990 would be bad enough for any prime minister or ruling party. Table 1Wide Range Of Estimates For Impact Of No-Deal Brexit
Tariffs ... And The Last Prime Minister Of The United Kingdom?
Tariffs ... And The Last Prime Minister Of The United Kingdom?
Chart 5
A small recession could also spiral out of control – it could create a vicious spiral with the European continent, which is already on the verge of recession. And it could damage consumer confidence more than anticipated – as it would be accompanied by immediate social and political unrest due to the half of the population that opposes Brexit in all forms. Politicians have to pay attention to the opinion polls as well as the referendum result, since opinion polls impact the next election. These show a plurality in favor of remaining in the EU and a strong trend against Brexit since 2017 – a factor that the currency markets are ignoring at the moment (Chart 6). While the evidence does not prove that a second referendum would result in Bremain, it is highly likely that a majority opposes a no-deal exit, given that at least a handful of pro-Brexit voters do not want to leave without a deal. The results of the European parliamentary elections in May (Chart 7) and the public’s preferences for different political parties (Chart 8) both support this conclusion. Chart 6Plurality Of Voters Still Favors Bremain Over Brexit
Plurality Of Voters Still Favors Bremain Over Brexit
Plurality Of Voters Still Favors Bremain Over Brexit
Chart 7
Chart 8Voters Favor Bremain-Leaning Political Parties
Voters Favor Bremain-Leaning Political Parties
Voters Favor Bremain-Leaning Political Parties
Parliament is also opposed to a no-deal Brexit. Though the Cooper-Letwin bill that forbad a no-deal exit initially passed by one vote in April (Chart 9A), the final amended version passed with a majority of 309 votes. Further, in July, with the rise of Boris Johnson, parliament passed a measure by 41 votes that requires parliament to sit this fall (Chart 9B), thus attempting to prevent Boris from proroguing parliament and forcing a no-deal Brexit that way. Technically Queen Elizabeth II could still prorogue parliament, but we highly doubt she would intervene in a way that would divide the nation. Johnson himself will have to face the reality of parliament and public opinion.
Chart 9
Chart 9
Parliament has one crystal clear means of halting a no-deal exit: a vote of no confidence in Johnson’s government.1 Theresa May only survived her vote of no confidence by 19 seats. Yet Johnson is entering 10 Downing Street at a time when parliament is essentially hung. The Conservative Party’s coalition with Northern Ireland’s Democratic Union Party has been reduced to a majority of two, which is likely to fall to a single solitary seat after the Brecon and Radnorshire by-election, which is taking place as we go to press. Johnson has purged several Tories from his cabinet, and there are a handful of Conservatives who are firmly opposed to a no-deal Brexit. It would be an extremely tight vote as to whether these Tory rebels would be willing and able to bring down one of their own governments – a careful assessment suggests that there are about half a dozen swing voters on each side of the House of Commons.2 But 47 Conservatives contrived to block prorogation (see Chart 9B). The magnitude of the crisis members of parliament would face – an unpopular, self-inflicted no-deal exit and recession – is essential context that would motivate rebellious voting behavior. Parliament’s actions so far, the reality of the economic impact, and the popular polling suggest that MPs are likely to halt the Johnson government from forcing a no-deal exit if he makes a mad dash for it. More likely is that Johnson himself pushes to hold an election after securing some technical concessions from Brussels. He is galvanizing the Conservative vote and swallowing up the single-issue Brexit vote (UKIP and the Brexit Party), while the opposition remains divided between the Labour Party under the vacillating Jeremy Corbyn and the resurgent Liberal Democrats (Chart 10). In a first-past-the-post electoral system, this provides a window of opportunity for the Conservatives to improve their parliamentary majority – assuming that Johnson has renegotiated a deal with the EU and has something to show for it. Chart 10BoJo Could Call Election With Deal In Hand
BoJo Could Call Election With Deal In Hand
BoJo Could Call Election With Deal In Hand
Chart 11Ireland Can Compromise For Stability's Sake
Ireland Can Compromise For Stability's Sake
Ireland Can Compromise For Stability's Sake
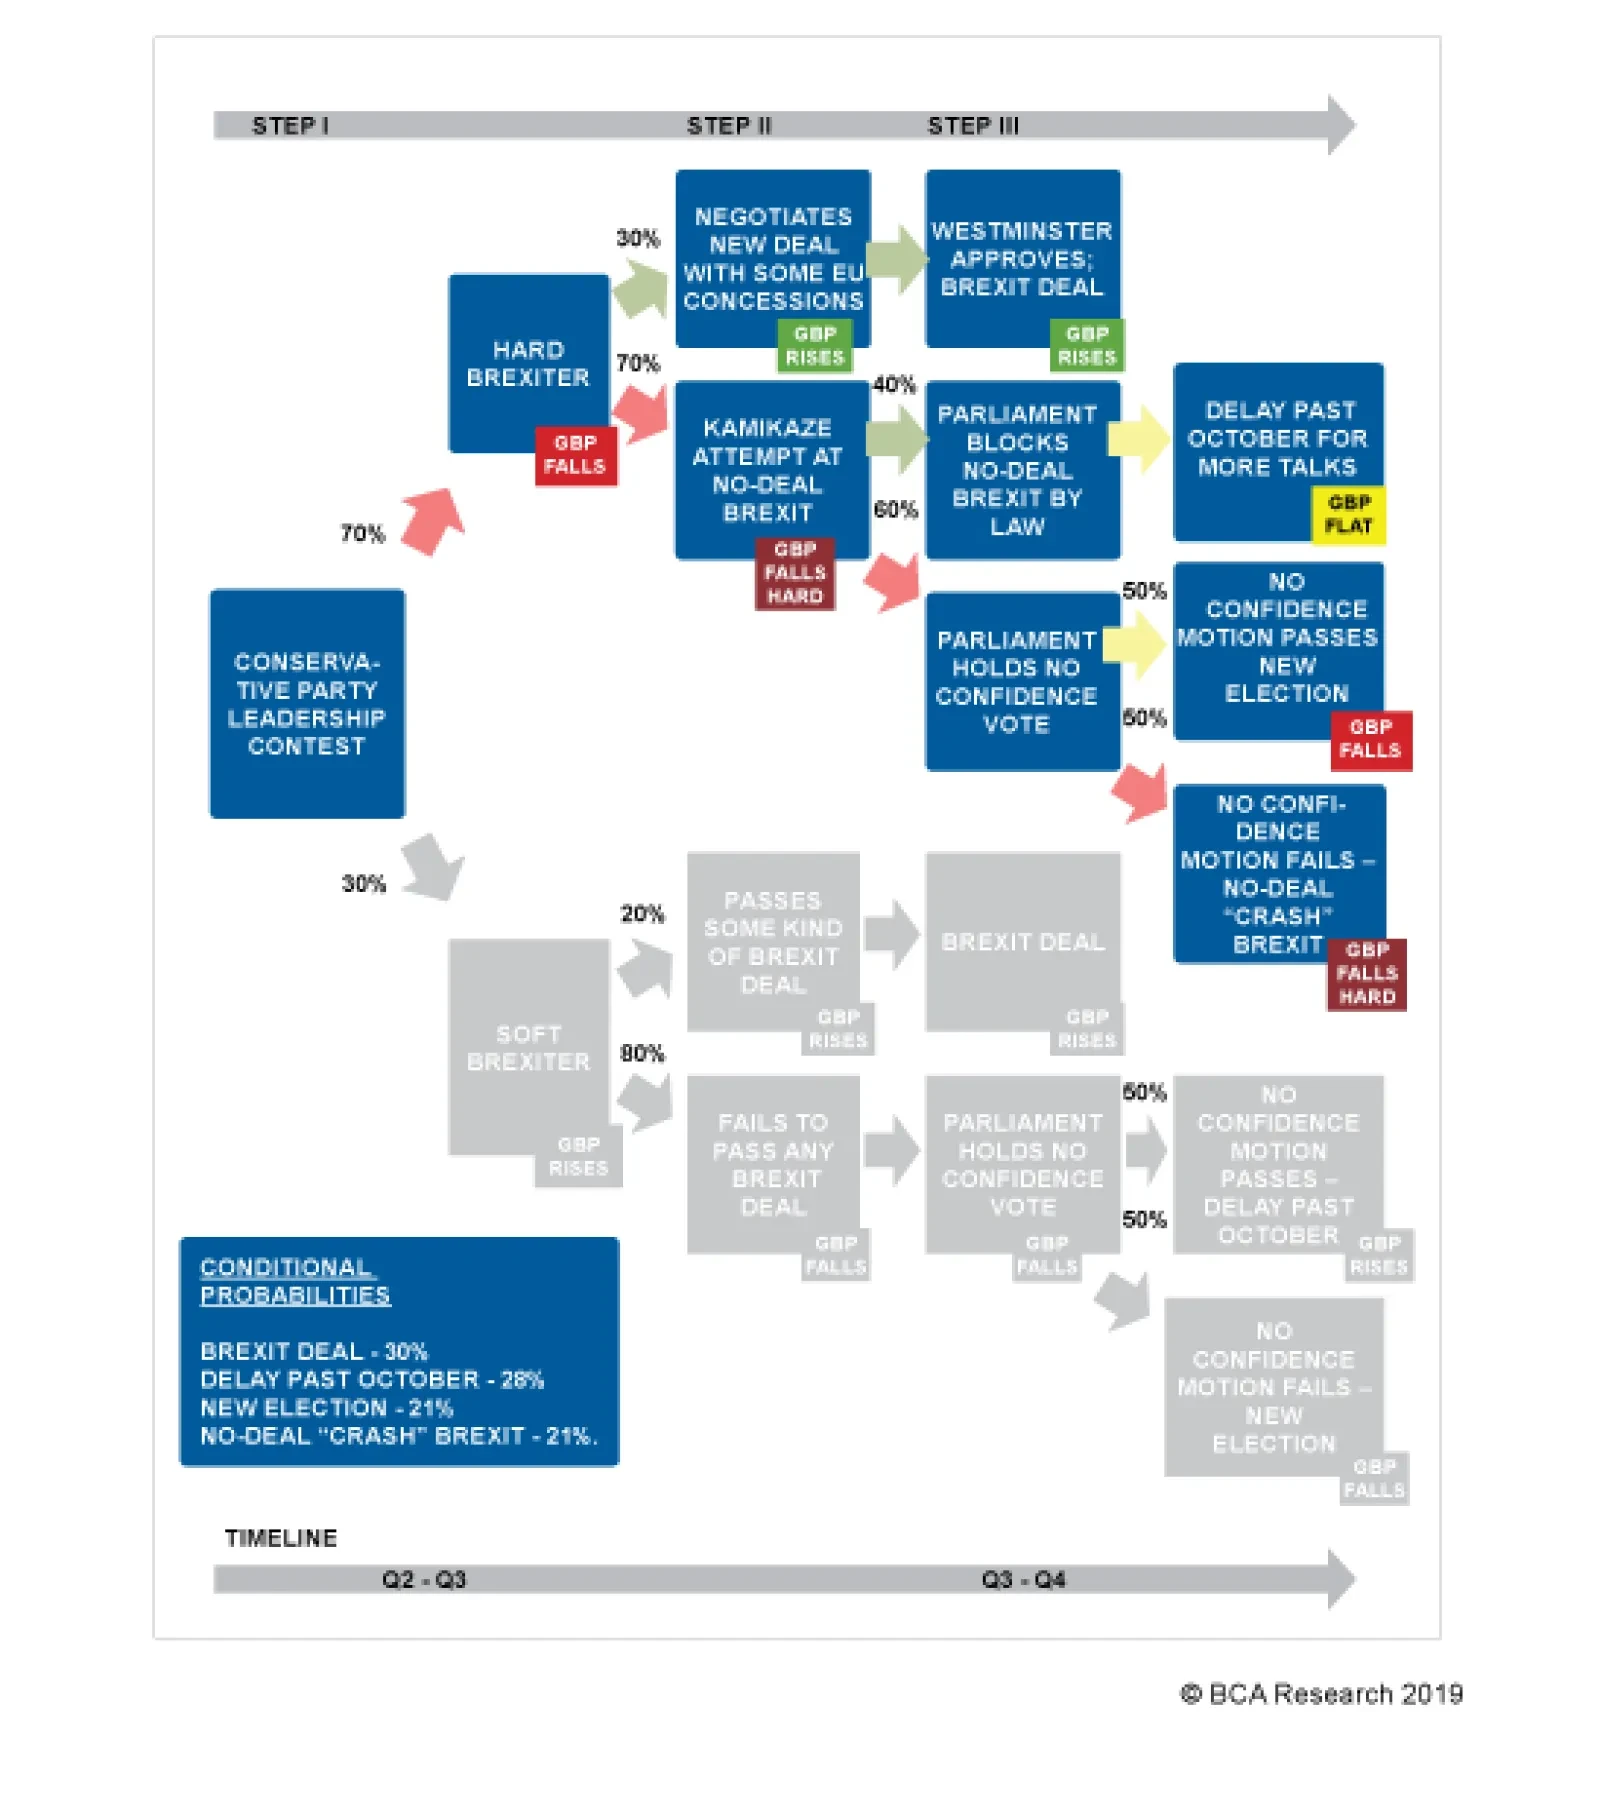
This would require the EU to delay the deadline yet again (September 3 is the last date for a non-confidence vote to force a pre-Brexit October 24 election). The European Union has a self-interest in preventing a no-deal Brexit, as it needs to maintain economic stability. It ultimately would prefer to keep the U.K. in the bloc, which means that delays can ultimately be granted, especially to accommodate a new election. As to what kind of compromises are available, the Irish backstop can suffer technical changes to its provisions, time frames, or application. In the end, the Irish Sea is already a different kind of border than the other borders in the U.K. and therefore it is possible to enact additional checks that nevertheless have a claim to retaining the integrity of the United Kingdom. The Democratic Unionists could find themselves outnumbered on this issue. Certainly the Republic of Ireland has an interest in preventing a no-deal Brexit as long as a hard border with Northern Ireland is avoided, and Boris Johnson maintains that it will be (Chart 11). The risk of a no-deal Brexit is around 21% Our updated Brexit Decision Tree in Diagram 1 provides the outcomes. Former Prime Minister Theresa May failed three times to pass her Brexit deal. We allot a 30% chance, higher than consensus, that Boris Johnson can do it through galvanizing the Conservative vote – given that he is operating with a hung parliament and is at odds with the median voter on Brexit. We give 21% odds to a no-deal Brexit based on the difficulty of parliament outright halting Johnson if his government is absolutely determined to follow through with it. This is clearly a large risk but not our base case. We would upgrade these odds to around 30% in the event that negotiations with the EU completely fail to produce tangible outcomes. It is far more likely that a delay occurs and leads to new elections (49%) – and these odds rise to 70% if Johnson fails to extract concessions from the EU that enable him to pass a deal through parliament. Diagram 1Brexit Decision Tree (Updated As Of June 21 For Boris Johnson)
Tariffs ... And The Last Prime Minister Of The United Kingdom?
Tariffs ... And The Last Prime Minister Of The United Kingdom?
A final constraint on Johnson comes from Scotland, as highlighted in the epigraph at the top of the report: the demand for a new Scottish independence referendum is reviving as a result of opposition to Brexit in general and specifically to Prime Minister Johnson’s hardline approach (Charts 12A & 12B). The SNP is also improving its favorability among Scottish voters relative to other parties (Chart 13). We have highlighted this risk in the past: support for Scottish independence does not have a clear ceiling amid the antagonism over Brexit, especially if an economic and political shock hits the union as a result of a forced no-deal exit.
Chart 12
Chart 12
Chart 13Scottish Nationals Resurgent
Scottish Nationals Resurgent
Scottish Nationals Resurgent
Bottom Line: The risk of a no-deal Brexit is around 21%, though a complete failure of negotiations with the EU could push it up to 30%. If it occurs it will induce a recession and eventually could result in the breakup of the union with Scotland. China And Investment Recommendations What can investors be certain of regardless of the different Brexit outcomes? The United Kingdom will reverse the fiscal austerity of recent years (Chart 14). Fiscal stimulus will be necessary either to offset the shock of a no-deal exit in the worst-case scenario, or to address the ongoing economic challenges and public grievances in a soft Brexit or no Brexit scenario. These grievances stem from the negative impact on the middle class of globalization, post-financial crisis deleveraging, low real wage growth, and the decline in productivity. Potential GDP growth is set to fall if immigration is curtailed and restrictions on trade with the EU go up. The government will have to offset this trend with spending to boost the social safety net and encourage investment. Chart 14Fiscal Austerity To Go Into Reverse
Fiscal Austerity To Go Into Reverse
Fiscal Austerity To Go Into Reverse
The pound is clearly weak on a long-term and structural basis (Chart 15). Based on our assessment of the British median voter – opposed to a no-deal Brexit – and the fact that parliament is also opposed to a no-deal Brexit Chart 15Deep Value In Sterling
Deep Value In Sterling
Deep Value In Sterling
and is the supreme lawgiving body in the British constitution, we expect that an enormous buying opportunity will emerge when Prime Minister Johnson’s gambit has reached its apex and he is either forced to accept what concessions the EU will give. But if forced out of office, election uncertainty due to a potential Prime Minister Jeremy Corbyn will prolong the pound’s weakness. Brexit is not the only risk affecting Europe this summer – a critical factor is Europe’s own economic status, which in great part hinges on our China view (Chart 16). The Chinese Communist Party’s mid-year Politburo meeting struck a more accommodative tone relative to the April meeting that sounded less dovish in the aftermath of the Q1 credit splurge. The emphasis of the remarks shifted back to the need to take additional measures to stabilize the economy, as in the October 2018 statement. This fits with our view since February that Chinese stimulus will surprise to the upside this year. Chart 16Chinese Reflation Positive For Europe
Chinese Reflation Positive For Europe
Chinese Reflation Positive For Europe
Policymakers’ efforts are working thus far, with signs of stabilization occurring in the all-important labor market (Chart 17). There is some evidence that Xi Jinping’s anti-corruption campaign is moderating, which also supports the view that policy settings in the broadest sense are becoming more supportive of growth (Chart 18). Chart 17China Will Reflate More
China Will Reflate More
China Will Reflate More
Chart 18Relaxing Anti-Corruption Campaign Another Form Of Easing
Relaxing Anti-Corruption Campaign Another Form Of Easing
Relaxing Anti-Corruption Campaign Another Form Of Easing
Chart 19Hong Kong Equities Have Farther To Fall
Hong Kong Equities Have Farther To Fall
Hong Kong Equities Have Farther To Fall
We still are long European equities versus Chinese equities and are short the CNY-USD. From a geopolitical point of view, the U.S.-China conflict is intensifying with President Trump’s threat to raise an additional 10% tariff on $300 billion of Chinese imports despite the resumption of talks. In addition, the Hong Kong protests are intensifying, with China’s People’s Liberation Army (PLA) warning that it may have to intervene. There is high potential for violence to erupt, leading to a more heavy-handed approach by Hong Kong security forces and even eventual PLA deployment. This suggests there is downside in the Hang Seng index (Chart 19) – and PLA intervention could lead to broader investor concerns about China’s internal stability and another reason for tensions with the United States and its allies. The U.S.-China conflict is intensifying. Our alarmist view on Taiwan in advance of the January 2020 election is finally taking shape. Not only has the Hong Kong unrest prompted a notable uptick in Taiwanese people’s view of themselves as exclusively Taiwanese (Chart 20), but Beijing has also announced additional restrictions on travel and tourism to Taiwan – an economic sanction that will harm the economy (Chart 21). These actions and escalation in Hong Kong raise the odds that the ruling Democratic Progressive Party will remain in power in Taiwan after January and hence that cross-strait relations (and by extension Sino-American relations) will remain strained and will require a higher risk premium to be built in. The latest trade war escalation could easily spill into strategic saber-rattling, as the U.S. blames China for North Korea’s return to bad behavior and China blames the U.S. for dissent in Hong Kong and likely Taiwan.
Chart 20
Chart 21Beijing To Sanction Taiwan Tourism Again
Beijing To Sanction Taiwan Tourism Again
Beijing To Sanction Taiwan Tourism Again
The U.S.-China trade negotiations are falling apart at the moment. We had argued that China’s stimulus and stabilization would create a negative reaction from President Trump, who would regret the Osaka ceasefire when he saw that China’s bargaining leverage had improved. This has come to pass, vindicating our 60% odds of an escalation post-G20. The U.S. Commerce Department could still conceivably renew the Temporary General License for U.S. companies to deal with Chinese tech firm Huawei on August 19, in order to create an environment conducive to progress for the next round of trade talks in September, but with the latest round of tariffs we think it is more likely that we will get a major escalation of strategic tensions and even saber-rattling. China’s new announcements regarding reforms to make local officials more accountable and to make it easier for companies to go bankrupt, including unprofitable “zombie” state-owned enterprises, could be a thinly veiled structural concession to the United States, but it remains to be seen whether these will be implemented and reinforced. Beijing rebooted structural reforms at the nineteenth national party congress but we expect stimulus to overwhelm reform amid trade war. We are converting our long non-Chinese rare earth producers recommendation to a strategic trade, after it hit our 5% stop-loss, as it is supported by our major theme of Sino-American strategic rivalry. The secular nature of this rivalry has been greatly confirmed by the fact that President Trump is now responding to American election dynamics. The U.S. Democratic Party’s primary debates have revealed that the candidates most likely to take on President Trump (Bernie Sanders and Elizabeth Warren) are adopting his hawkish foreign policy and trade policy stance toward China. The frontrunner former Vice President Joe Biden is the exception, as he is maintaining President Obama’s more dovish and multilateral approach. Trump’s clear response is to ensure that he still owns the trade and manufacturing narrative, to call Biden weak on trade, and to prevent the left-wing populists from outflanking him. Short the Hang Seng index as a tactical trade and close long Q1 2020 Brent futures versus Q1 2021 at the market bell tonight. Matt Gertken, Vice President Geopolitical Strategist mattg@bcaresearch.com Footnotes 1 See Maddy Thimont Jack, “A New Prime Minister Intent On No Deal Brexit Can’t Be Stopped By MPs,” May 22, 2019, www.instituteforgovernment.org.uk. 2 See Dominic Walsh, “Would MPs really back a no confidence motion to stop no-deal?” The New Statesman, July 15, 2019, www.newstatesman.com.
Dear Client, Next week I am sending you a Special Report on Japan written by Amr Hanafy, Research Associate of BCA’s Global Asset Allocation service. Amr answers some key questions that clients have been asking about Japan recently: Does the Bank of Japan have any monetary policy ammunition left? How hard will October’s tax hike hit consumption? Has Japan’s corporate governance improved meaningfully? Is there a case for a rerating of Japanese equities? I trust you will find his report very informative. Best regards, Peter Berezin, Chief Global Strategist Highlights Risk assets are likely to struggle over the next few weeks as investors digest both the decision by President Trump to further raise tariffs on Chinese imports, and the realization that the Fed’s “insurance cuts” may not be as generous as they had anticipated. Beyond then, the key question is whether the global economy is, in fact, experiencing a mid-cycle slowdown or is on the brink of a recession. If it is the former, as we think is the case, risk assets will bounce back. Despite the bluster from the Trump Administration, a trade deal between the U.S. and China is still more likely than not. The failure to reach a deal would weaken the U.S. economy, hurting Trump’s reelection prospects. Reassuringly, there is scant evidence that the global manufacturing downturn has infected the service sector to any significant degree. This is true not just for the U.S., but for manufacturing-intensive economies such as Germany as well. The share of manufacturing in both GDP and employment has fallen steadily around the world. Manufacturing output has also become less volatile over time, and less correlated with service sector growth. As global manufacturing activity starts to recover later this year, earnings growth will pick up. Stay overweight global equities relative to bonds on a 12-month horizon, while preparing to increase exposure to EM and European stocks. Feature First The Fed, And Then Trump Risk assets got hit by a one-two punch this week. First, the Federal Reserve dashed investors’ hopes for an extended easing cycle. While the Fed did cut rates by 25 basis points and pledged to end its balance sheet runoff in August (two months earlier than previously indicated), Jay Powell’s characterization of the Fed’s current mantra as a “mid-cycle adjustment to policy” suggested that further cuts were far from guaranteed. To reinforce the point, Powell stated that the Fed was not at “the beginning of a lengthy cutting cycle.” “That’s not our perspective now, our outlook,” he added. Contributing to the hawkish backdrop, Esther George, the president of the Kansas City Fed, and Eric Rosengren, the once fairly dovish president of the Boston Fed, voted to keep rates unchanged. Equities initially plunged on Wednesday following Chair Powell’s press conference. Markets rallied back Thursday morning, only to tumble again in the wake of President Trump’s decision to further raise tariffs on Chinese imports. There is no shortage of theories purporting to explain the timing of Trump’s decision. Was he trying to send a message to the Fed that it had better keep easing? Was he annoyed that Elizabeth Warren, Bernie Sanders, and a number of other presidential contenders tried to outflank him on trade during the Democratic debate the prior evening by suggesting he was not protectionist enough? Regardless, risk assets are likely to struggle over the next few weeks as investors grapple with both renewed trade war anxiety and the realization that the Fed’s “insurance cuts” may not be as generous as they had anticipated. Beyond then, the key question is whether the global economy is, in fact, experiencing a mid-cycle slowdown or is on the brink of a recession. If it is the former, as we think is the case, risk assets will bounce back. While a severe escalation of the trade war would tip the scales towards recession, the risk of such an outcome remains low. Negotiations with China are ongoing. The threat to further raise tariffs in September is consistent with the “maximum pressure” doctrine that has governed Trump’s policy decisions. Ultimately, the failure to reach a trade deal would weaken the U.S. economy, undermining Trump’s reelection prospects. The fact that the latest tranche of tariffs, unlike previous ones, will fall mainly on consumer goods could further hurt Trump in the polls. He does not want that. The Manufacturing Cycle: How Low Will It Go? Chart 1The Global Manufacturing Cycle Has Likely Reached A Bottom
The Global Manufacturing Cycle Has Likely Reached A Bottom
The Global Manufacturing Cycle Has Likely Reached A Bottom
Trade tensions have undoubtedly exacerbated the global manufacturing downturn. However, trade policy hasn't been the only culprit, as evidenced by the fact that manufacturing activity began to decelerate even before the trade war heated up in earnest. As we explained in detail last week,1 manufacturing activity tends to follow a “natural cycle” lasting about three years, with output growth rising for the first 18 months, and falling for the next 18 months (Chart 1). The latest downleg began at the start of 2018. Thus, as long as the trade war does not spiral out of control, we should soon see a bottom in the manufacturing cycle based on this timing. For now, the evidence for such a bottom remains mixed. It is encouraging that data released this week showed an improvement in the Chinese Caixin Manufacturing PMI and a slight uptick in the new orders component of the U.S. ISM manufacturing survey. Nevertheless, both surveys remain weak in absolute terms. Meanwhile, the European PMIs have continued to deteriorate, taking the global manufacturing PMI down to 49.3 in July, the lowest level since October 2012. What one can say more definitively is that at least so far, the manufacturing downturn has not infected the service sector to any significant degree (Chart 2). The U.S. non-manufacturing ISM will be released on Monday, but the June reading of 55.1, while below year-ago levels, was still in the middle of its historic range (Chart 3). Chart 2AThe Service Sector Has Softened Much Less Than Manufacturing (I)
The Service Sector Has Softened Much Less Than Manufacturing (I)
The Service Sector Has Softened Much Less Than Manufacturing (I)
Chart 2BThe Service Sector Has Softened Much Less Than Manufacturing (II)
The Service Sector Has Softened Much Less Than Manufacturing (II)
The Service Sector Has Softened Much Less Than Manufacturing (II)
Chart 3U.S. ISM Non-Manufacturing Still Close To Its Historic Average
U.S. ISM Non-Manufacturing Still Close To Its Historic Average
U.S. ISM Non-Manufacturing Still Close To Its Historic Average
Strong demand for services has underpinned U.S. employment growth which, in turn, has supported consumption growth. Real PCE rose by 4.3% in Q2. The jump in the Conference Board’s index of consumer confidence in July suggests that U.S. consumers remain upbeat. Notably, the services PMI has increased in the euro area this year, even as the manufacturing sector has weakened there. In Germany, where the manufacturing PMI plunged to 43.2 in July, the non-manufacturing PMI still managed to clock in at 55.4, up from 51.8 in December 2018. Manufacturing: A Canary In The Coal Mine Or Just A Coal Mine? The fact that the overall German economy has not come crashing down despite its high reliance on manufacturing is reassuring. Nevertheless, many investors remain convinced that it is just a matter of time before manufacturing woes precipitate a broad-based economic downturn. Such concerns are well founded if protectionism causes the entire global trading system to come crashing down. However, provided that this does not occur, it is unlikely that slower manufacturing growth, in and of itself, will trigger a recession. Uncertainty over Fed policy and the trade war are likely to weigh on risk assets over the coming weeks. Contrary to conventional wisdom, there is little evidence that manufacturing leads the broader economy. Chart 4 clearly shows that manufacturing output tracks overall real GDP growth, with no clear lead-lag relationship. Chart 4Manufacturing Activity Moves In Sync With The Broad Economy
Manufacturing Activity Moves In Sync With The Broad Economy
Manufacturing Activity Moves In Sync With The Broad Economy
Granted, manufacturing growth is more volatile than GDP growth, but that is simply because of the nature of manufacturing production. More than half of manufacturing output consists of durable goods. Purchases of durable goods tend to be lumpy over time. When unemployment starts to rise, households typically postpone purchases of, say, refrigerators and automobiles, while businesses postpone purchases of capital goods. As inventories pile up, manufacturers respond by cutting output. The opposite happens during expansions. The Declining Role Of Manufacturing In The Economy As a share of GDP, global manufacturing output currently stands at 16%. The manufacturing share has been trending lower in most countries (Chart 5). In the U.S., where the data goes back much further, manufacturing output has declined from over 25% of GDP in the 1950s to 11% of GDP at present. The share of manufacturing jobs in total employment has dropped in tandem (Chart 6). Chart 5The Declining Role Of Manufacturing Is A Global Phenomenon
The Declining Role Of Manufacturing Is A Global Phenomenon
The Declining Role Of Manufacturing Is A Global Phenomenon
Chart 6The Relative Size Of Manufacturing In The U.S. Economy Has Been Falling
The Relative Size Of Manufacturing In The U.S. Economy Has Been Falling
The Relative Size Of Manufacturing In The U.S. Economy Has Been Falling
The volatility of manufacturing growth rates has also fallen over time. This has occurred partly because of better inventory management techniques. Chart 7 shows that the ratio of real nonfarm inventories-to-domestic sales of goods and structures has been trending lower for the past 40 years. Diminished fears of oil embargos and price controls, which were rampant during the 1970s, have also allowed inventory levels to come down. Chart 7A Structural Decline In The Inventories-To-Sales Ratio Starting In The Early 1980s
A Structural Decline In The Inventories-To-Sales Ratio Starting in The Early 1980s
A Structural Decline In The Inventories-To-Sales Ratio Starting in The Early 1980s
As manufacturing has become a smaller and less volatile part of the economy, its impact on the service sector has diminished. In fact, we estimate that all of the reduction in the variance of U.S. private sector GDP growth over the past 50 years can be attributed to a smaller contribution from the goods-producing sector, as well as a decline in the correlation between goods-producing and service-producing industries (Chart 8).
Chart 8
Investment Conclusions Uncertainty over Fed policy and the trade war are likely to weigh on risk assets over the coming weeks. As long as the trade war does not boil over, global manufacturing activity should recover during the remainder of this year, boosting corporate earnings in the process. More cyclically-oriented stock markets and sectors will benefit the most. Non-U.S. stocks have the advantage of trading at a substantial discount to their U.S. peers. Chart 9 shows that U.S. stocks trade at 17.5-times forward earnings, while non-U.S. stocks trade at only 13.5-times forward earnings. We expect to upgrade European and EM equities over the coming months. Chart 9AEquities: Better Valuations Outside The U.S. (I)
Equities: Better Valuations Outside The U.S. (I)
Equities: Better Valuations Outside The U.S. (I)
Chart 9BEquities: Better Valuations Outside The U.S. (II)
Equities: Better Valuations Outside The U.S. (II)
Equities: Better Valuations Outside The U.S. (II)
Better global growth prospects should cause the dollar to weaken. Stronger growth should also allow government bond yields to rise and yield curves to steepen. Investors should favor stocks over bonds for the next 12 months. Housekeeping: We were stopped out of our long EUR/JPY trade for a loss of 5%. We will consider reopening this trade once market volatility settles down. Peter Berezin, Chief Global Strategist Global Investment Strategy peterb@bcaresearch.com Footnotes 1 Please see Global Investment Strategy Weekly Report, “Three Cycles,” dated July 26, 2019. Strategy & Market Trends MacroQuant Model And Current Subjective Scores
Chart 10
Tactical Trades Strategic Recommendations Closed Trades
Given how loose monetary conditions already are, it makes sense for the ECB to restart the Asset Purchase Program (APP). This option is the most direct way for the ECB to directly lower the cost of borrowing for European companies where credit conditions…
Highlights Fed: The Fed will deliver a 25bp rate cut this week, despite a firmer tone to recent U.S. economic and inflation data, and the door will be left open to an additional “insurance” cut in September. ECB: The ECB will unveil a package of easing measures, from interest rate cuts to restarting asset purchases – including a healthy dose of corporate bond buying – in September. Fixed Income Strategy: The Fed is more likely to disappoint deeply dovish market expectations than the ECB over the next 6-12 months. European fixed income should outperform U.S. equivalents, both for government bonds and corporate debt, especially with the ECB ready to buy bonds again. Stay overweight Bunds vs Treasuries and euro area corporate debt vs U.S. equivalents on a USD-hedged basis. Feature Chart of the WeekData To Satisfy Both The Optimists & Pessimists
Data To Satisfy Both The Optimists & Pessimists
Data To Satisfy Both The Optimists & Pessimists
In normal years, the final days of July are a quiet time for financial markets, with investors focused on preparations for August vacations rather than fretting about the performance of their portfolios. This is not one of those years. Central banks are springing into action to combat a global manufacturing downturn, creating a peculiar divergence of market price signals - elevated stock prices and depressed bond yields. BCA exposed our own internal debate on the growth outlook, and the implications for financial markets, in a recent Special Report.1 Our latest discussions with clients show similar splits within investment committees. While Global Fixed Income Strategy is in the optimist camp at BCA, we do recognize that there is enough news and data at the moment to satisfy both bullish and bearish investors (Chart of the Week). The growth bears can point to the continued deceleration of global trade and manufacturing data, with our global PMI indicator now sitting below the 2015/16 lows. The bulls, on the other hand, can highlight the bottoming of forward-looking data like our global leading economic indicator or the pickup in Chinese credit growth. Most importantly, the bulls are having a very enjoyable summer with interest rate cuts expected from the Fed and ECB, and the latter likely to restart quantitative easing. In this Weekly Report, we focus on monetary policy – specifically, the outlook for the Fed and ECB’s next moves over the next few months – and the implications for financial markets. Our conclusion is that the likely policy choices will benefit the relative performance of European fixed income markets versus U.S. equivalents over a 6-12 month horizon. The ECB’s Next Move: See You In September Chart 2A "Manufacturing-Only" Slump
A "Manufacturing-Only" Slump
A "Manufacturing-Only" Slump
The global trade downturn has hit growth in the U.S. and Europe in a similar fashion, with PMI data showing substantially weaker activity in manufacturing compared to more domestically focused service industries (Chart 2). In Europe, there is an unprecedented divergence, with the services PMI rising and the manufacturing PMI plummeting over the past several months. At his press conference after last week’s monetary policy meeting, ECB President Mario Draghi described the European manufacturing data as “getting worse and worse”. He is right, as evidenced by the downtrends seen in other cyclical data like the ZEW and IFO surveys. European bond markets are betting that the ECB will focus on the manufacturing side of the export-heavy euro area economies and will soon ease monetary policy. Draghi gave strong indications that the ECB will deliver a package of easing measures at the September policy meeting, ranging from interest rate cuts to restarting the Asset Purchase Program (APP) for both government and corporate debt. Bond investors have been making large bets on the ECB delivering a big easing, with European bond yields plummeting to new cyclical lows. Investors remain highly skeptical that robust, inflationary growth – and higher interest rates – will ever return to Europe. The surge in the amount of debt trading at negative yields has gotten the attention of the market. By our count, 53% of all government bonds in the developed economies are now trading with a negative yield, with much of those in Europe (Chart 3). Investors are reaching for anything with a positive yield, including formerly toxic debt like Italian and Greek government bonds, with the benchmark 10-year yields in those markets now down to 1.6% and 2.1%, respectively. The rally has extended into spread product, creating oddities such as shorter-maturity EUR-denominated emerging market bonds – some with credit ratings below investment grade – trading at negative yields.2 From a longer-term perspective, the European bond rally continues a trend seen over the past decade where the relative performance of European equities versus government bonds, a.k.a. the stock-to-bond ratio, has been anemic compared to the similar metric in the U.S. (Chart 4). Investors remain highly skeptical that robust, inflationary growth – and higher interest rates – will ever return to Europe. Chart 3Positive Yields Are Getting Harder To Find
Positive Yields Are Getting Harder To Find
Positive Yields Are Getting Harder To Find
Chart 4Structural Market Pessimism On Europe
Structural Market Pessimism On Europe
Structural Market Pessimism On Europe
From a cyclical perspective, the case for a comprehensive easing package from the ECB now is a strong one, for several reasons: There is a broad-based slowing of growth and inflation within the euro area. Our diffusion indices of individual country data for real GDP growth and the OECD’s leading economic indicators show that the overwhelming majority of euro area nations are seeing slowing growth (Chart 5). Similar readings coincided with multiple interest rate cuts in 2001, 2008/09 and 2012. Chart 5Good Reasons For An ECB Rate Cut
Good Reasons For An ECB Rate Cut
Good Reasons For An ECB Rate Cut
Chart 6Can The ECB Stop A Credit Crunch In Italy?
Can The ECB Stop A Credit Crunch In Italy?
Can The ECB Stop A Credit Crunch In Italy?
Realized inflation and inflation expectations remain muted. Our diffusion indices for inflation rates among euro area countries are more mixed, with almost all nations actually seeing a slight uptick in core inflation over the past three months (bottom panel). Yet given the plunge in market-based inflation expectations, with the 5-year/5-year forward EUR CPI swap rate now down to 1.35%, the ECB must focus on trying to put a floor under growth to stabilize inflation expectations. Banks are starting to tighten lending standards. The ECB’s latest Bank Lending Survey showed a sharp tightening of lending standards to businesses during Q2/2019 (Chart 6) in France and, more worryingly, Italy where loan growth has been contracting on a year-over-year basis. The ECB already took action back in March to introduce a new targeted bank funding program (TLTRO3), largely to prevent a possible credit crunch in Italy where cheap ECB loans have funded 10% of total Italian bank lending. Yet with Italian banks already tightening lending standards to domestic borrowers, the ECB must take other actions to fight off a deeper contraction in Italian corporate loans. So what can the ECB plausibly do to ease monetary conditions that are already very loose? Cut the deposit rate. Given the ECB’s large balance sheet, swollen by asset purchases, the deposit rate on the excess reserves of banks is now effectively the ECB’s main policy rate. The deposit rate is currently -0.40%, and the ECB is concerned about the impact on European bank profitability by pushing that rate even deeper into negative territory. Draghi noted in his press conference last week that the ECB would consider “tiering” interest rates on excess deposits – essentially, exempting portions of European banks’ excess reserves from being charged negative deposit rates – to help offset the hit to bank profits from negative rates. Chart 7The ECB Can Help Finance European Companies
The ECB Can Help Finance European Companies
The ECB Can Help Finance European Companies
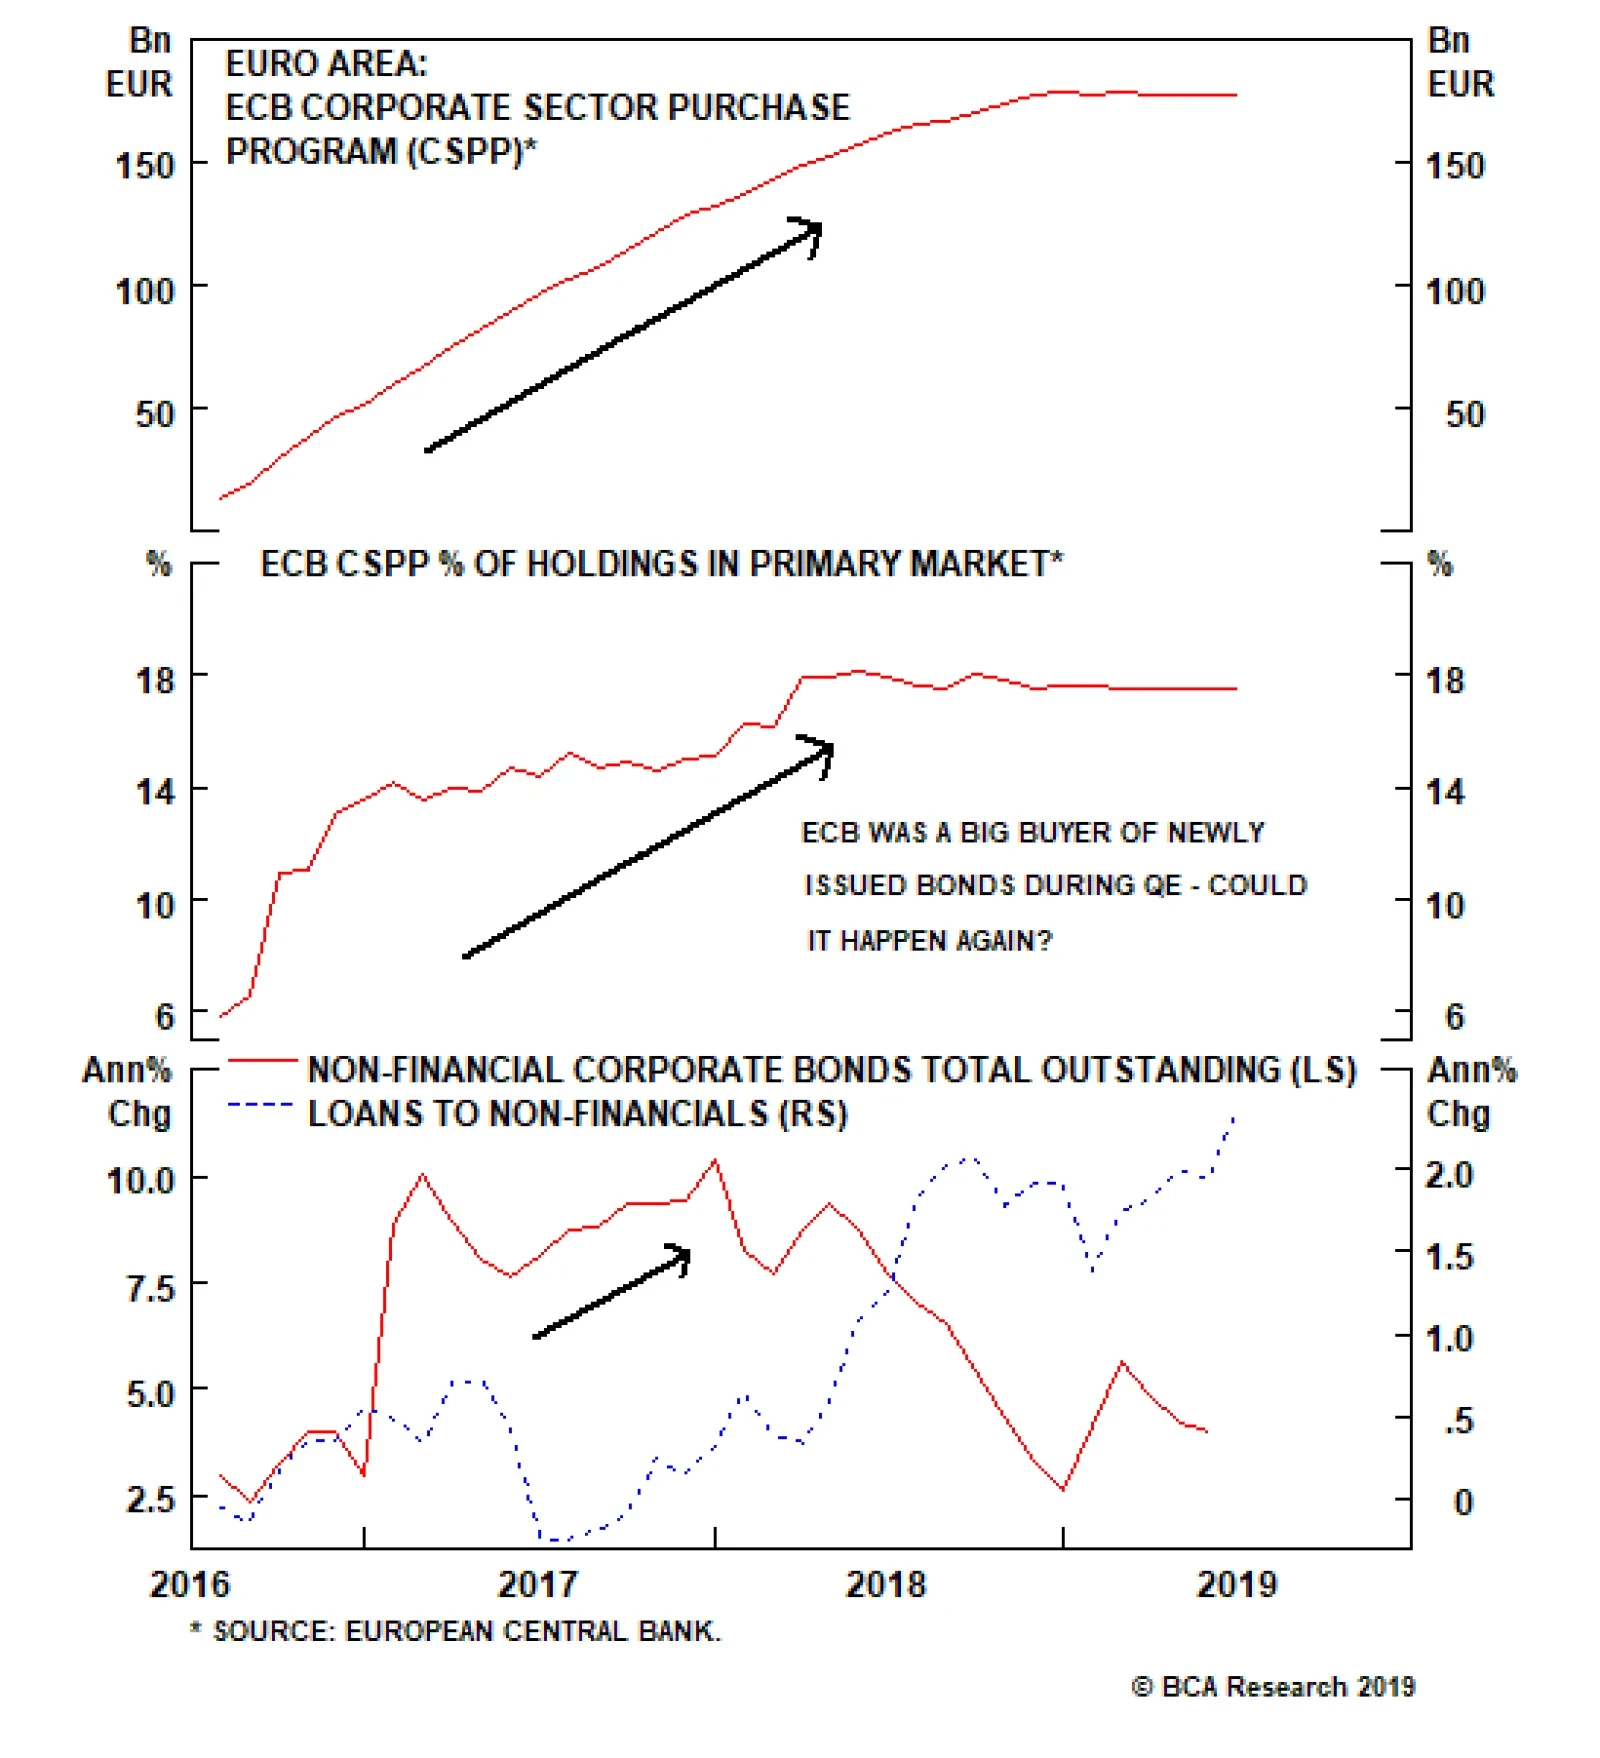
Tiering has been introduced in other countries with negative deposit rates (Japan, Switzerland, Denmark), with limited impacts on bank profitability. The experience of those countries, however, suggests that an introduction of tiering by the ECB could put a floor under interest rate expectations, as it would indicate that additional rate cuts would be too damaging for European bank profitability to be considered by the ECB. For that reason, the ECB could decide to cut rates in September, but without tiering to ensure the maximum effect on European interest rates and bond yields. Restart the Asset Purchase Program (APP). This option is the most intriguing, as it would be a more direct way for the ECB to directly lower the cost of borrowing for European companies where credit conditions are becoming tighter. During the corporate bond buying phase of the APP in 2016-2018, the ECB was not only buying bonds in the secondary market but was buying corporates in the primary (new issue) market. At the peak, the central bank was buying around 18% of all the primary issuance by euro area companies eligible for the APP (Chart 7). This allowed many smaller European companies that relied entirely on bank loans to begin issuing publicly traded corporate bonds to diversify their sources of funding, with the ECB as a guaranteed buyer – in some cases, at interest rates even lower than corporate bank lending rates. With the ECB having fewer constraints on its corporate bond buying (i.e. no Capital Key as in the case of government bond purchases), the big policy surprise in September could be a bigger focus on corporates over sovereigns in the restarted APP. That would be good news for euro area corporate bond performance. Chart 8Markets Discounting New ECB Corporate Bond Purchases?
Markets Discounting New ECB Corporate Bond Purchases?
Markets Discounting New ECB Corporate Bond Purchases?
Investors seem to have already priced in some expectation of a resumption of the ECB’s corporate bond buying program, as euro area credit spreads have tightened sharply despite weakening economic growth (Chart 8). The spread tightening has occurred across all countries and investment grade credit tiers, pushing valuations back to towards the levels seen during the height of the ECB’s last period of corporate bond buying in 2017. The ECB will likely have to start out fairly aggressively with its pace of corporate bond buying, likely with more than €10bn/month, to justify current valuations. With the ECB having fewer constraints on its corporate bond buying (i.e. no Capital Key as in the case of government bond purchases), the big policy surprise in September could be a bigger focus on corporates over sovereigns in the restarted APP. That would be good news for euro area corporate bond performance. Bottom Line: The ECB will unveil a package of easing measures, from interest rate cuts to restarting asset purchases – including a healthy dose of corporate bond buying – in September. The Fed’s Next Moves: Insurance Cuts In July & September, No More After That The latest batch of data from the U.S. suggests that tomorrow’s widely-expected Fed rate cut will not be the start of a full-blown easing cycle. Expect a 25bp cut, with forward guidance suggesting another 25bps in September to protect against the adverse effects on the U.S. from any additional trade policy uncertainty and the associated deterioration of non-U.S. economic growth. Any further easing beyond that is unnecessary given the current state of U.S. growth and inflation. While the year-over-year growth rates of real GDP and core durable goods orders have slowed, the annualized changes over the past six months have shown some reacceleration (Chart 9). Consumer spending has also perked up after the sharp drop fueled by the government shutdown back in January, while the lagged impact of the sharp fall in mortgage rates over the past year should provide a moderate boost to housing activity. A similar dynamic is seen on the inflation front, where the marginal 6-month annualized rate of change of core PCE inflation has picked up to 2% (Chart 10). Less volatile inflation gauges like the Dallas Fed’s trimmed mean core PCE inflation rate are also at 2%. Furthermore, one of the main causes of the unexpected downturn in core PCE inflation in 2018, the Financial Services component, is already rebounding – a trend that will continue given the U.S. equity market’s strong gains in 2019 (bottom panel). Chart 9U.S. Growth Rebounding
U.S. Growth Rebounding
U.S. Growth Rebounding
Chart 10U.S Inflation Rebounding
U.S Inflation Rebounding
U.S Inflation Rebounding
Look for the Fed to signal a cautious tone tomorrow, but without sounding overly pessimistic on U.S. growth prospects. Bottom Line: The Fed will deliver a 25bp rate cut this week, despite a firmer tone to recent U.S. economic and inflation data, and the door will be left open to an additional cut in September. Additional moves after that are unlikely, given signs of reaccelerating momentum in U.S. economic growth and inflation. Investment Implications For The U.S. Versus Europe Over The Next 6-12 Months Looking ahead over the rest of 2019, relative economic performance should continue to favor the U.S. over Europe, creating a backdrop where relative monetary policies will support euro area fixed income returns versus U.S. equivalents. Looking ahead over the rest of 2019, relative economic performance should continue to favor the U.S. over Europe, creating a backdrop where relative monetary policies will support euro area fixed income returns versus U.S. equivalents. Chart 11Too Soon To See An Export-Led Rebound In Europe
Too Soon To See An Export-Led Rebound In Europe
Too Soon To See An Export-Led Rebound In Europe
The European economic downturn seen over the past year has come almost entirely from the trade side, when looking at the contributions to real GDP growth from net exports and domestic demand (Chart 11). This is also consistent with the manufacturing/services gap discussed earlier in this report, given the large share of manufactured goods in overall euro area exports. China will play a huge role in determining the future path of European economic growth through the trade channel, and already the pickup in Chinese credit growth is heralding a future rebound in European exports to China (third panel). A recovery in euro area exports to other countries besides China is also in store, based on our global leading economic indicator diffusion index (i.e. the net number of countries seeing a rising leading indicator). Yet given the long lead time before changes in those leading European export indicators and the subsequent growth of European exports – between 9-12 months – an improvement in euro area exports will not be visible in the hard data until late in 2019. It will likely be even longer than that given the additional publishing lags of the export data. Importantly, while the recent headlines have provided grounds for more cautious optimism on U.S.-China trade talks, any breakdown on that front would potentially delay any recovery in euro area exports (even if that is met by a bigger policy stimulus from China). At the moment, the U.S. economy is better positioned to withstand a renewed bout of trade uncertainty than the euro area, even though U.S. growth would take a hit through higher market volatility and tighter financial conditions if investors turn more risk averse on another failure of U.S.-China trade talks. Chart 12Not Much Downside Left For Bond Yields
Not Much Downside Left For Bond Yields
Not Much Downside Left For Bond Yields
So after looking at the relative outlooks for economic growth in the U.S. and Europe, and the likely paths to be taken by the Fed and ECB, we come up with the following fixed income investment recommendations: Maintain below-benchmark overall global duration exposure: At an overall portfolio level, we continue to recommend a moderate below-benchmark global duration stance (Chart 12). Our global leading economic indicator diffusion index suggests that global real yields should soon bottom. At the same time, the annual rate of change of oil prices will accelerate over the rest of the year simply based on comparisons versus the sharp plunge in energy prices in the latter months of 2018. If the bullish oil forecast of BCA’s commodity strategists comes to fruition, the growth rate of oil prices will be even higher (see the “X” in the middle panel of Chart 12). Given the correlations between market-based inflation expectations and oil prices, a rebound in oil on a rate of change basis should put a floor under the inflation expectations component of government bond yields in the developed markets. Expect a rebound in the Treasury/Bund spread: The ECB is more likely to deliver on the policy expectations for the next twelve months discounted in Overnight Index Swap curves (-22bps of rate cuts) compared to the Fed (-89bps of rate cuts). This suggests that the spread between 10-year U.S. Treasury yields and 10-year German Bund yields is likely to widen, but coming first through higher relative market-based U.S. inflation expectations - a trend that is already starting to unfold (Chart 13). ECB rate cuts, and the return of the ECB as a buyer of euro area non-financial corporate debt, will provide an obvious boost to the relative performance of euro area corporate debt (both investment grade and high-yield) over U.S. equivalents. Favor euro area corporates versus U.S. corporates: ECB rate cuts, and the return of the ECB as a buyer of euro area non-financial corporate debt, will provide an obvious boost to the relative performance of euro area corporate debt (both investment grade and high-yield) over U.S. equivalents. Another factor supporting European corporates is the better state of financial health among euro area companies, according to our Corporate Health Monitors (Chart 14). Chart 13Inflation Expectations Bottoming Out, Led By The U.S.
Inflation Expectations Bottoming Out, Led By The U.S.
Inflation Expectations Bottoming Out, Led By The U.S.
The gap between the “bottom-up” versions of the Monitors tracks the spread differentials of the benchmark corporate bond indices quite closely, and is currently pointing to a more solid fundamental underpinning for euro area corporates on a cyclical (6-12 months) horizon. Chart 14Favor Euro Area Corporates Over U.S. Corporates
Favor Euro Area Corporates Over U.S. Corporates
Favor Euro Area Corporates Over U.S. Corporates
Robert Robis, CFA, Chief Fixed Income Strategist rrobis@bcaresearch.com Footnotes 1 Please see BCA Special Report, “What Goes On Between Those Walls? BCA’s Diverging Views In The Open”, dated July 19, 2019, available at bca.bcaresearch.com and gfis.bcaresearch.com. 2https://www.bloomberg.com/news/articles/2019-07-15/em-succumbs-to-sub-zero-epidemic-as-debt-pile-doubles-in-a-weekD The GFIS Recommended Portfolio Vs. The Custom Benchmark Index
A Cure For The Summertime Blues
A Cure For The Summertime Blues
Recommendations Duration Regional Allocation Spread Product Tactical Trades Yields & Returns Global Bond Yields Historical Returns
While the Conservatives and the U.K. have a new leader, as far as Brexit is concerned, plus ça change plus c’est la même chose. A new leader does not change the tight parliamentary arithmetic in which the Conservative/DUP pact now has a wafer-thin working…

In a range of -1 to 2 percent, inflation expectations become insensitive to monetary policy. So in their obsession to achieve two point zero, central banks have pushed harder and harder on a piece of string. As a result, the experimental policy tools of our…